

Nvidia RTX 3500 Ada prestatiedebuut: HP ZBook Fury 16 G11 workstation test
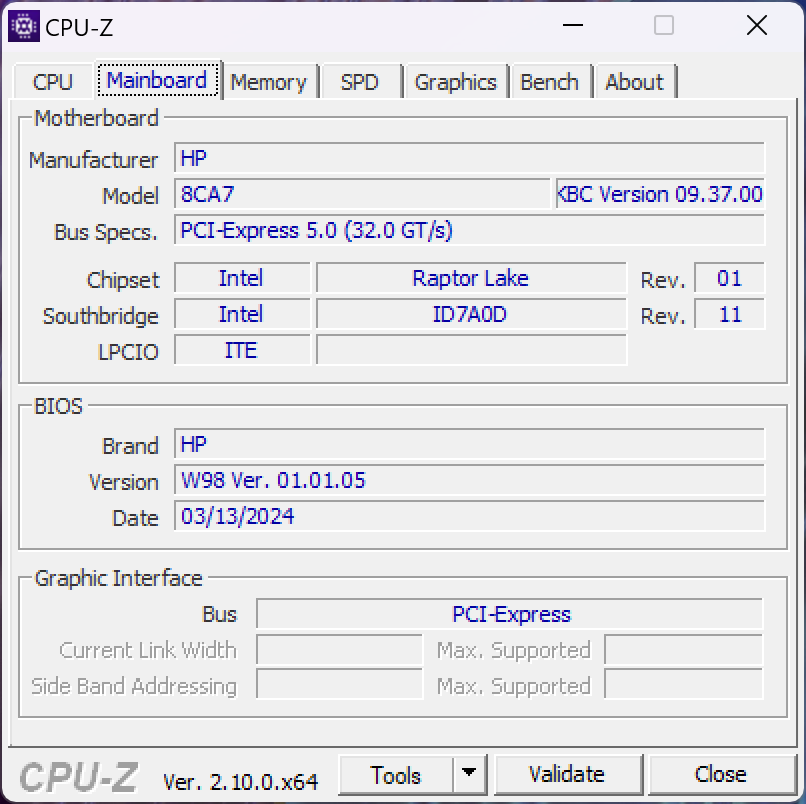
De 2024 ZBook Fury 16 G11 is de opvolger van de 2023 Fury 16 G10 door de Raptor Lake-HX CPU's te vervangen door nieuwere Raptor Lake-HX Refresh opties. Voor de rest blijft het chassis identiek aan de Fury 16 G10 of Fury 16 G9, net als veel van de configureerbare opties. We raden u aan om onze review van de Fury 16 G9 te lezen voor meer informatie over de fysieke kenmerken van het model.
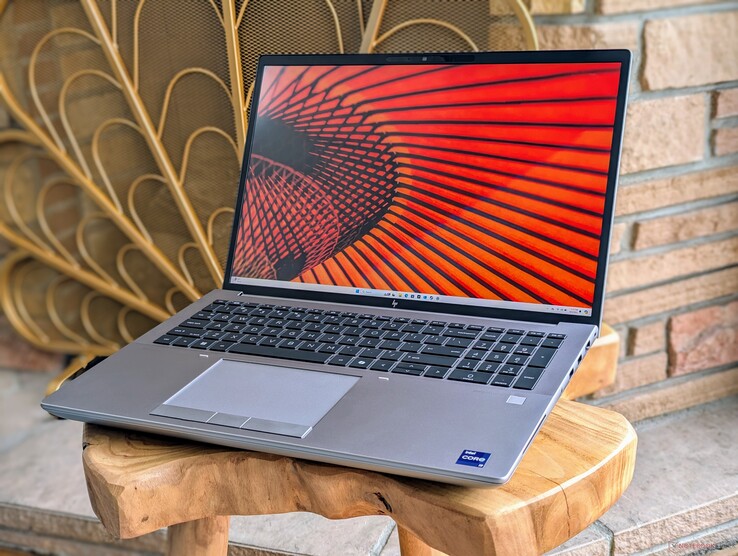
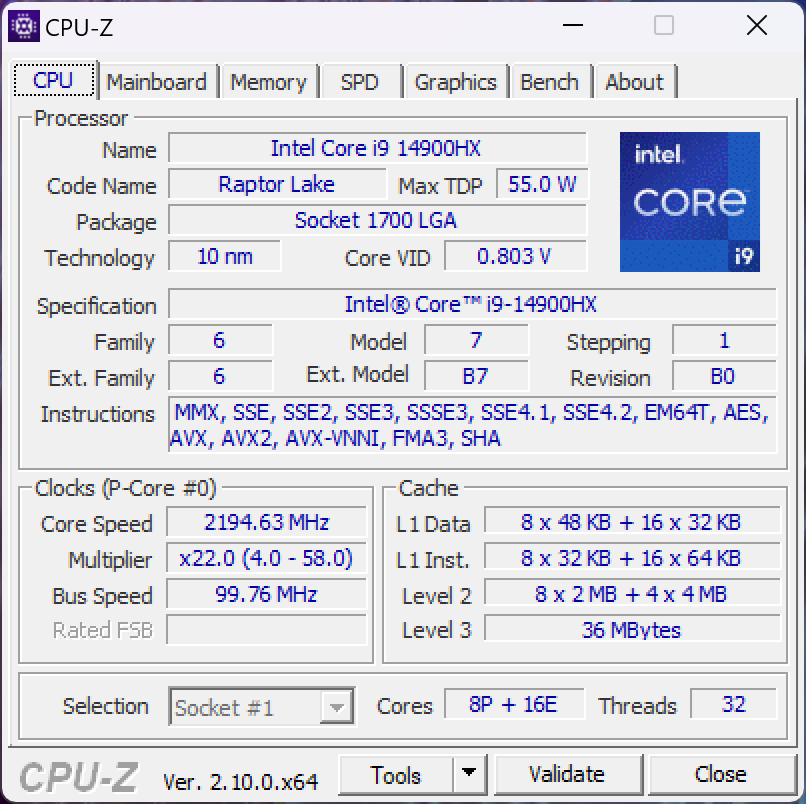
Onze testeenheid is een configuratie voor het hogere middensegment met de Core i9-14900HX CPU, RTX 3500 Ada GPU en een 120 Hz 3840 x 2400 IPS scherm voor ongeveer $3300. Andere SKU's beginnen met de Core i5-13600HX tot de RTX 5000 Ada en 2400p OLED touchscreen. Er zijn geen Meteor Lake CPU opties.
Concurrenten voor de ZBook Fury 16 G11 zijn andere 16-inch werkstations zoals de Dell Precision 5690, Lenovo ThinkPad P16 G2of Asus ProArt Studiobook 16.
Meer HP beoordelingen:
Potentiële concurrenten in vergelijkings
Evaluatie | Versie | Datum | Model | Gewicht | Hoogte | Formaat | Resolutie | Beste prijs |
|---|---|---|---|---|---|---|---|---|
| 85.9 % | v8 | 08-2024 | HP ZBook Fury 16 G11 i9-14900HX, NVIDIA RTX 3500 Ada Generation Laptop GPU | 2.6 kg | 28.5 mm | 16.00" | 3840x2400 | |
| 92.3 % v7 (old) | v7 (old) | 09-2023 | HP ZBook Fury 16 G10 i9-13950HX, NVIDIA RTX 5000 Ada Generation Laptop GPU | 2.6 kg | 28.5 mm | 16.00" | 3840x2400 | |
| 91 % v7 (old) | v7 (old) | 06-2023 | HP ZBook Fury 16 G9 i9-12950HX, RTX A5500 Laptop GPU | 2.6 kg | 28.5 mm | 16.00" | 3840x2400 | |
| 88.3 % v7 (old) | v7 (old) | 05-2024 | Dell Precision 5690 Ultra 9 185H, NVIDIA RTX 5000 Ada Generation Laptop GPU | 2.3 kg | 22.17 mm | 16.00" | 3840x2400 | |
| 90.2 % v7 (old) | v7 (old) | 03-2024 | Lenovo ThinkPad P16 G2 21FA000FGE i7-13700HX, NVIDIA RTX 2000 Ada Generation Laptop GPU | 3 kg | 30.23 mm | 16.00" | 2560x1600 | |
| 90.1 % v7 (old) | v7 (old) | 12-2023 | Lenovo ThinkPad P1 G6 21FV001KUS i7-13800H, NVIDIA GeForce RTX 4080 Laptop GPU | 1.9 kg | 17.5 mm | 16.00" | 3480x2400 | |
| 86.1 % v7 (old) | v7 (old) | 06-2023 | Asus ProArt Studiobook 16 OLED H7604 i9-13980HX, NVIDIA GeForce RTX 4070 Laptop GPU | 2.4 kg | 23.9 mm | 16.00" | 3200x2000 |
Hinweis: We hebben ons beoordelingssysteem kürzlich geactualiseerd en de resultaten van versie 8 zijn niet vergelijkbaar met de resultaten van versie 7. Meer informatie vindt u hier beschikbaar.
Opmerking: We hebben ons beoordelingssysteem onlangs bijgewerkt en de resultaten van versie 8 zijn niet vergelijkbaar met de resultaten van versie 7. Meer informatie is beschikbaar hier .
Zaak
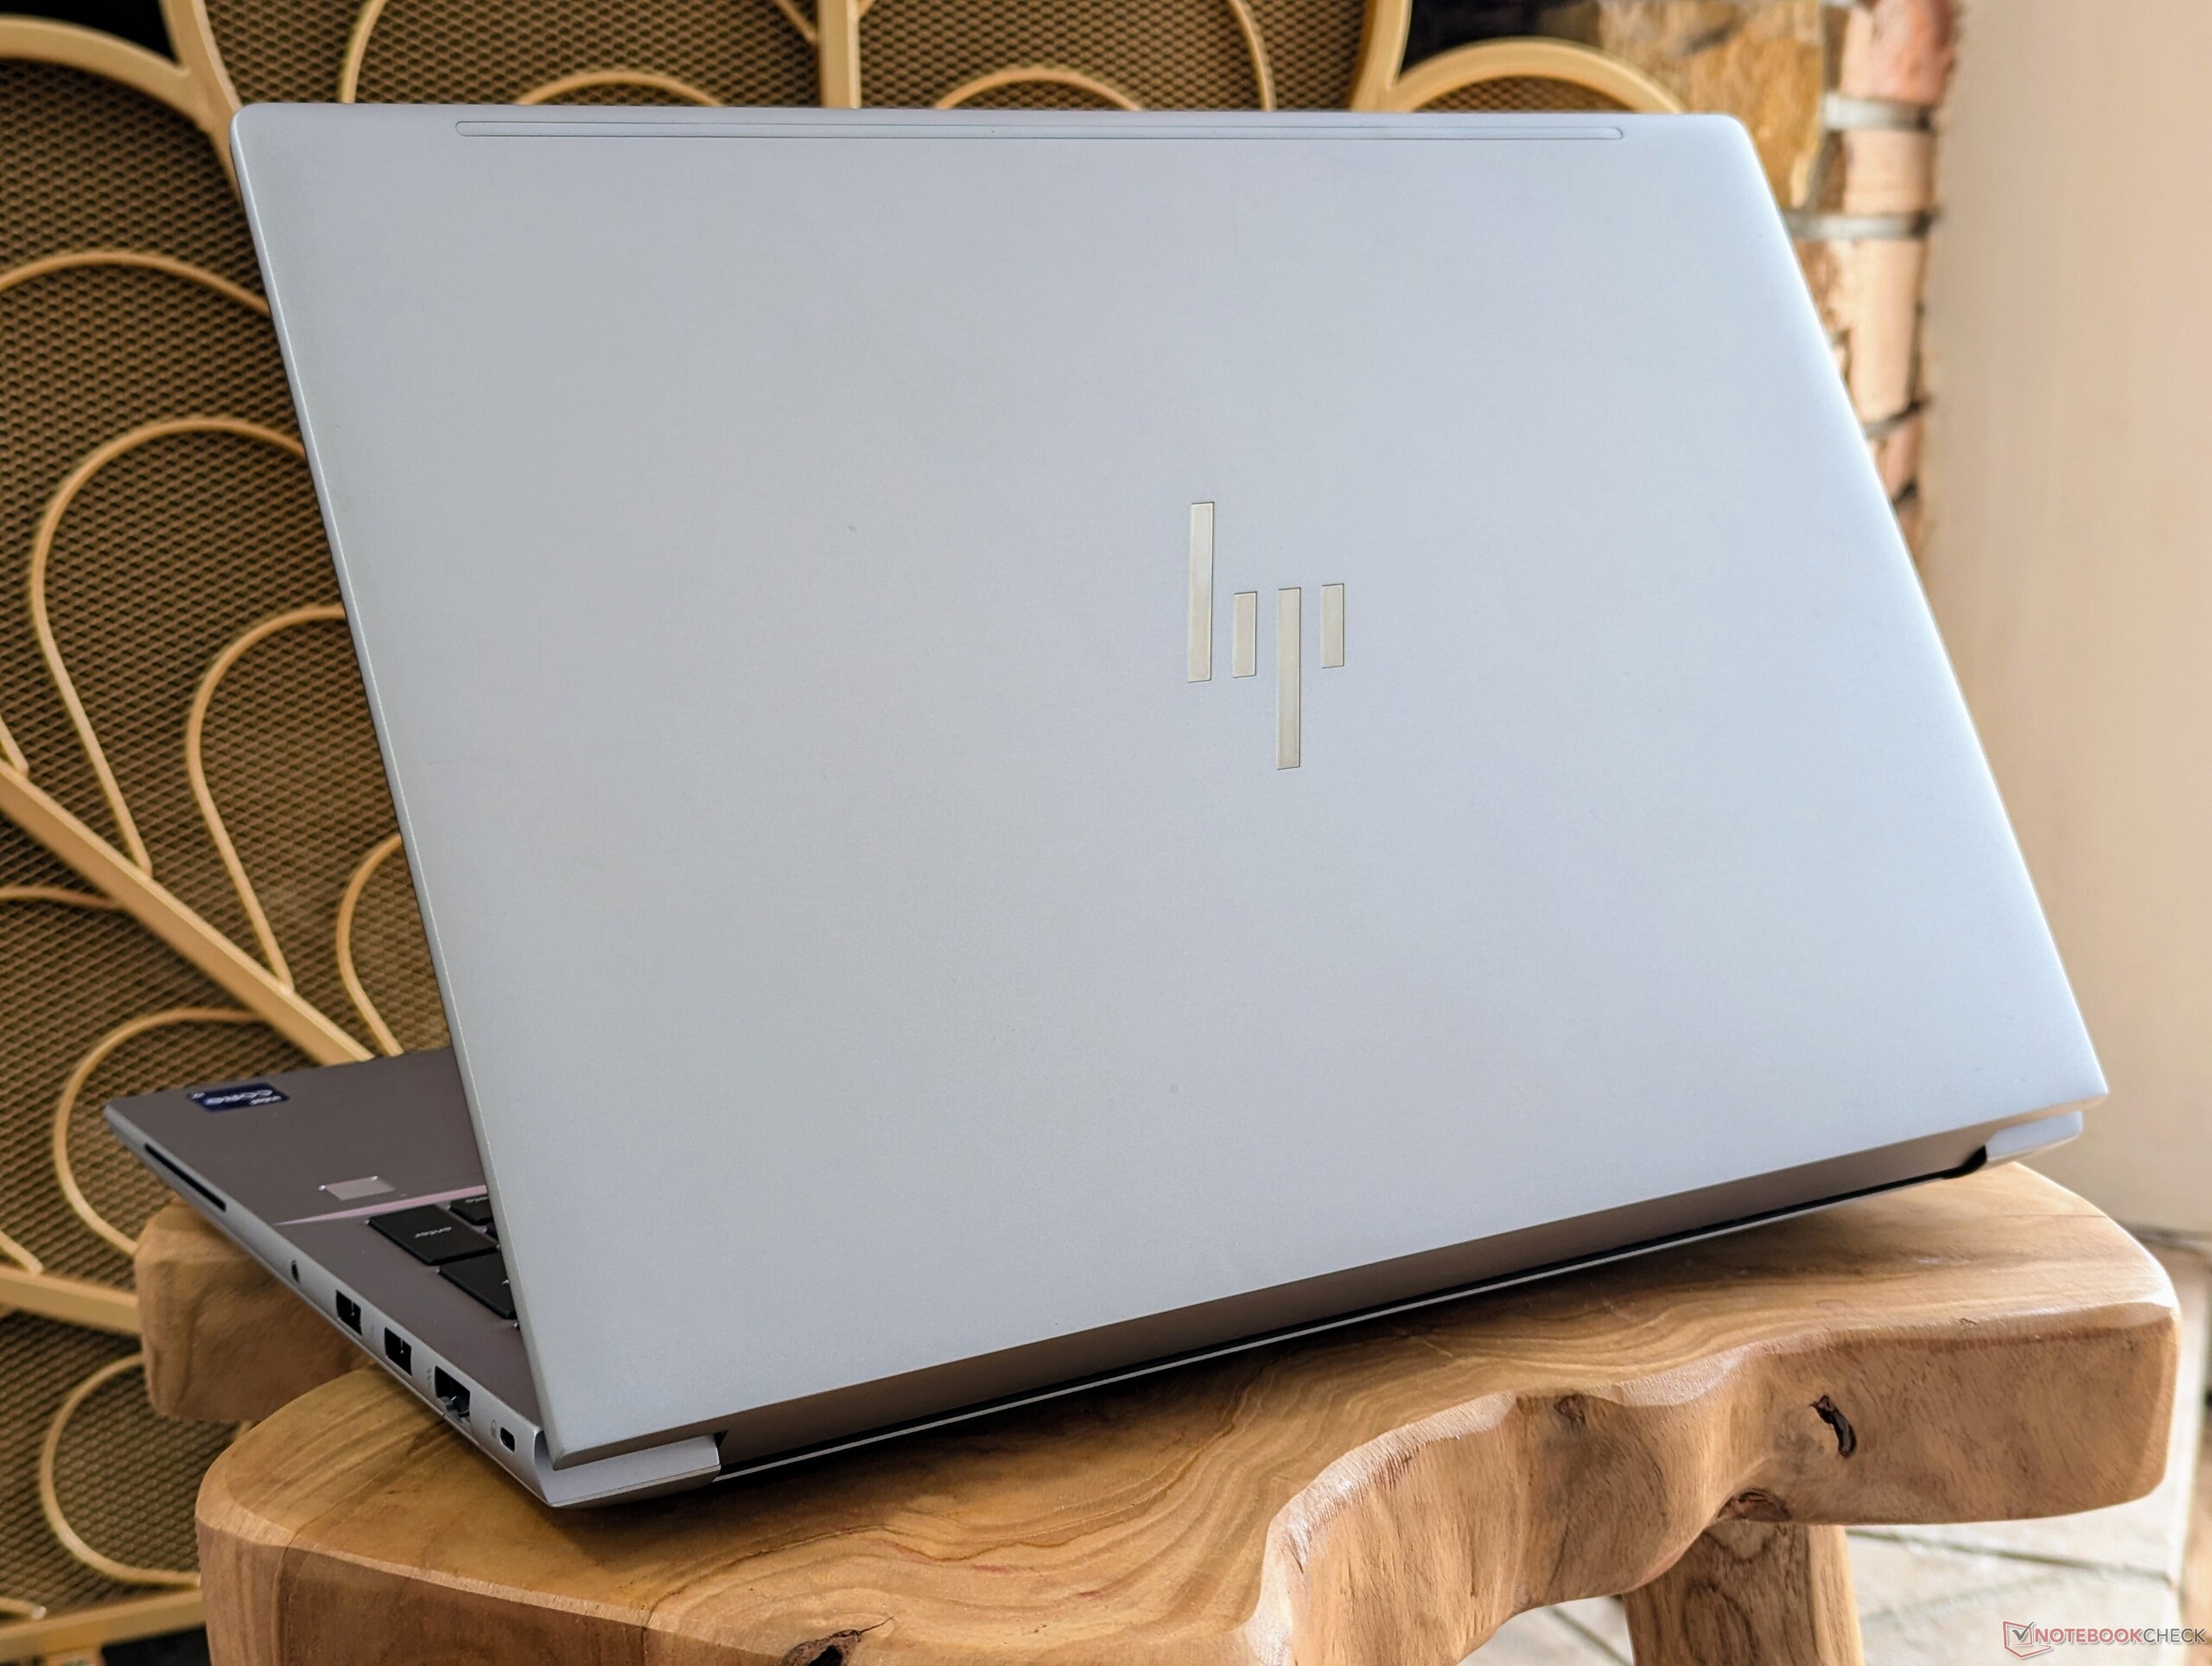
Een gemakkelijke manier om de ZBook Fury 16 G11 te onderscheiden van eerdere versies is door te kijken naar de Co-Pilot toets op het toetsenbord. Voor de rest blijft het ontwerp van de behuizing hetzelfde als voorheen.
Connectiviteit


SD-kaartlezer
| SD Card Reader | |
| average JPG Copy Test (av. of 3 runs) | |
| Lenovo ThinkPad P1 G6 21FV001KUS (Toshiba Exceria Pro SDXC 64 GB UHS-II) | |
| HP ZBook Fury 16 G11 (Toshiba Exceria Pro SDXC 64 GB UHS-II) | |
| HP ZBook Fury 16 G10 (Toshiba Exceria Pro SDXC 64 GB UHS-II) | |
| HP ZBook Fury 16 G9 (PNY EliteX-PRO60) | |
| Asus ProArt Studiobook 16 OLED H7604 (Angelibird AV Pro V60) | |
| Lenovo ThinkPad P16 G2 21FA000FGE | |
| maximum AS SSD Seq Read Test (1GB) | |
| HP ZBook Fury 16 G11 (Toshiba Exceria Pro SDXC 64 GB UHS-II) | |
| Lenovo ThinkPad P1 G6 21FV001KUS (Toshiba Exceria Pro SDXC 64 GB UHS-II) | |
| HP ZBook Fury 16 G10 (Toshiba Exceria Pro SDXC 64 GB UHS-II) | |
| HP ZBook Fury 16 G9 (PNY EliteX-PRO60) | |
| Lenovo ThinkPad P16 G2 21FA000FGE | |
| Asus ProArt Studiobook 16 OLED H7604 (Angelibird AV Pro V60) | |
Communicatie
WLAN is geüpgraded van de Intel AX211 naar de BE200 voor goede Wi-Fi 7 ondersteuning. In de praktijk zullen de meeste gebruikers echter nog steeds verbinding maken met Wi-Fi 6 of 6E toegangspunten.
Webcam


Onderhoud
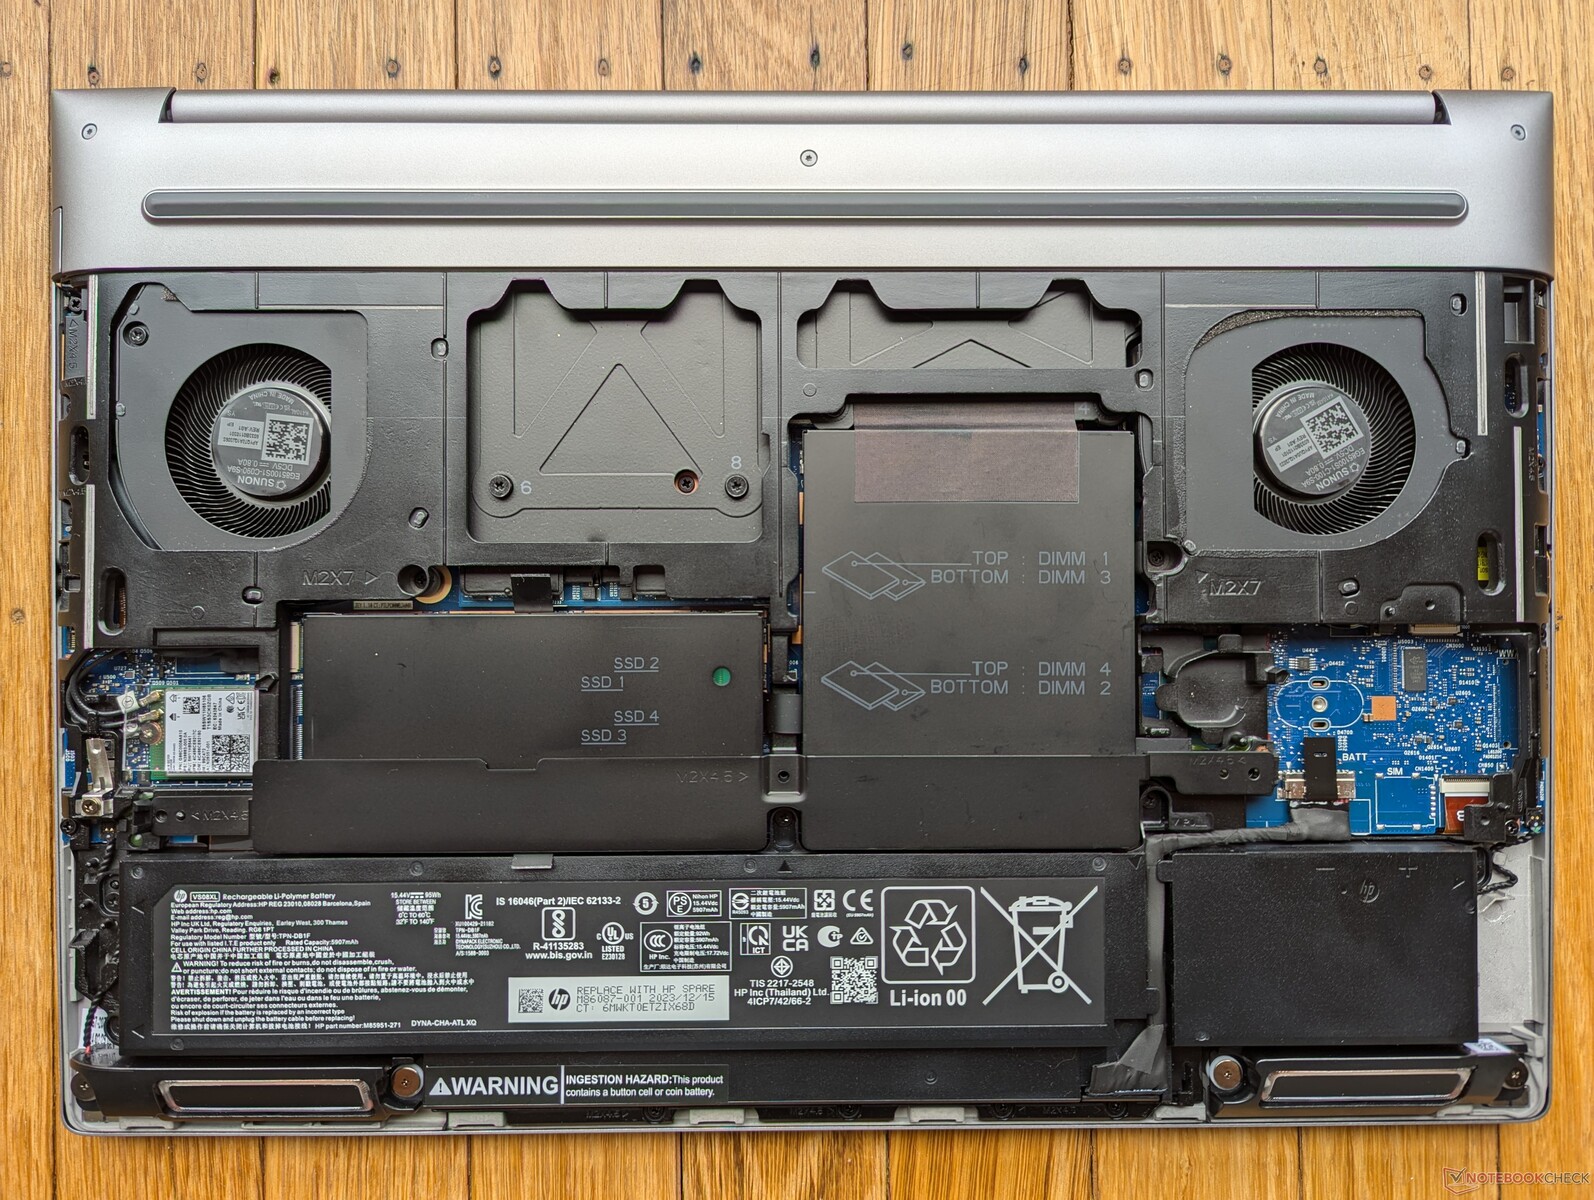
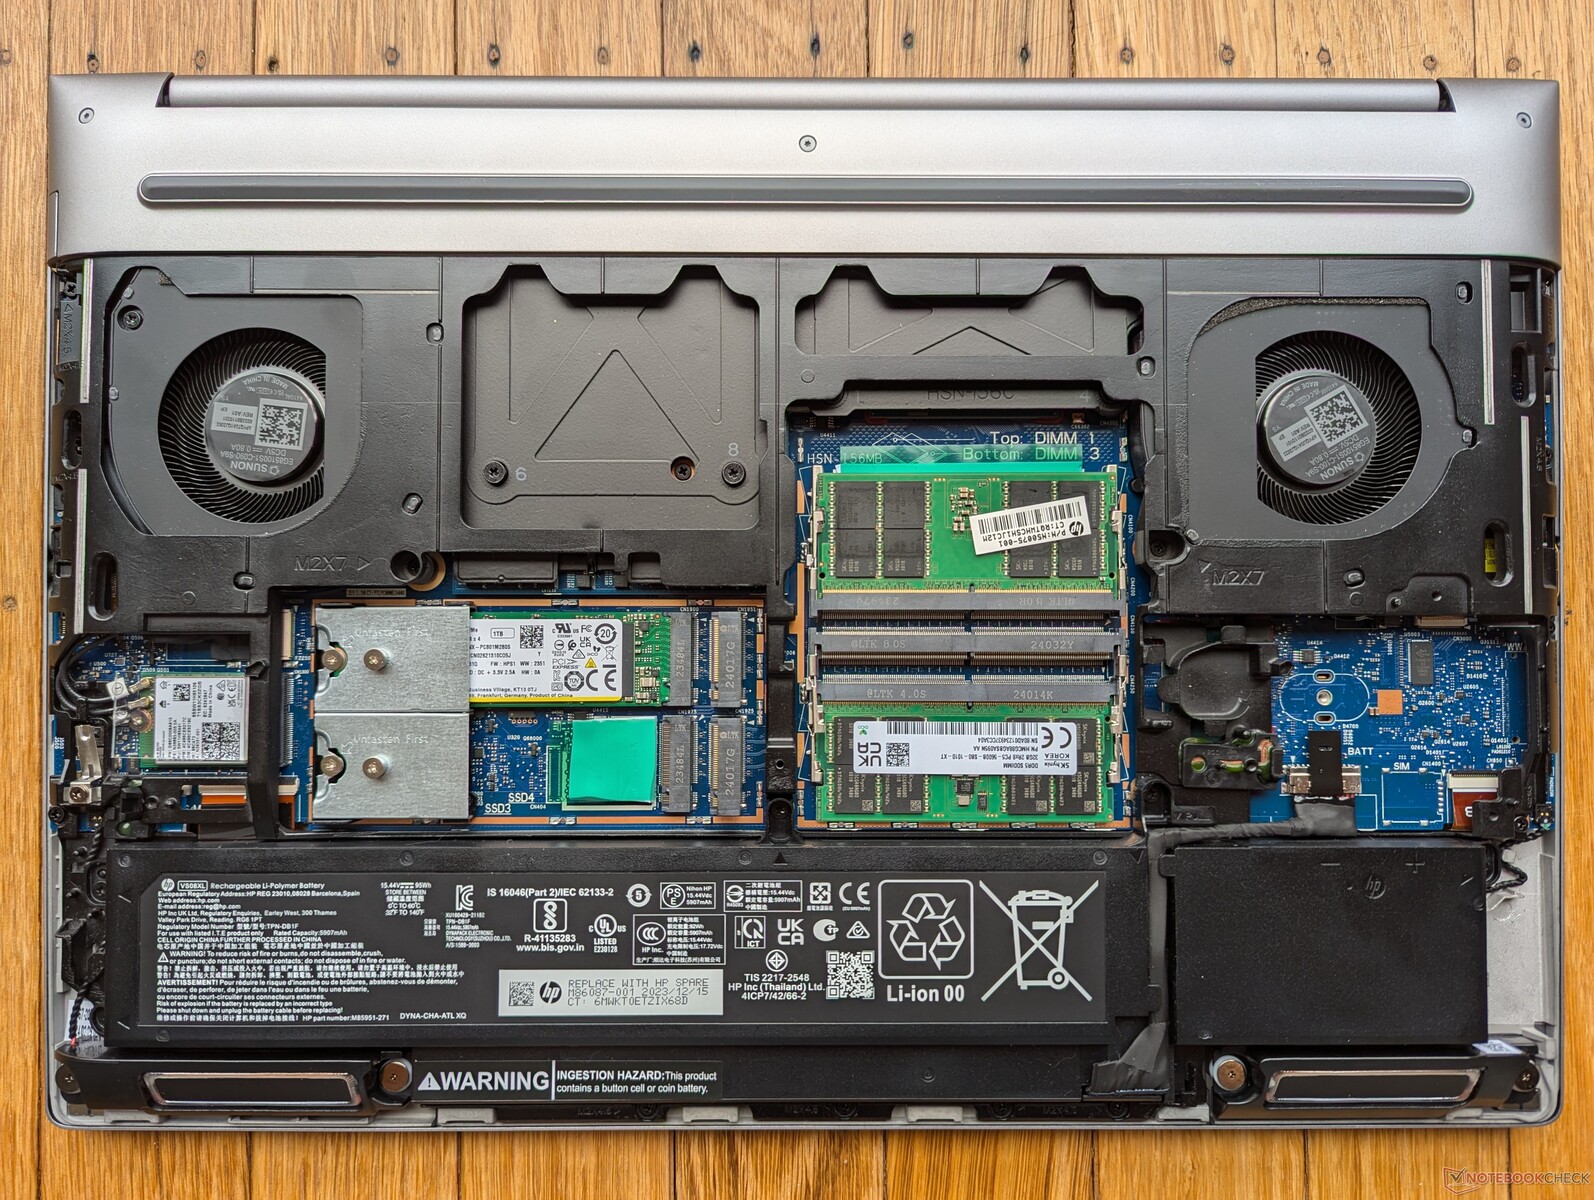
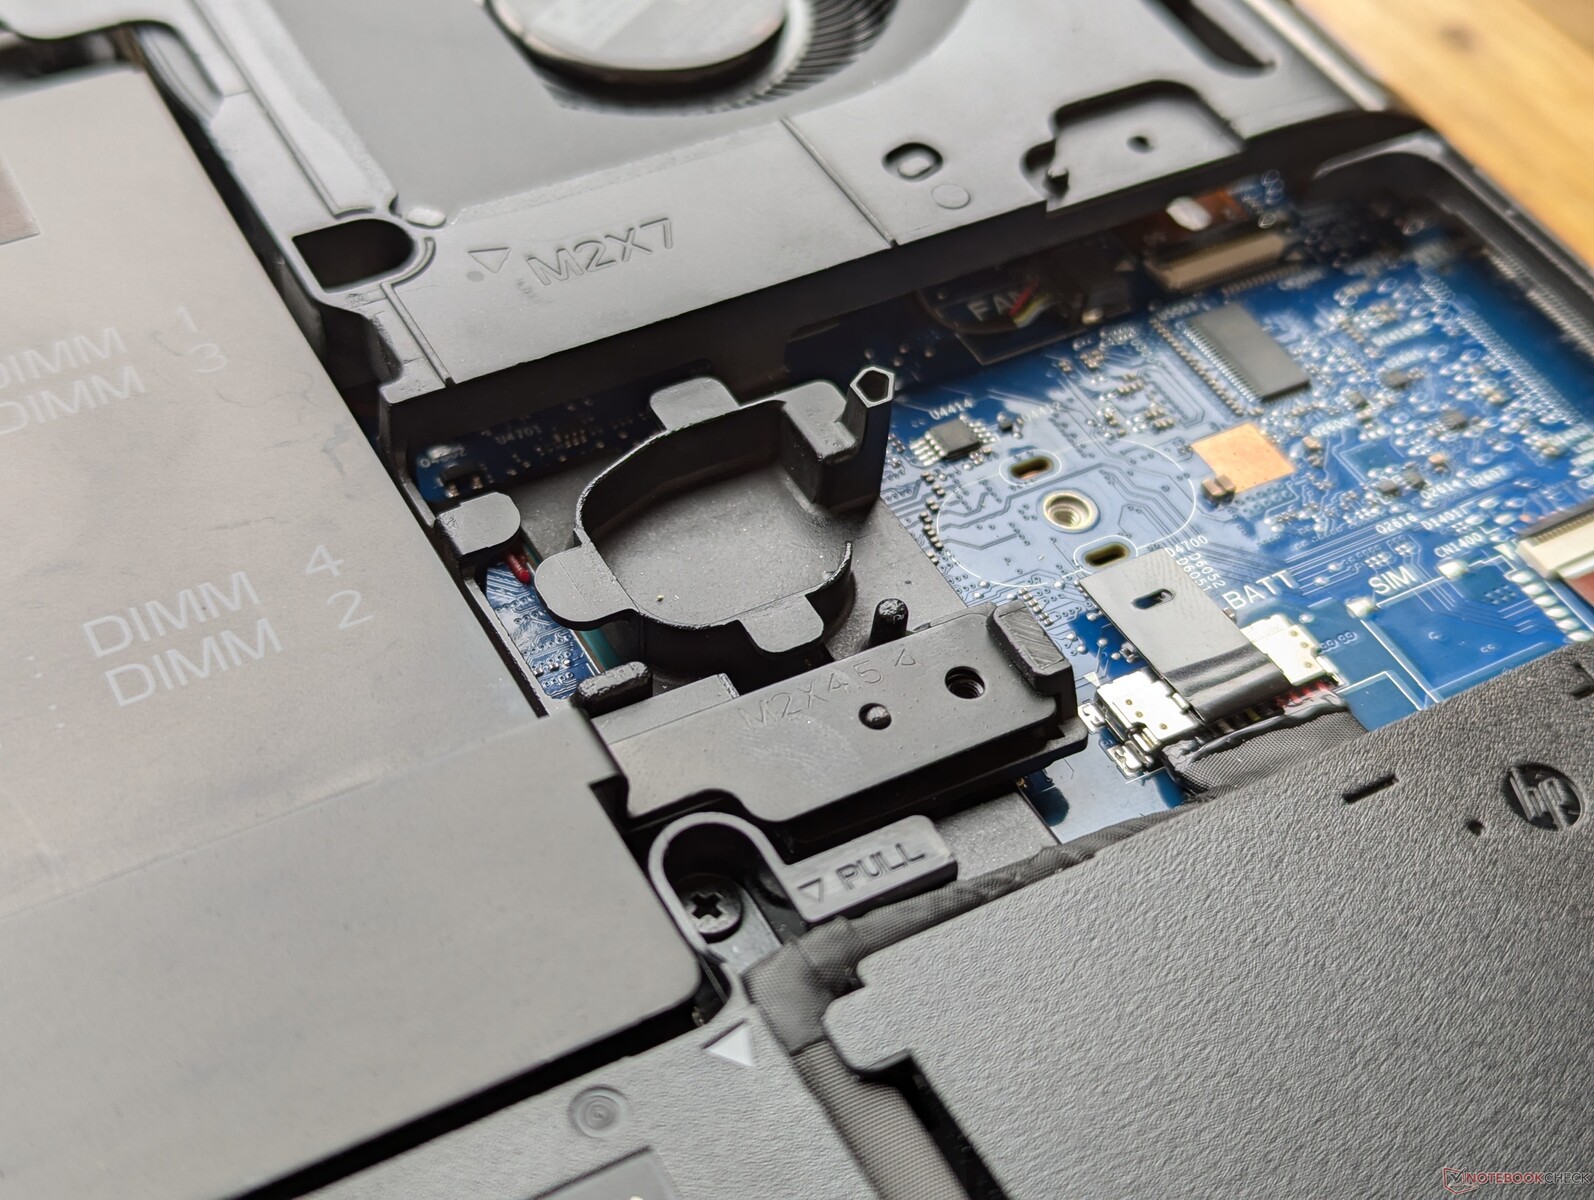
HP gaat al sinds het G9 model eerder vorig jaar prat op onderhoudsbeurten zonder gereedschap voor de Fury 16 serie. Hoewel het bodempaneel er zonder gereedschap af kon worden geschoven, werden de RAM- en SODIMM-modules nog steeds beschermd door een aluminium afdekking die met een schroevendraaier verwijderd moest worden. Deze aluminium afdekking is op het G11 model opnieuw ontworpen met vergrendelingen in plaats van schroeven, wat betekent dat gebruikers RAM-modules nu zonder gereedschap kunnen installeren.
De SSD's zijn echter nog steeds met schroeven aan het moederbord bevestigd en er is dus nog steeds een schroevendraaier nodig om schijven te verwisselen. Het systeem kan maximaal vier SSD's en vier RAM-modules ondersteunen.

Duurzaamheid
De verpakking is volledig recyclebaar en bestaat voornamelijk uit papier. De wisselstroomadapter is het enige onderdeel dat in plastic is verpakt.
Accessoires en garantie
De verkoopverpakking bevat geen extra's behalve de AC-adapter en papierwerk. Bij aankoop in de VS krijgt u standaard drie jaar fabrieksgarantie.
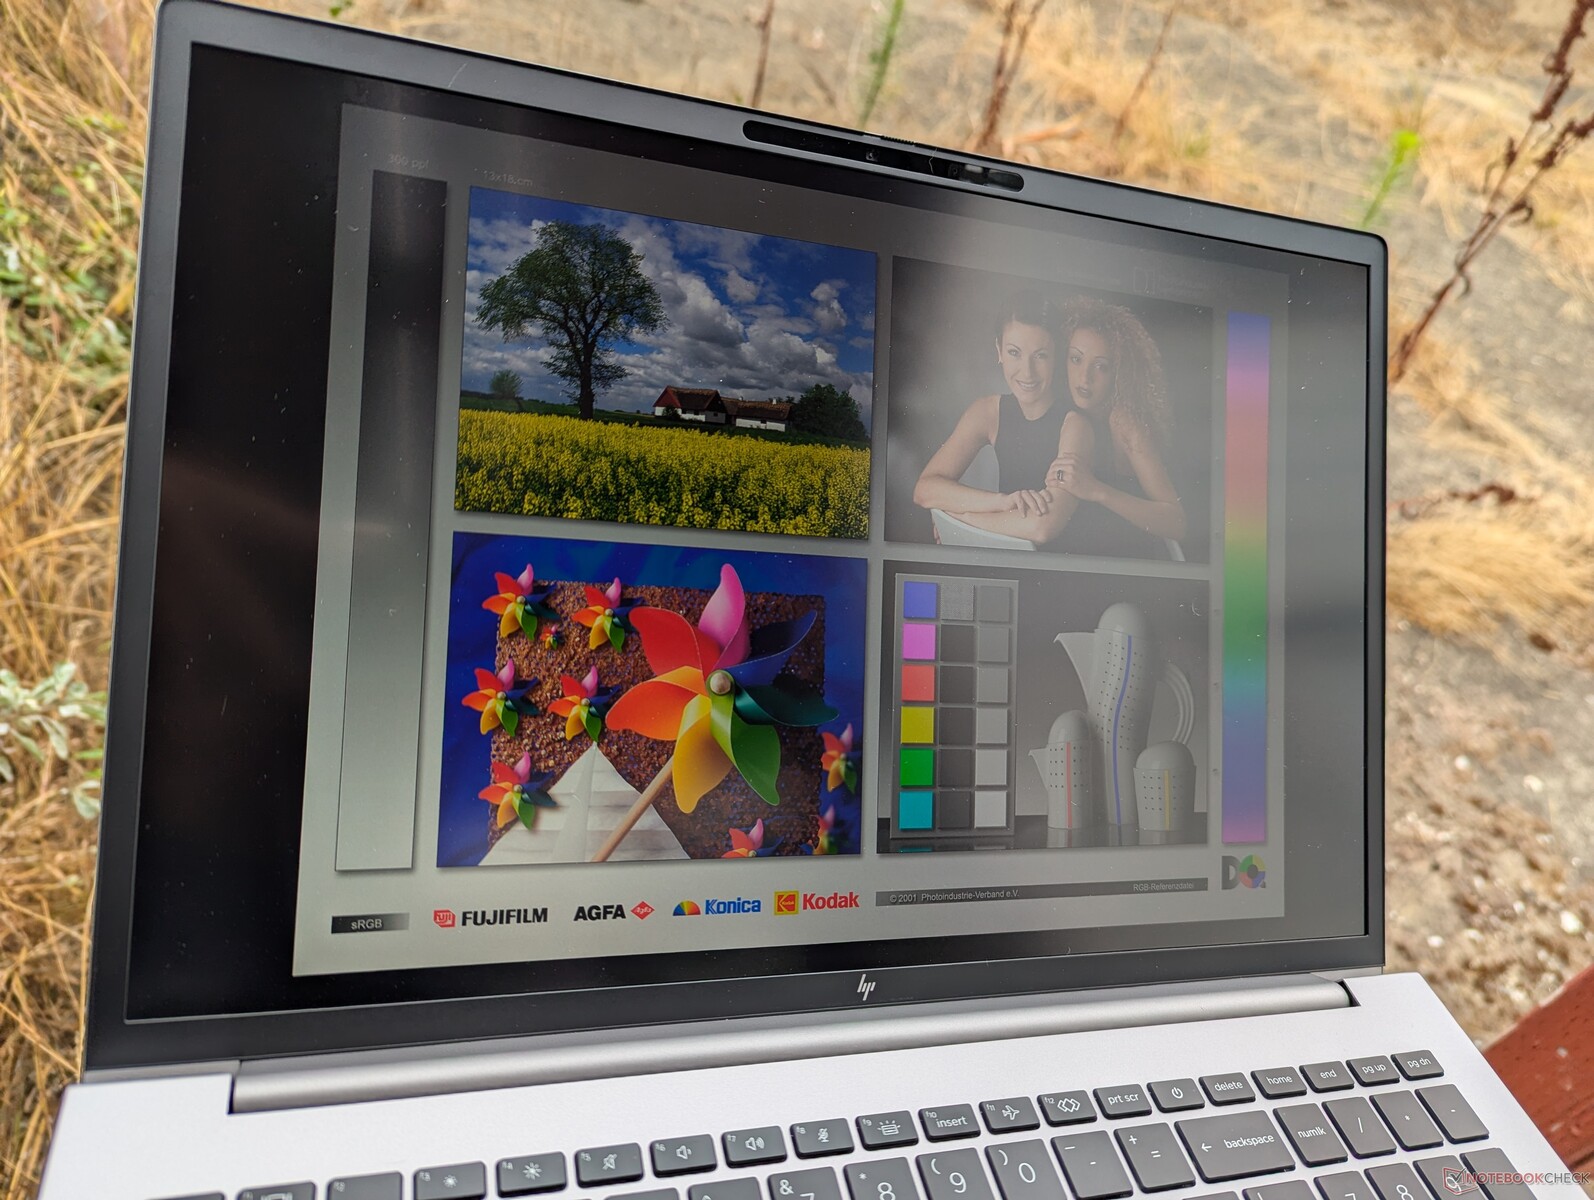
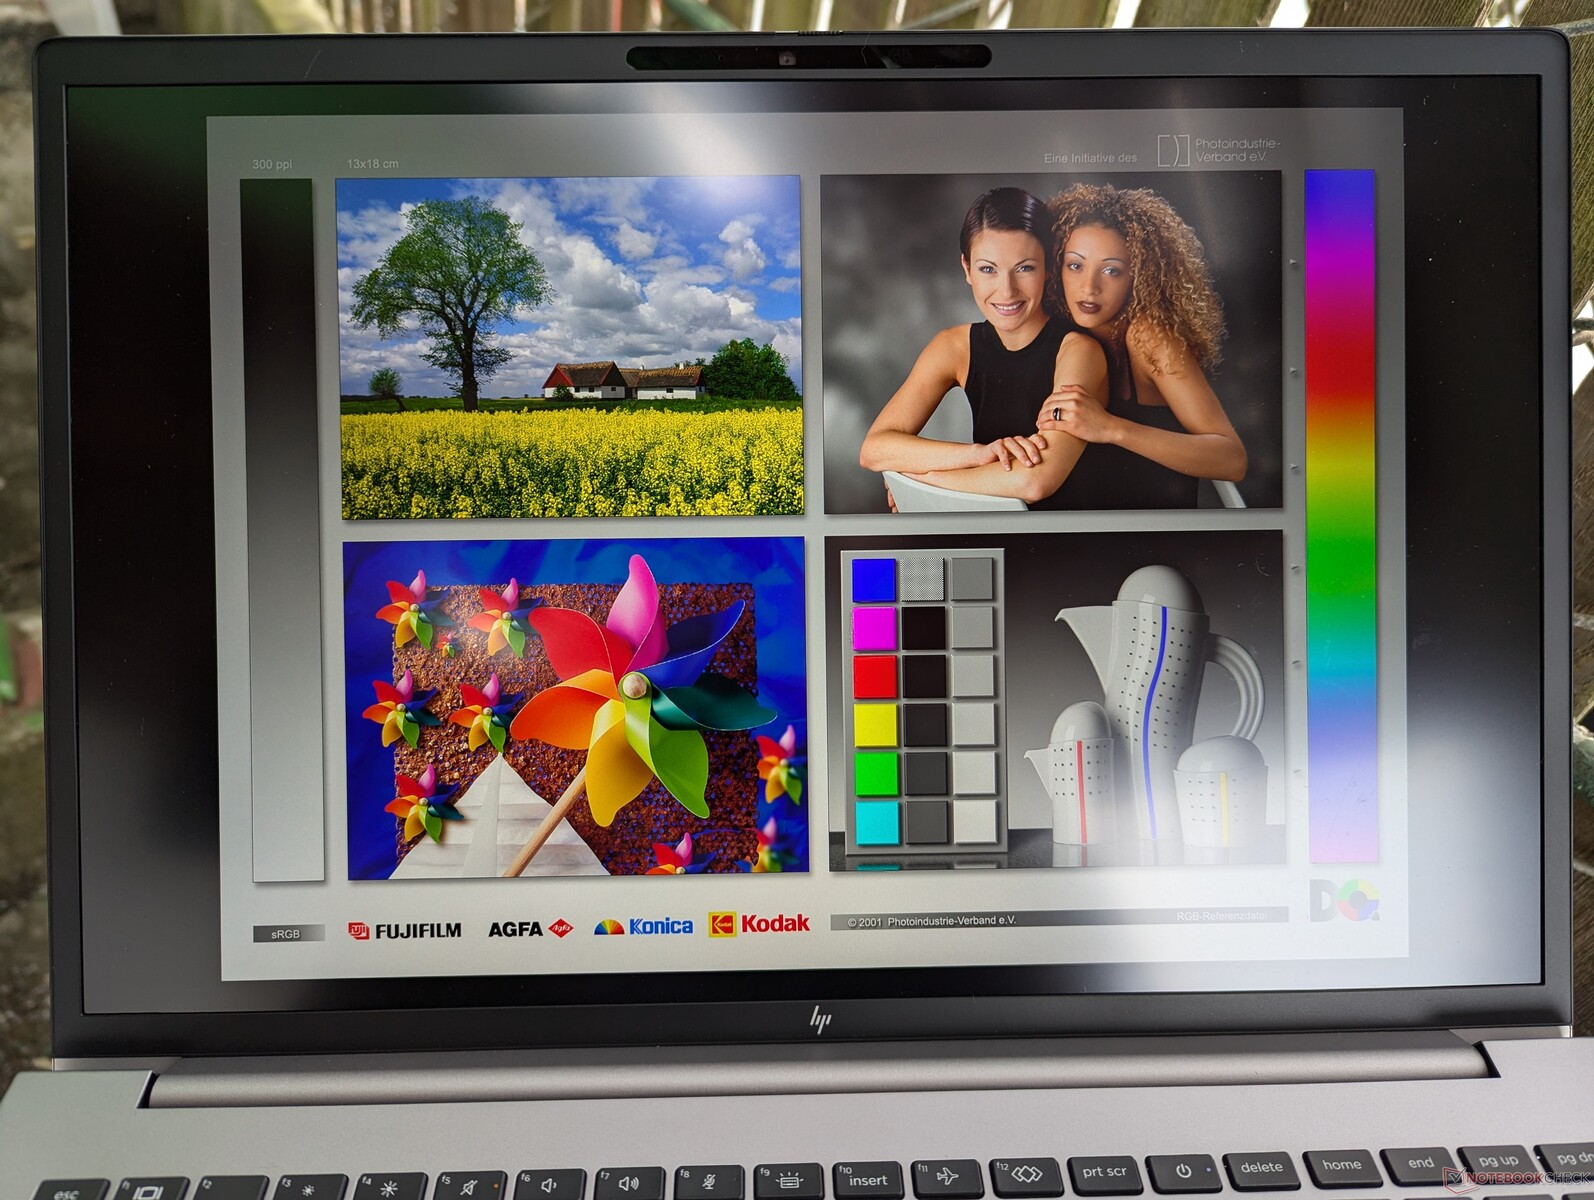
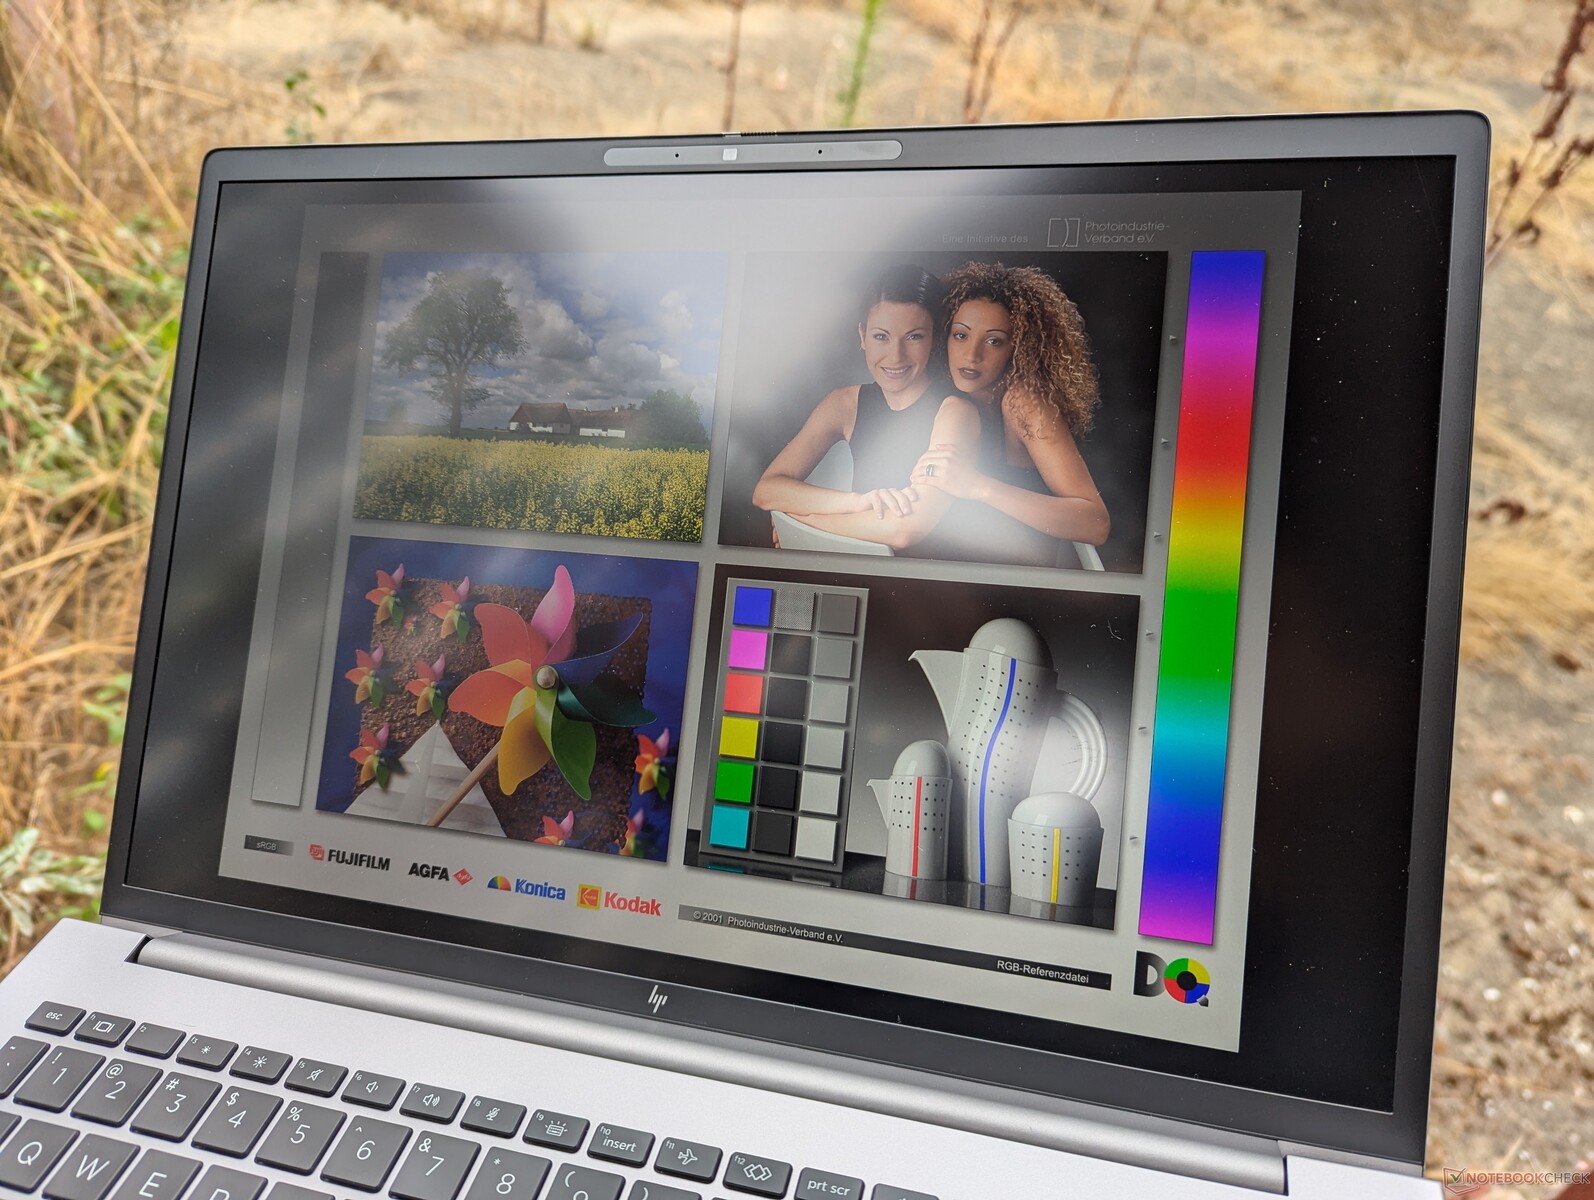
Weergave
Er zijn vijf schermopties beschikbaar. Onze specifieke testeenheid wordt geleverd met het vetgedrukte paneel.
- 3840 x 2400, OLED, aanraakscherm, glanzend, 400 nits, 100% DCI-P3, 60 Hz
- 3840 x 2400, IPS, non-touch, mat, 500 nits, 100% DCI-P3, 120 Hz
- 1920 x 1200, IPS, niet-touch, mat, 400 nits, 100% sRGB, 60 Hz
- 1920 x 1200, IPS, niet-touch, mat, 1000 nits, 100% sRGB, 60 Hz, Sure View Integrated
- 1920 x 1200, IPS, aanraakscherm, glanzend, 400 nits, 100% sRGB, 60 Hz
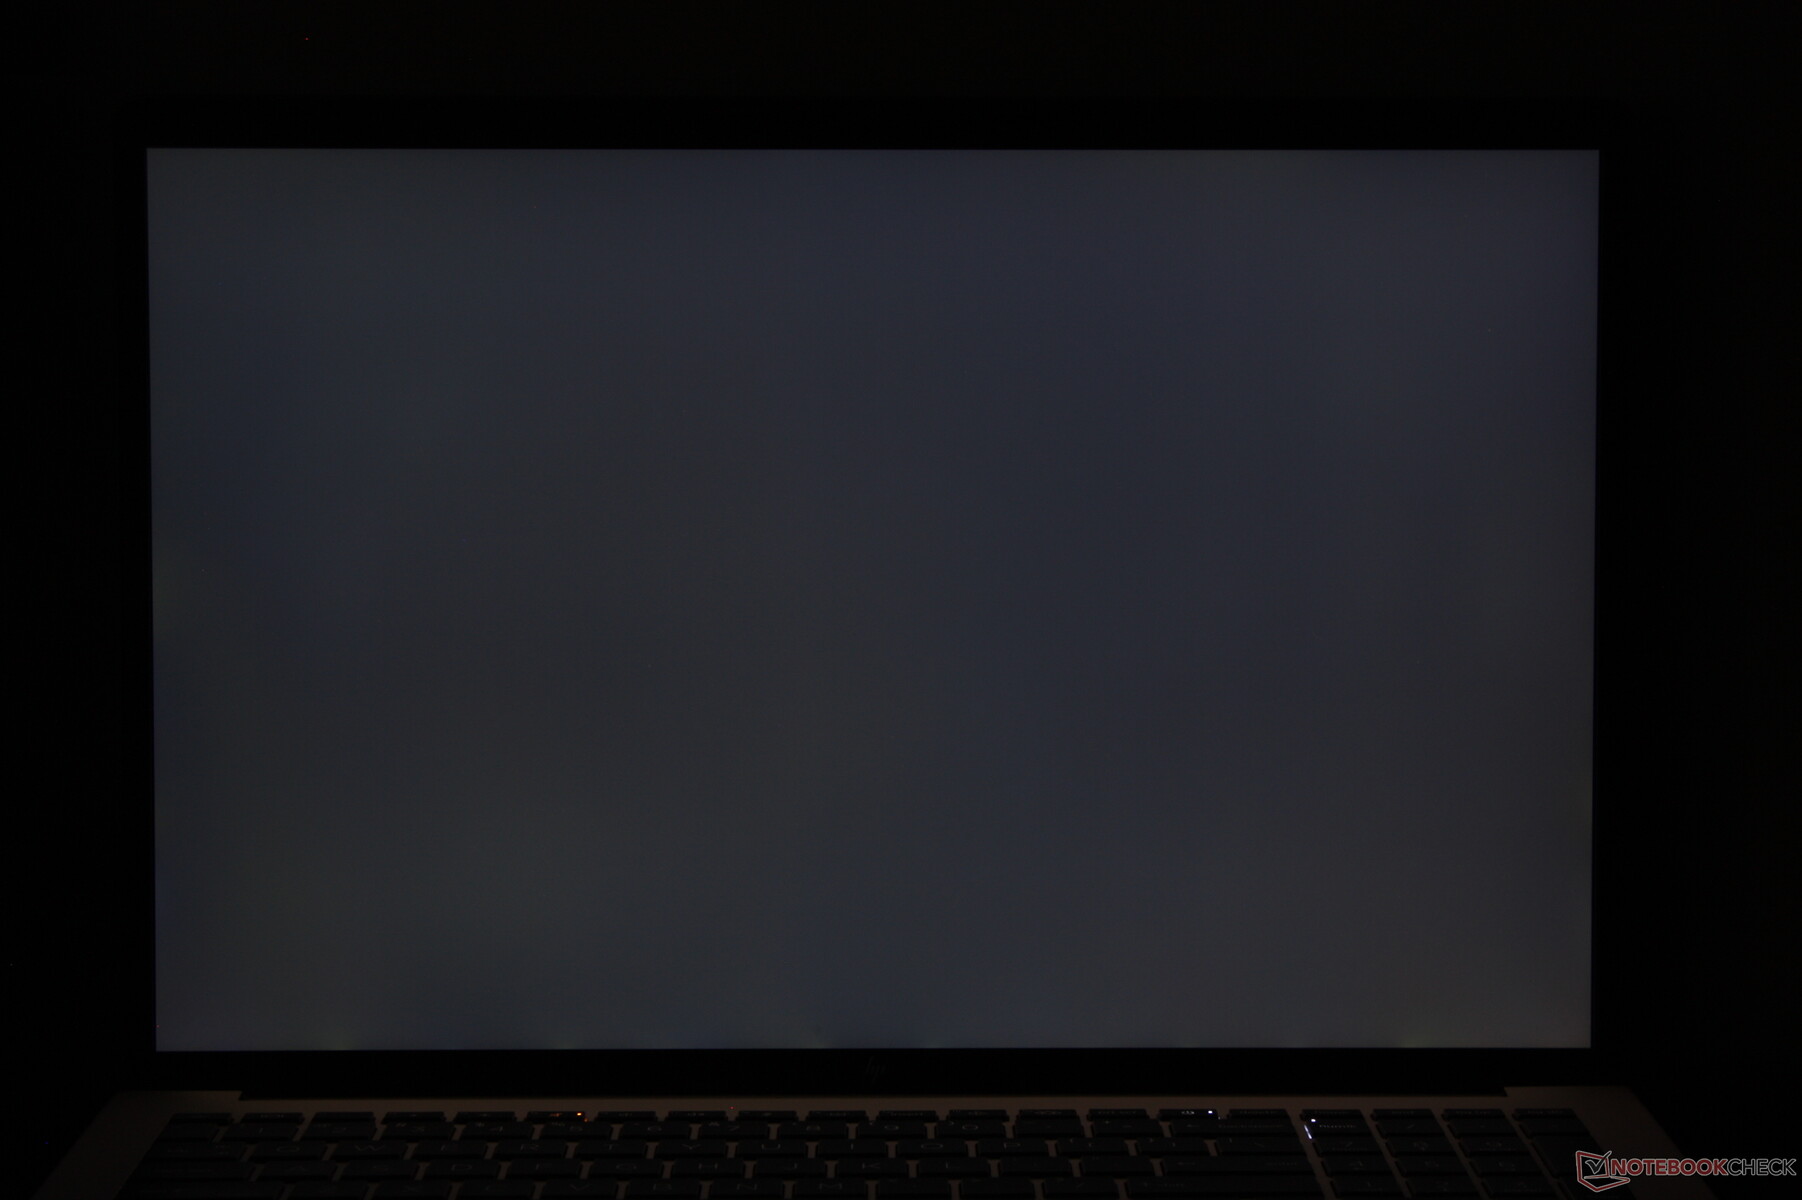
Dit specifieke paneel is toevallig hetzelfde als bij onze ZBook Fury 16 G10 en de visuele ervaring blijft dus identiek. Kopers die van plan zijn om de laptop buitenshuis te gebruiken, kunnen de 1000-nits optie overwegen, maar dit paneel is helaas gebonden aan Sure View, wat de kijkhoeken aanzienlijk beperkt en het moeilijker maakt om het scherm met anderen te delen. Ondertussen biedt de OLED-optie veel betere zwartniveaus voor digitale kunstenaars en toepassingen voor het bewerken van multimedia, maar de glanzende overlay en de lage verversingssnelheid van 60 Hz kunnen een afknapper zijn.
De dynamische vernieuwingsfrequentie van Windows wordt slechts tot 60 Hz ondersteund op ons geconfigureerde paneel.
| |||||||||||||||||||||||||
Helderheidsverdeling: 83 %
Helderheid in Batterij-modus: 457.6 cd/m²
Contrast: 1064:1 (Zwart: 0.43 cd/m²)
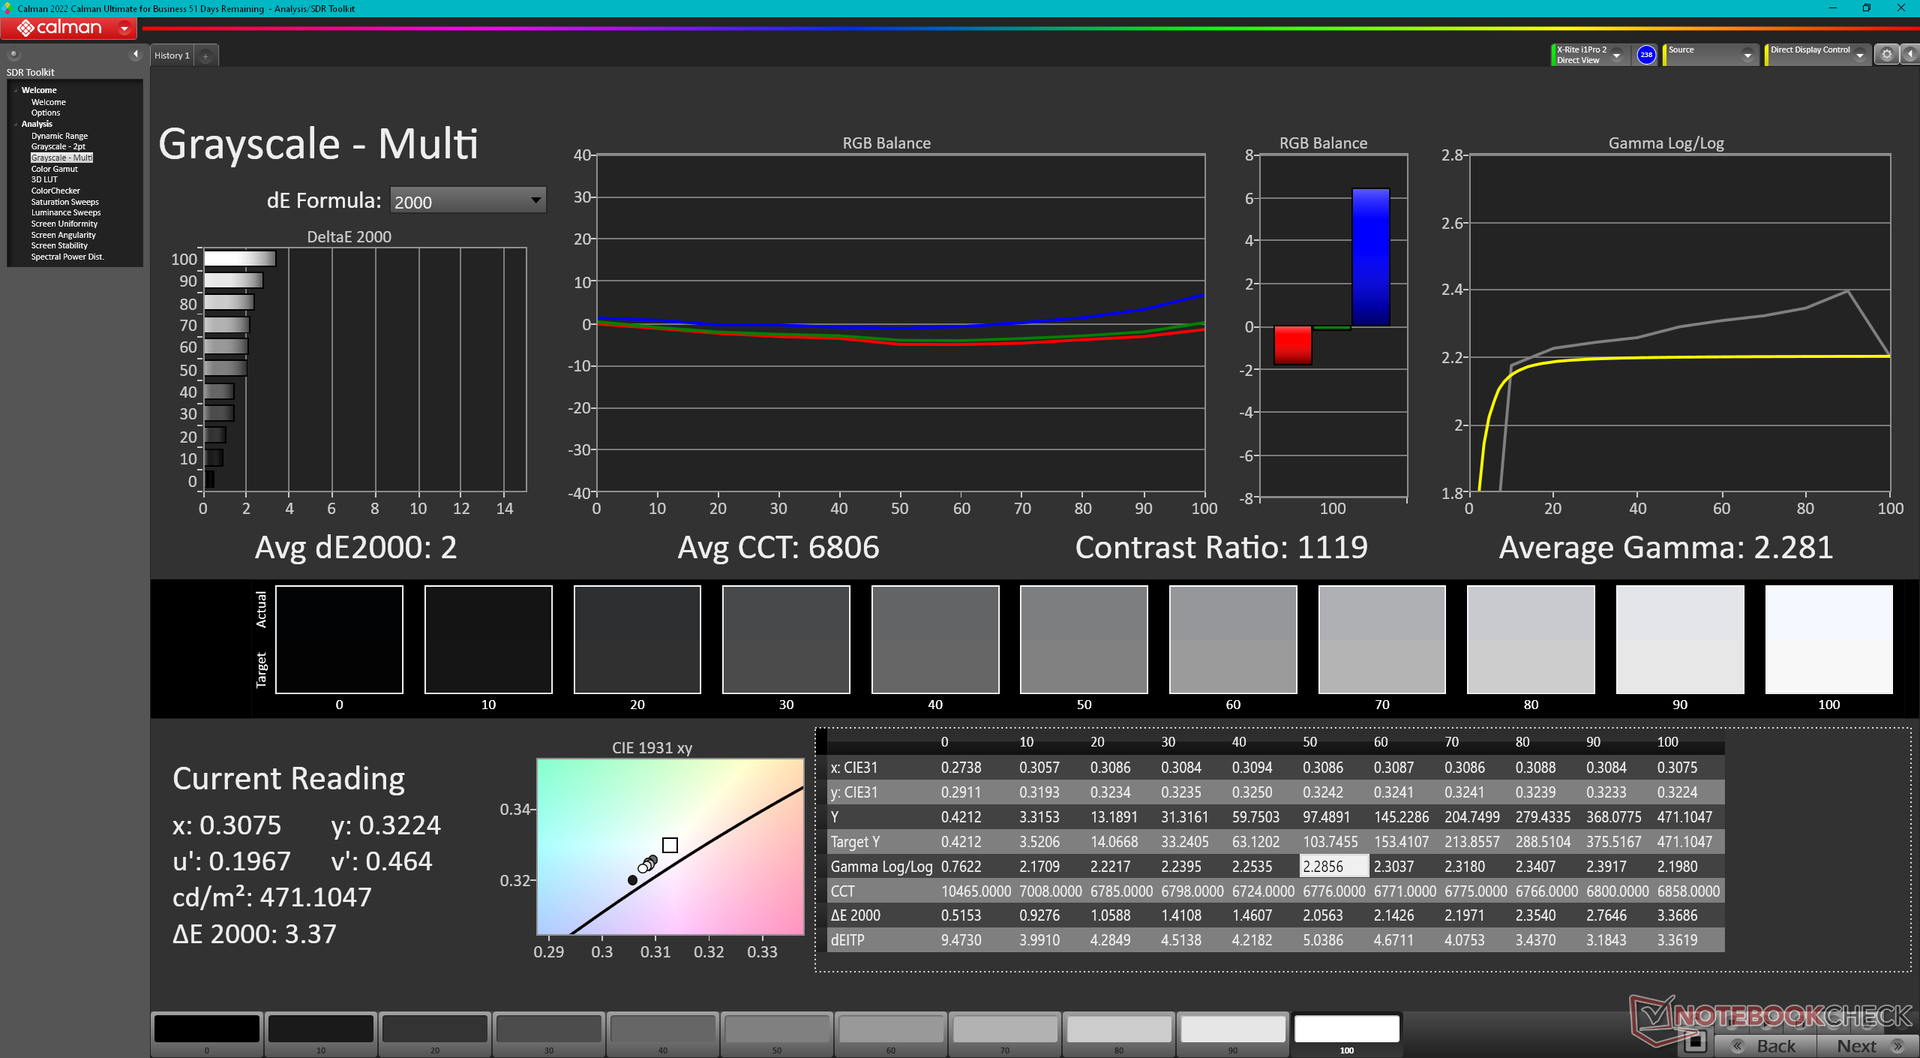
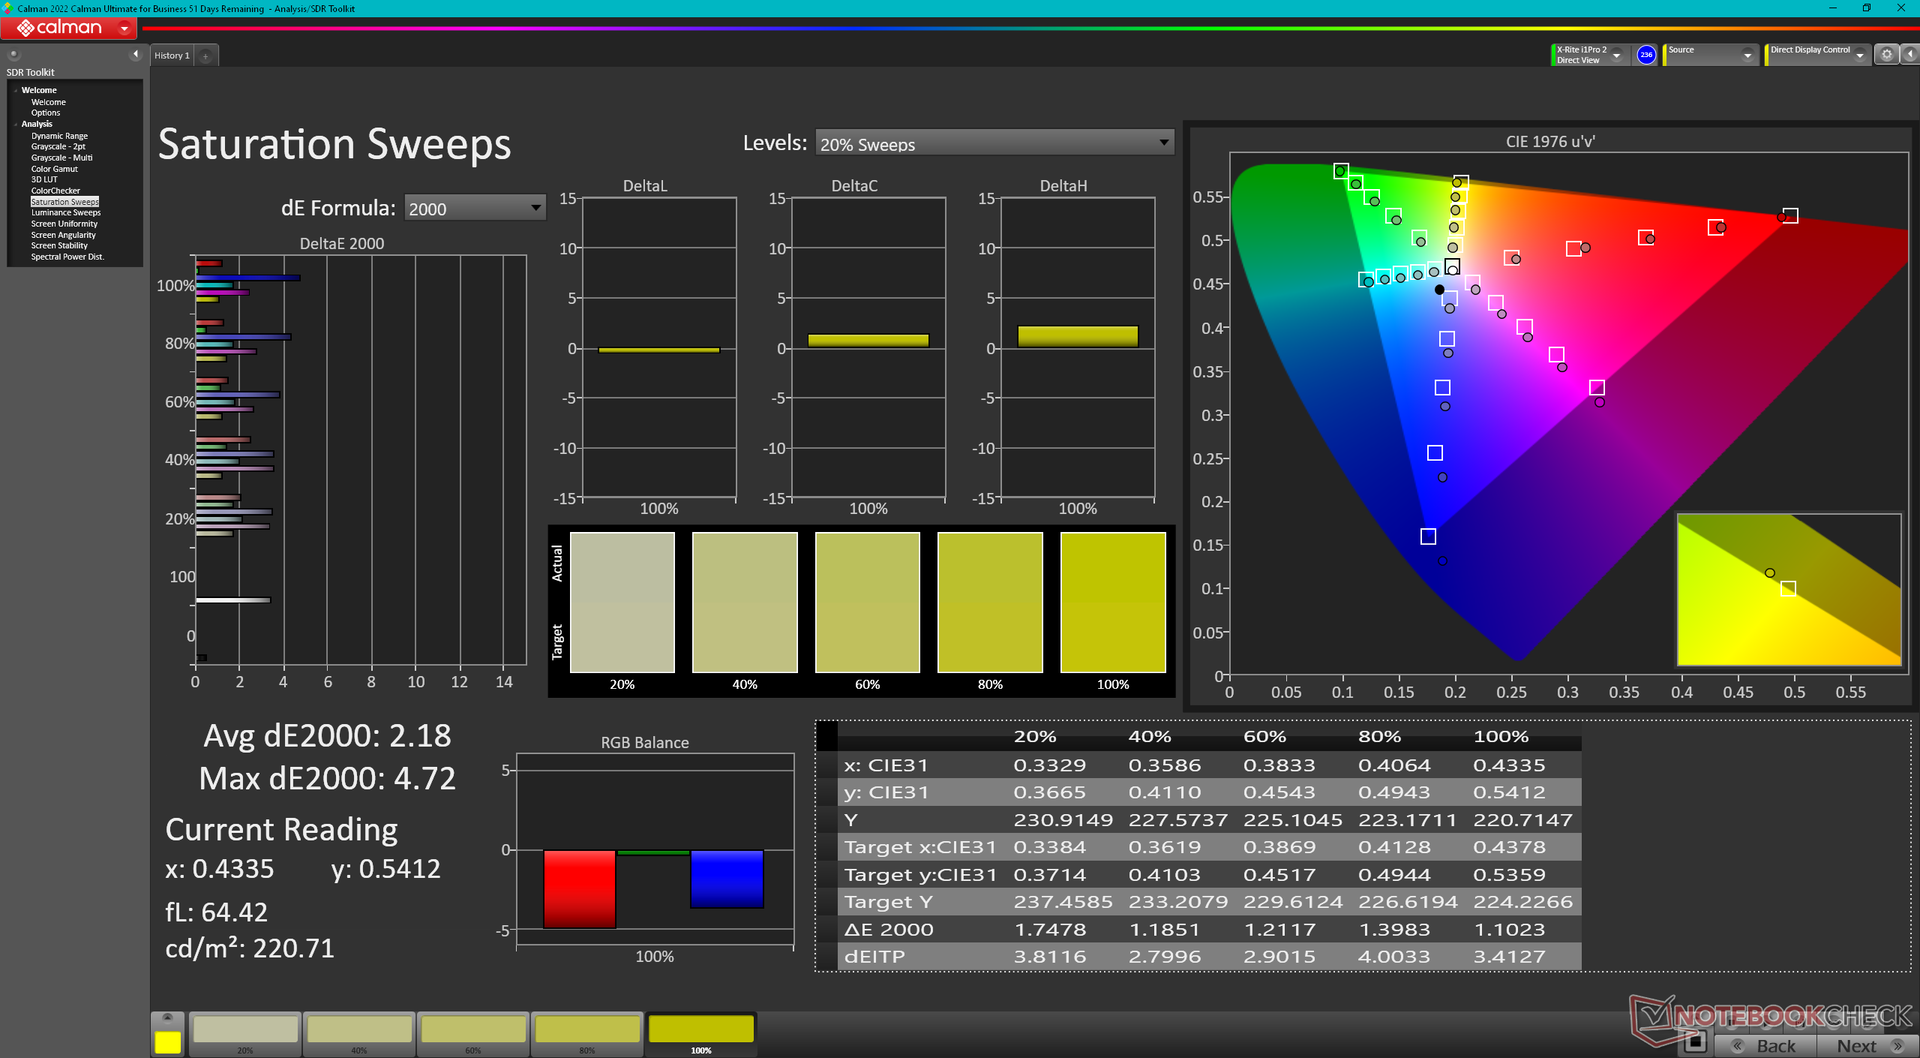
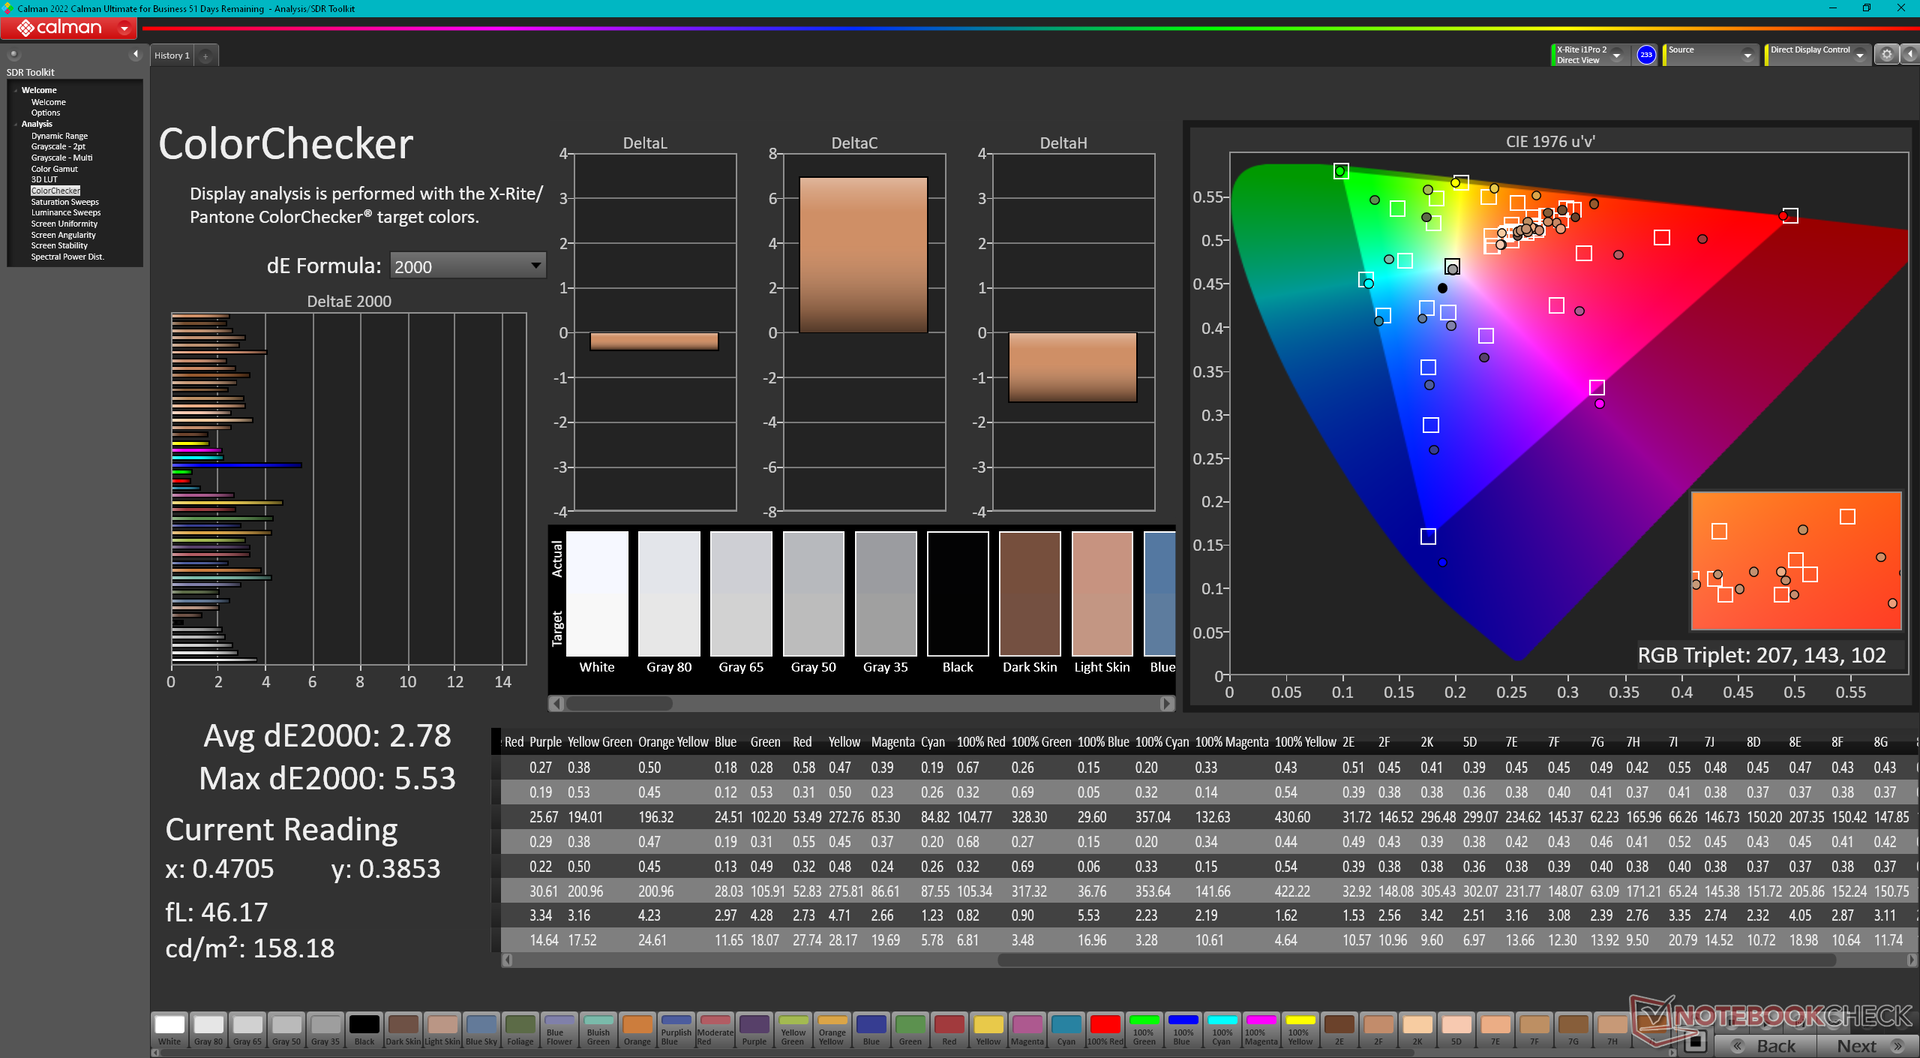
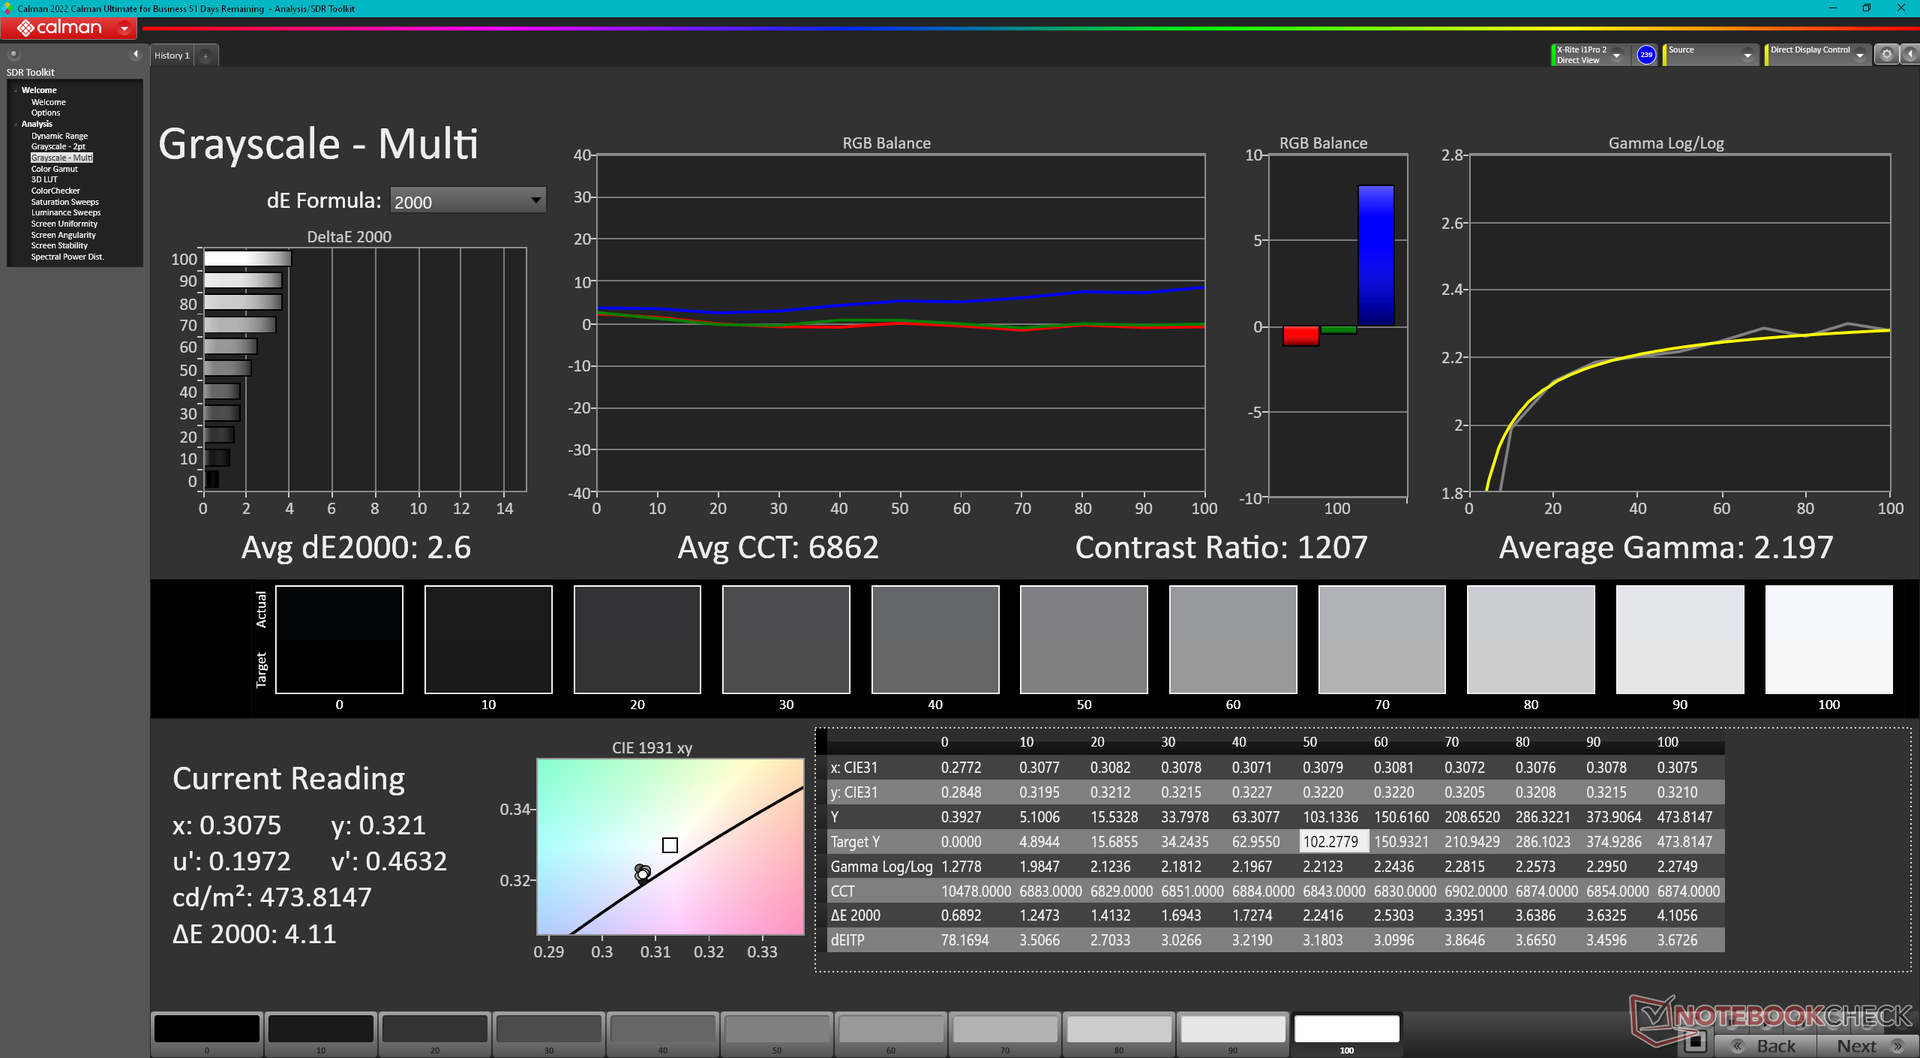
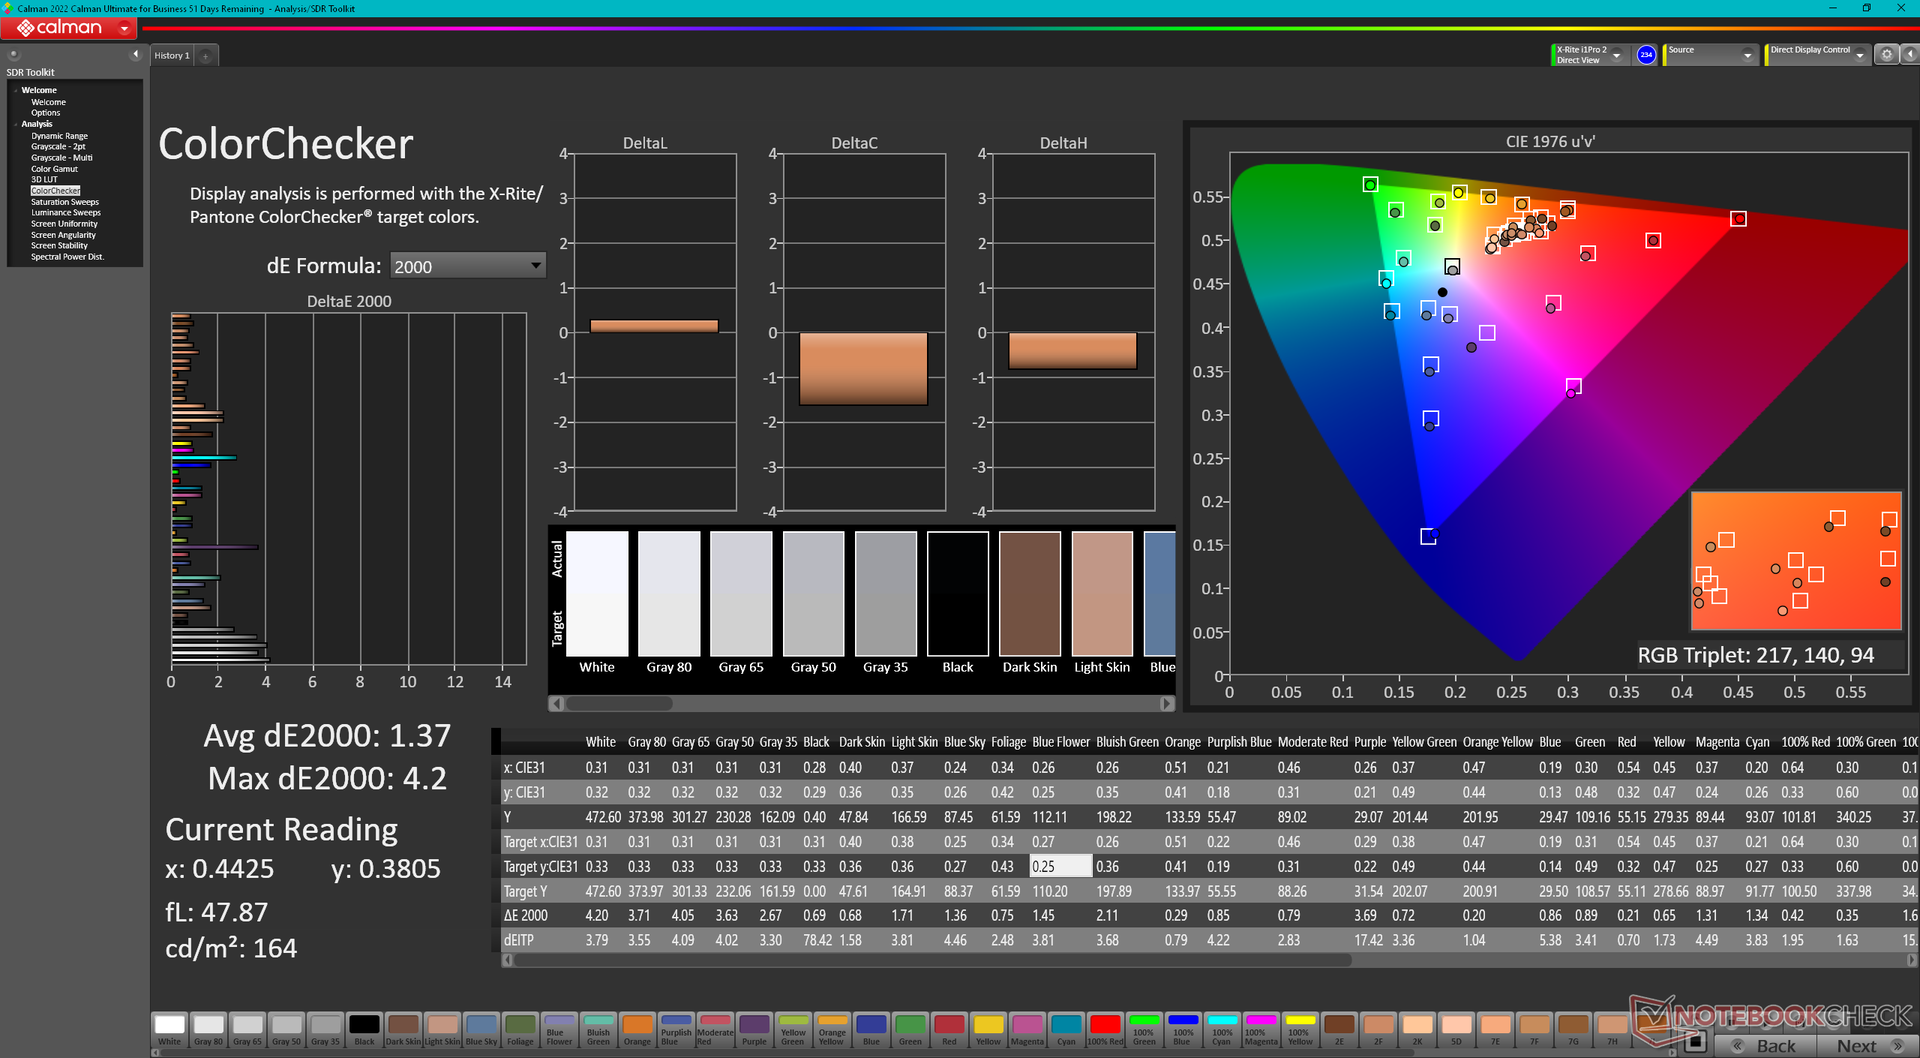
ΔE Color 2.78 | 0.5-29.43 Ø4.86, calibrated: 1.37
ΔE Greyscale 2 | 0.5-98 Ø5.1
86% AdobeRGB 1998 (Argyll 2.2.0 3D)
99.9% sRGB (Argyll 2.2.0 3D)
98.4% Display P3 (Argyll 2.2.0 3D)
Gamma: 2.28
| HP ZBook Fury 16 G11 AUO87A8, IPS, 3840x2400, 16", 120 Hz | HP ZBook Fury 16 G10 AUO87A8, IPS, 3840x2400, 16", 120 Hz | HP ZBook Fury 16 G9 BOE0A52, IPS, 3840x2400, 16", 60 Hz | Dell Precision 5690 Samsung 160YV03, OLED, 3840x2400, 16", 60 Hz | Lenovo ThinkPad P16 G2 21FA000FGE MNG007DA1-9, IPS LED, 2560x1600, 16", 165 Hz | Lenovo ThinkPad P1 G6 21FV001KUS Samsung ATNA60YV04-0, OLED, 3480x2400, 16", 60 Hz | Asus ProArt Studiobook 16 OLED H7604 ATNA60BX01-1, OLED, 3200x2000, 16", 120 Hz | |
|---|---|---|---|---|---|---|---|
| Display | 0% | -0% | 4% | -15% | 5% | 2% | |
| Display P3 Coverage | 98.4 | 98 0% | 97.4 -1% | 99.8 1% | 71 -28% | 99.8 1% | 99.6 1% |
| sRGB Coverage | 99.9 | 99.9 0% | 99.9 0% | 100 0% | 99.2 -1% | 100 0% | 100 0% |
| AdobeRGB 1998 Coverage | 86 | 86.2 0% | 86.3 0% | 96.6 12% | 73.2 -15% | 97.9 14% | 89.4 4% |
| Response Times | -9% | -11% | 83% | -16% | 82% | 93% | |
| Response Time Grey 50% / Grey 80% * | 11.4 ? | 11.9 ? -4% | 13.7 ? -20% | 1.7 ? 85% | 12.8 ? -12% | 1.69 ? 85% | 0.59 ? 95% |
| Response Time Black / White * | 8.4 ? | 9.6 ? -14% | 8.6 ? -2% | 1.7 ? 80% | 10.1 ? -20% | 1.73 ? 79% | 0.79 ? 91% |
| PWM Frequency | 60 ? | 60 ? | 240 ? | ||||
| Screen | 19% | -25% | -8% | -7% | 19% | 179% | |
| Brightness middle | 457.6 | 514.6 12% | 530.5 16% | 348.1 -24% | 510 11% | 375.1 -18% | 349 -24% |
| Brightness | 466 | 495 6% | 476 2% | 351 -25% | 517 11% | 379 -19% | 350 -25% |
| Brightness Distribution | 83 | 90 8% | 83 0% | 97 17% | 89 7% | 98 18% | 95 14% |
| Black Level * | 0.43 | 0.46 -7% | 0.57 -33% | 0.37 14% | 0.02 95% | ||
| Contrast | 1064 | 1119 5% | 931 -12% | 1378 30% | 17450 1540% | ||
| Colorchecker dE 2000 * | 2.78 | 2.4 14% | 2.26 19% | 4.18 -50% | 2.6 6% | 1.16 58% | 2.1 24% |
| Colorchecker dE 2000 max. * | 5.53 | 4.86 12% | 6.68 -21% | 5.2 6% | 2.94 47% | 5.5 1% | |
| Colorchecker dE 2000 calibrated * | 1.37 | 0.4 71% | 4.73 -245% | 0.97 29% | 2.3 -68% | 2.1 -53% | |
| Greyscale dE 2000 * | 2 | 1 50% | 1 50% | 1.7 15% | 3.6 -80% | 1.4 30% | 1.2 40% |
| Gamma | 2.28 96% | 2.3 96% | 2.28 96% | 2.2 100% | 2.26 97% | 2.2 100% | 2.19 100% |
| CCT | 6806 96% | 6553 99% | 6543 99% | 6198 105% | 5969 109% | 6325 103% | 6545 99% |
| Totaal Gemiddelde (Programma / Instellingen) | 3% /
11% | -12% /
-17% | 26% /
10% | -13% /
-10% | 35% /
27% | 91% /
129% |
* ... kleiner is beter
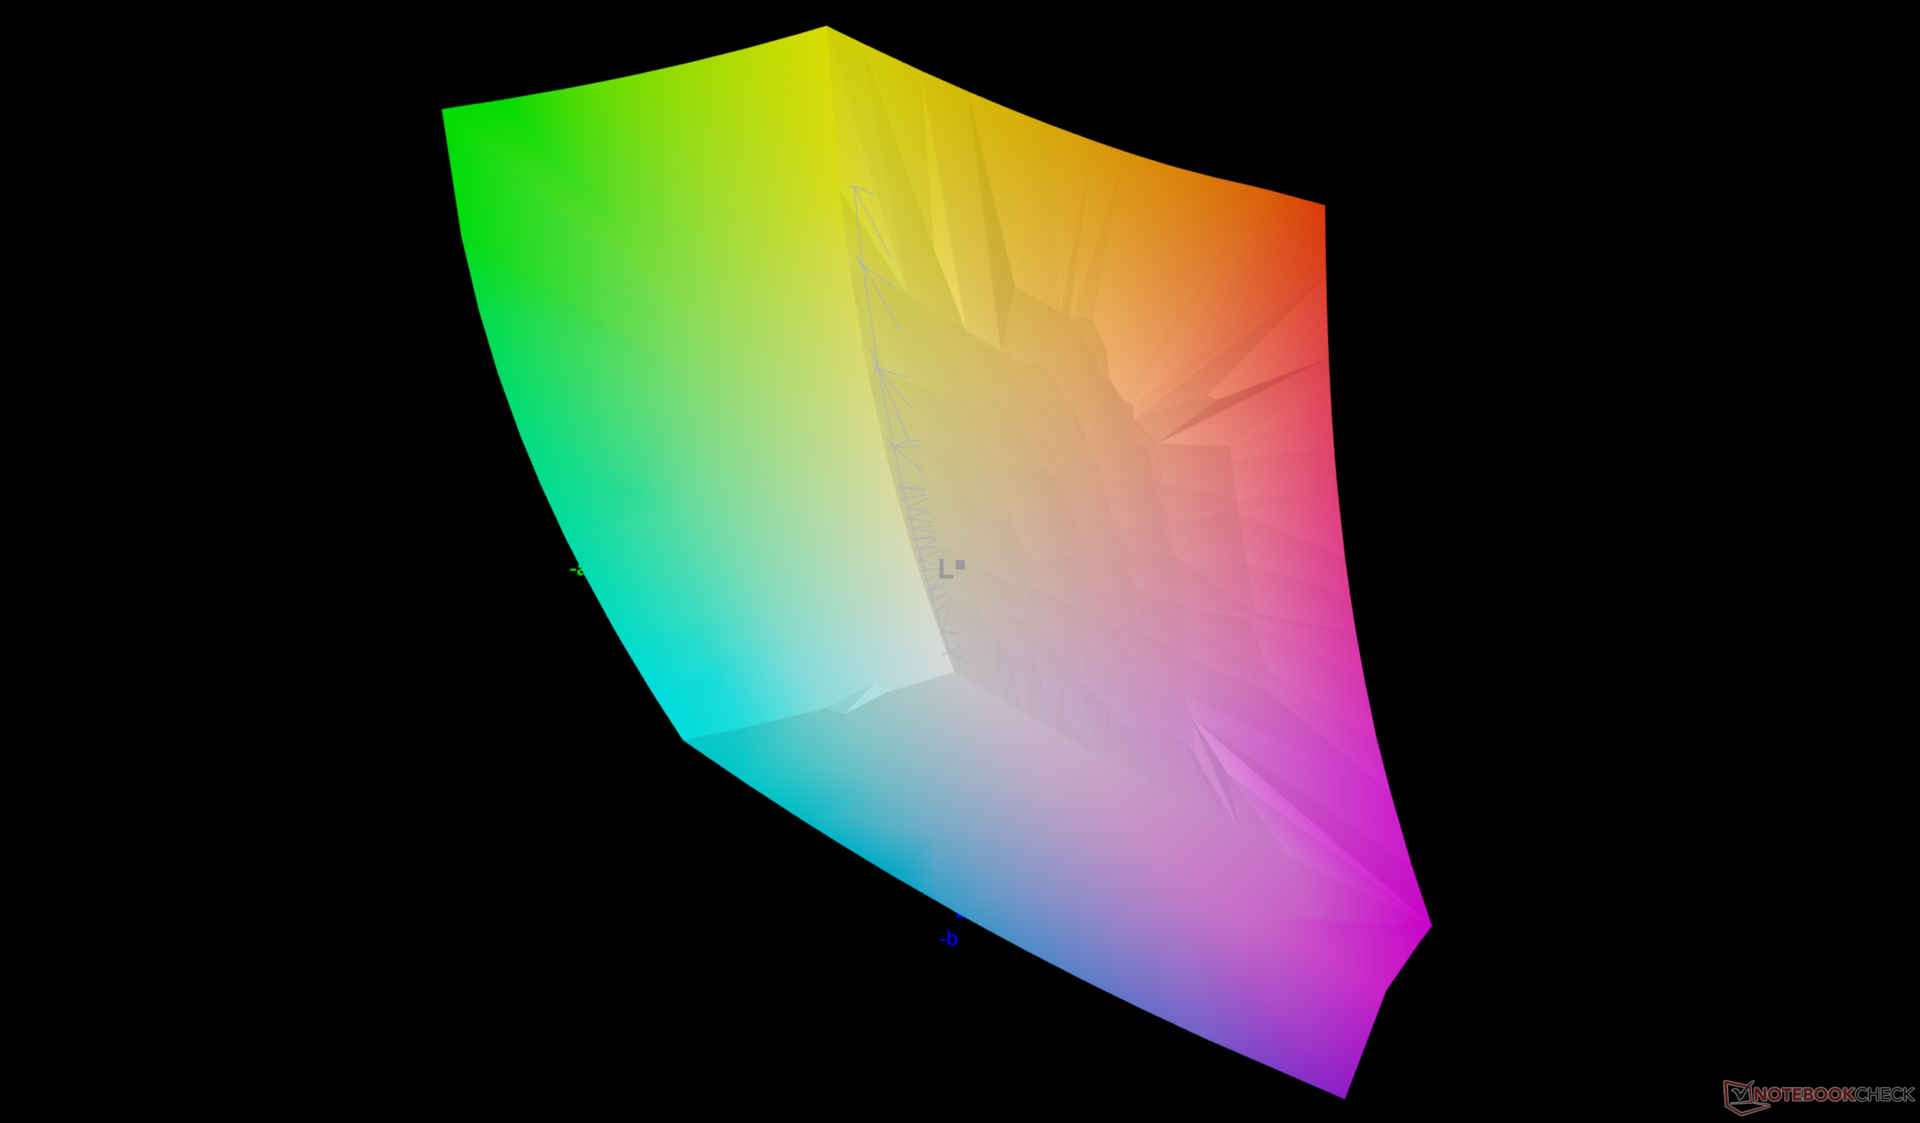
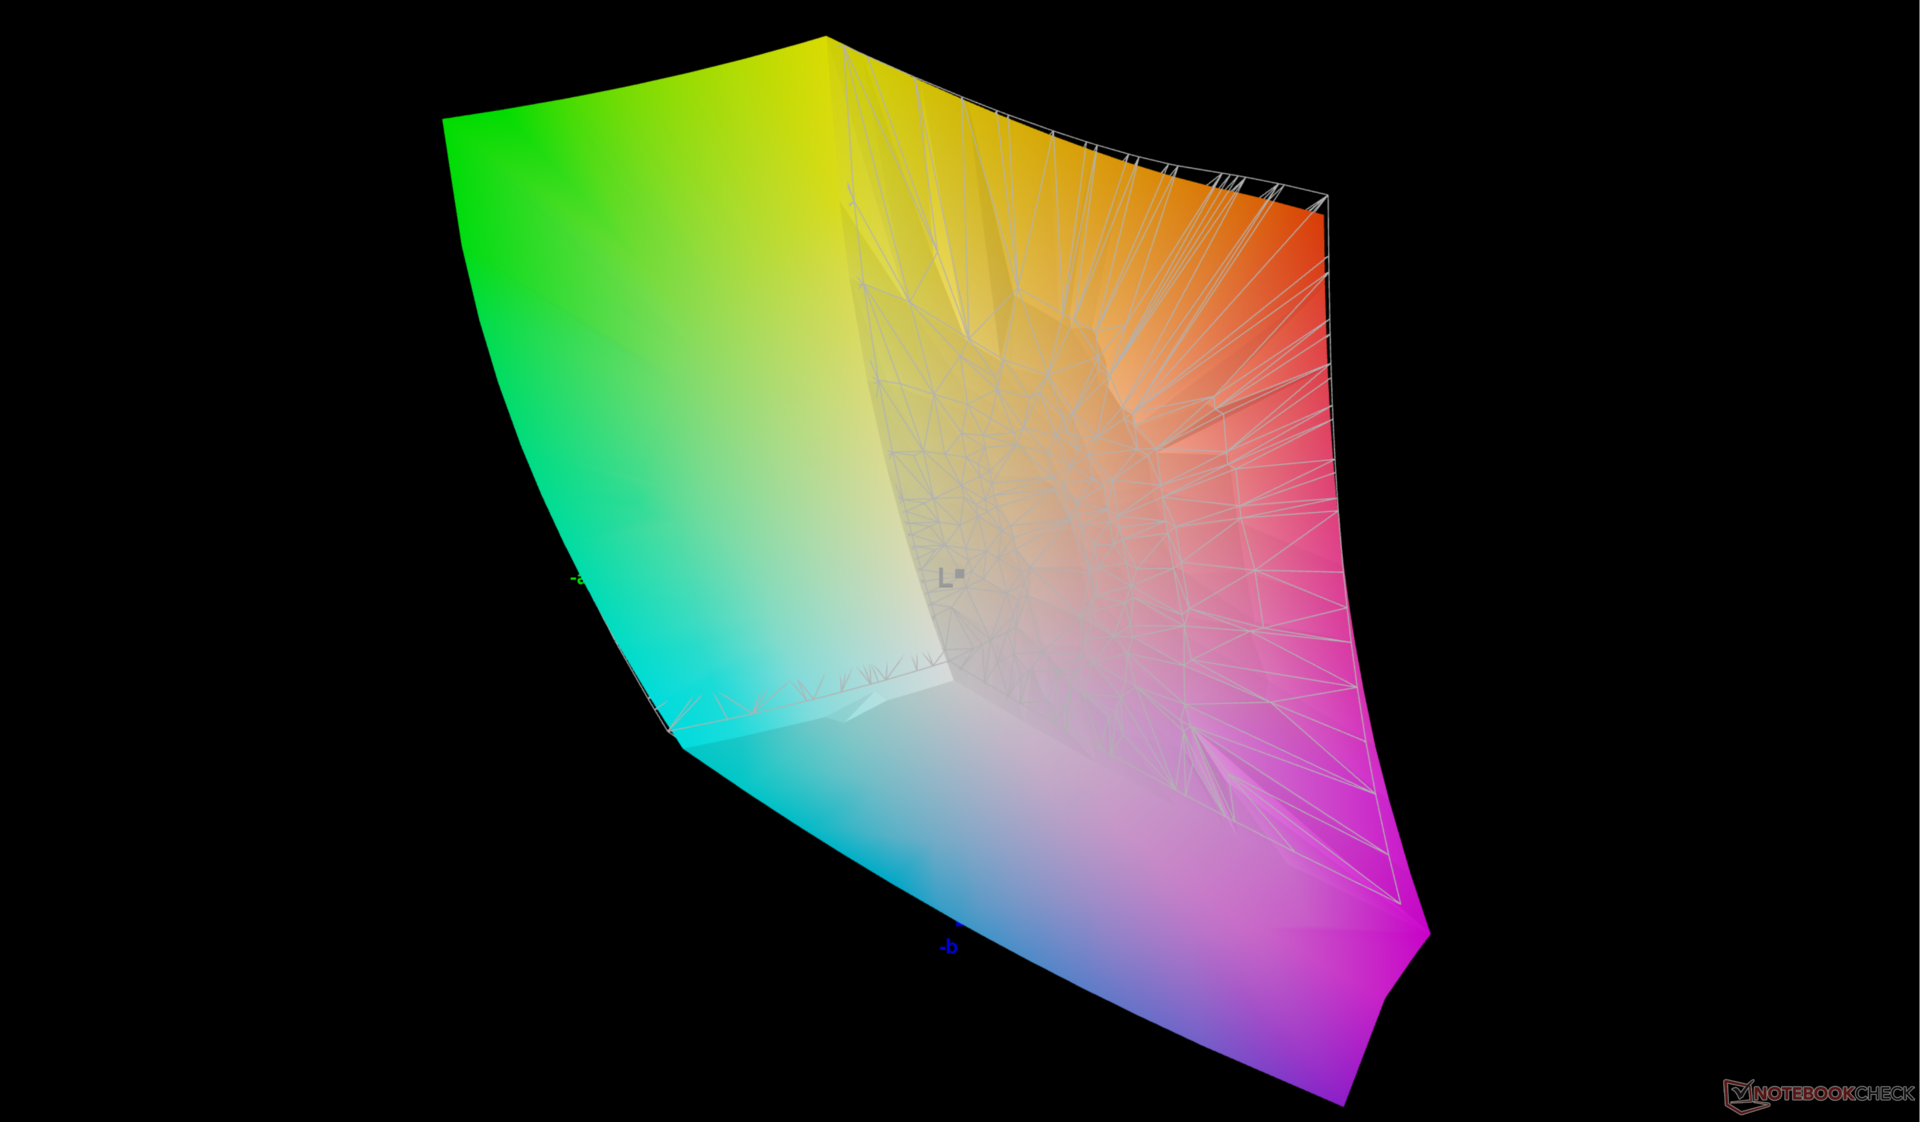
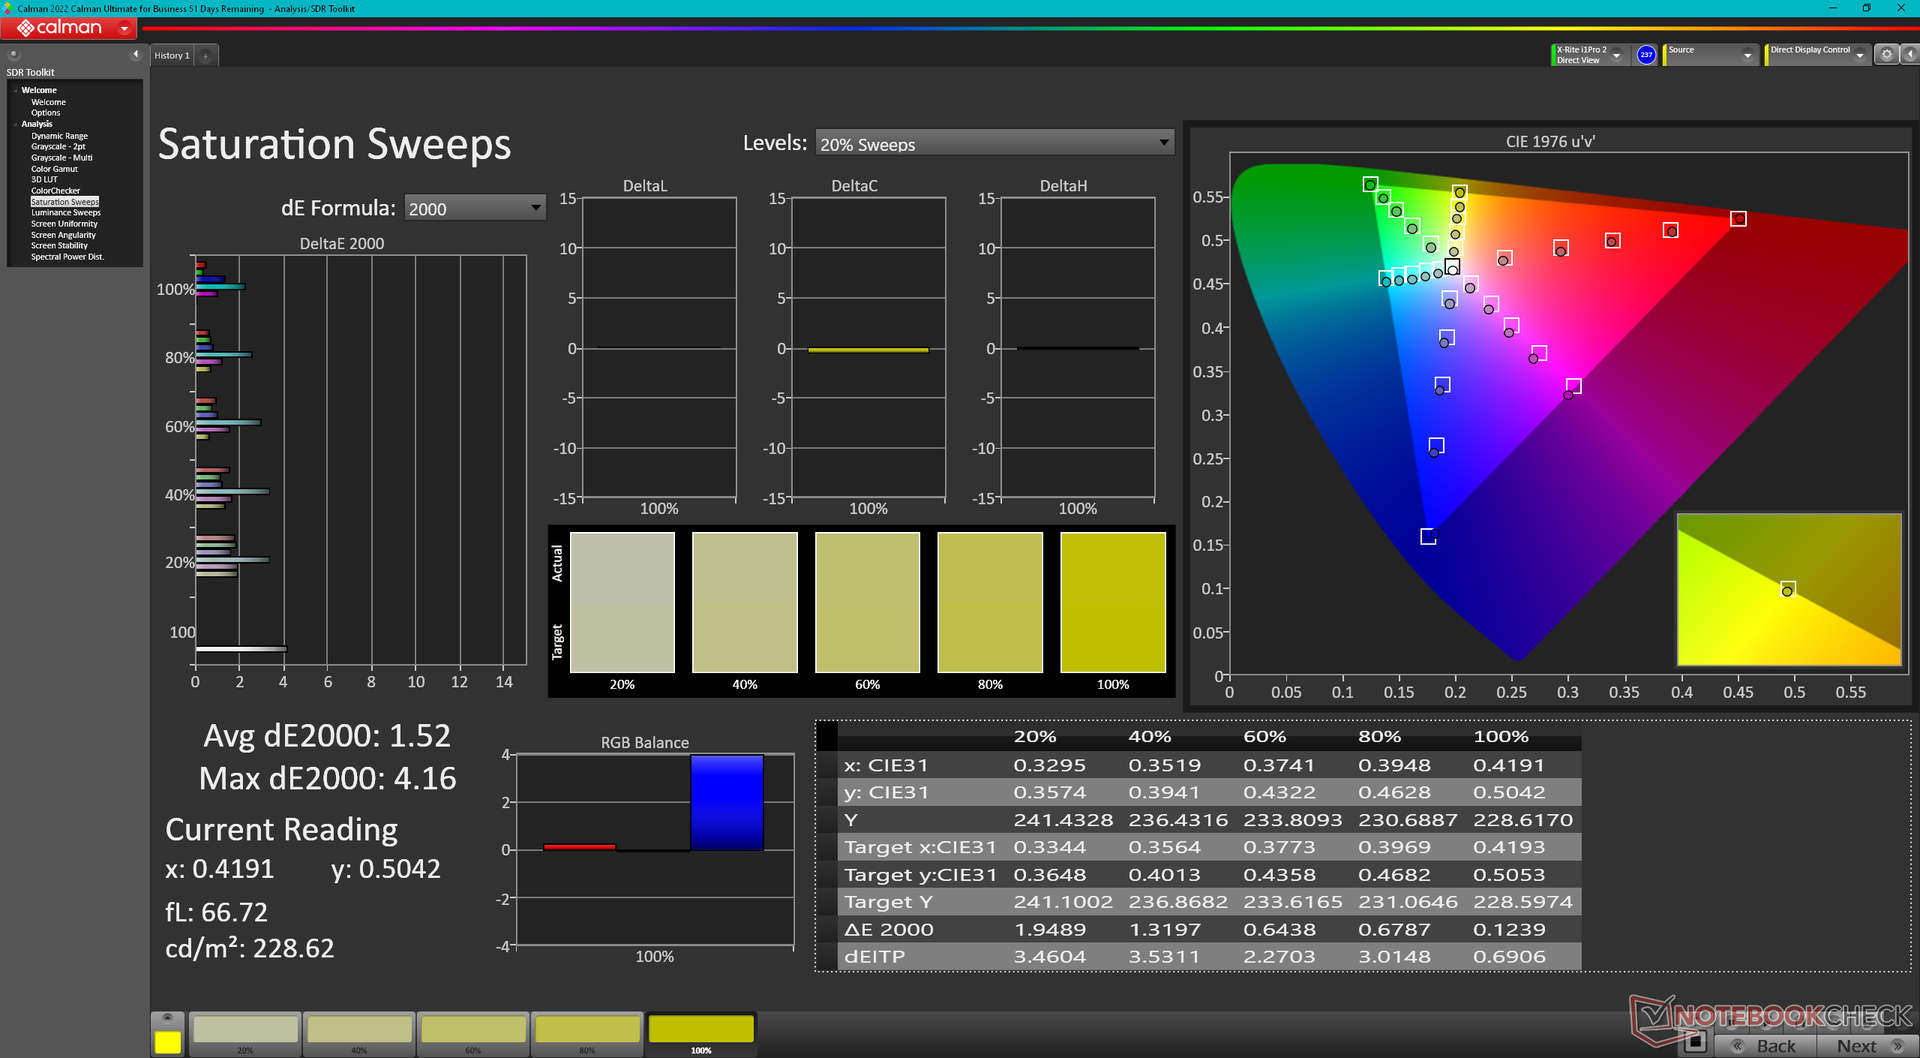
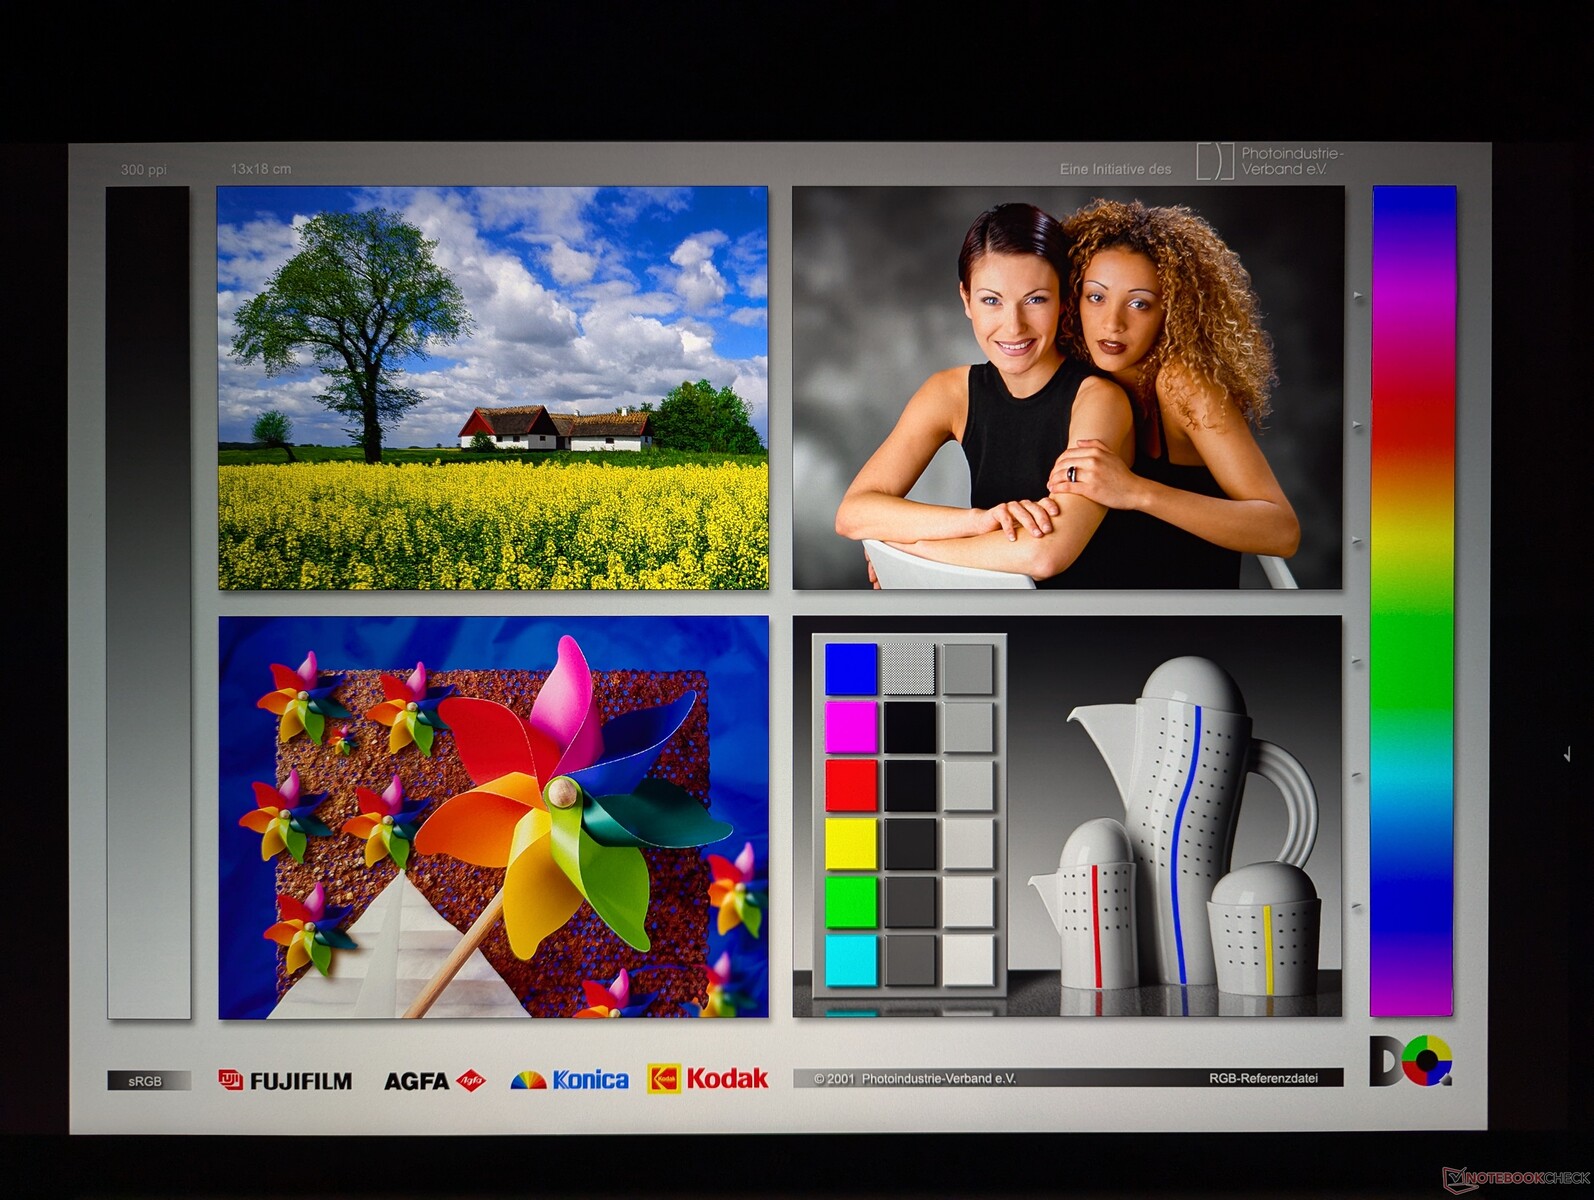
Het beeldscherm is goed gekalibreerd ten opzichte van de P3 standaard met gemiddelde deltaE grijswaarden en kleurwaarden van respectievelijk slechts 2 en 2,18. Het paneel nog verder kalibreren met onze X-Rite colorimeter zou de nauwkeurigheid slechts licht verbeteren en is voor de meeste gebruikers meestal overbodig.
Responstijd Scherm
| ↔ Responstijd Zwart naar Wit | ||
|---|---|---|
| 8.4 ms ... stijging ↗ en daling ↘ gecombineerd | ↗ 4.7 ms stijging | 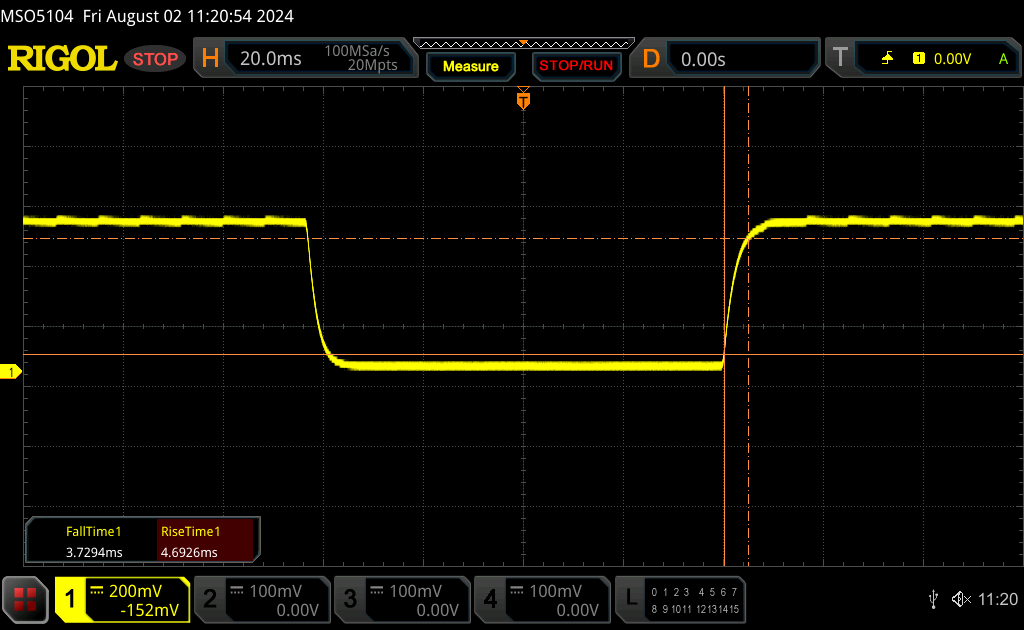 |
| ↘ 3.7 ms daling | ||
| Het scherm vertoonde snelle responstijden in onze tests en zou geschikt moeten zijn voor games. Ter vergelijking: alle testtoestellen variëren van 0.1 (minimum) tot 240 (maximum) ms. » 21 % van alle toestellen zijn beter. Dit betekent dat de gemeten responstijd beter is dan het gemiddelde (20.7 ms) van alle geteste toestellen. | ||
| ↔ Responstijd 50% Grijs naar 80% Grijs | ||
| 11.4 ms ... stijging ↗ en daling ↘ gecombineerd | ↗ 5.3 ms stijging | 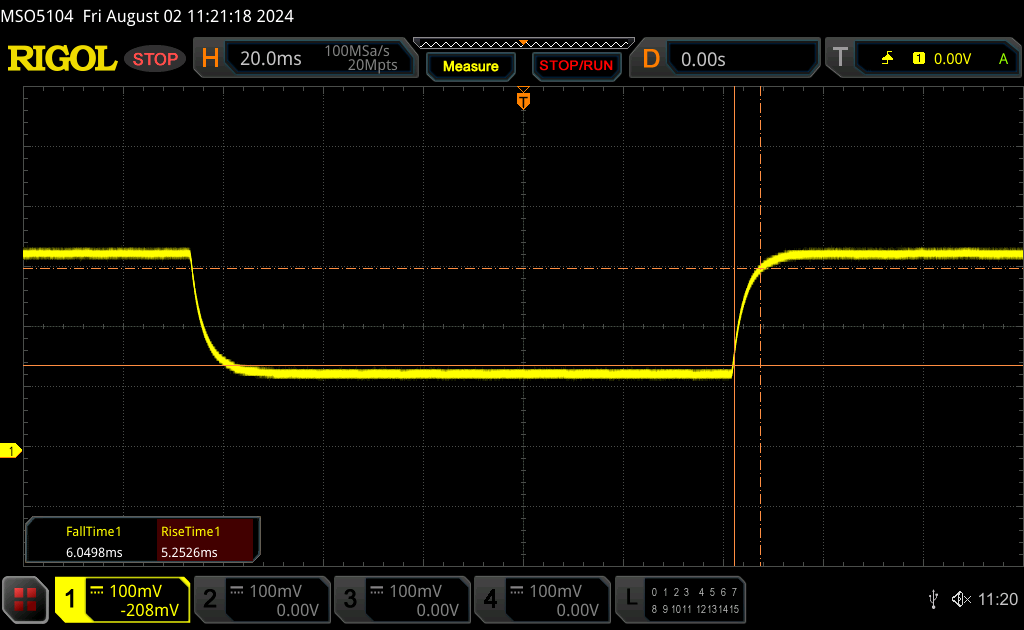 |
| ↘ 6.1 ms daling | ||
| Het scherm vertoonde prima responstijden in onze tests maar is misschien wat te traag voor competitieve games. Ter vergelijking: alle testtoestellen variëren van 0.165 (minimum) tot 636 (maximum) ms. » 22 % van alle toestellen zijn beter. Dit betekent dat de gemeten responstijd beter is dan het gemiddelde (32.4 ms) van alle geteste toestellen. | ||
Screen Flickering / PWM (Pulse-Width Modulation)
| Screen flickering / PWM niet waargenomen | 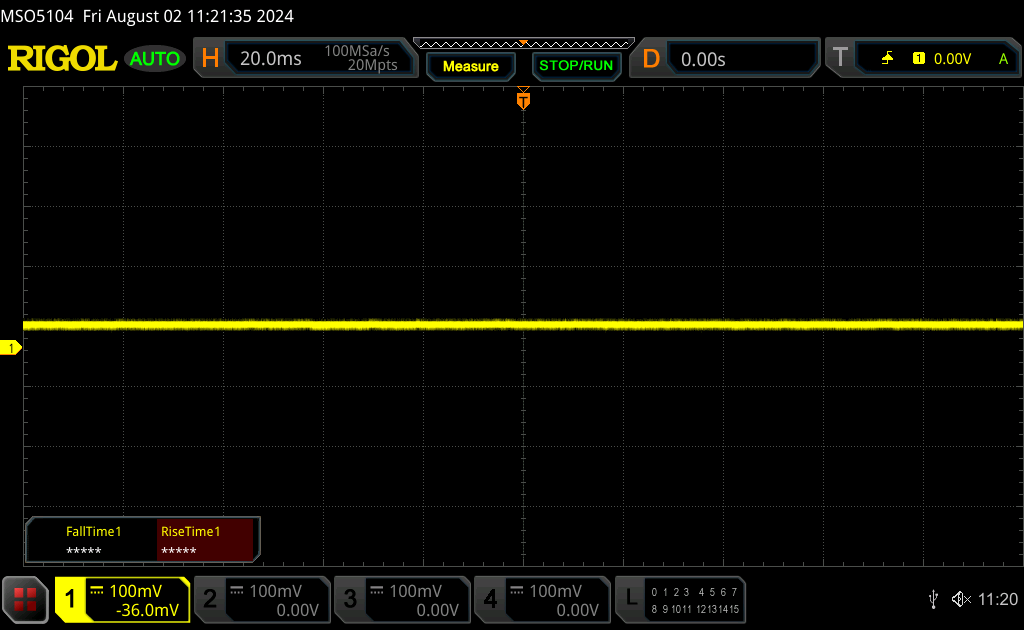 | ||
Ter vergelijking: 53 % van alle geteste toestellen maakten geen gebruik van PWM om de schermhelderheid te verlagen. Als het wel werd gebruikt, werd een gemiddelde van 8458 (minimum: 5 - maximum: 343500) Hz waargenomen. | |||
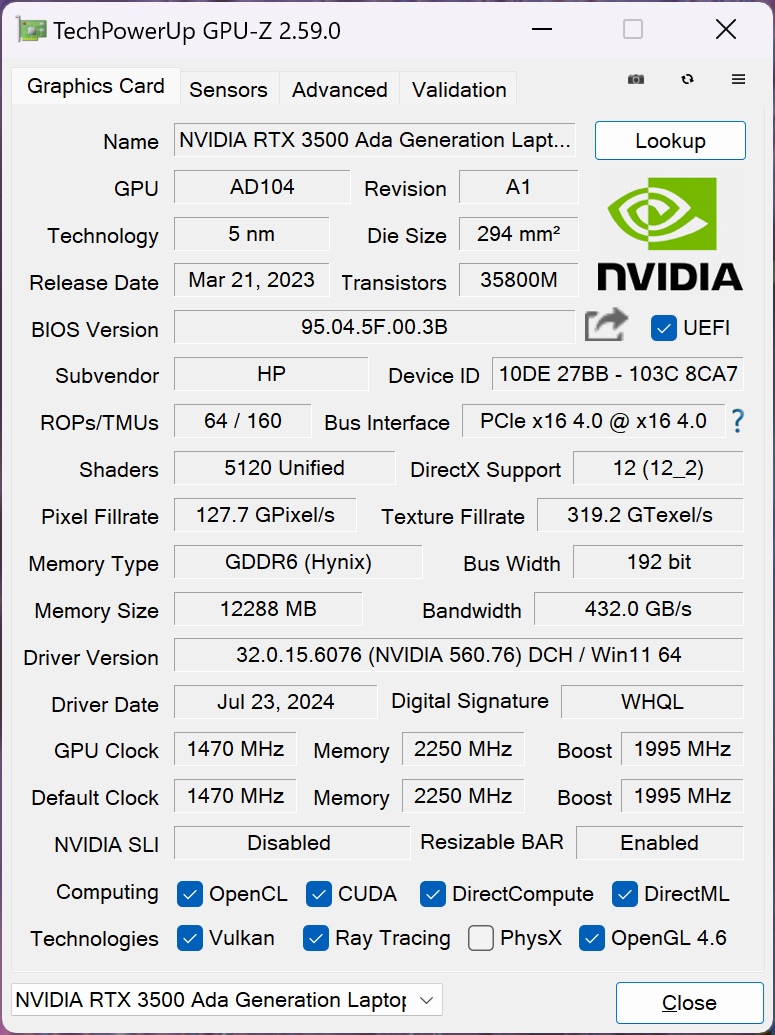
Prestaties - Hogere Turbo Boost Potentie
Testomstandigheden
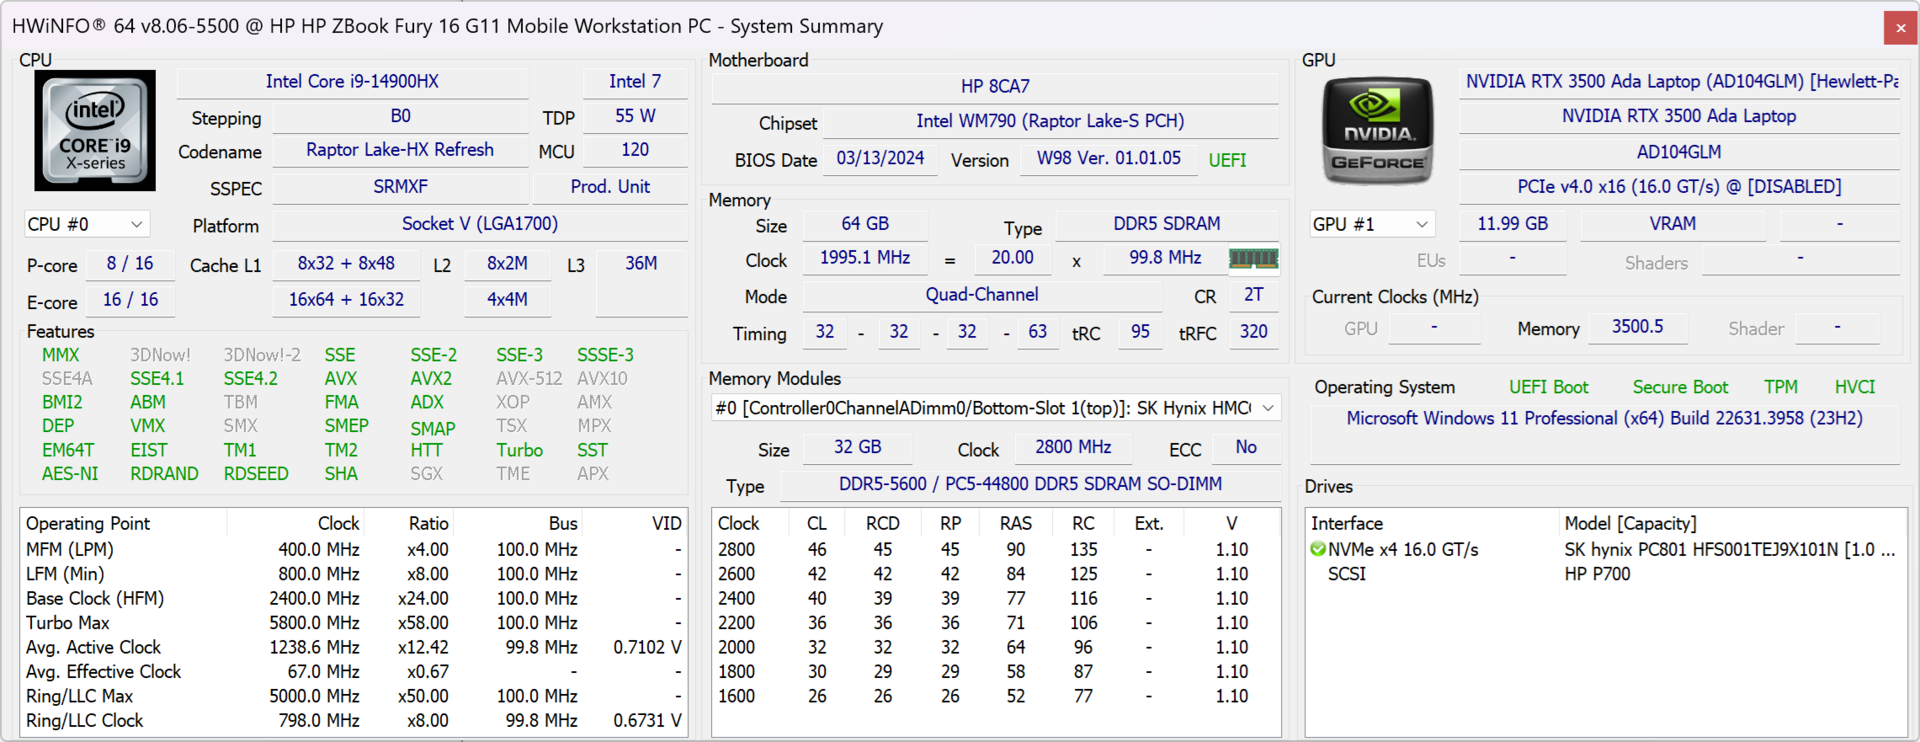
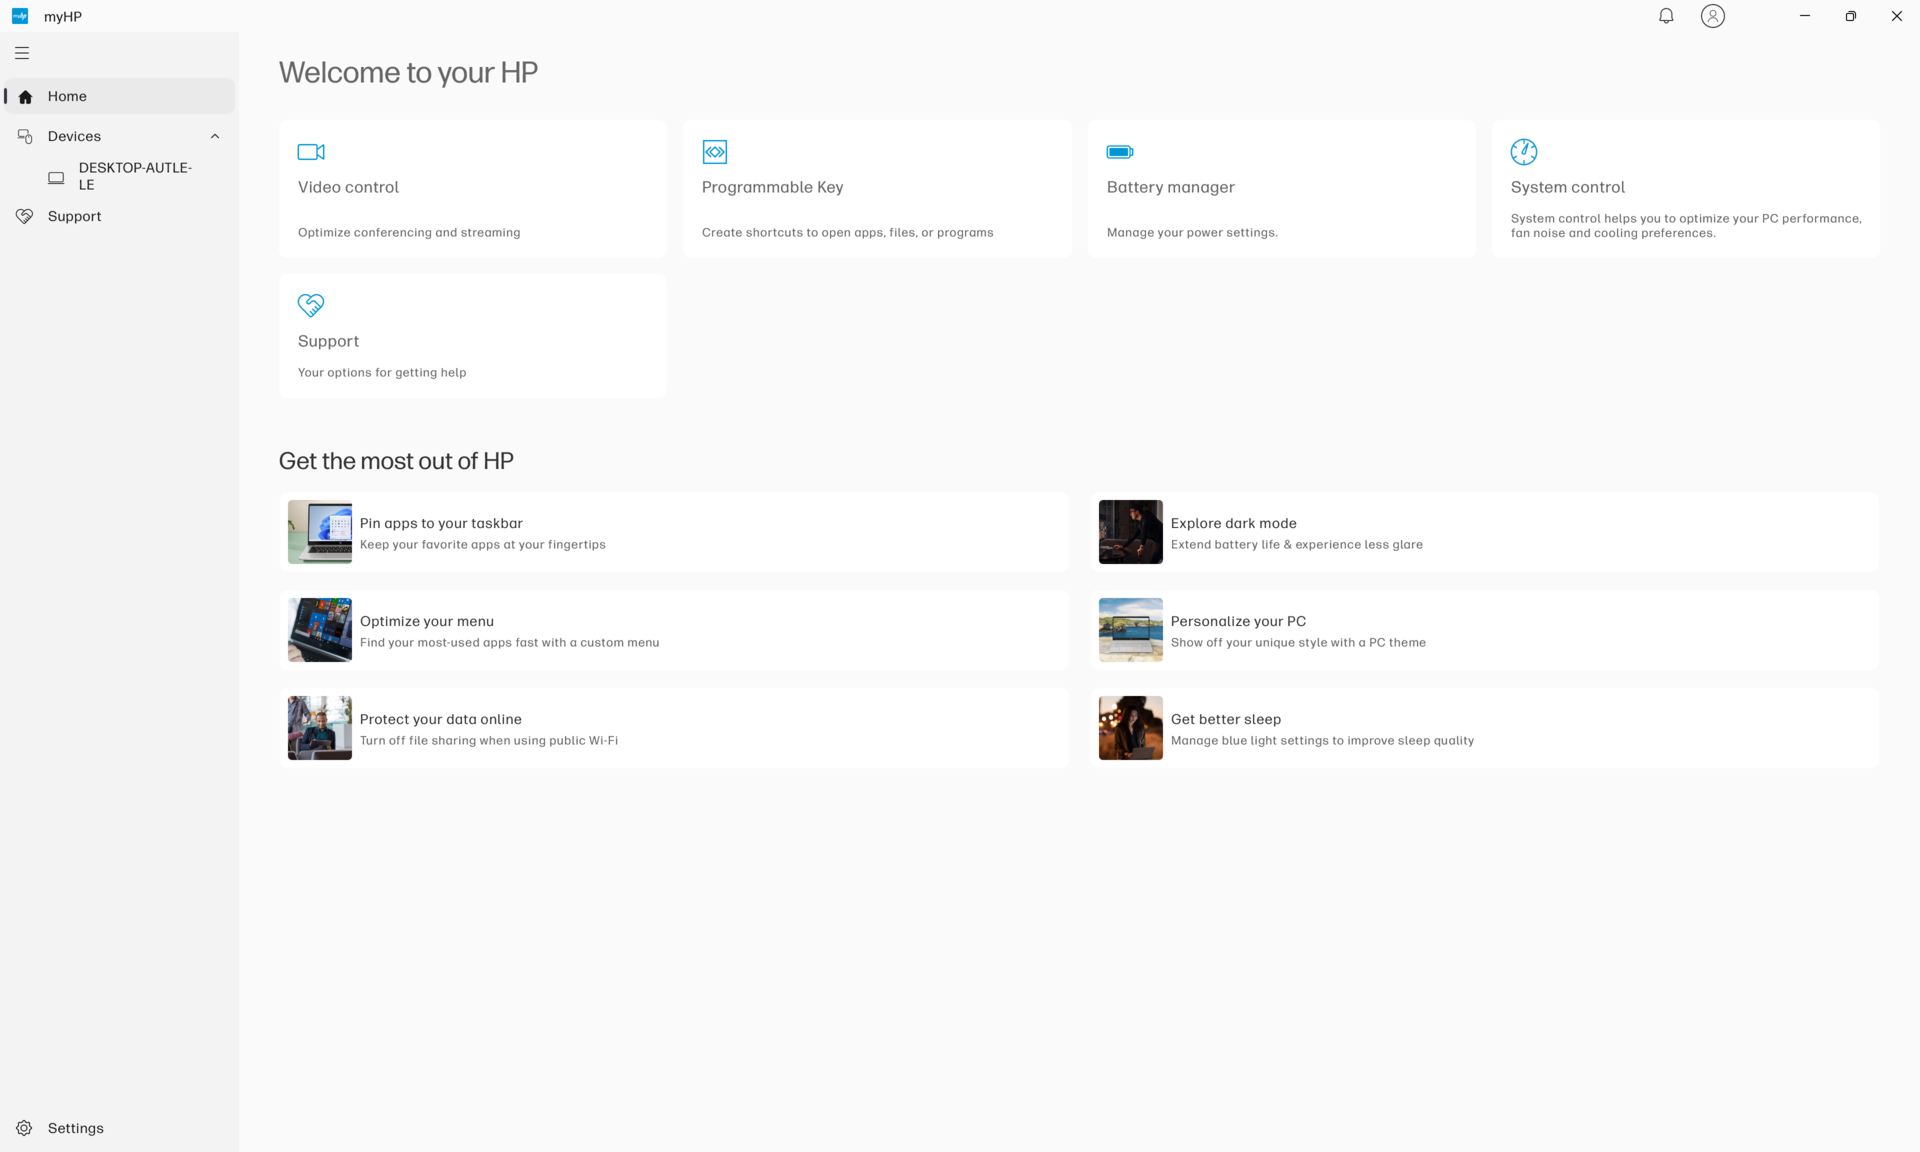
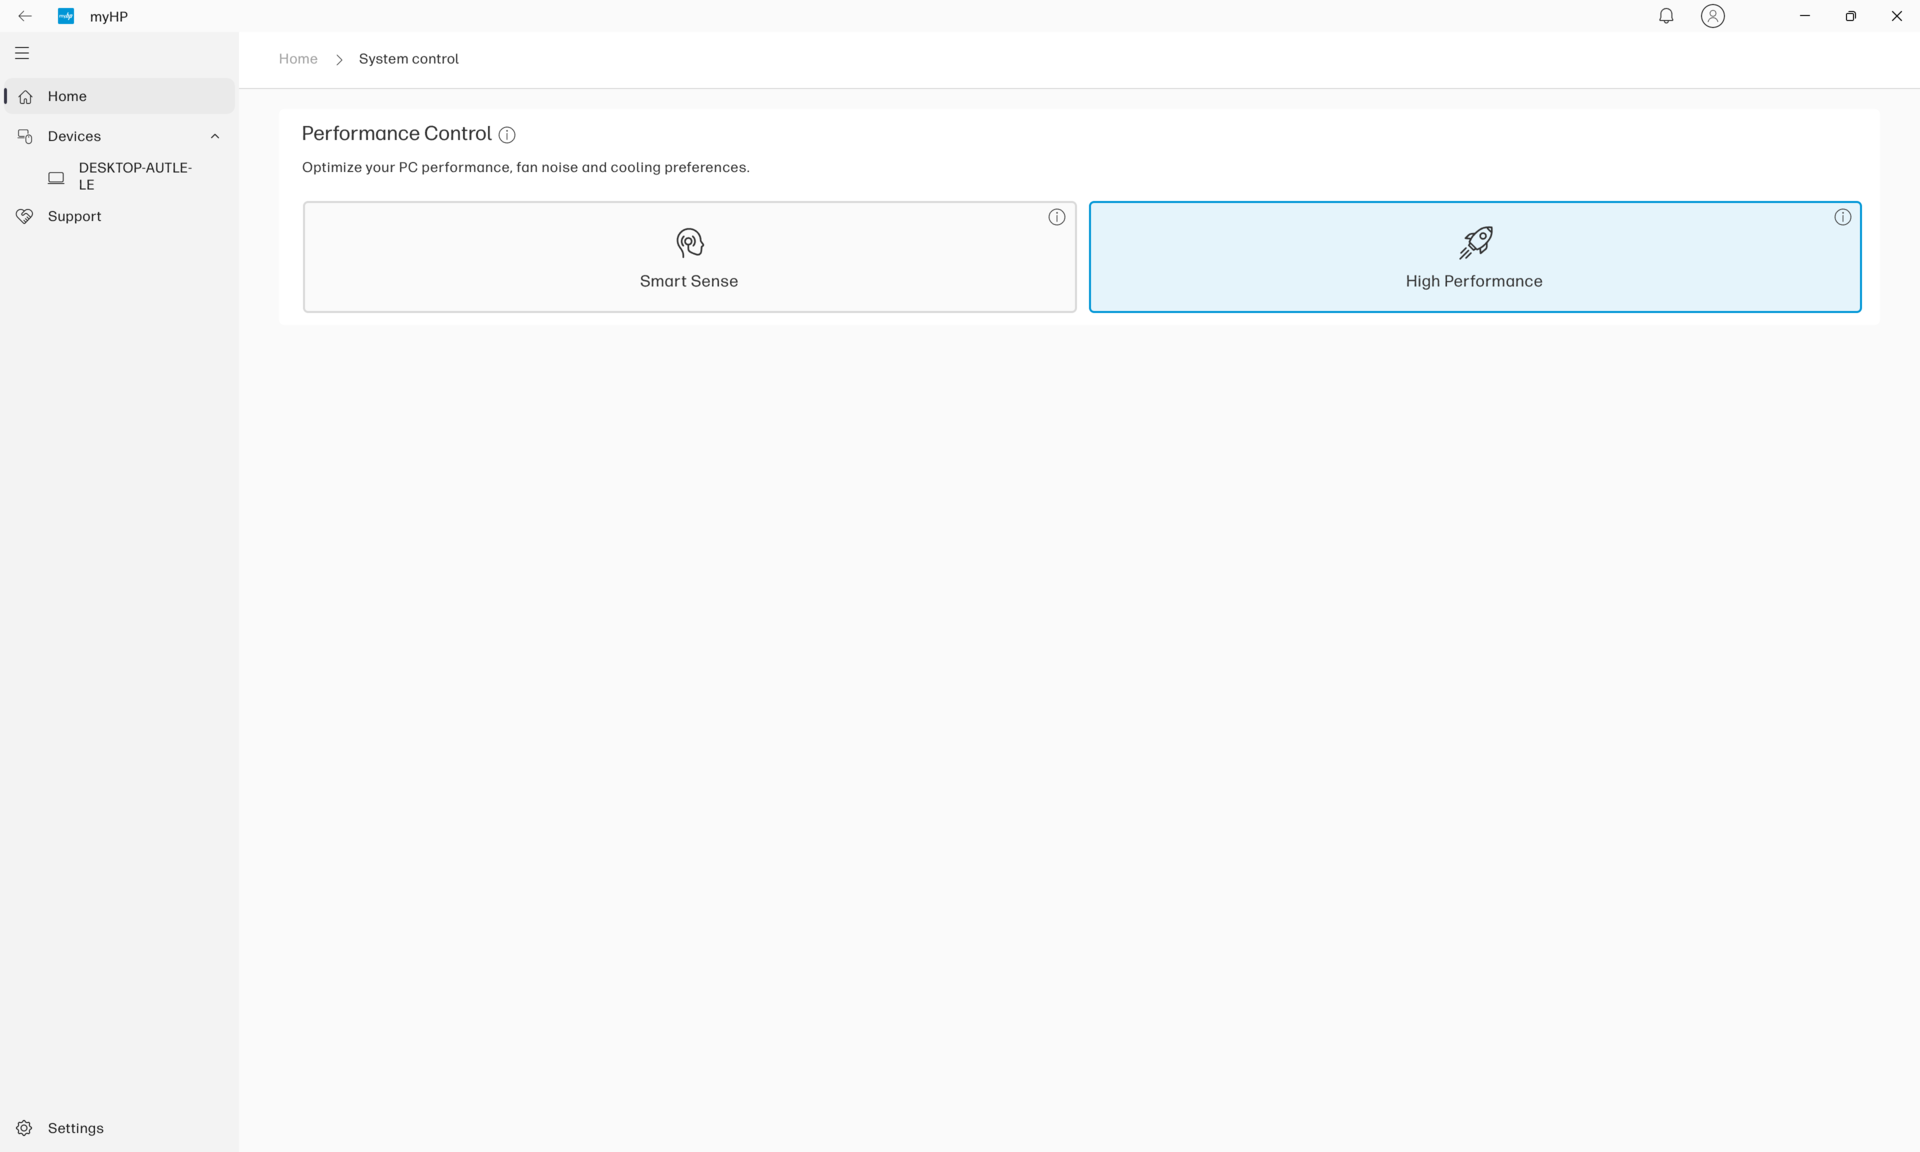
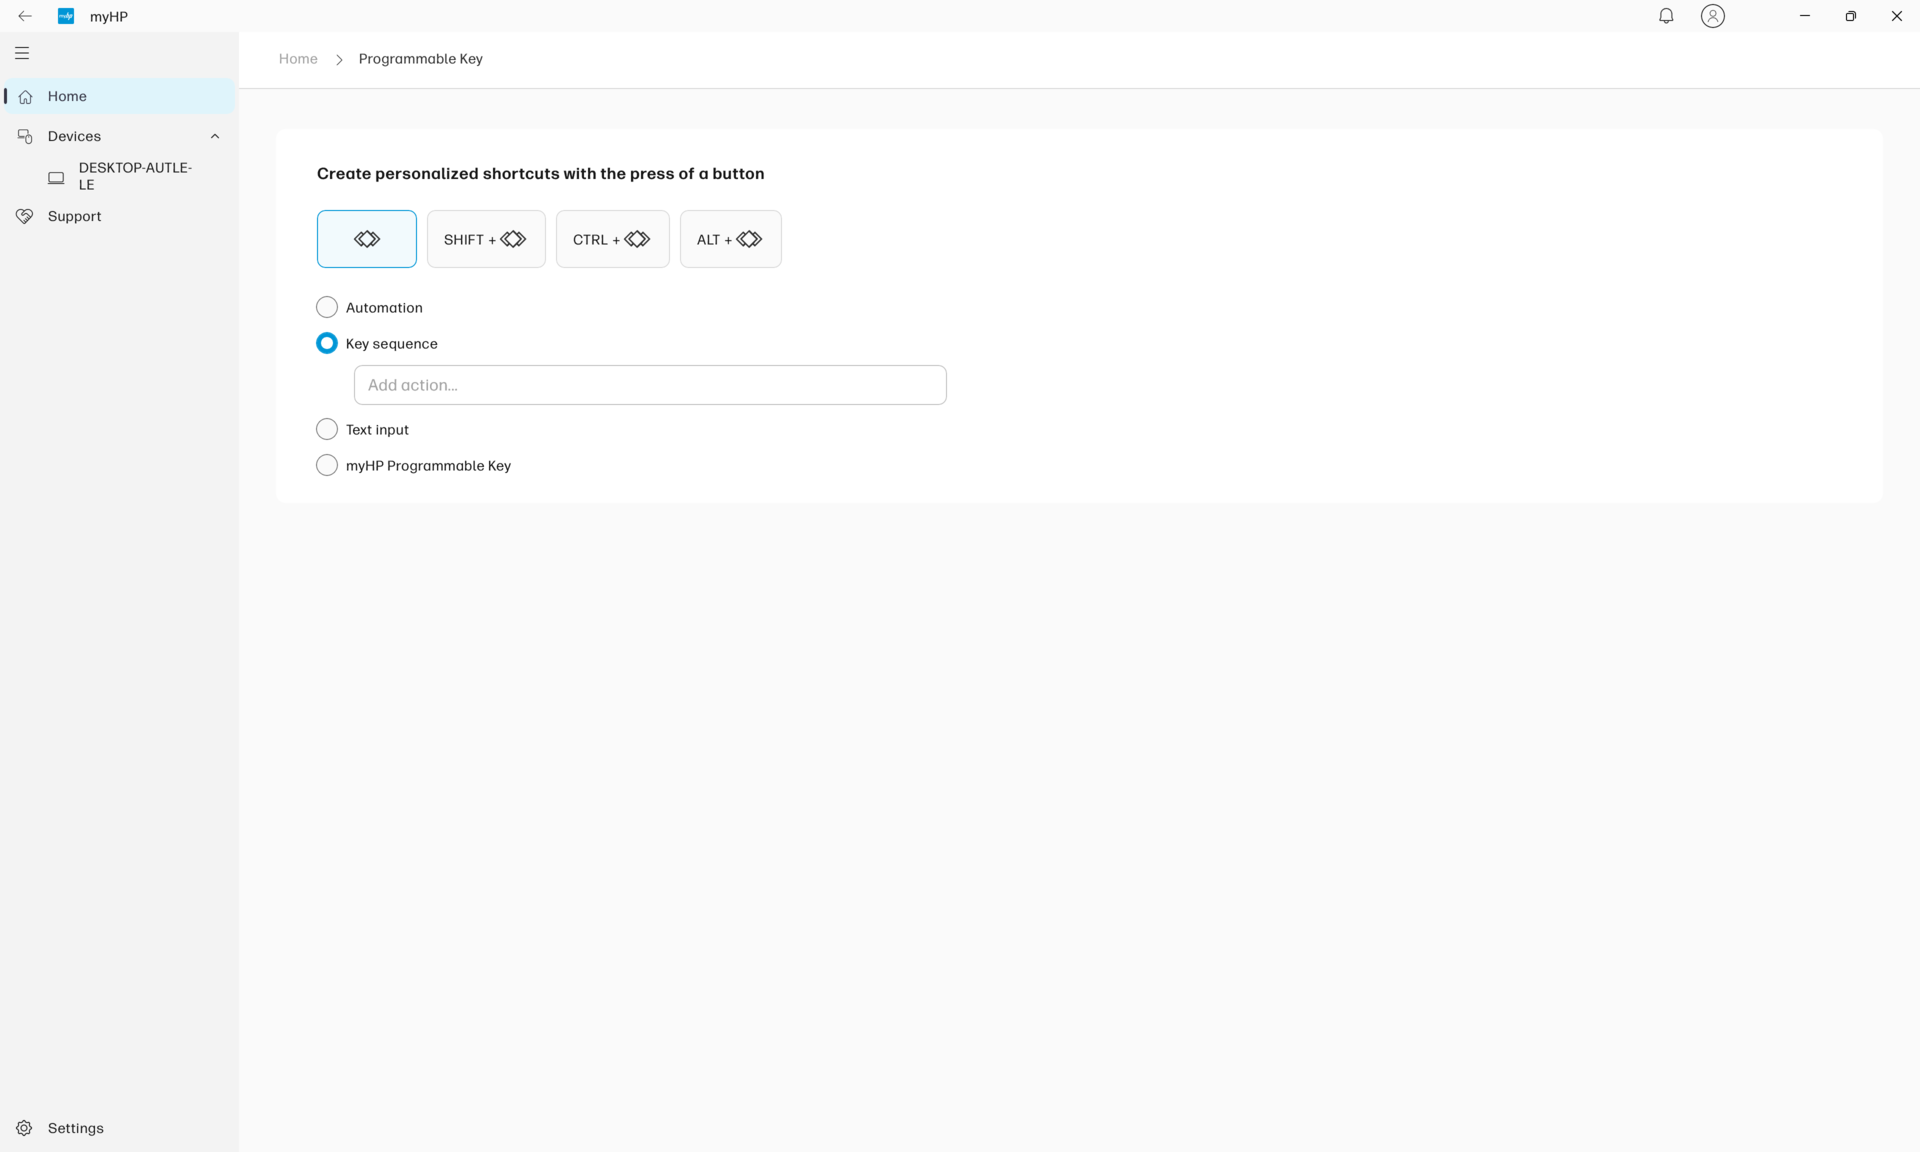
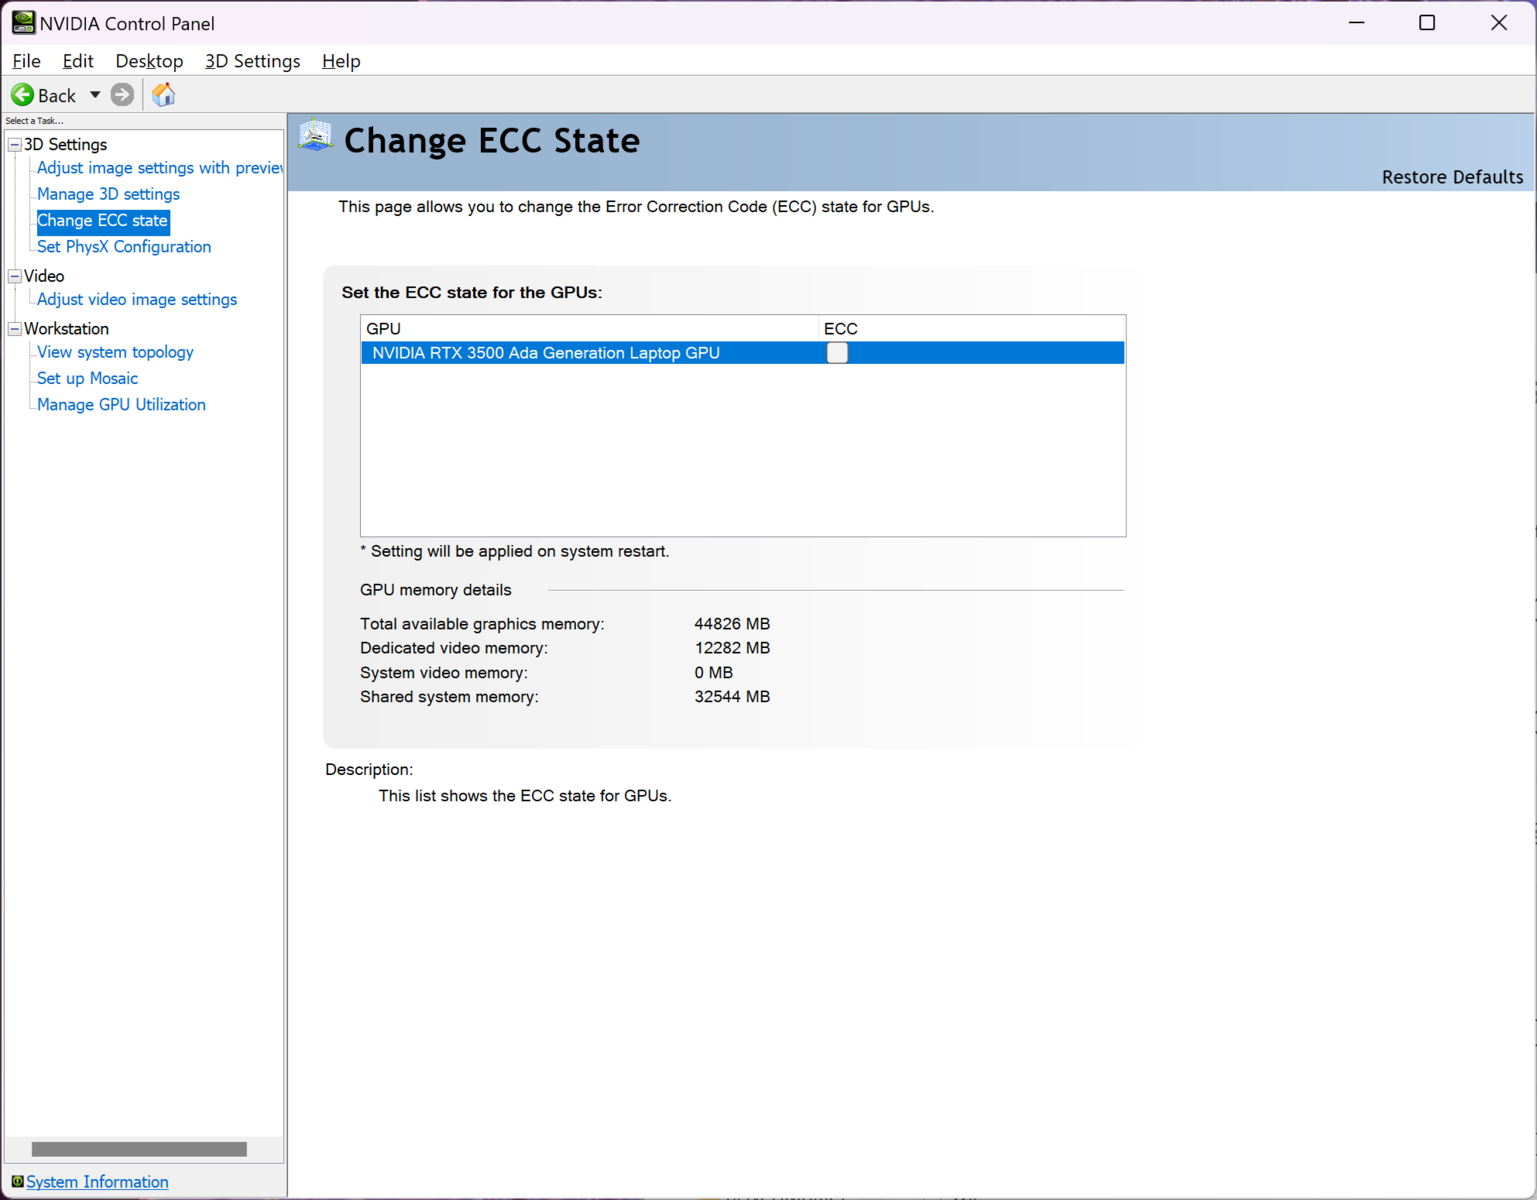
We hebben zowel Windows als MyHP in de modus Prestaties gezet voordat we de onderstaande benchmarks uitvoerden. We hebben ook de GPU ECC-modus uitgeschakeld via het Nvidia Configuratiescherm.
Processor
Van de Core i9-12950HX in de ZBook Fury 16 G9 naar de Core i9-13950HX in de ZBook Fury 16 G10 bracht aanzienlijke prestatiewinst met zich mee. Helaas kan hetzelfde niet gezegd worden van de Core i9-13950HX in de Fury 16 G10 naar de Core i9-14900HX in onze Fury 16 G11 configuratie. De winst is veel kleiner, ongeveer 10 tot 15 procent, voordat er rekening wordt gehouden met throttling. Als throttling eenmaal is meegerekend, zouden de algemene processorprestaties in wezen identiek zijn aan die van de Core i9-13950HX, zoals blijkt uit onze CineBench R15 xT loop testresultaten hieronder. De Core i9-14900HX maakt gebruik van dezelfde onderliggende architectuur als de Core i9-13950HX en kan dus worden beschouwd als een rebranding van de opties van vorig jaar. Het hogere Turbo Boost-plafond is dus het belangrijkste voordeel ten opzichte van de uitgaande processor, ook al zijn die hogere Turbo Boost-snelheden van korte duur.
De Lenovo Legion 9 16IRX9die wordt geleverd met dezelfde Core i9-14900HX als onze HP, zou tot 20 procent sneller zijn, waarschijnlijk dankzij de betere koeling om hogere Turbo Boost-kloksnelheden aan te kunnen.
Cinebench R15 Multi Loop
Cinebench R23: Multi Core | Single Core
Cinebench R20: CPU (Multi Core) | CPU (Single Core)
Cinebench R15: CPU Multi 64Bit | CPU Single 64Bit
Blender: v2.79 BMW27 CPU
7-Zip 18.03: 7z b 4 | 7z b 4 -mmt1
Geekbench 6.4: Multi-Core | Single-Core
Geekbench 5.5: Multi-Core | Single-Core
HWBOT x265 Benchmark v2.2: 4k Preset
LibreOffice : 20 Documents To PDF
R Benchmark 2.5: Overall mean
| Geekbench 6.4 / Multi-Core | |
| Gemiddeld Intel Core i9-14900HX (13158 - 19665, n=37) | |
| HP ZBook Fury 16 G10 | |
| HP ZBook Fury 16 G11 | |
| Dell Precision 5000 5680 | |
| Dell Precision 5690 | |
| Lenovo ThinkPad P1 G6 21FV001KUS | |
| Lenovo ThinkPad P1 G6-21FV000DGE | |
| Lenovo ThinkPad P16v G1 AMD | |
| Geekbench 6.4 / Single-Core | |
| Gemiddeld Intel Core i9-14900HX (2419 - 3129, n=37) | |
| HP ZBook Fury 16 G10 | |
| HP ZBook Fury 16 G11 | |
| Lenovo ThinkPad P1 G6 21FV001KUS | |
| Lenovo ThinkPad P1 G6-21FV000DGE | |
| Dell Precision 5000 5680 | |
| Lenovo ThinkPad P16v G1 AMD | |
| Dell Precision 5690 | |
Cinebench R23: Multi Core | Single Core
Cinebench R20: CPU (Multi Core) | CPU (Single Core)
Cinebench R15: CPU Multi 64Bit | CPU Single 64Bit
Blender: v2.79 BMW27 CPU
7-Zip 18.03: 7z b 4 | 7z b 4 -mmt1
Geekbench 6.4: Multi-Core | Single-Core
Geekbench 5.5: Multi-Core | Single-Core
HWBOT x265 Benchmark v2.2: 4k Preset
LibreOffice : 20 Documents To PDF
R Benchmark 2.5: Overall mean
* ... kleiner is beter
AIDA64: FP32 Ray-Trace | FPU Julia | CPU SHA3 | CPU Queen | FPU SinJulia | FPU Mandel | CPU AES | CPU ZLib | FP64 Ray-Trace | CPU PhotoWorxx
| Performance Rating | |
| Asus ProArt Studiobook 16 OLED H7604 | |
| Gemiddeld Intel Core i9-14900HX | |
| HP ZBook Fury 16 G10 | |
| HP ZBook Fury 16 G11 | |
| Dell Precision 5690 | |
| Lenovo ThinkPad P16 G2 21FA000FGE | |
| HP ZBook Fury 16 G9 | |
| Lenovo ThinkPad P1 G6 21FV001KUS | |
| AIDA64 / FP32 Ray-Trace | |
| Asus ProArt Studiobook 16 OLED H7604 | |
| Gemiddeld Intel Core i9-14900HX (13098 - 33474, n=36) | |
| HP ZBook Fury 16 G10 | |
| HP ZBook Fury 16 G11 | |
| Dell Precision 5690 | |
| Lenovo ThinkPad P16 G2 21FA000FGE | |
| HP ZBook Fury 16 G9 | |
| Lenovo ThinkPad P1 G6 21FV001KUS | |
| AIDA64 / FPU Julia | |
| Asus ProArt Studiobook 16 OLED H7604 | |
| Gemiddeld Intel Core i9-14900HX (67573 - 166040, n=36) | |
| HP ZBook Fury 16 G10 | |
| HP ZBook Fury 16 G11 | |
| HP ZBook Fury 16 G9 | |
| Dell Precision 5690 | |
| Lenovo ThinkPad P16 G2 21FA000FGE | |
| Lenovo ThinkPad P1 G6 21FV001KUS | |
| AIDA64 / CPU SHA3 | |
| Asus ProArt Studiobook 16 OLED H7604 | |
| Gemiddeld Intel Core i9-14900HX (3589 - 7979, n=36) | |
| HP ZBook Fury 16 G10 | |
| HP ZBook Fury 16 G11 | |
| Dell Precision 5690 | |
| Lenovo ThinkPad P16 G2 21FA000FGE | |
| HP ZBook Fury 16 G9 | |
| Lenovo ThinkPad P1 G6 21FV001KUS | |
| AIDA64 / CPU Queen | |
| Gemiddeld Intel Core i9-14900HX (118405 - 148966, n=36) | |
| HP ZBook Fury 16 G11 | |
| Asus ProArt Studiobook 16 OLED H7604 | |
| HP ZBook Fury 16 G10 | |
| Lenovo ThinkPad P1 G6 21FV001KUS | |
| Lenovo ThinkPad P16 G2 21FA000FGE | |
| HP ZBook Fury 16 G9 | |
| Dell Precision 5690 | |
| AIDA64 / FPU SinJulia | |
| Asus ProArt Studiobook 16 OLED H7604 | |
| Gemiddeld Intel Core i9-14900HX (10475 - 18517, n=36) | |
| HP ZBook Fury 16 G11 | |
| HP ZBook Fury 16 G10 | |
| Lenovo ThinkPad P16 G2 21FA000FGE | |
| HP ZBook Fury 16 G9 | |
| Dell Precision 5690 | |
| Lenovo ThinkPad P1 G6 21FV001KUS | |
| AIDA64 / FPU Mandel | |
| Asus ProArt Studiobook 16 OLED H7604 | |
| Gemiddeld Intel Core i9-14900HX (32543 - 83662, n=36) | |
| HP ZBook Fury 16 G10 | |
| HP ZBook Fury 16 G11 | |
| Dell Precision 5690 | |
| HP ZBook Fury 16 G9 | |
| Lenovo ThinkPad P16 G2 21FA000FGE | |
| Lenovo ThinkPad P1 G6 21FV001KUS | |
| AIDA64 / CPU AES | |
| Gemiddeld Intel Core i9-14900HX (86964 - 241777, n=36) | |
| Asus ProArt Studiobook 16 OLED H7604 | |
| HP ZBook Fury 16 G10 | |
| HP ZBook Fury 16 G11 | |
| HP ZBook Fury 16 G9 | |
| Dell Precision 5690 | |
| Lenovo ThinkPad P16 G2 21FA000FGE | |
| Lenovo ThinkPad P1 G6 21FV001KUS | |
| AIDA64 / CPU ZLib | |
| Asus ProArt Studiobook 16 OLED H7604 | |
| Gemiddeld Intel Core i9-14900HX (1054 - 2292, n=36) | |
| HP ZBook Fury 16 G11 | |
| HP ZBook Fury 16 G10 | |
| Dell Precision 5690 | |
| HP ZBook Fury 16 G9 | |
| Lenovo ThinkPad P1 G6 21FV001KUS | |
| Lenovo ThinkPad P16 G2 21FA000FGE | |
| AIDA64 / FP64 Ray-Trace | |
| Asus ProArt Studiobook 16 OLED H7604 | |
| Gemiddeld Intel Core i9-14900HX (6809 - 18349, n=36) | |
| HP ZBook Fury 16 G10 | |
| HP ZBook Fury 16 G11 | |
| Lenovo ThinkPad P16 G2 21FA000FGE | |
| Dell Precision 5690 | |
| Lenovo ThinkPad P1 G6 21FV001KUS | |
| HP ZBook Fury 16 G9 | |
| AIDA64 / CPU PhotoWorxx | |
| Dell Precision 5690 | |
| Asus ProArt Studiobook 16 OLED H7604 | |
| Gemiddeld Intel Core i9-14900HX (23903 - 54702, n=36) | |
| HP ZBook Fury 16 G10 | |
| HP ZBook Fury 16 G9 | |
| HP ZBook Fury 16 G11 | |
| Lenovo ThinkPad P16 G2 21FA000FGE | |
| Lenovo ThinkPad P1 G6 21FV001KUS | |
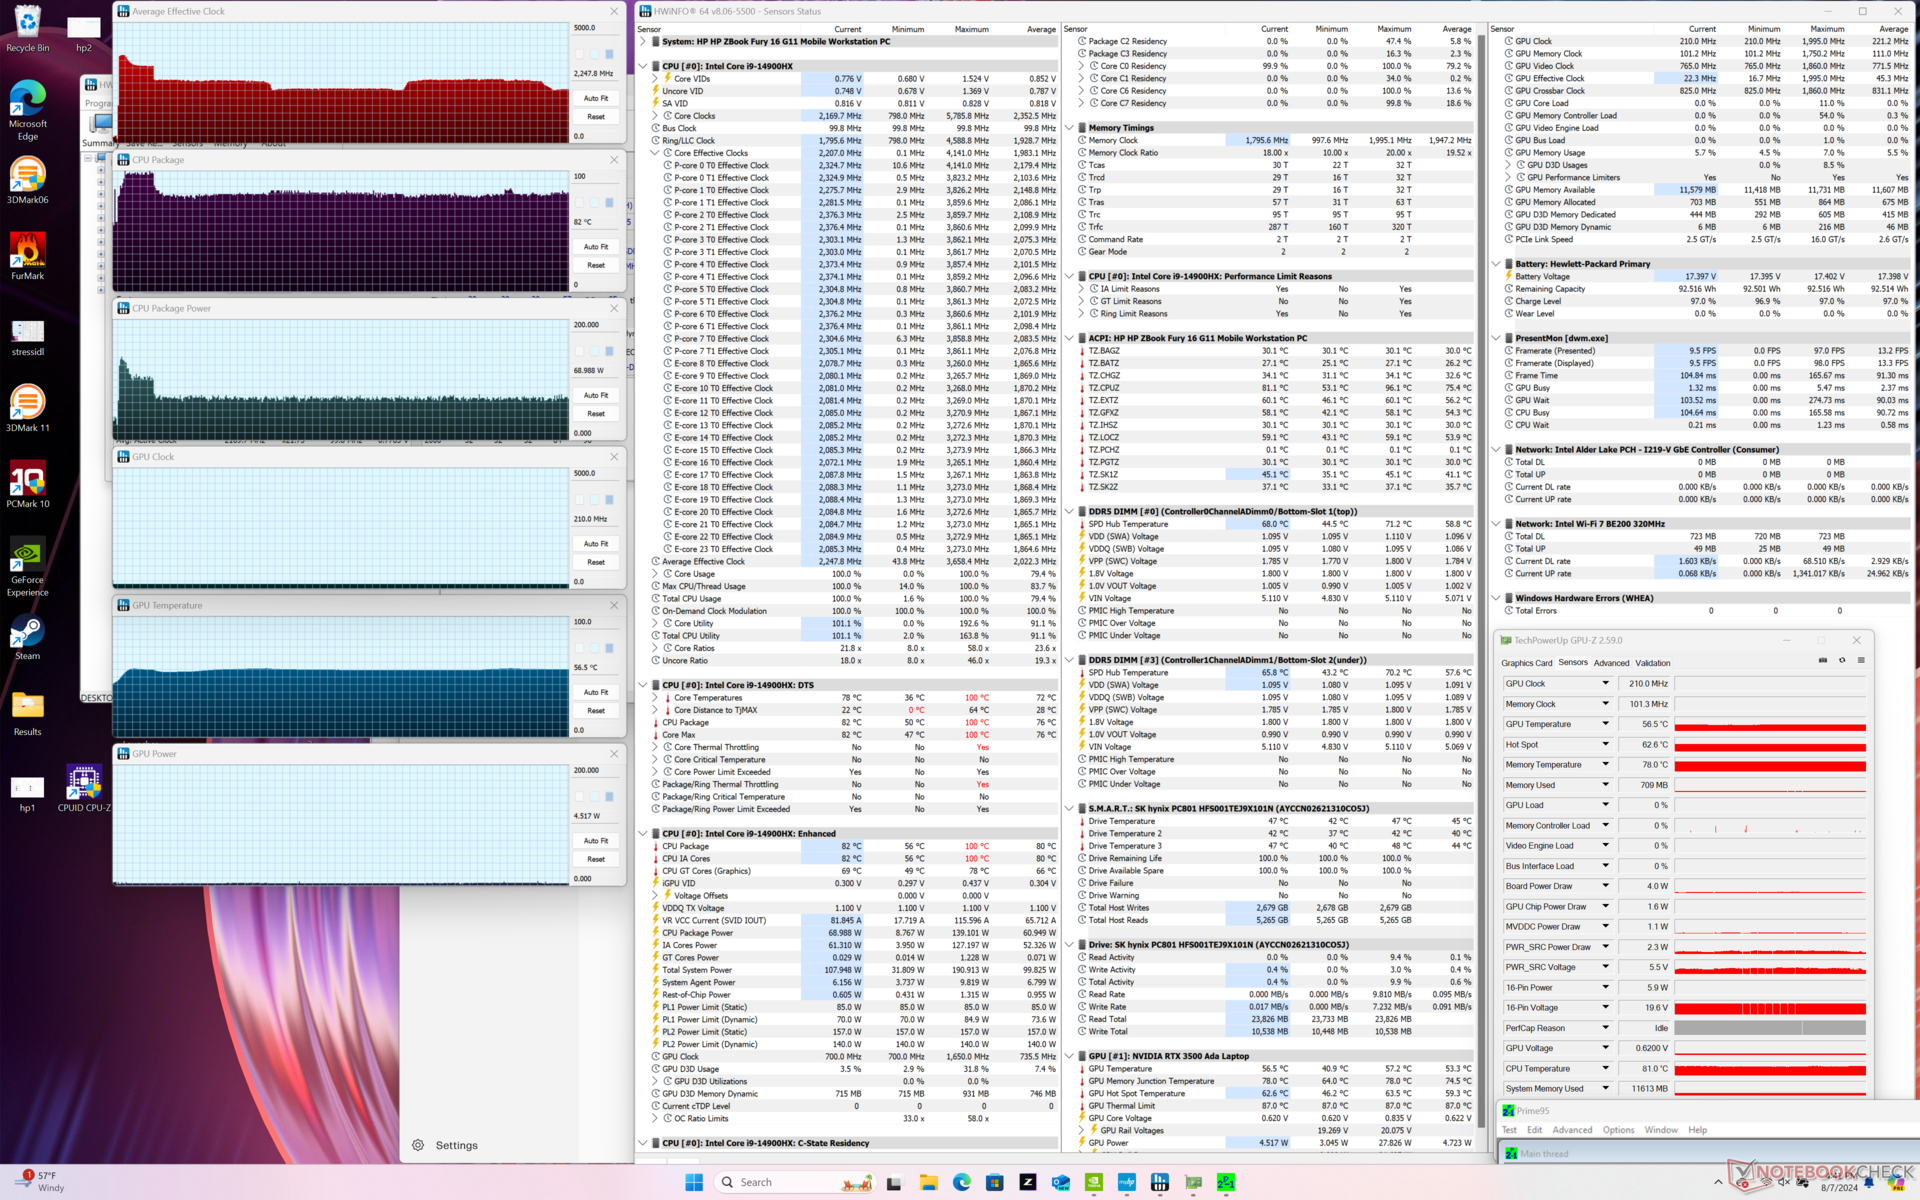
Stresstest
Toen Prime95 werd uitgevoerd om de CPU te belasten, piekten de kernkloksnelheden en het opgenomen vermogen van het pakket naar respectievelijk 3,7 GHz en 139 W, wat hooguit een minuut duurde, terwijl de kerntemperatuur ook naar 99 C steeg. De CPU bleef uiteindelijk steken op 2,3 GHz en 69 W om een beter beheersbare kerntemperatuur van 82 C te handhaven. De relatief sterke daling van de prestaties in de loop van de tijd leidt tot de geleidelijk lagere CineBench R15 xT loop scores die hierboven zijn vermeld.
De CPU- en GPU-temperaturen bij hogere belastingen, zoals games, stabiliseren zich ondanks de prestatieverschillen op bijna dezelfde waarden als wat we vorig jaar op de ZBook Fury 16 G10 vaststelden.
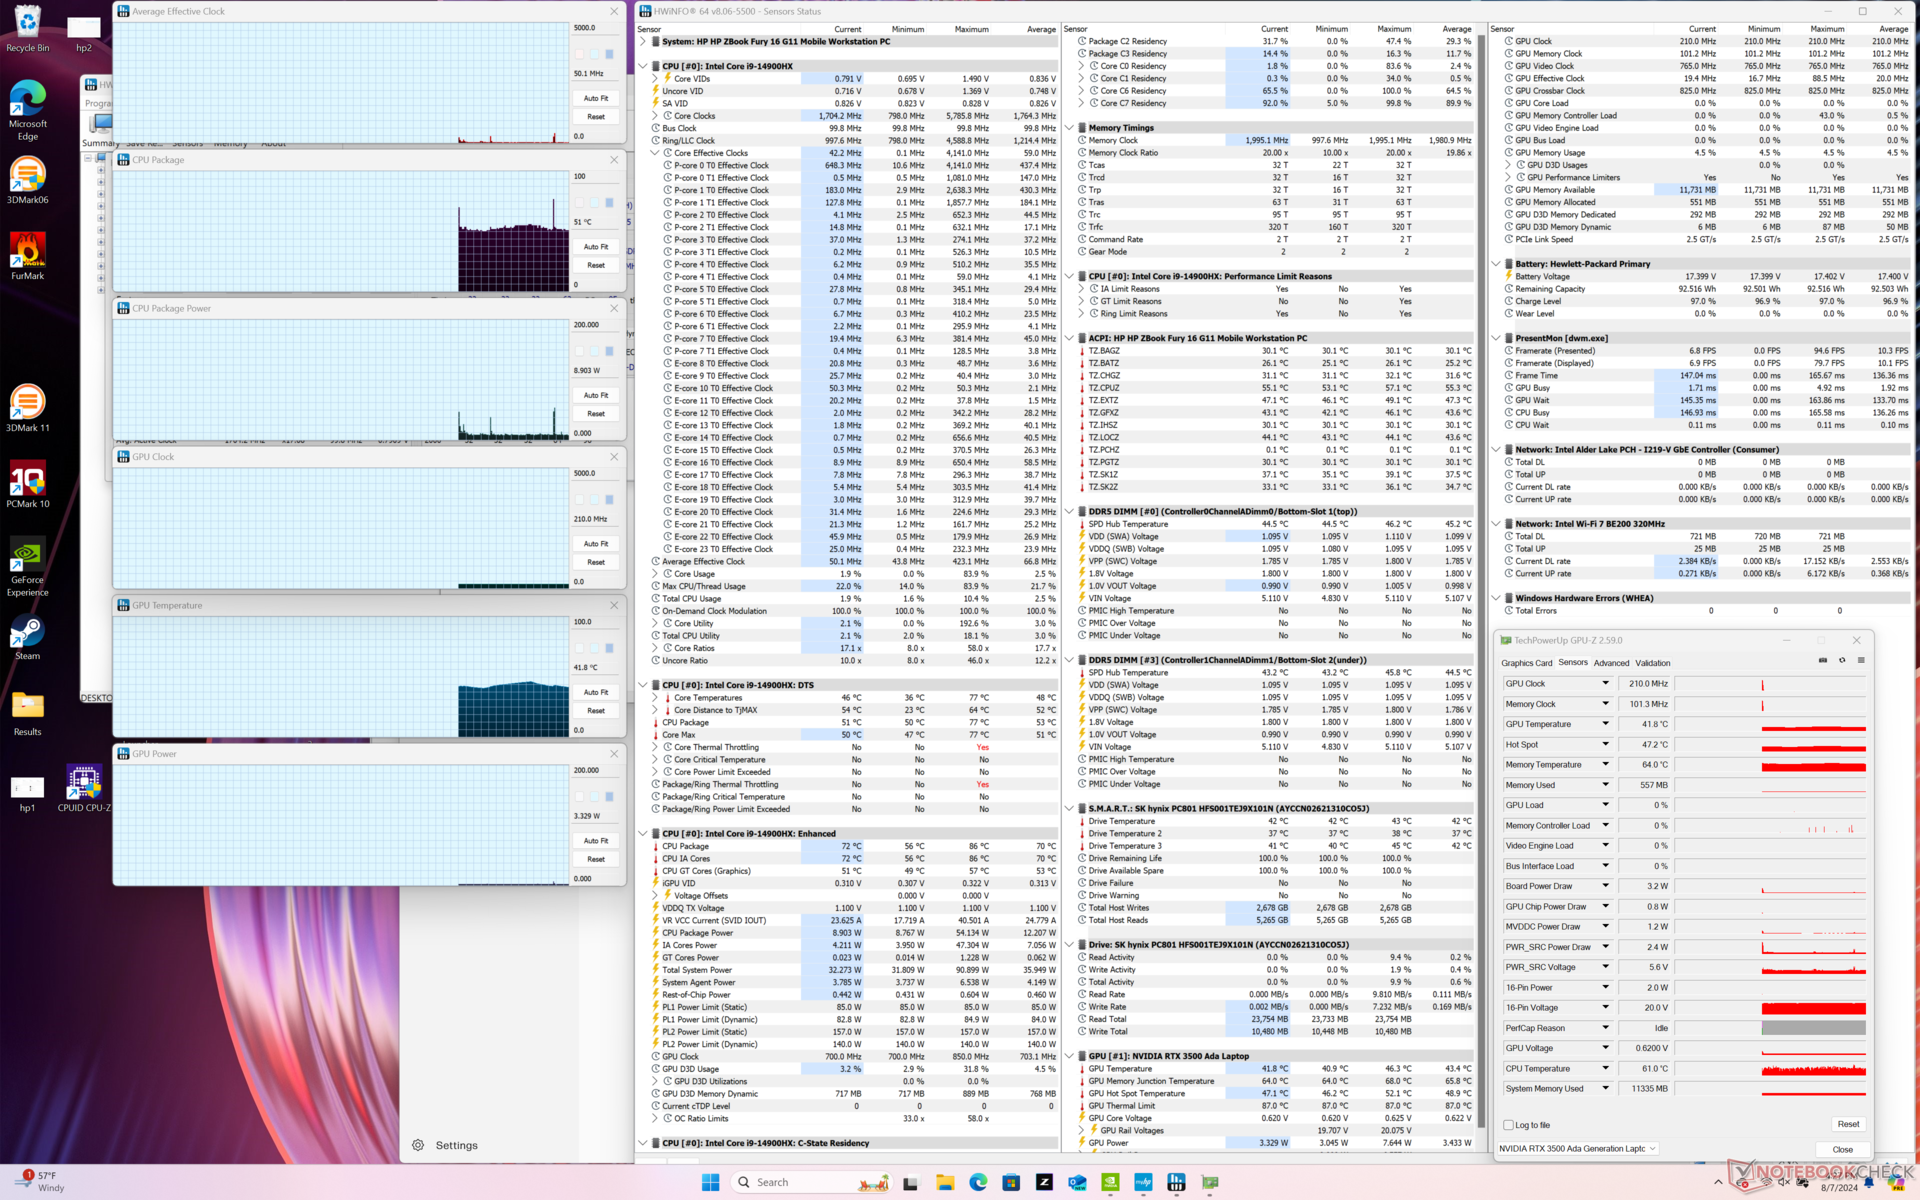
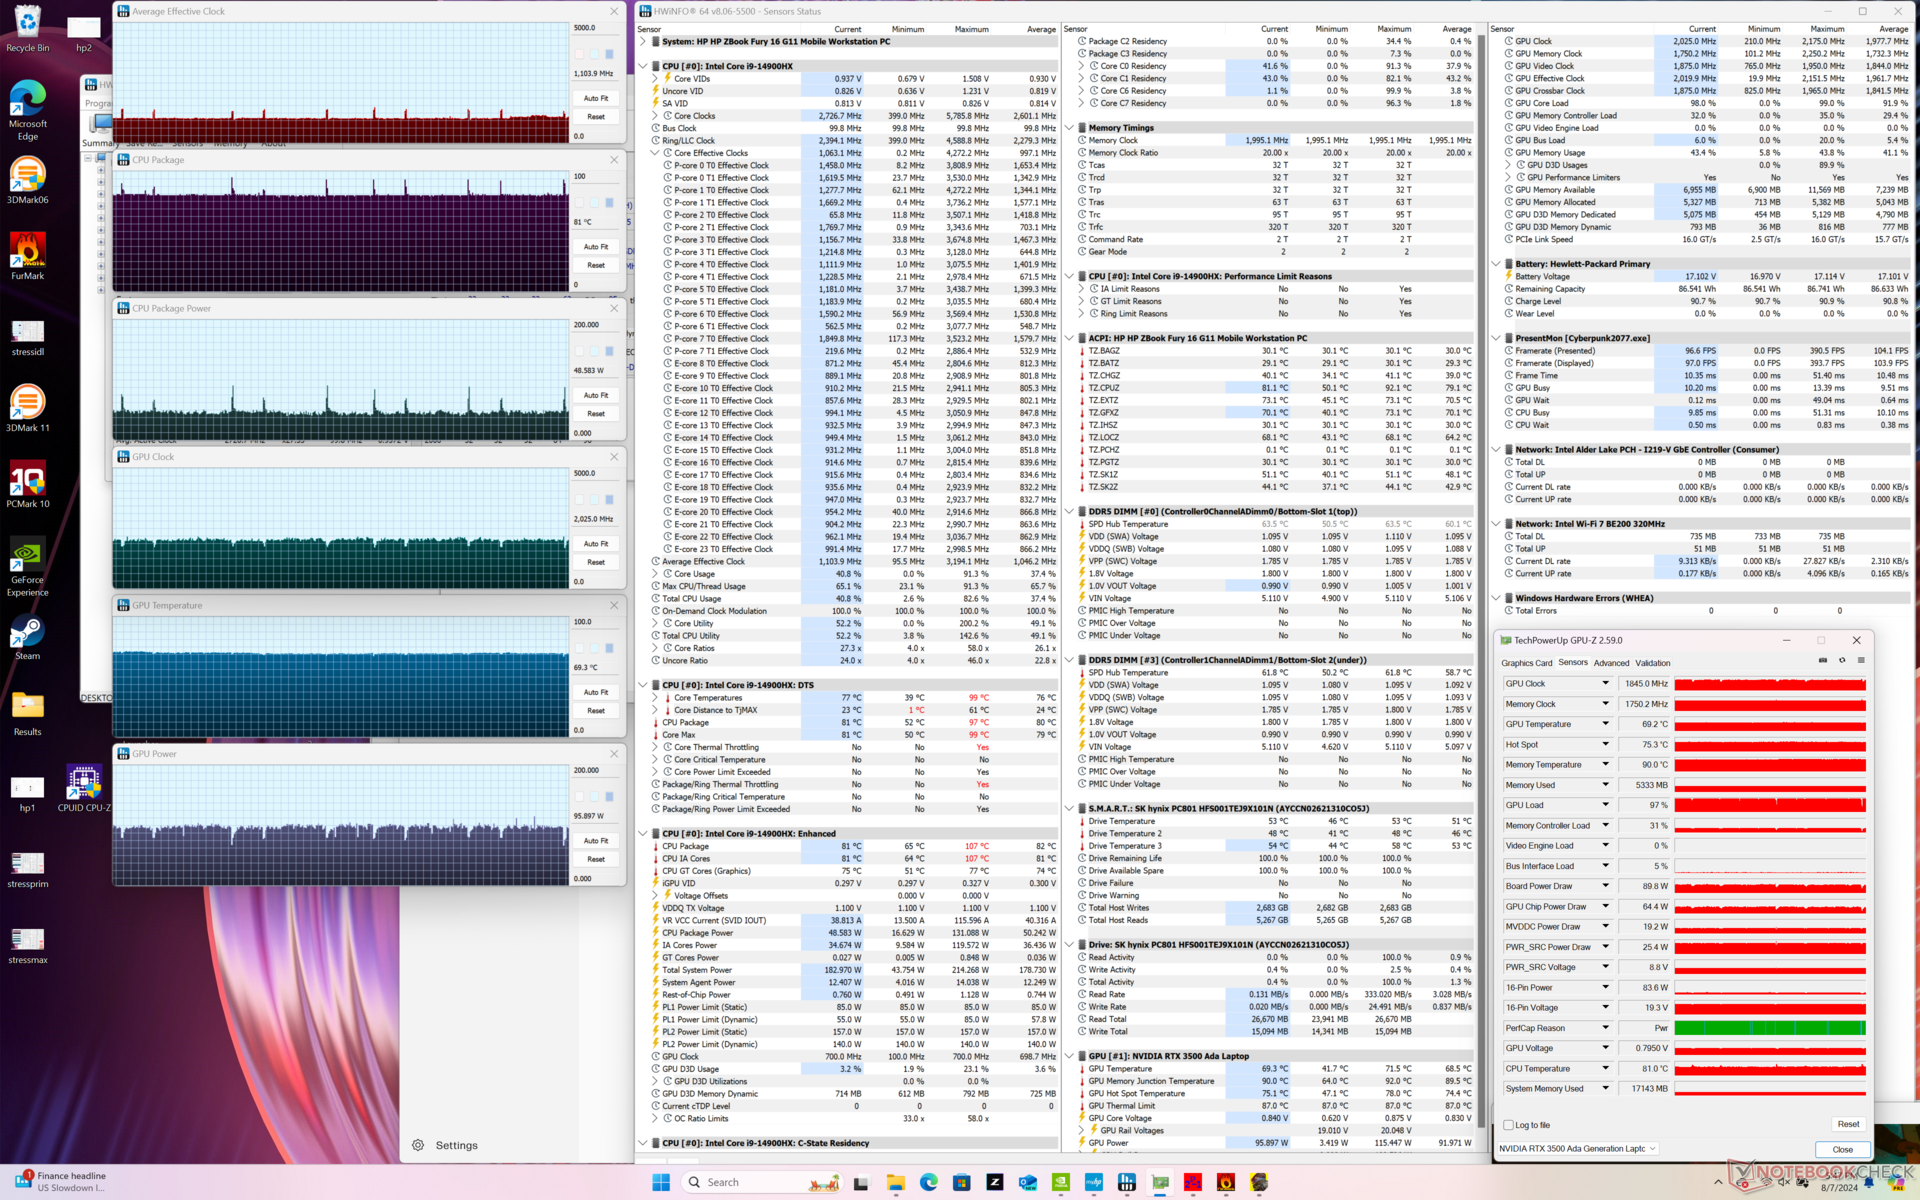
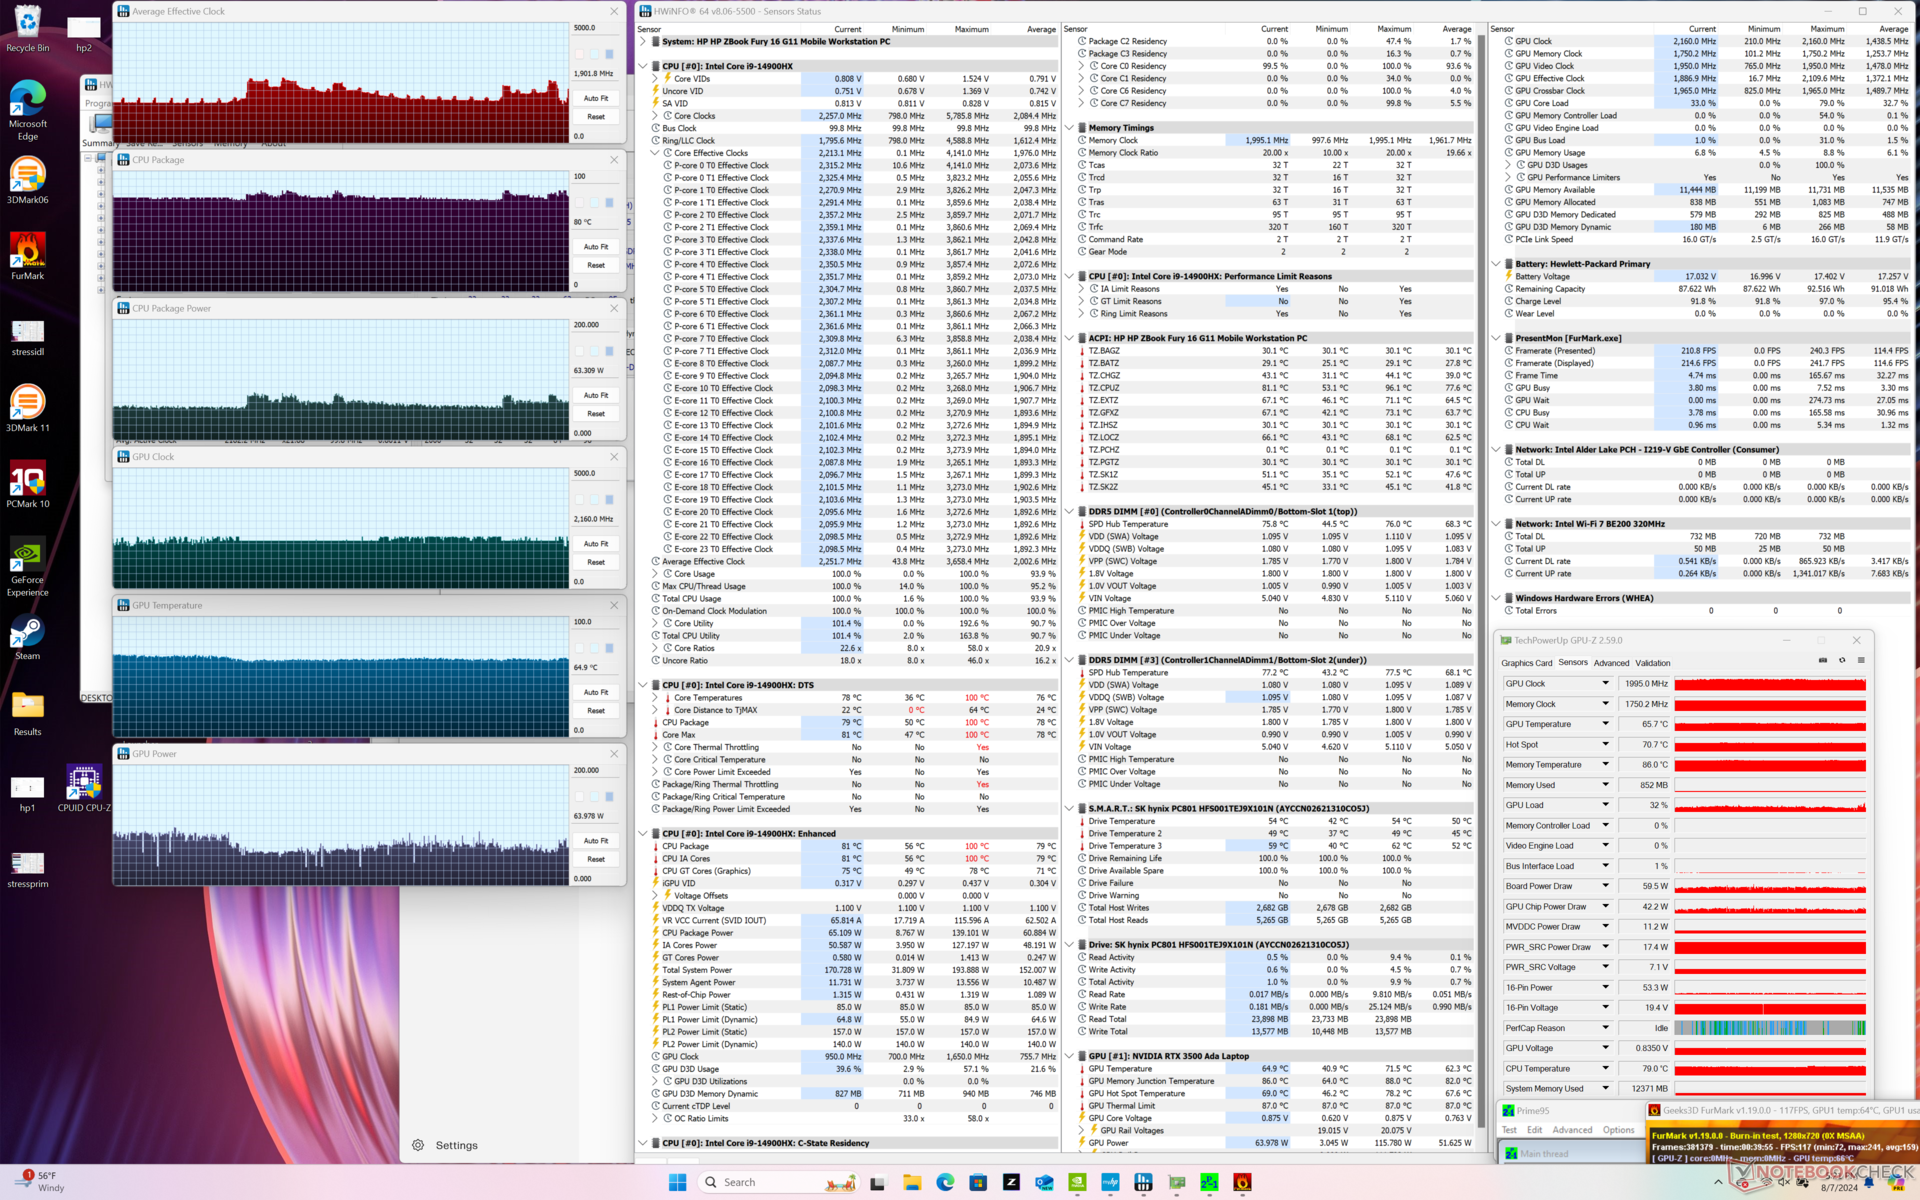
| Gemiddelde CPU-klok (GHz) | GPU-klok (MHz) | Gemiddelde CPU-temperatuur (°C) | Gemiddelde GPU-temperatuur (°C) | |
| Systeem inactief | -- | -- | 51 | 42 |
| Prime95 Stress | 2.2 - 2.6 | -- | 82 | 57 |
| Prime95 + FurMark Stress | 1.8 | 1995 | 81 | 65 |
| Cyberpunk 2077 Stress | 1.1 | 1845 | 81 | 69 |
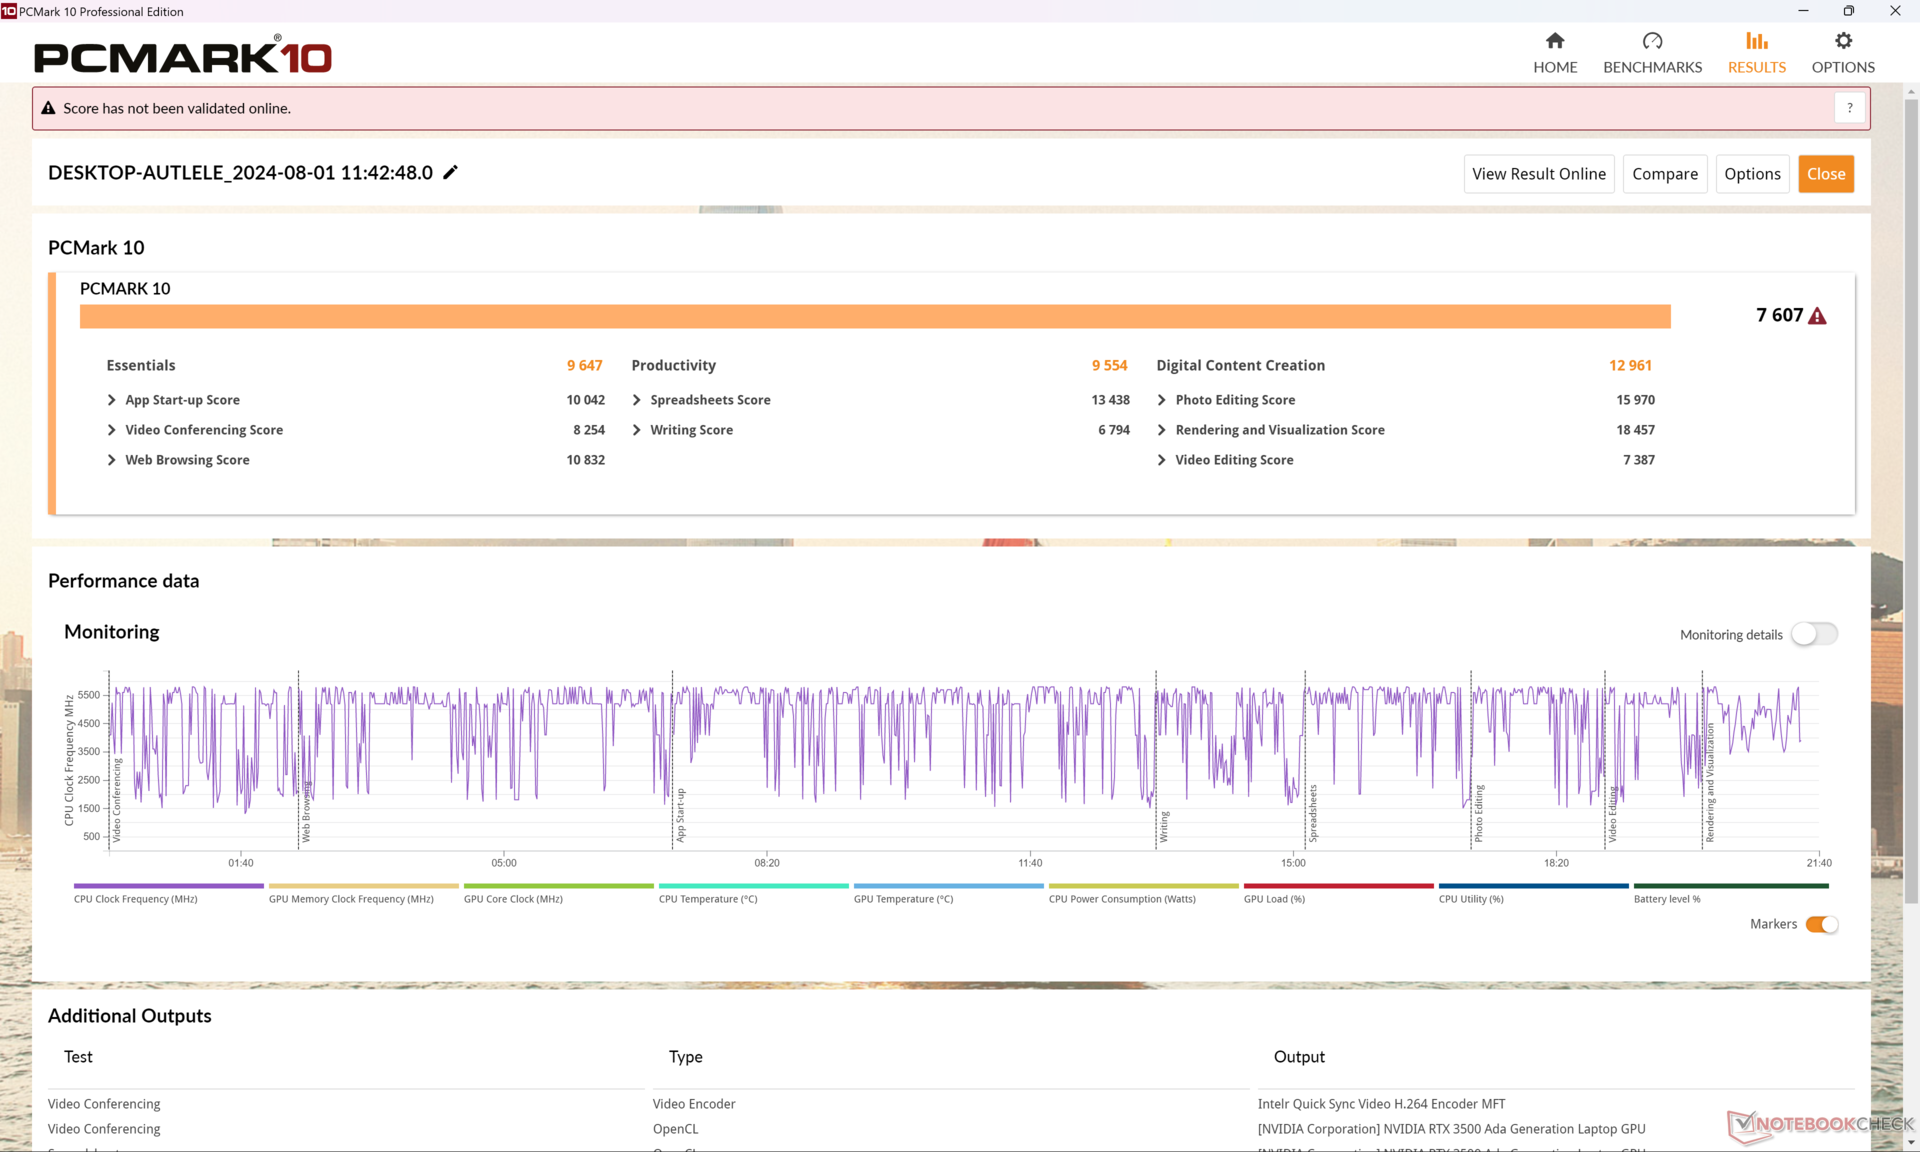
Systeemprestaties
De resultaten van PCMark zijn vergelijkbaar met die van de ZBook Fury 16 G10 van vorig jaar en suggereren dat de ZBook Fury 16 G11 de meeste dagelijkse taken niet sneller uitvoert dan zijn voorganger.
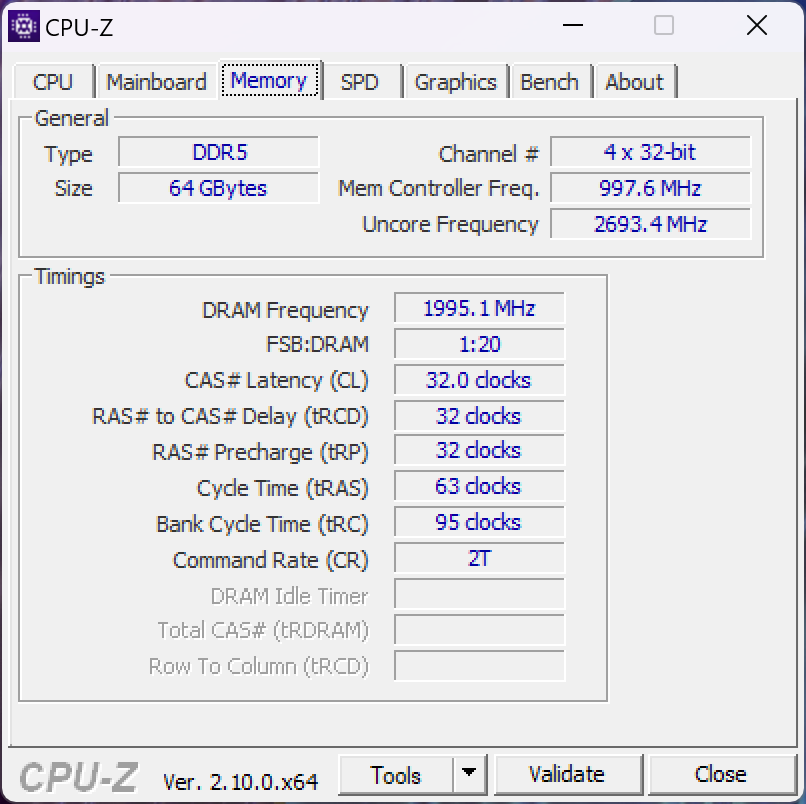
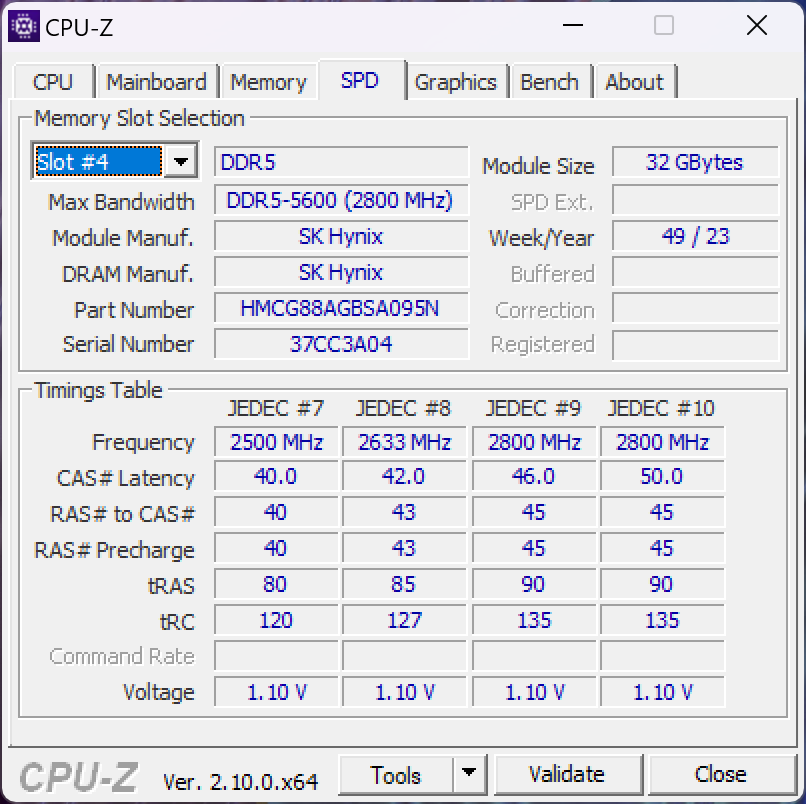
Houd er rekening mee dat de maximale RAM-snelheid beperkt is tot slechts 4000 MT/s indien geconfigureerd met 128 GB geheugen vanwege de beperkingen van de SODIMM-standaard. Het model ondersteunt zowel ECC RAM als niet-ECC RAM.
CrossMark: Overall | Productivity | Creativity | Responsiveness
WebXPRT 3: Overall
WebXPRT 4: Overall
Mozilla Kraken 1.1: Total
| PCMark 10 / Score | |
| HP ZBook Fury 16 G10 | |
| Dell Precision 5690 | |
| Lenovo ThinkPad P1 G6 21FV001KUS | |
| HP ZBook Fury 16 G11 | |
| Gemiddeld Intel Core i9-14900HX, NVIDIA RTX 3500 Ada Generation Laptop GPU (n=1) | |
| Asus ProArt Studiobook 16 OLED H7604 | |
| Lenovo ThinkPad P16 G2 21FA000FGE | |
| HP ZBook Fury 16 G9 | |
| PCMark 10 / Essentials | |
| Lenovo ThinkPad P1 G6 21FV001KUS | |
| HP ZBook Fury 16 G10 | |
| Dell Precision 5690 | |
| Lenovo ThinkPad P16 G2 21FA000FGE | |
| HP ZBook Fury 16 G9 | |
| Asus ProArt Studiobook 16 OLED H7604 | |
| HP ZBook Fury 16 G11 | |
| Gemiddeld Intel Core i9-14900HX, NVIDIA RTX 3500 Ada Generation Laptop GPU (n=1) | |
| PCMark 10 / Productivity | |
| Dell Precision 5690 | |
| Lenovo ThinkPad P1 G6 21FV001KUS | |
| Asus ProArt Studiobook 16 OLED H7604 | |
| HP ZBook Fury 16 G11 | |
| Gemiddeld Intel Core i9-14900HX, NVIDIA RTX 3500 Ada Generation Laptop GPU (n=1) | |
| Lenovo ThinkPad P16 G2 21FA000FGE | |
| HP ZBook Fury 16 G10 | |
| HP ZBook Fury 16 G9 | |
| PCMark 10 / Digital Content Creation | |
| HP ZBook Fury 16 G10 | |
| HP ZBook Fury 16 G11 | |
| Gemiddeld Intel Core i9-14900HX, NVIDIA RTX 3500 Ada Generation Laptop GPU (n=1) | |
| Lenovo ThinkPad P1 G6 21FV001KUS | |
| Dell Precision 5690 | |
| Asus ProArt Studiobook 16 OLED H7604 | |
| Lenovo ThinkPad P16 G2 21FA000FGE | |
| HP ZBook Fury 16 G9 | |
| CrossMark / Overall | |
| Asus ProArt Studiobook 16 OLED H7604 | |
| HP ZBook Fury 16 G11 | |
| Gemiddeld Intel Core i9-14900HX, NVIDIA RTX 3500 Ada Generation Laptop GPU (n=1) | |
| HP ZBook Fury 16 G10 | |
| HP ZBook Fury 16 G9 | |
| Lenovo ThinkPad P16 G2 21FA000FGE | |
| Lenovo ThinkPad P1 G6 21FV001KUS | |
| Dell Precision 5690 | |
| CrossMark / Productivity | |
| Asus ProArt Studiobook 16 OLED H7604 | |
| HP ZBook Fury 16 G11 | |
| Gemiddeld Intel Core i9-14900HX, NVIDIA RTX 3500 Ada Generation Laptop GPU (n=1) | |
| HP ZBook Fury 16 G10 | |
| HP ZBook Fury 16 G9 | |
| Dell Precision 5690 | |
| Lenovo ThinkPad P1 G6 21FV001KUS | |
| Lenovo ThinkPad P16 G2 21FA000FGE | |
| CrossMark / Creativity | |
| Asus ProArt Studiobook 16 OLED H7604 | |
| HP ZBook Fury 16 G11 | |
| Gemiddeld Intel Core i9-14900HX, NVIDIA RTX 3500 Ada Generation Laptop GPU (n=1) | |
| Lenovo ThinkPad P16 G2 21FA000FGE | |
| HP ZBook Fury 16 G9 | |
| HP ZBook Fury 16 G10 | |
| Lenovo ThinkPad P1 G6 21FV001KUS | |
| Dell Precision 5690 | |
| CrossMark / Responsiveness | |
| Asus ProArt Studiobook 16 OLED H7604 | |
| HP ZBook Fury 16 G11 | |
| Gemiddeld Intel Core i9-14900HX, NVIDIA RTX 3500 Ada Generation Laptop GPU (n=1) | |
| HP ZBook Fury 16 G10 | |
| HP ZBook Fury 16 G9 | |
| Dell Precision 5690 | |
| Lenovo ThinkPad P1 G6 21FV001KUS | |
| Lenovo ThinkPad P16 G2 21FA000FGE | |
| WebXPRT 3 / Overall | |
| HP ZBook Fury 16 G10 | |
| Asus ProArt Studiobook 16 OLED H7604 | |
| Lenovo ThinkPad P16 G2 21FA000FGE | |
| HP ZBook Fury 16 G11 | |
| Gemiddeld Intel Core i9-14900HX, NVIDIA RTX 3500 Ada Generation Laptop GPU (n=1) | |
| Lenovo ThinkPad P1 G6 21FV001KUS | |
| HP ZBook Fury 16 G9 | |
| Dell Precision 5690 | |
| WebXPRT 4 / Overall | |
| HP ZBook Fury 16 G11 | |
| Gemiddeld Intel Core i9-14900HX, NVIDIA RTX 3500 Ada Generation Laptop GPU (n=1) | |
| HP ZBook Fury 16 G10 | |
| Asus ProArt Studiobook 16 OLED H7604 | |
| Lenovo ThinkPad P1 G6 21FV001KUS | |
| HP ZBook Fury 16 G9 | |
| Dell Precision 5690 | |
| Mozilla Kraken 1.1 / Total | |
| Dell Precision 5690 | |
| HP ZBook Fury 16 G9 | |
| Lenovo ThinkPad P16 G2 21FA000FGE | |
| Lenovo ThinkPad P1 G6 21FV001KUS | |
| HP ZBook Fury 16 G10 | |
| HP ZBook Fury 16 G11 | |
| Gemiddeld Intel Core i9-14900HX, NVIDIA RTX 3500 Ada Generation Laptop GPU (n=1) | |
| Asus ProArt Studiobook 16 OLED H7604 | |
* ... kleiner is beter
| PCMark 10 Score | 7607 punten | |
Help | ||
| AIDA64 / Memory Copy | |
| Dell Precision 5690 | |
| Gemiddeld Intel Core i9-14900HX (38028 - 83392, n=36) | |
| Asus ProArt Studiobook 16 OLED H7604 | |
| HP ZBook Fury 16 G10 | |
| HP ZBook Fury 16 G9 | |
| HP ZBook Fury 16 G11 | |
| Lenovo ThinkPad P16 G2 21FA000FGE | |
| Lenovo ThinkPad P1 G6 21FV001KUS | |
| AIDA64 / Memory Read | |
| Dell Precision 5690 | |
| Gemiddeld Intel Core i9-14900HX (43306 - 87568, n=36) | |
| Asus ProArt Studiobook 16 OLED H7604 | |
| HP ZBook Fury 16 G10 | |
| HP ZBook Fury 16 G11 | |
| HP ZBook Fury 16 G9 | |
| Lenovo ThinkPad P16 G2 21FA000FGE | |
| Lenovo ThinkPad P1 G6 21FV001KUS | |
| AIDA64 / Memory Write | |
| Dell Precision 5690 | |
| Gemiddeld Intel Core i9-14900HX (37146 - 80589, n=36) | |
| Asus ProArt Studiobook 16 OLED H7604 | |
| HP ZBook Fury 16 G10 | |
| HP ZBook Fury 16 G9 | |
| Lenovo ThinkPad P16 G2 21FA000FGE | |
| HP ZBook Fury 16 G11 | |
| Lenovo ThinkPad P1 G6 21FV001KUS | |
| AIDA64 / Memory Latency | |
| Dell Precision 5690 | |
| HP ZBook Fury 16 G10 | |
| Lenovo ThinkPad P16 G2 21FA000FGE | |
| HP ZBook Fury 16 G11 | |
| HP ZBook Fury 16 G9 | |
| Asus ProArt Studiobook 16 OLED H7604 | |
| Lenovo ThinkPad P1 G6 21FV001KUS | |
| Gemiddeld Intel Core i9-14900HX (76.1 - 105, n=36) | |
* ... kleiner is beter
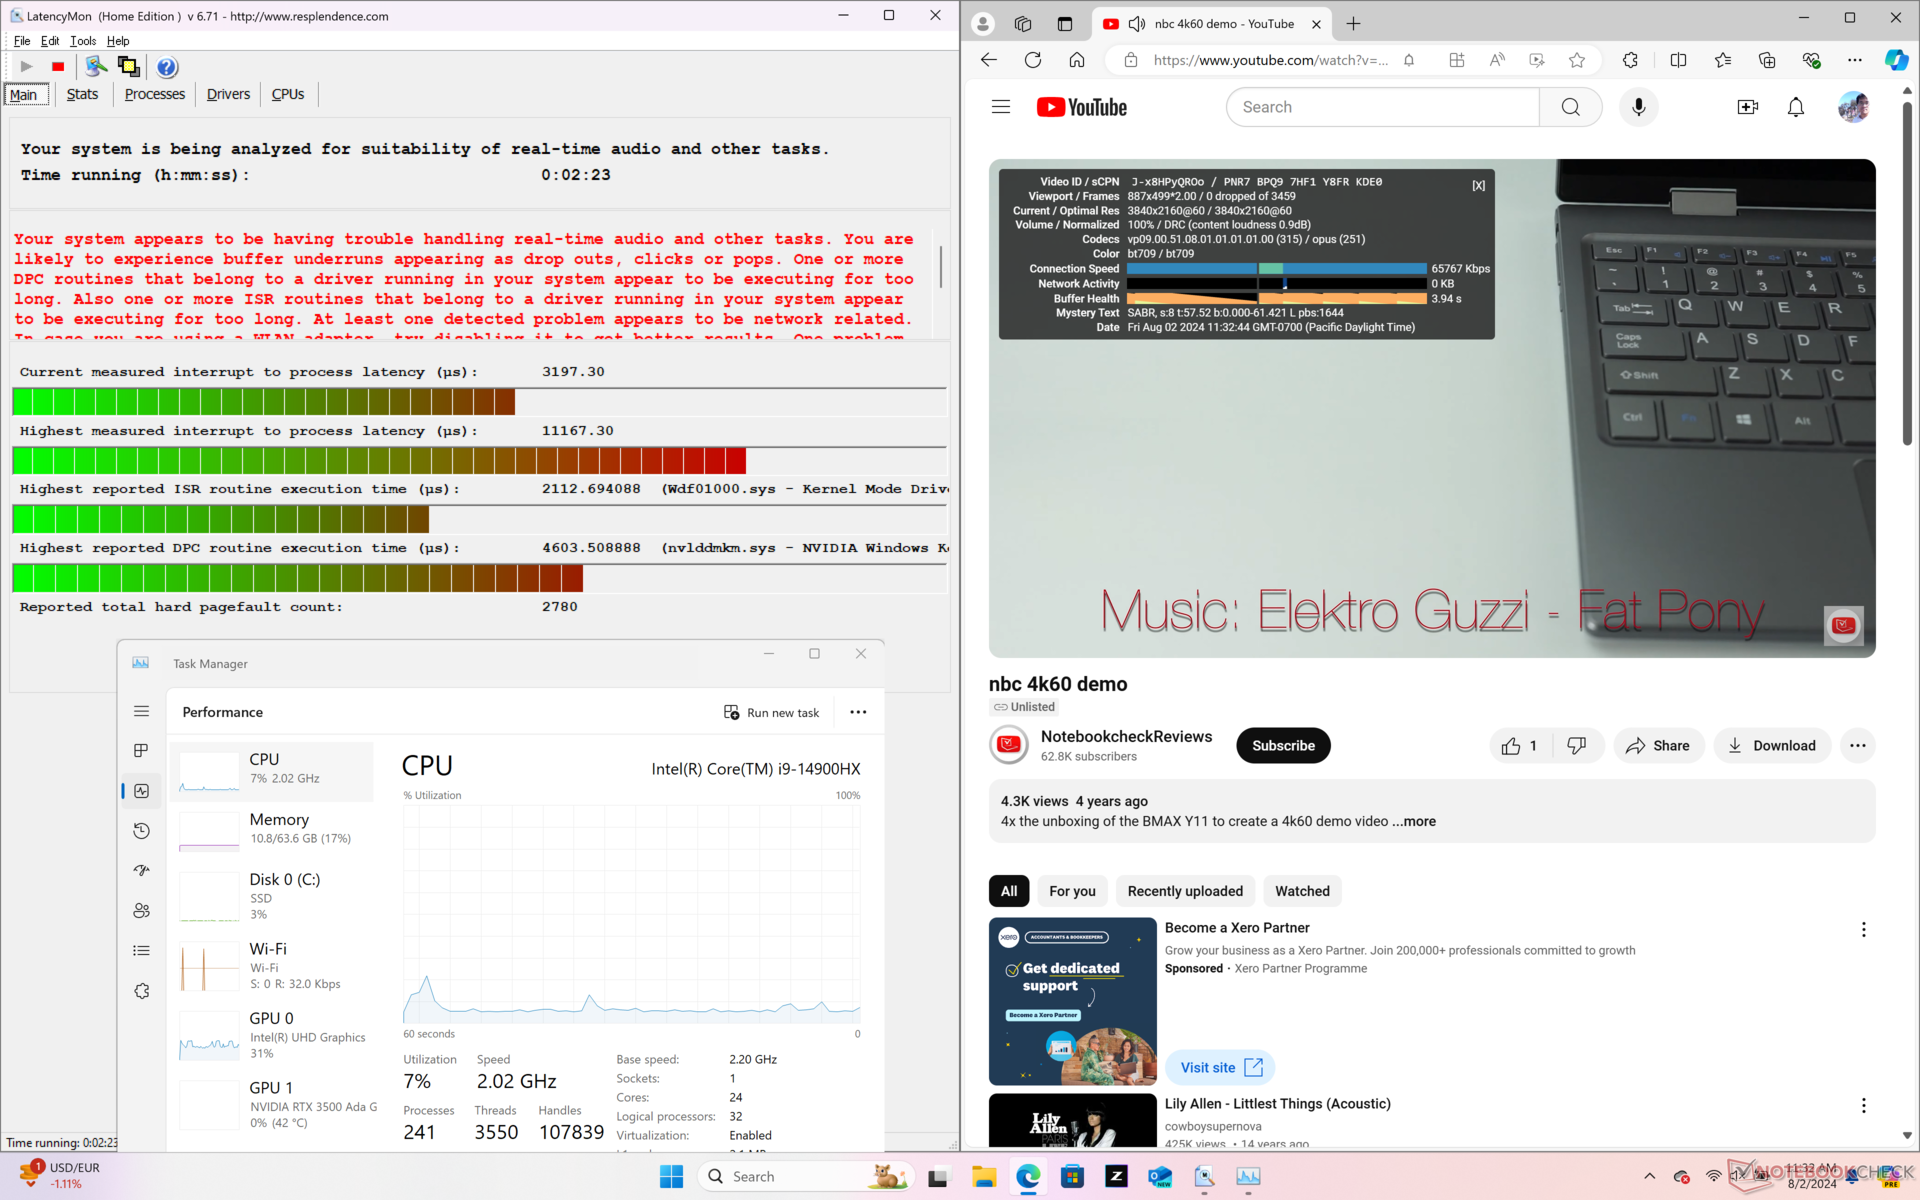
DPC latentie
LatencyMon onthult DPC-problemen bij het openen van meerdere browsertabbladen van onze startpagina. het afspelen van 4K-video's met 60 FPS verloopt verder perfect, zonder dropped frames.

| DPC Latencies / LatencyMon - interrupt to process latency (max), Web, Youtube, Prime95 | |
| HP ZBook Fury 16 G11 | |
| HP ZBook Fury 16 G10 | |
| HP ZBook Fury 16 G9 | |
| Asus ProArt Studiobook 16 OLED H7604 | |
| Lenovo ThinkPad P1 G6 21FV001KUS | |
| Lenovo ThinkPad P16 G2 21FA000FGE | |
| Dell Precision 5690 | |
* ... kleiner is beter
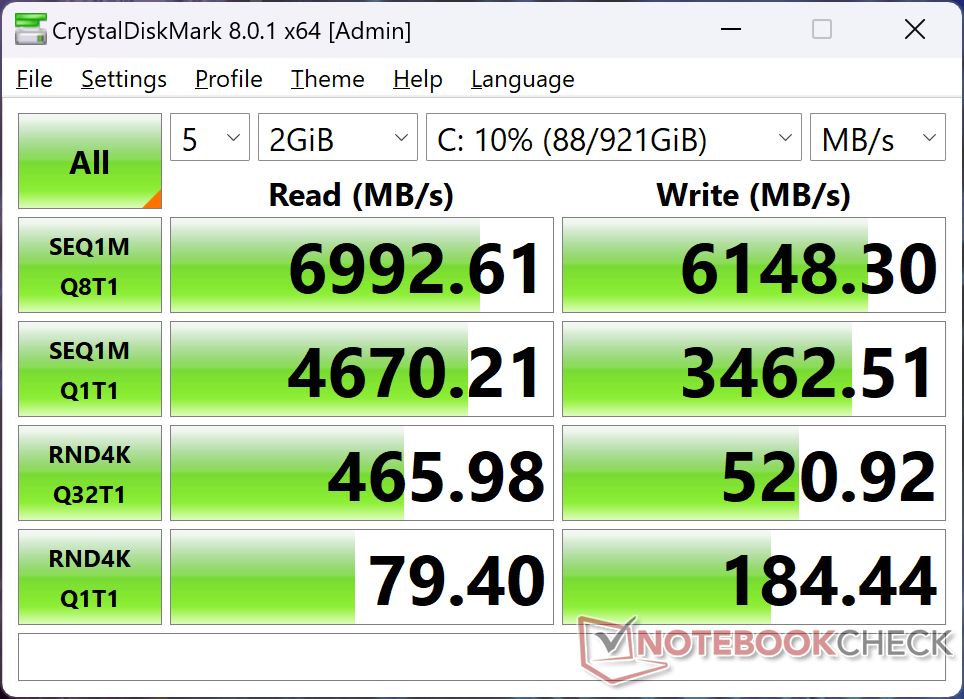
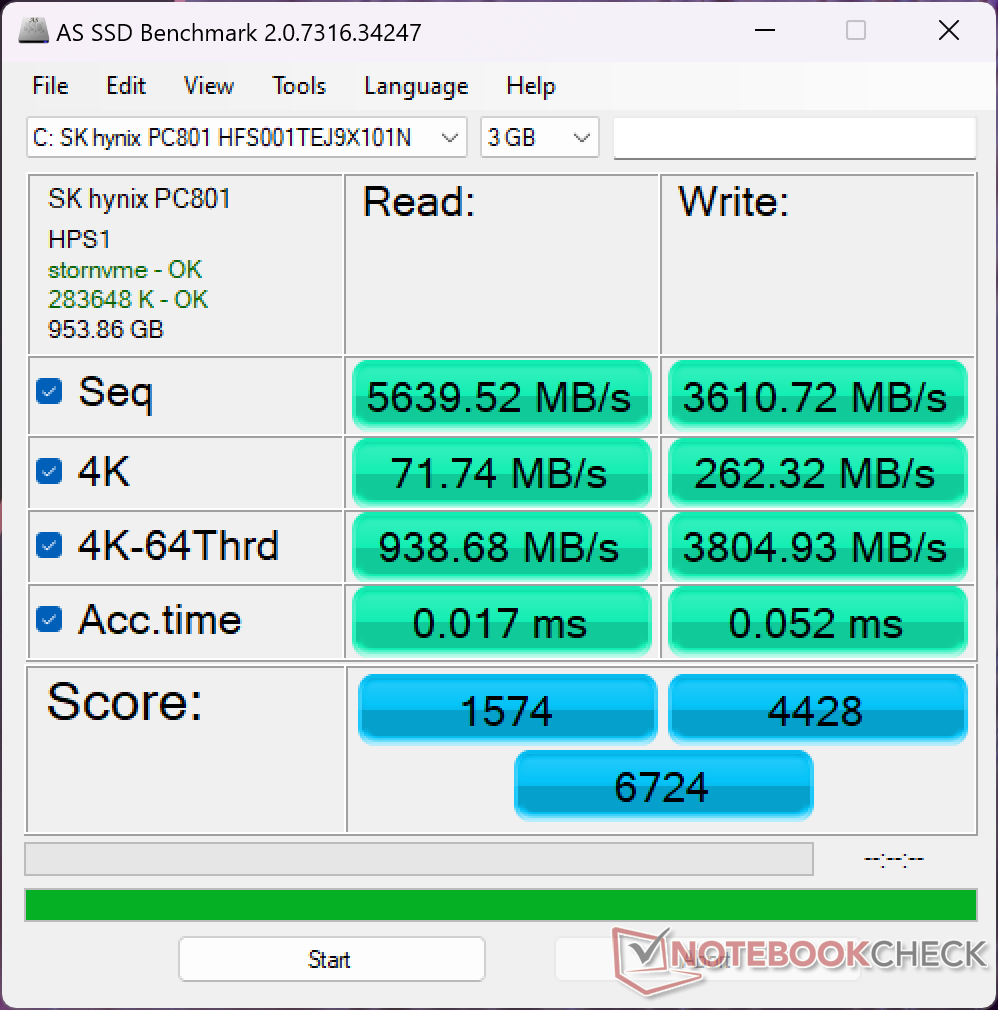
Opslagapparaten
Onze testunit wordt geleverd met dezelfde 1 TB SK Hynix PC801 HFS001TEJ9X101N PCIe4 M.2 SSD als die in de ZBook Fury 16 G10 van vorig jaar. Helaas heeft de schijf ook last van dezelfde prestatieproblemen. Wanneer DiskSpd in een lus werd uitgevoerd, begonnen de overdrachtsnelheden zeer hoog met bijna 7000 MB/s voordat ze slechts een paar minuten later terugvielen naar 3400 MB/s, zoals de grafiek hieronder laat zien. Dit kan worden toegeschreven aan onvoldoende koeling voor de schijven, maar dat is misschien de prijs die betaald moet worden voor het ondersteunen van meer individuele schijven dan de meeste andere laptops.

* ... kleiner is beter
Disk Throttling: DiskSpd Read Loop, Queue Depth 8
GPU-prestaties
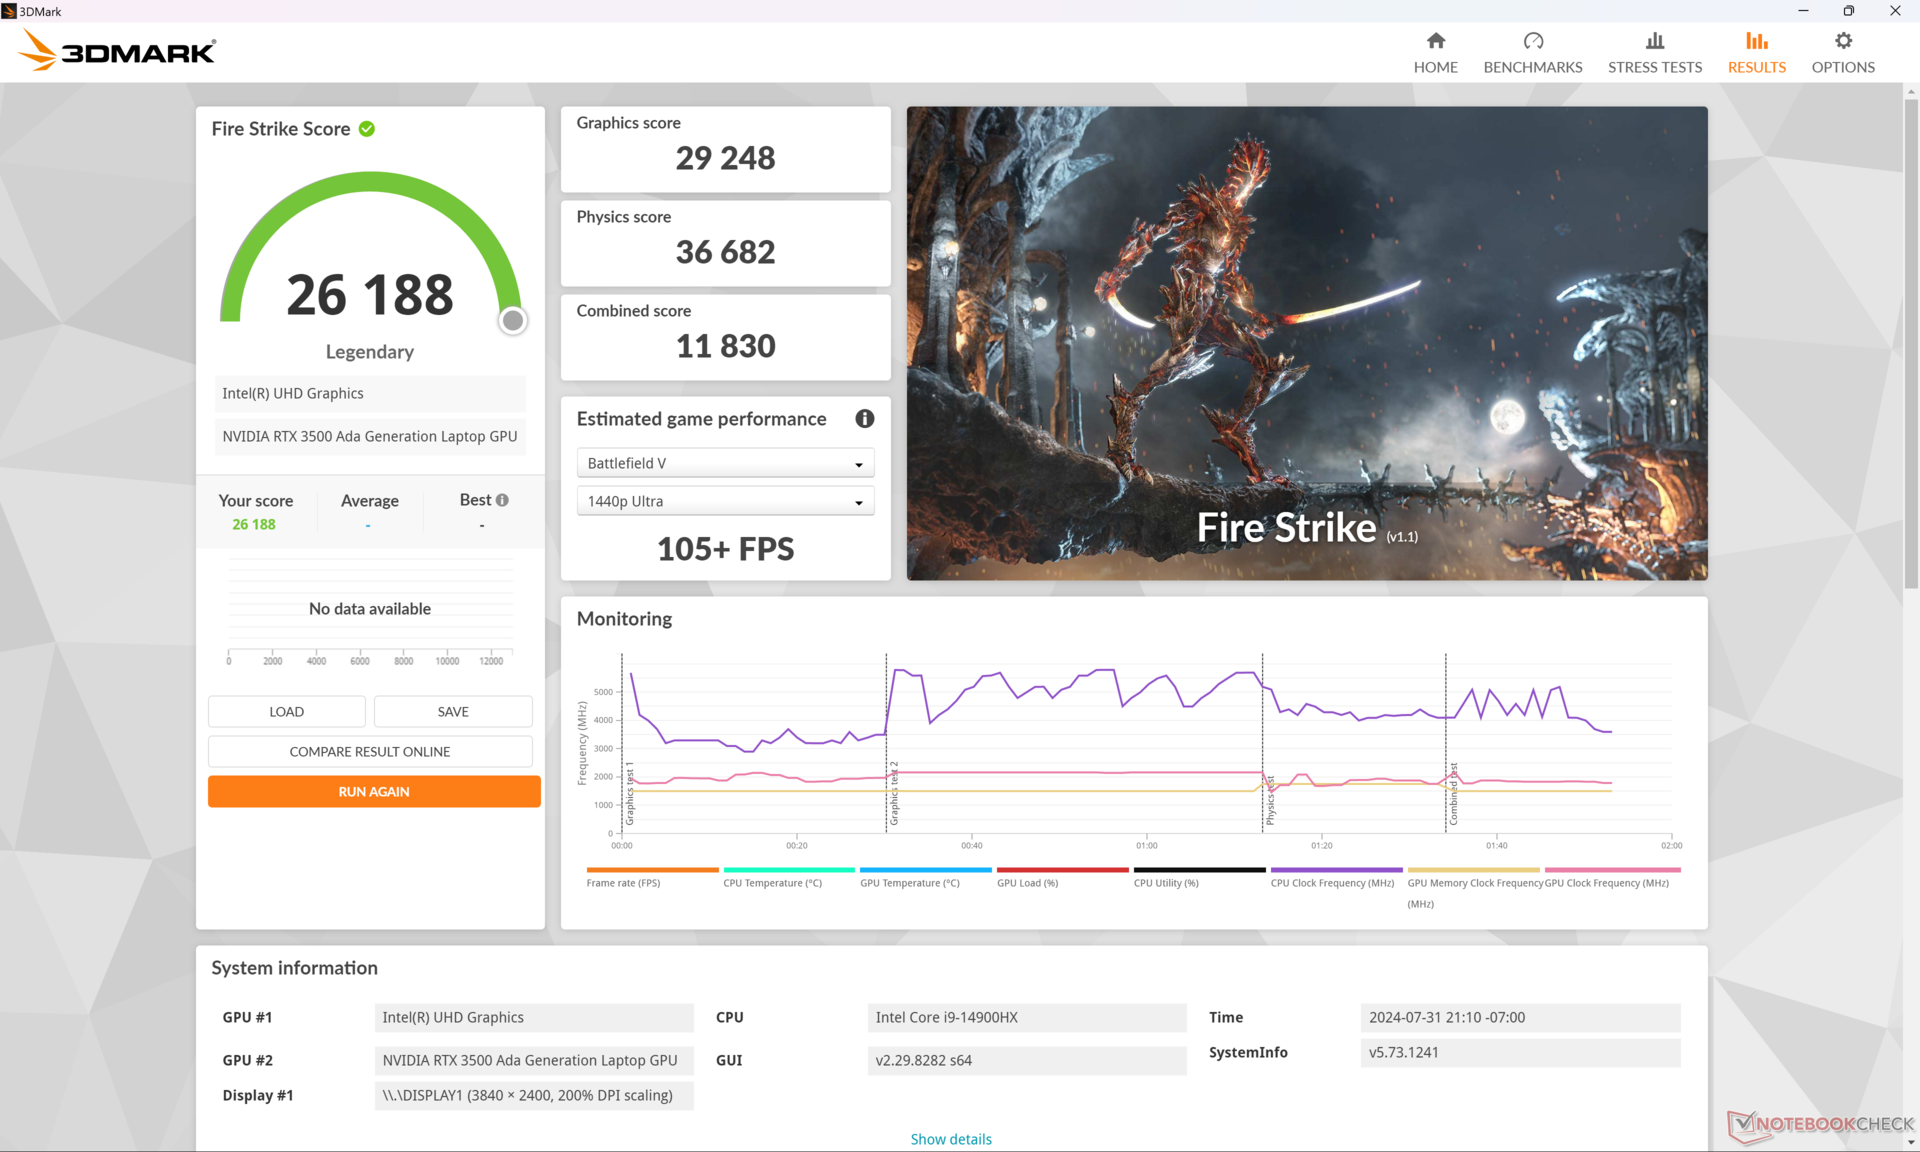
Gebruikers kunnen de RTX 3500 Ada ruwweg 20 tot 30 procent langzamer presteert dan de RTX 5000 Ada. Aangezien Nvidia nog geen nieuwe generatie mobiele GPU's heeft geïntroduceerd, wordt de ZBook Fury 16 G11 geleverd met dezelfde GPU-opties als op het model van vorig jaar, zonder noemenswaardige prestatiewinst. De RTA 5000 Ada blijft de snelste GPU voor mobiel werkstation die beschikbaar is.
| Vermogen | Grafische Score | Fysieke Score | Gecombineerde Score |
| Prestatiemodus | 29248 | 36682 | 11830 |
| Evenwichtige modus | 28214 (-4%) | 33094 (-10%) | 10246 (-13%) |
| Batterijvoeding | 16618 (-43%) | 25118 (-32%) | 4101 (-65%) |
Het draaien in de Balanced-modus in plaats van de Performance-modus zou de prestaties met wel 10 tot 15 procent beïnvloeden, zoals onze bovenstaande Fire Strike tabel laat zien. Het prestatietekort wordt nog groter als er op de batterij wordt gewerkt, wat te verwachten is van de meeste laptops met hoge prestaties.
| 3DMark Performance Rating - Percent | |
| HP ZBook Fury 16 G10 -2! | |
| Dell Precision 5690 -2! | |
| Dell Precision 5000 5680 -2! | |
| HP ZBook Fury 16 G11 | |
| Gemiddeld NVIDIA RTX 3500 Ada Generation Laptop GPU | |
| Lenovo ThinkPad P1 G6 21FV001KUS -2! | |
| Lenovo ThinkPad P1 G6-21FV000DGE -17! | |
| HP ZBook Fury 16 G9 -2! | |
| Lenovo ThinkPad P16 G2 21FA000FGE -17! | |
| MSI CreatorPro Z16P B12UKST -17! | |
| Asus ProArt Studiobook 16 OLED H7604 -17! | |
| Asus ExpertBook B6 Flip B6602FC2 -17! | |
| Lenovo ThinkPad P1 G4-20Y4S0KS00 -10! | |
| Lenovo ThinkPad P16v G1 AMD -17! | |
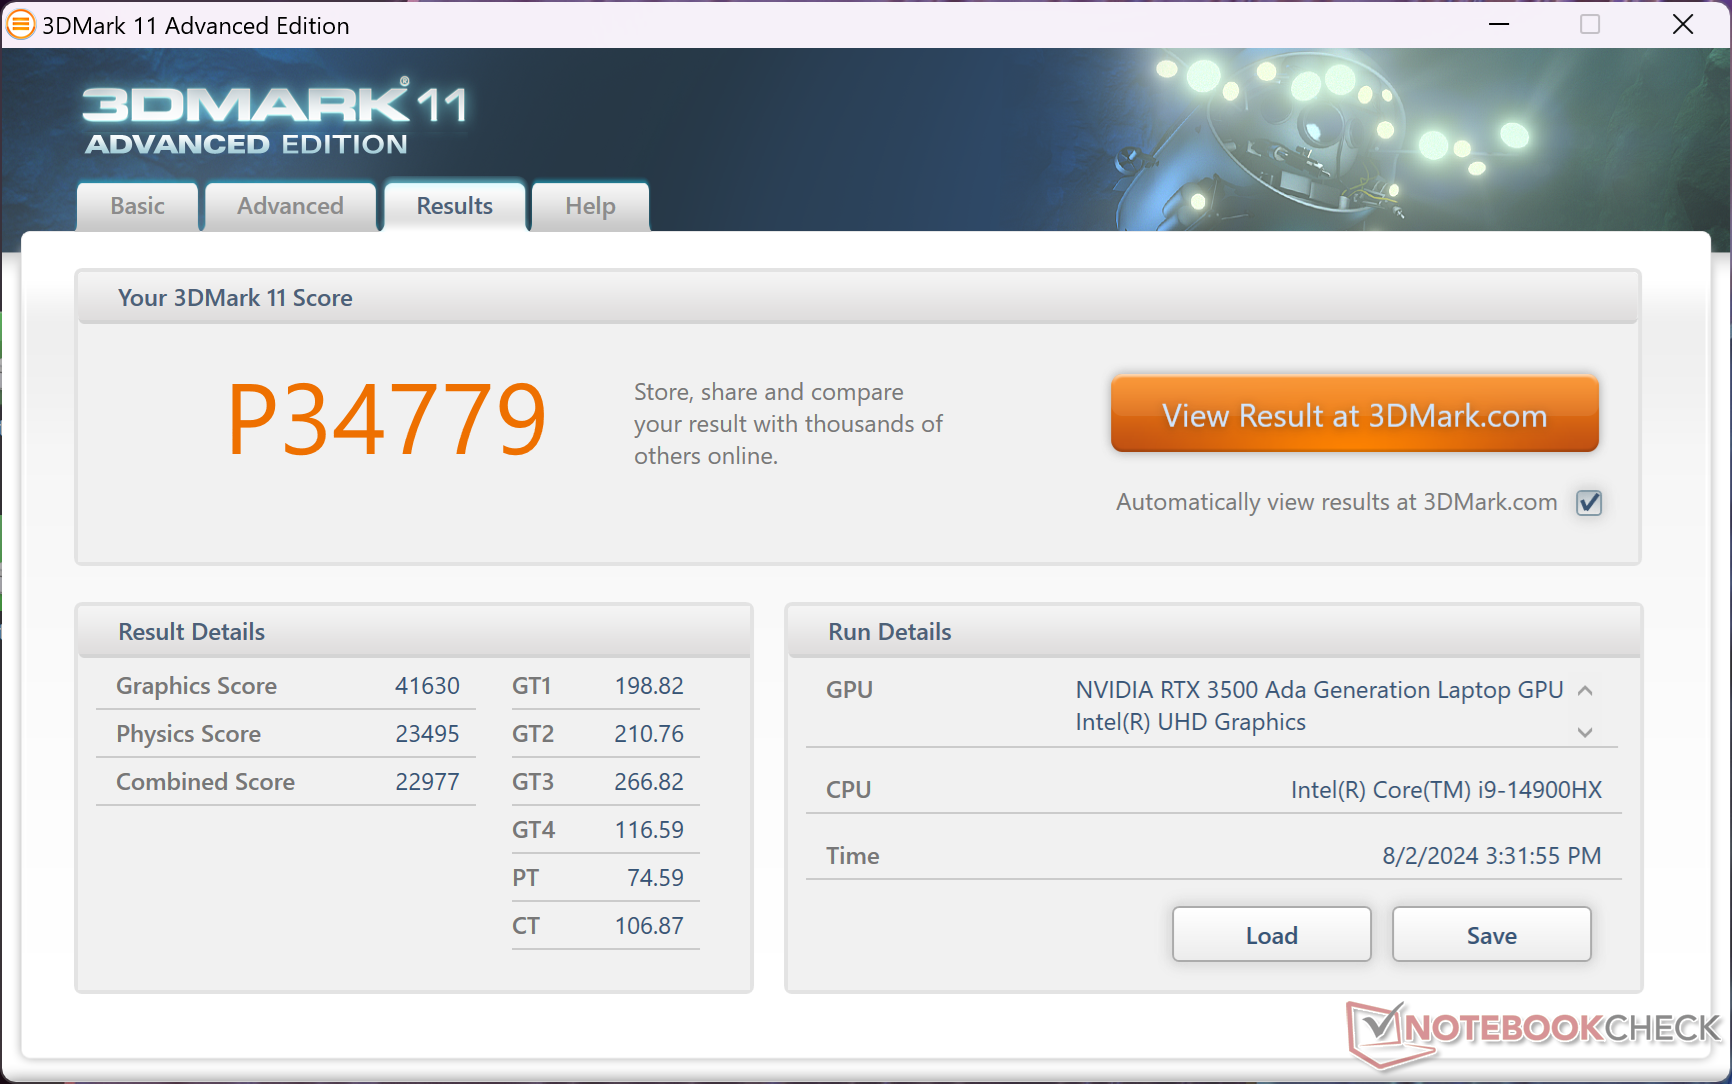
| 3DMark 11 Performance | 34779 punten | |
| 3DMark Fire Strike Score | 26188 punten | |
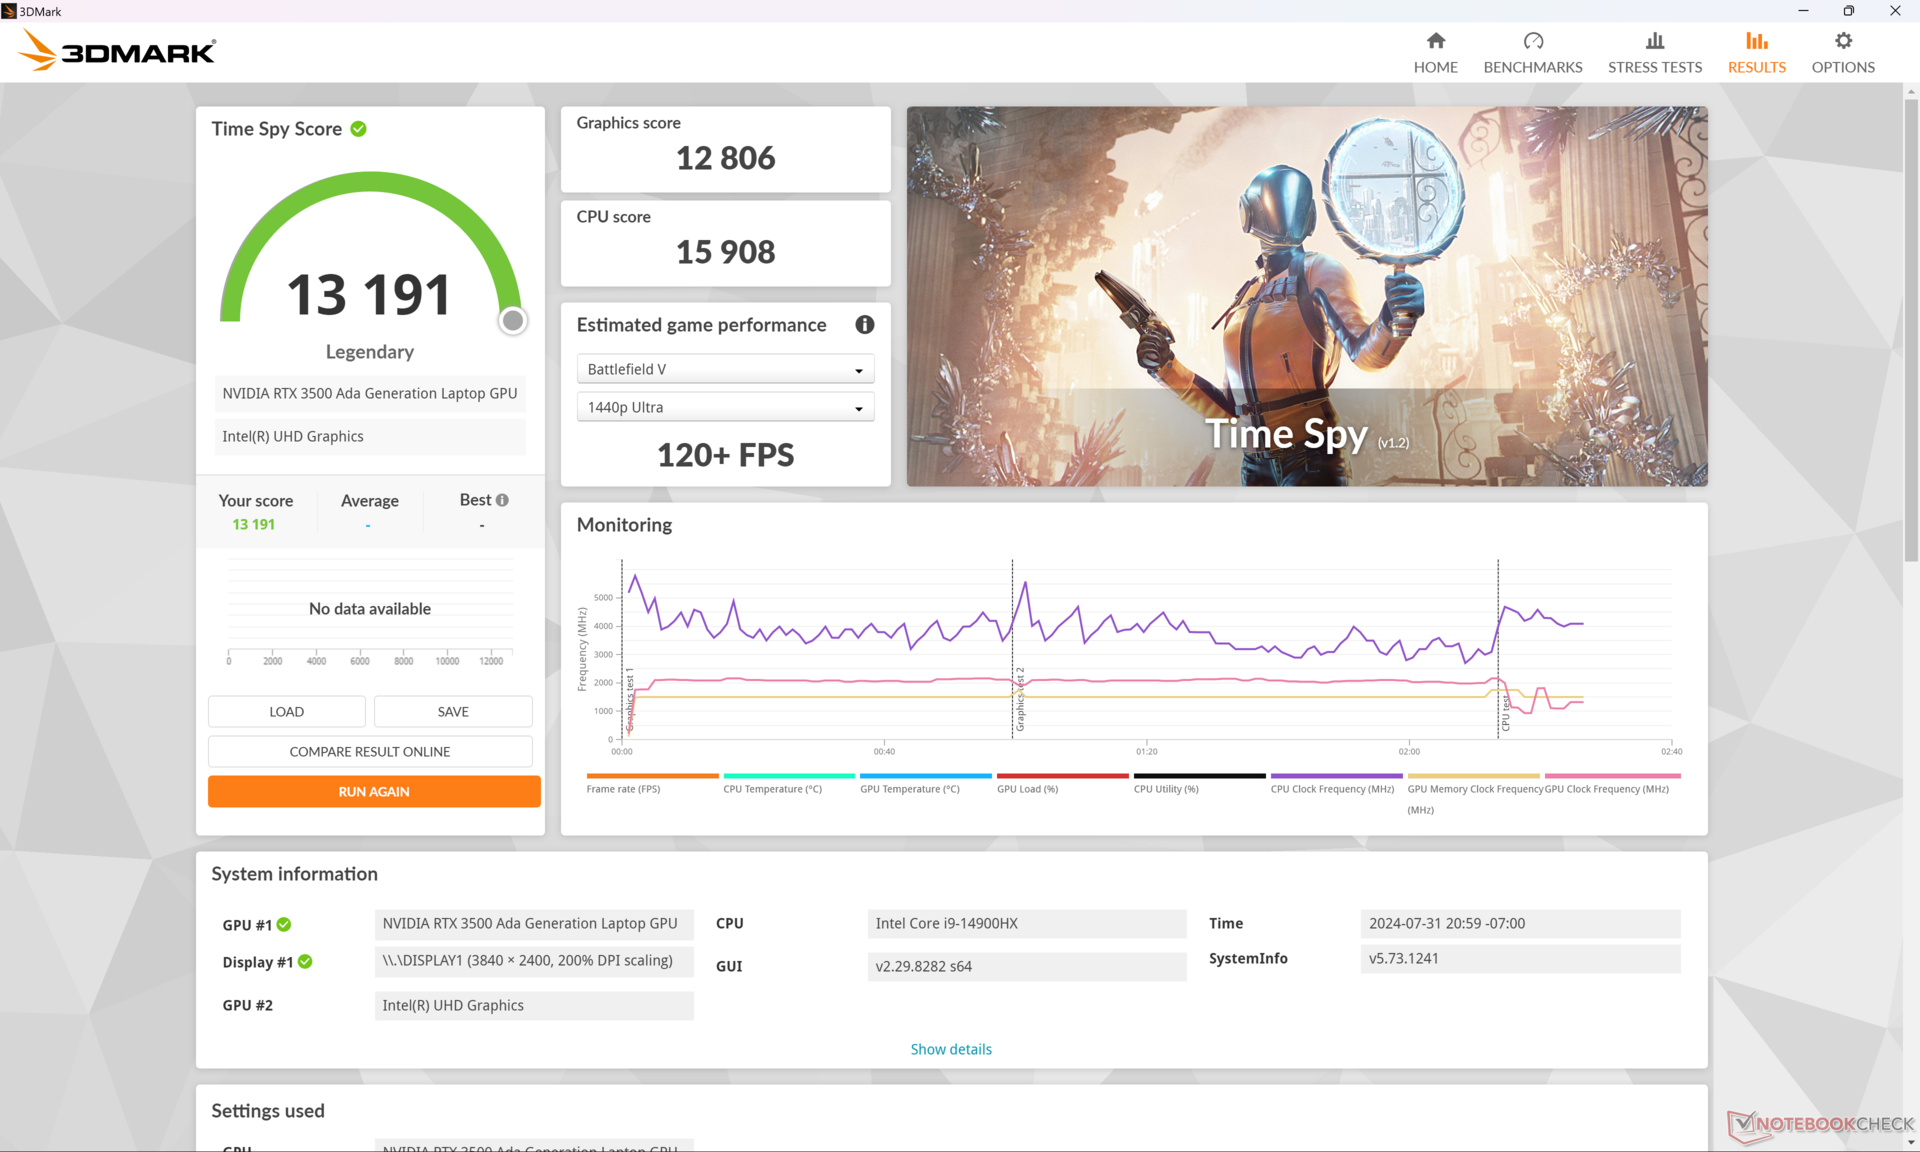
| 3DMark Time Spy Score | 13191 punten | |
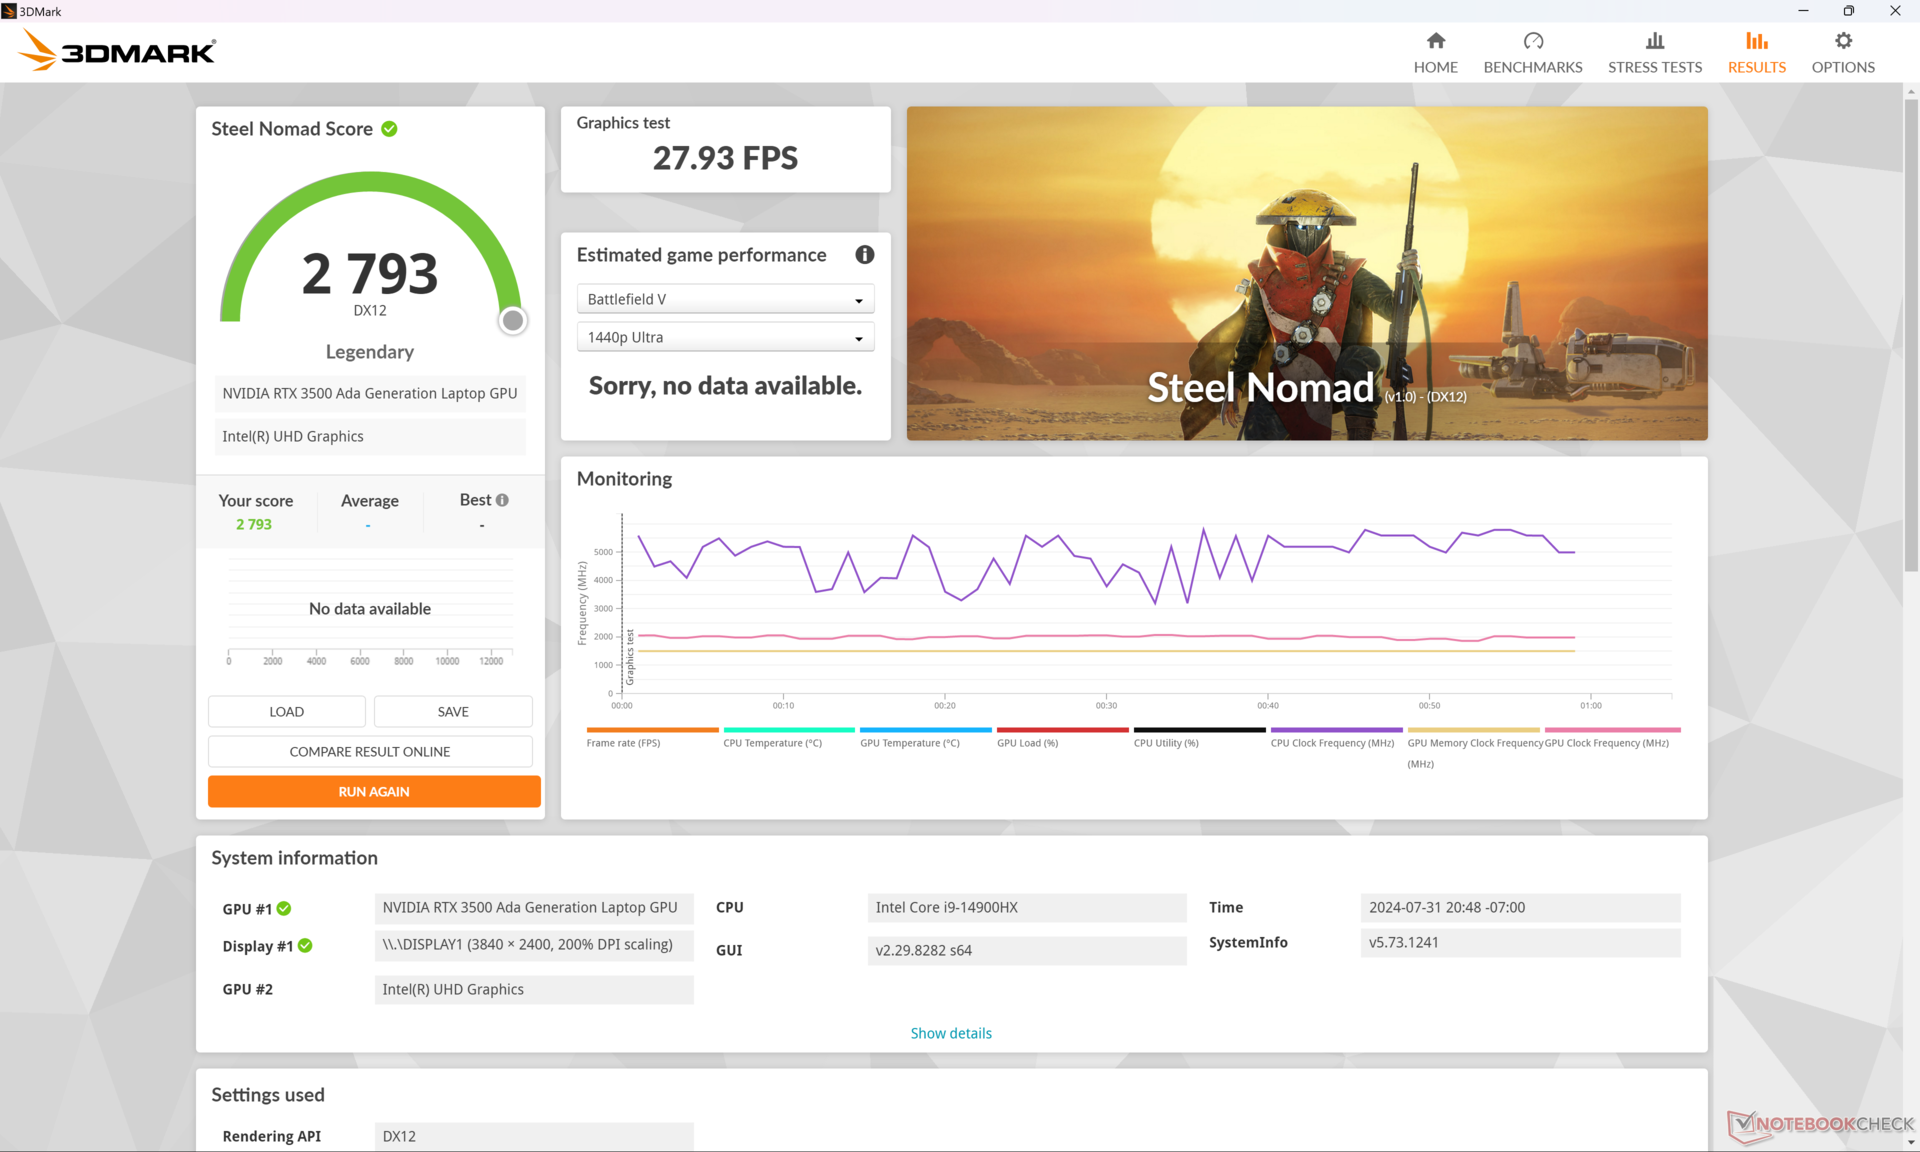
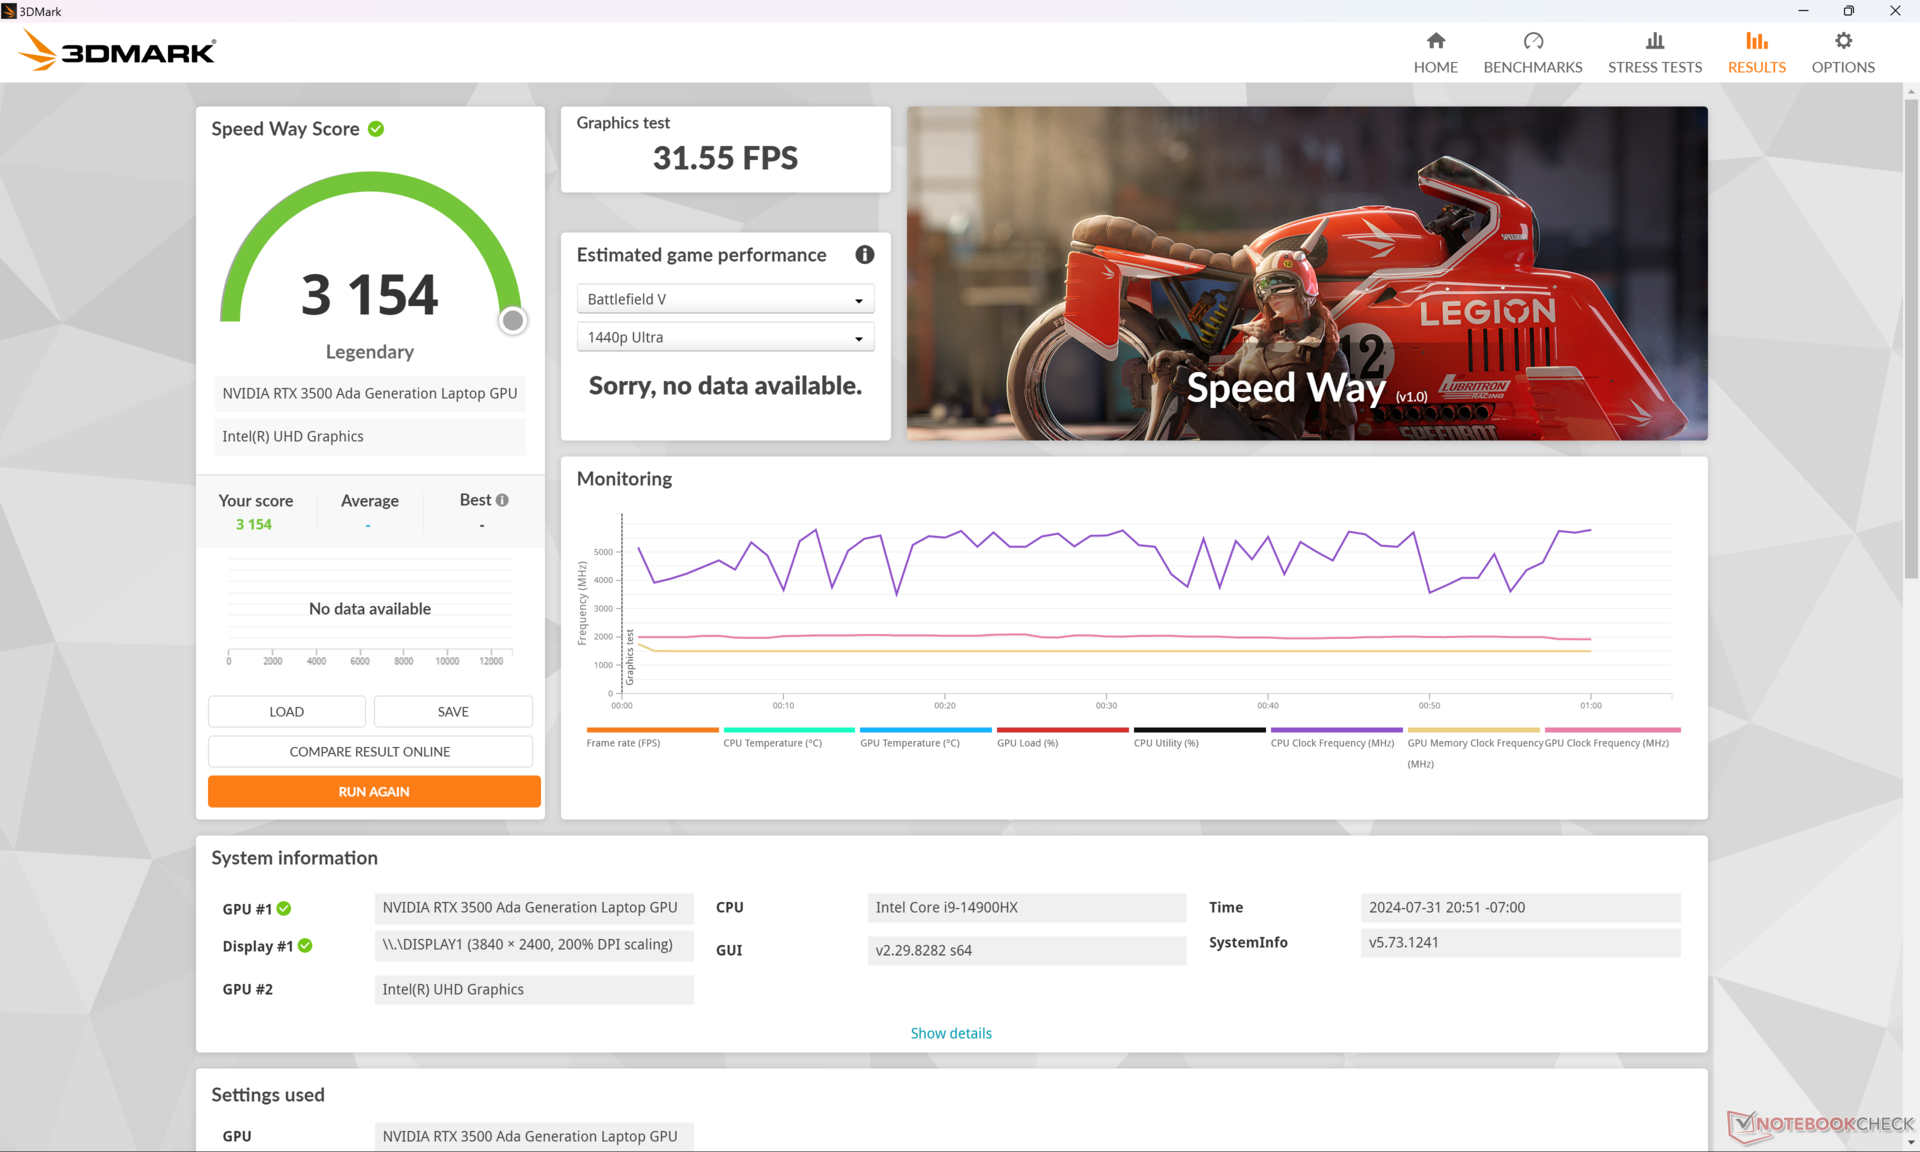
| 3DMark Steel Nomad Score | 2793 punten | |
Help | ||
* ... kleiner is beter
Gaming prestaties
Hoewel de RTX 3500 Ada niet is ontworpen voor gaming, presteert hij iets beter dan mobiele GeForce RTX 4070 maar onder de mobiele RTX 4080, vooral als we kijken naar het aantal unified pipelines, tensor cores en geheugenbandbreedte. De prestaties kunnen in de loop van de tijd echter geleidelijk vertragen wanneer er druk op wordt uitgeoefend, omdat GPU-boostsnelheden niet onbeperkt zijn. Bij stationair draaien op Cyberpunk 2077 op 1080p Ultra-instellingen, bijvoorbeeld, begonnen de prestaties met iets meer dan 70 FPS voordat ze geleidelijk afnamen naar de lage 60 FPS na slechts 30 minuten, zoals de grafiek hieronder laat zien.
| Performance Rating - Percent | |
| HP ZBook Fury 16 G10 -2! | |
| Lenovo ThinkPad P1 G6 21FV001KUS -1! | |
| HP ZBook Fury 16 G11 | |
| Asus ProArt Studiobook 16 OLED H7604 -1! | |
| Dell Precision 5690 -1! | |
| HP ZBook Fury 16 G9 -1! | |
| Lenovo ThinkPad P16 G2 21FA000FGE -1! | |
| GTA V - 1920x1080 Highest Settings possible AA:4xMSAA + FX AF:16x | |
| Asus ProArt Studiobook 16 OLED H7604 | |
| Lenovo ThinkPad P1 G6 21FV001KUS | |
| HP ZBook Fury 16 G9 | |
| HP ZBook Fury 16 G11 | |
| Lenovo ThinkPad P16 G2 21FA000FGE | |
| Final Fantasy XV Benchmark - 1920x1080 High Quality | |
| HP ZBook Fury 16 G10 | |
| Lenovo ThinkPad P1 G6 21FV001KUS | |
| Dell Precision 5690 | |
| HP ZBook Fury 16 G11 | |
| Asus ProArt Studiobook 16 OLED H7604 | |
| HP ZBook Fury 16 G9 | |
| Lenovo ThinkPad P16 G2 21FA000FGE | |
| Strange Brigade - 1920x1080 ultra AA:ultra AF:16 | |
| HP ZBook Fury 16 G10 | |
| Dell Precision 5690 | |
| HP ZBook Fury 16 G11 | |
| HP ZBook Fury 16 G9 | |
| Lenovo ThinkPad P16 G2 21FA000FGE | |
| Asus ProArt Studiobook 16 OLED H7604 | |
| Dota 2 Reborn - 1920x1080 ultra (3/3) best looking | |
| Asus ProArt Studiobook 16 OLED H7604 | |
| HP ZBook Fury 16 G10 | |
| HP ZBook Fury 16 G11 | |
| HP ZBook Fury 16 G9 | |
| Lenovo ThinkPad P16 G2 21FA000FGE | |
| Lenovo ThinkPad P1 G6 21FV001KUS | |
| Dell Precision 5690 | |
| Cyberpunk 2077 2.2 Phantom Liberty - 1920x1080 Ultra Preset (FSR off) | |
| Dell Precision 5690 | |
| Lenovo ThinkPad P1 G6 21FV001KUS | |
| HP ZBook Fury 16 G11 | |
| Baldur's Gate 3 | |
| 1920x1080 Ultra Preset AA:T | |
| Dell Precision 5690 | |
| Lenovo ThinkPad P1 G6 21FV001KUS | |
| HP ZBook Fury 16 G11 | |
| Gemiddeld NVIDIA RTX 3500 Ada Generation Laptop GPU (n=1) | |
| 2560x1440 Ultra Preset AA:T | |
| Dell Precision 5690 | |
| Lenovo ThinkPad P1 G6 21FV001KUS | |
| HP ZBook Fury 16 G11 | |
| Gemiddeld NVIDIA RTX 3500 Ada Generation Laptop GPU (n=1) | |
| 3840x2160 Ultra Preset AA:T | |
| Dell Precision 5690 | |
| Lenovo ThinkPad P1 G6 21FV001KUS | |
| HP ZBook Fury 16 G11 | |
| Gemiddeld NVIDIA RTX 3500 Ada Generation Laptop GPU (n=1) | |
Cyberpunk 2077 ultra FPS Chart
| lage | gem. | hoge | ultra | QHD | 4K | |
|---|---|---|---|---|---|---|
| GTA V (2015) | 184.3 | 181 | 170.1 | 115.5 | 97.5 | 59.6 |
| Dota 2 Reborn (2015) | 201 | 177.7 | 162.1 | 153.9 | 134.4 | |
| Final Fantasy XV Benchmark (2018) | 200 | 167.6 | 128.9 | 97.5 | 54.2 | |
| X-Plane 11.11 (2018) | 144.6 | 137.8 | 110.9 | 92.7 | ||
| Far Cry 5 (2018) | 133 | 135 | 127 | 109 | 62 | |
| Strange Brigade (2018) | 411 | 296 | 235 | 223 | 159.2 | 78.6 |
| Tiny Tina's Wonderlands (2022) | 232.5 | 195.4 | 137.9 | 109.3 | 74.4 | 41.6 |
| F1 22 (2022) | 228 | 223 | 182.8 | 72.9 | 48.3 | 24 |
| Baldur's Gate 3 (2023) | 164.8 | 136.2 | 118.6 | 117.3 | 80.2 | 41.2 |
| Cyberpunk 2077 2.2 Phantom Liberty (2023) | 121.2 | 113.1 | 101.8 | 90.3 | 60.2 | 21.3 |
Uitstoot
Systeemgeluid
Het geluid en gedrag van de ventilatoren zijn ongeveer hetzelfde als wat we opnamen bij het model van vorig jaar, zo niet iets luider bij hogere belastingen. De ventilatoren pulseerden nog steeds af en toe wanneer ze stationair draaiden op het bureaublad, zelfs wanneer ze ingesteld waren op de gebalanceerde modus zonder actieve toepassingen. Erger nog, ons specifieke apparaat heeft last van een merkbaar spoelgejank dat gedurende de hele testperiode aanhield.
Geluidsniveau
| Onbelast |
| 23.2 / 23.2 / 29.5 dB (A) |
| Belasting |
| 43 / 48.2 dB (A) |
 | ||
30 dB stil 40 dB(A) hoorbaar 50 dB(A) luid |
||
min: | ||
| HP ZBook Fury 16 G11 NVIDIA RTX 3500 Ada Generation Laptop GPU, i9-14900HX, SK hynix PC801 HFS001TEJ9X101N | HP ZBook Fury 16 G10 NVIDIA RTX 5000 Ada Generation Laptop GPU, i9-13950HX, SK hynix PC801 HFS001TEJ9X101N | HP ZBook Fury 16 G9 RTX A5500 Laptop GPU, i9-12950HX, Micron 3400 1TB MTFDKBA1T0TFH | Dell Precision 5690 NVIDIA RTX 5000 Ada Generation Laptop GPU, Ultra 9 185H, 2x Samsung PM9A1 1TB (RAID 0) | Lenovo ThinkPad P16 G2 21FA000FGE NVIDIA RTX 2000 Ada Generation Laptop GPU, i7-13700HX, SK hynix PC801 HFS001TEJ9X162N | Lenovo ThinkPad P1 G6 21FV001KUS NVIDIA GeForce RTX 4080 Laptop GPU, i7-13800H, Kioxia XG8 KXG8AZNV1T02 | Asus ProArt Studiobook 16 OLED H7604 NVIDIA GeForce RTX 4070 Laptop GPU, i9-13980HX, Phison EM2804TBMTCB47 | |
|---|---|---|---|---|---|---|---|
| Noise | 3% | 4% | -3% | -4% | 9% | -5% | |
| uit / omgeving * | 23.2 | 22.9 1% | 22.6 3% | 23.4 -1% | 23.5 -1% | 22.5 3% | 24.5 -6% |
| Idle Minimum * | 23.2 | 22.9 1% | 22.7 2% | 23.6 -2% | 23.5 -1% | 22.5 3% | 24.5 -6% |
| Idle Average * | 23.2 | 22.9 1% | 22.7 2% | 24.9 -7% | 29.2 -26% | 22.5 3% | 24.5 -6% |
| Idle Maximum * | 29.5 | 28.5 3% | 28.8 2% | 30.9 -5% | 29.5 -0% | 22.5 24% | 24.5 17% |
| Load Average * | 43 | 40.6 6% | 36.2 16% | 40.4 6% | 32.7 24% | 28.7 33% | 47.6 -11% |
| Cyberpunk 2077 ultra * | 48.2 | ||||||
| Load Maximum * | 48.2 | 45.8 5% | 49.3 -2% | 51.9 -8% | 56.6 -17% | 54.4 -13% | 56.7 -18% |
| Witcher 3 ultra * | 44.1 | 49.5 | 48.3 | 50.6 | 47.5 | 55.9 |
* ... kleiner is beter
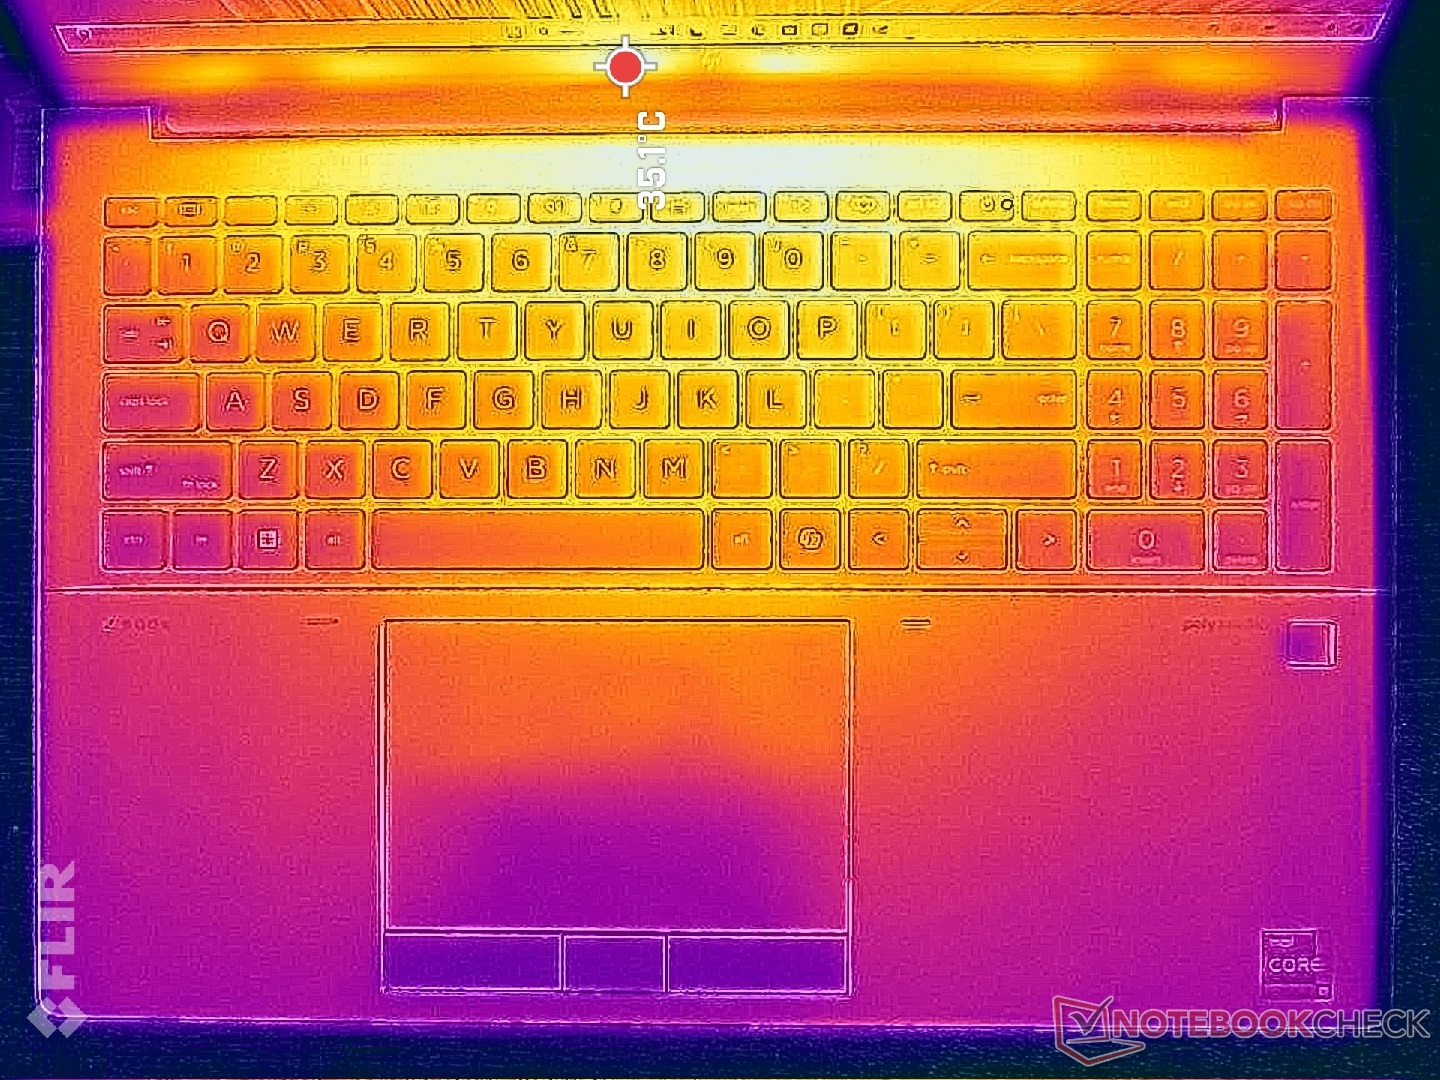
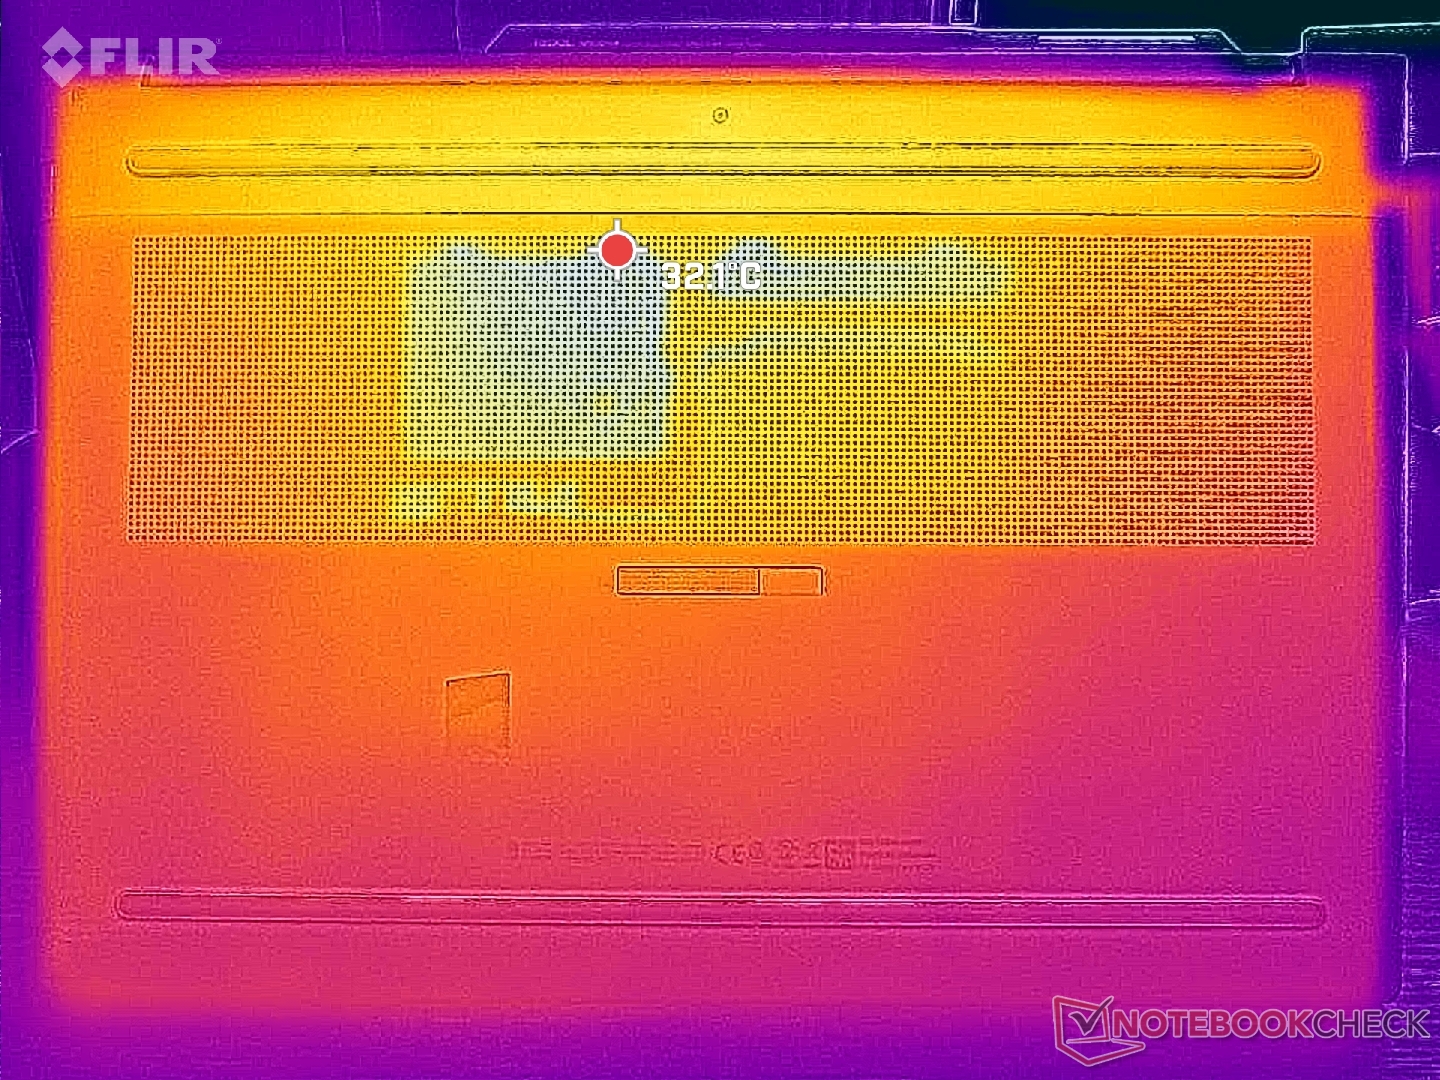
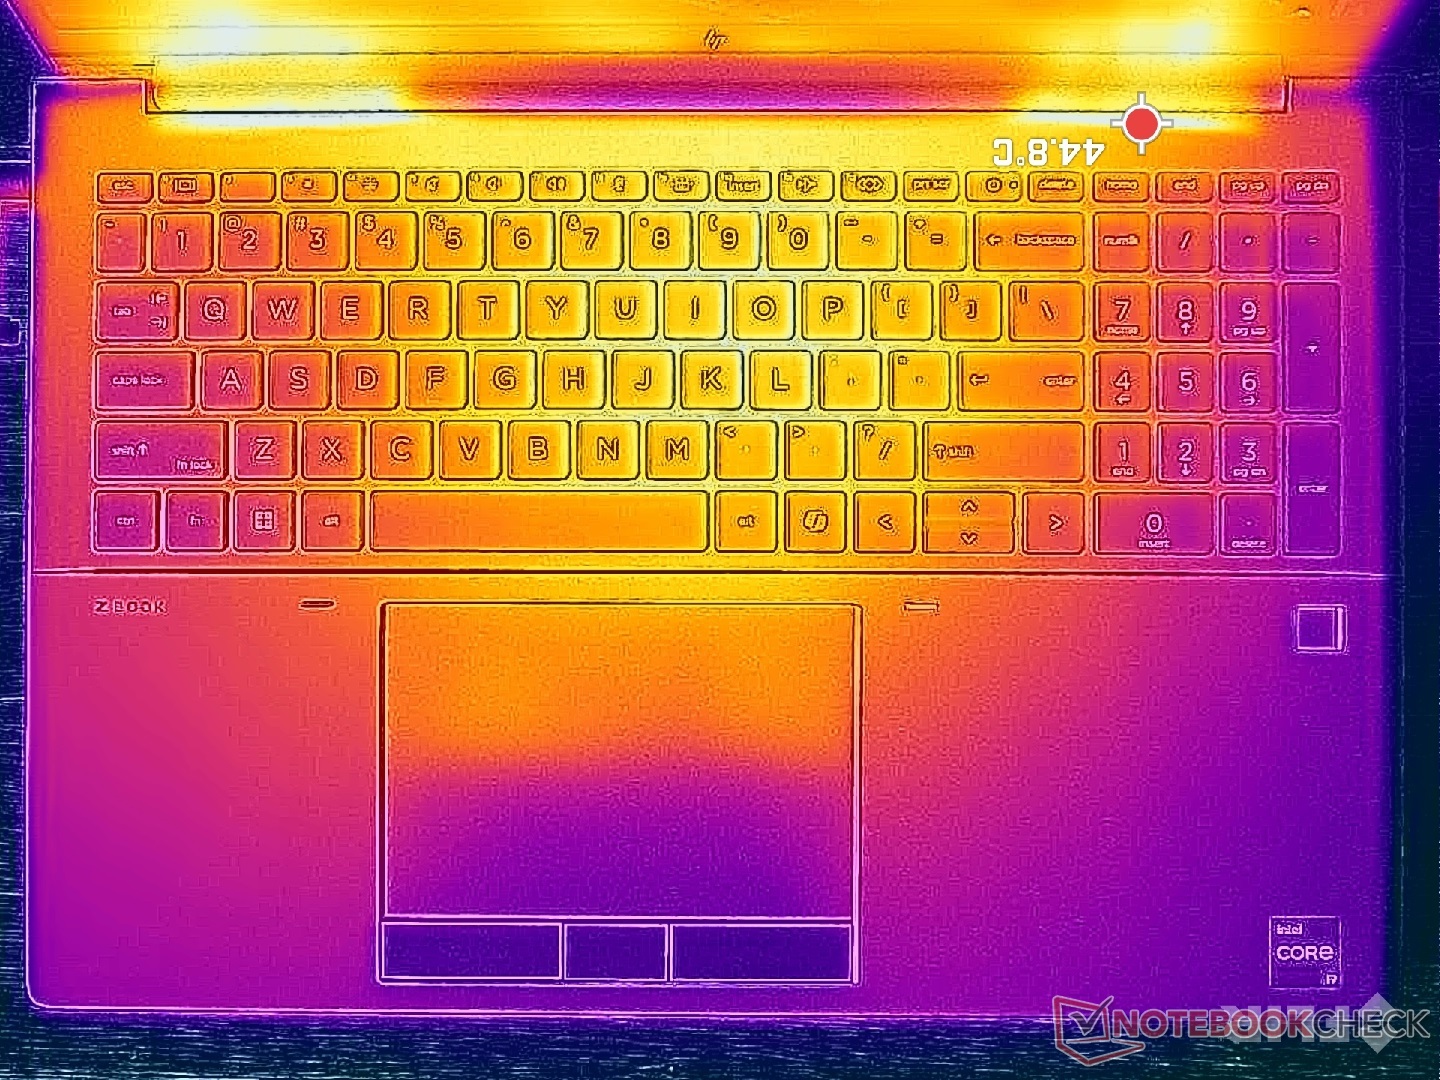
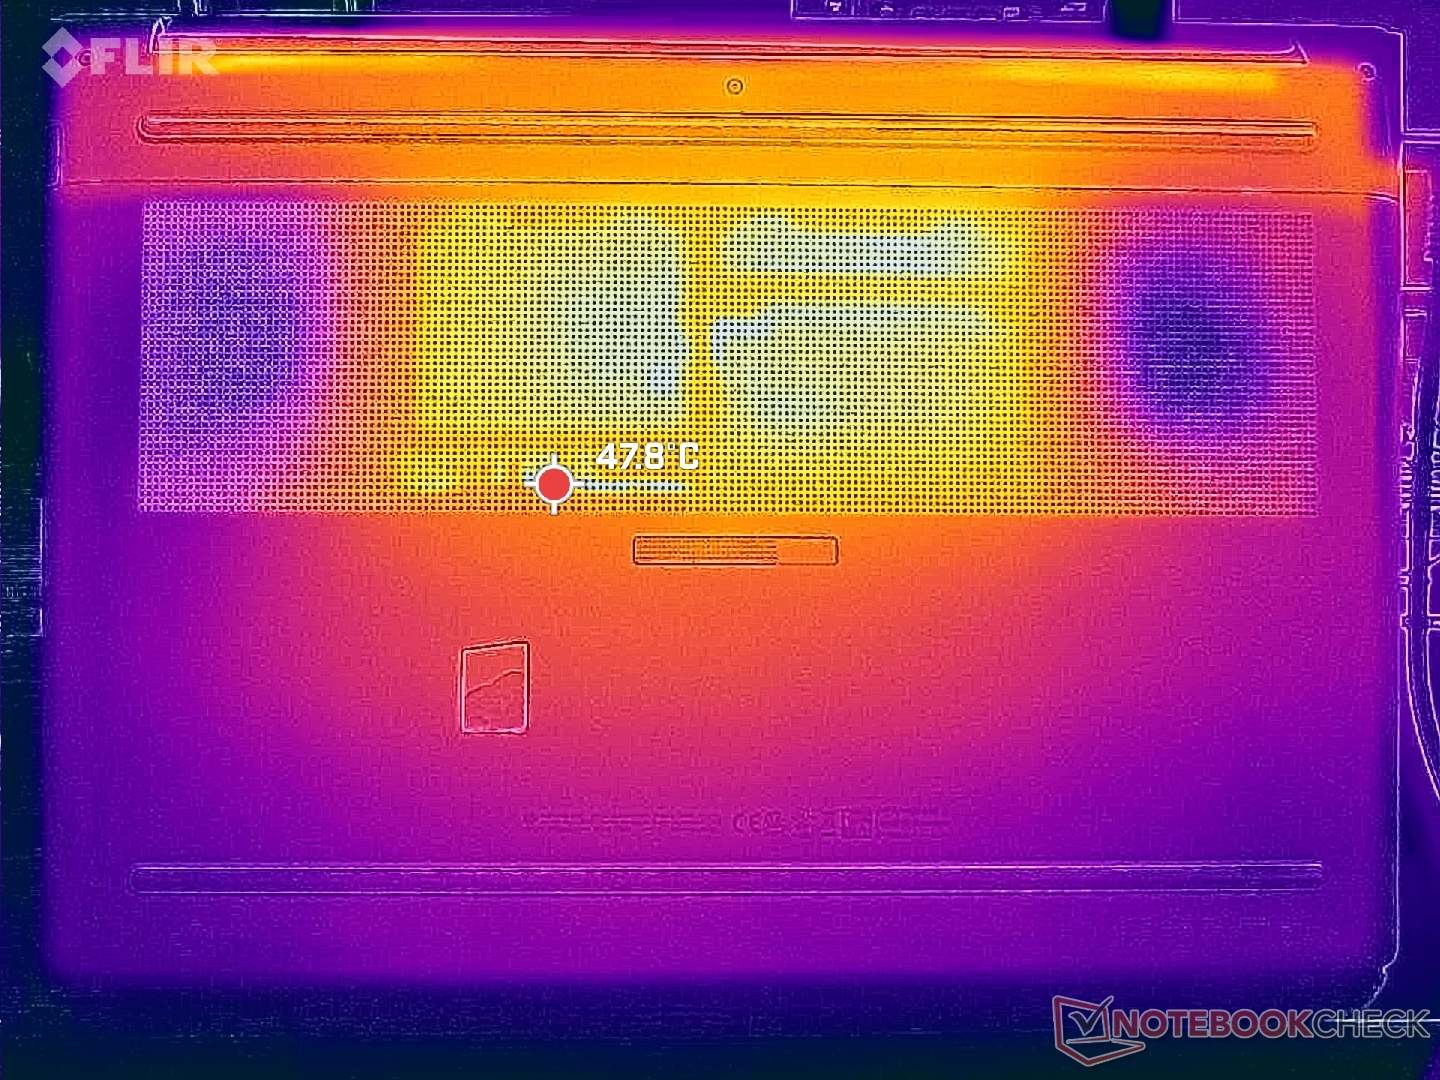
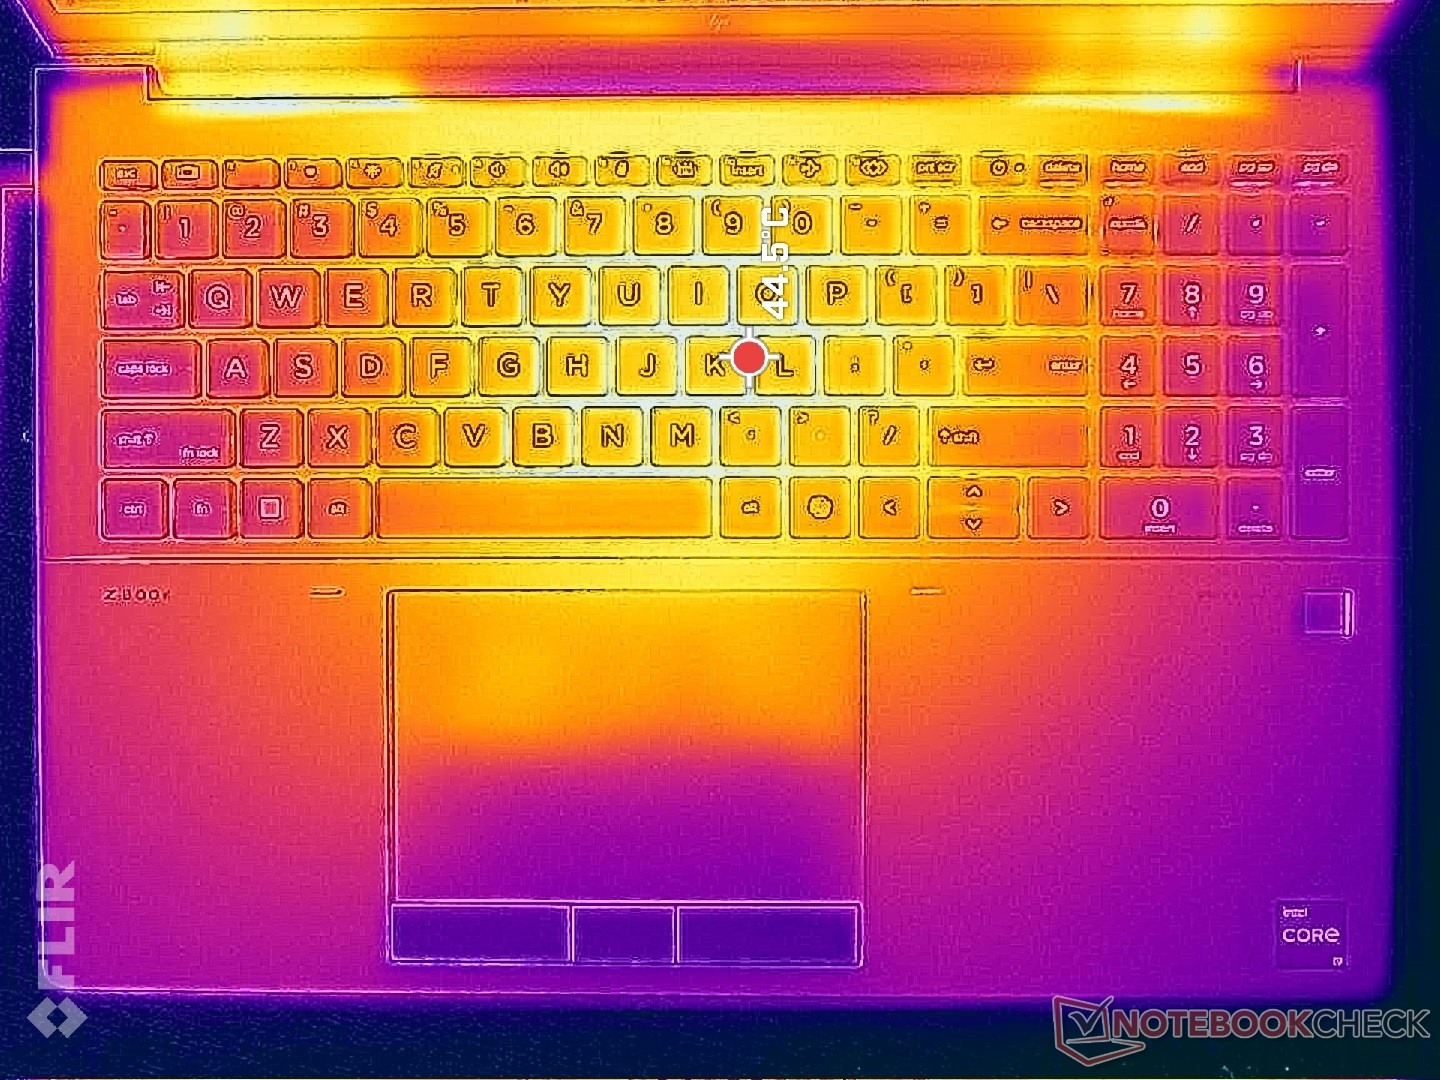
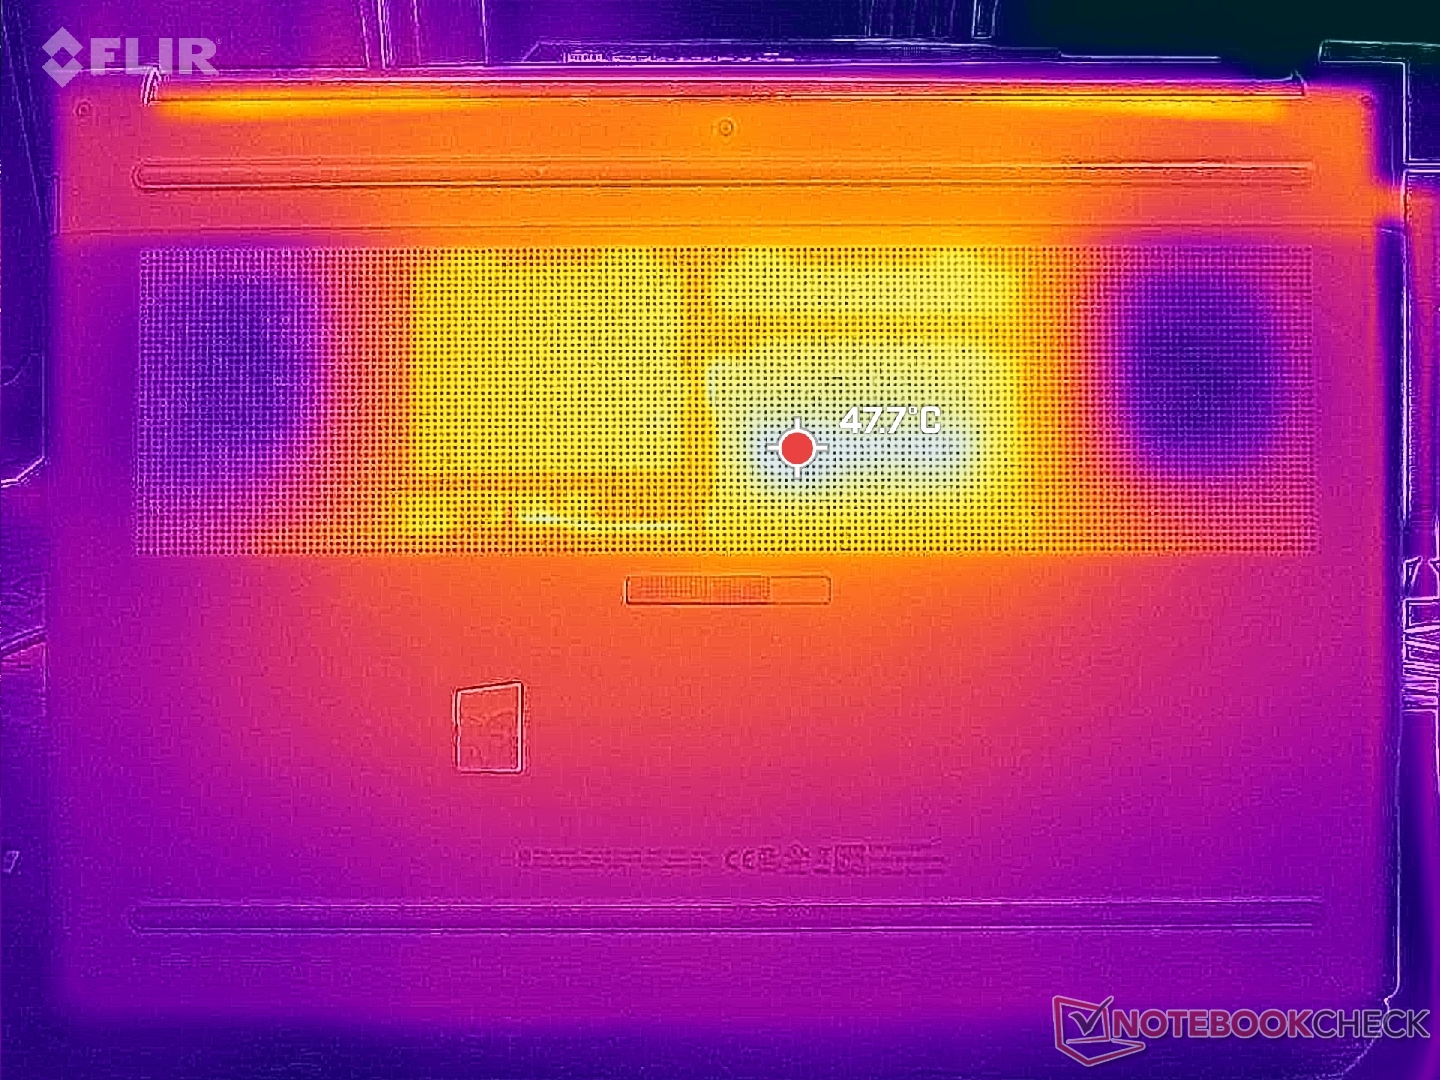
Temperatuur
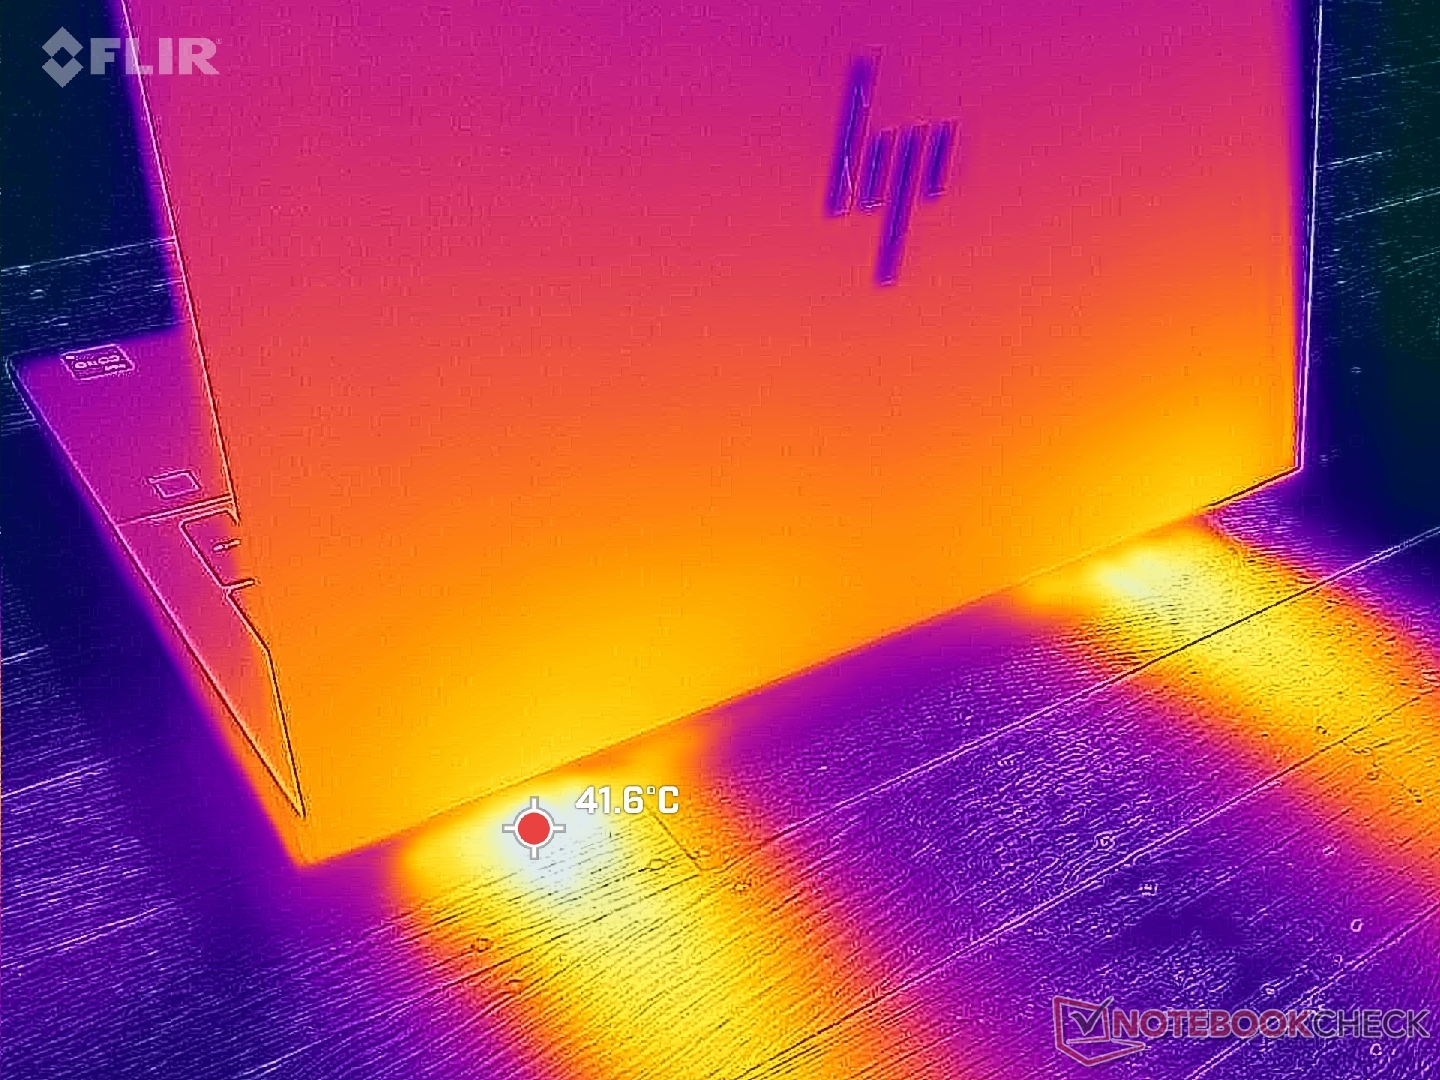
(±) De maximumtemperatuur aan de bovenzijde bedraagt 42.2 °C / 108 F, vergeleken met het gemiddelde van 38.2 °C / 101 F, variërend van 22.2 tot 69.8 °C voor de klasse Workstation.
(-) De bodem warmt op tot een maximum van 48 °C / 118 F, vergeleken met een gemiddelde van 41.2 °C / 106 F
(±) Bij onbelast gebruik bedraagt de gemiddelde temperatuur voor de bovenzijde 33.8 °C / 93 F, vergeleken met het apparaatgemiddelde van 32 °C / 90 F.
(-) 3: The average temperature for the upper side is 38.5 °C / 101 F, compared to the average of 32 °C / 90 F for the class Workstation.
(±) De palmsteunen en het touchpad kunnen zeer heet aanvoelen met een maximum van ###max## °C / 99.7 F.
(-) De gemiddelde temperatuur van de handpalmsteun van soortgelijke toestellen bedroeg 27.8 °C / 82 F (-9.8 °C / -17.7 F).
| HP ZBook Fury 16 G11 Intel Core i9-14900HX, NVIDIA RTX 3500 Ada Generation Laptop GPU | HP ZBook Fury 16 G10 Intel Core i9-13950HX, Nvidia RTX 5000 Ada Generation Laptop GPU | HP ZBook Fury 16 G9 Intel Core i9-12950HX, NVIDIA RTX A5500 Laptop GPU | Dell Precision 5690 Intel Core Ultra 9 185H, Nvidia RTX 5000 Ada Generation Laptop GPU | Lenovo ThinkPad P16 G2 21FA000FGE Intel Core i7-13700HX, NVIDIA RTX 2000 Ada Generation Laptop GPU | Lenovo ThinkPad P1 G6 21FV001KUS Intel Core i7-13800H, NVIDIA GeForce RTX 4080 Laptop GPU | Asus ProArt Studiobook 16 OLED H7604 Intel Core i9-13980HX, NVIDIA GeForce RTX 4070 Laptop GPU | |
|---|---|---|---|---|---|---|---|
| Heat | 3% | 10% | 13% | 15% | 4% | 3% | |
| Maximum Upper Side * | 42.2 | 44.8 -6% | 43.2 -2% | 46.6 -10% | 47.2 -12% | 42 -0% | 44.1 -5% |
| Maximum Bottom * | 48 | 50 -4% | 50.4 -5% | 33 31% | 39.5 18% | 45.2 6% | 48 -0% |
| Idle Upper Side * | 37 | 34.4 7% | 28.6 23% | 32.4 12% | 28.1 24% | 33 11% | 32.7 12% |
| Idle Bottom * | 36.8 | 31.8 14% | 28.2 23% | 29.4 20% | 25.3 31% | 37 -1% | 34.9 5% |
* ... kleiner is beter
Luidsprekers
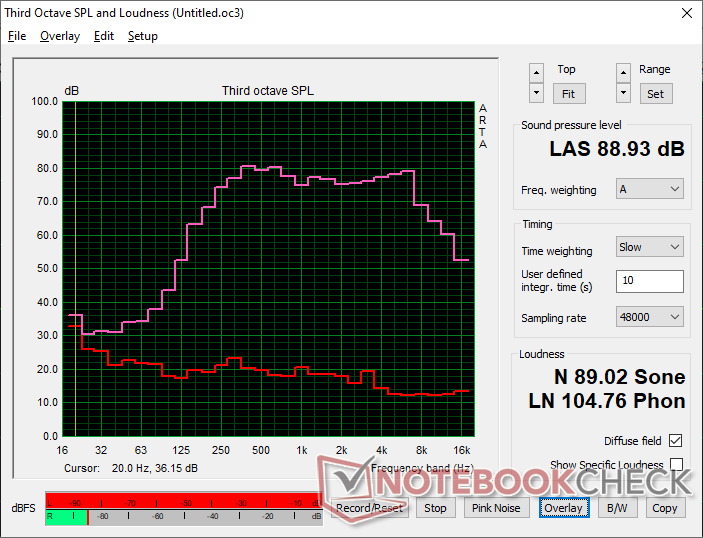
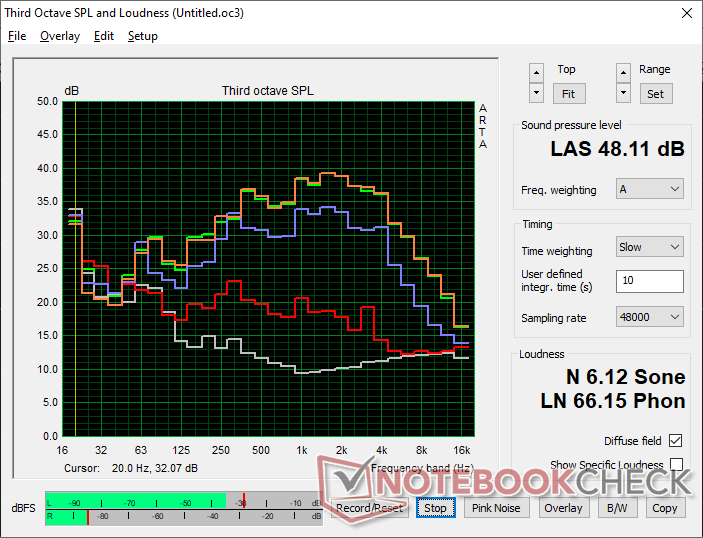
HP ZBook Fury 16 G11 audioanalyse
(+) | luidsprekers kunnen relatief luid spelen (88.9 dB)
Bas 100 - 315 Hz
(±) | verminderde zeebaars - gemiddeld 13.3% lager dan de mediaan
(±) | lineariteit van de lage tonen is gemiddeld (11.2% delta ten opzichte van de vorige frequentie)
Midden 400 - 2000 Hz
(+) | evenwichtige middens - slechts 2.2% verwijderd van de mediaan
(+) | de middentonen zijn lineair (3.2% delta ten opzichte van de vorige frequentie)
Hoog 2 - 16 kHz
(+) | evenwichtige hoogtepunten - slechts 3.7% verwijderd van de mediaan
(+) | de hoge tonen zijn lineair (4.6% delta naar de vorige frequentie)
Algemeen 100 - 16.000 Hz
(+) | het totale geluid is lineair (12.9% verschil met de mediaan)
Vergeleken met dezelfde klasse
» 17% van alle geteste apparaten in deze klasse waren beter, 6% vergelijkbaar, 76% slechter
» De beste had een delta van 7%, het gemiddelde was 18%, de slechtste was 35%
Vergeleken met alle geteste toestellen
» 11% van alle geteste apparaten waren beter, 3% gelijk, 86% slechter
» De beste had een delta van 4%, het gemiddelde was 24%, de slechtste was 134%
Apple MacBook Pro 16 2021 M1 Pro audioanalyse
(+) | luidsprekers kunnen relatief luid spelen (84.7 dB)
Bas 100 - 315 Hz
(+) | goede baars - slechts 3.8% verwijderd van de mediaan
(+) | de lage tonen zijn lineair (5.2% delta naar de vorige frequentie)
Midden 400 - 2000 Hz
(+) | evenwichtige middens - slechts 1.3% verwijderd van de mediaan
(+) | de middentonen zijn lineair (2.1% delta ten opzichte van de vorige frequentie)
Hoog 2 - 16 kHz
(+) | evenwichtige hoogtepunten - slechts 1.9% verwijderd van de mediaan
(+) | de hoge tonen zijn lineair (2.7% delta naar de vorige frequentie)
Algemeen 100 - 16.000 Hz
(+) | het totale geluid is lineair (4.6% verschil met de mediaan)
Vergeleken met dezelfde klasse
» 0% van alle geteste apparaten in deze klasse waren beter, 0% vergelijkbaar, 100% slechter
» De beste had een delta van 5%, het gemiddelde was 18%, de slechtste was 45%
Vergeleken met alle geteste toestellen
» 0% van alle geteste apparaten waren beter, 0% gelijk, 100% slechter
» De beste had een delta van 4%, het gemiddelde was 24%, de slechtste was 134%
Energiebeheer
Stroomverbruik
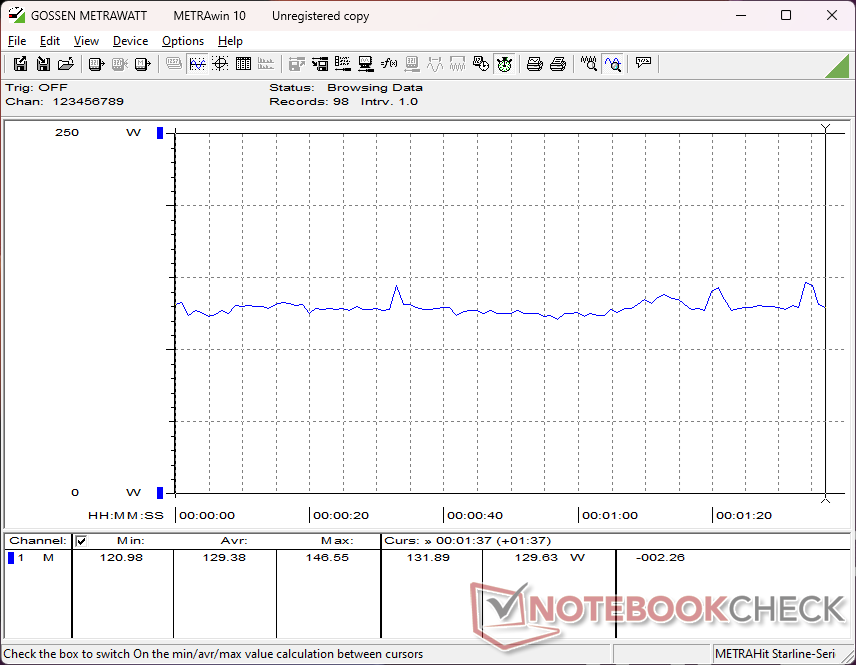
Het systeem is efficiënter wanneer het stationair draait op de desktop in vergelijking met onze ZBook Fury 16 G10 configuratie. Voor de rest is het verbruik bijna gelijk wanneer er zwaardere belastingen zoals games worden uitgevoerd, ook al zijn de geconfigureerde GPU's in onze twee voorbeelden verschillend. Prestaties-per-watt nemen dus toe bij het kiezen van duurdere GPU-configuraties in vergelijking met onze middenklasse RTX 3500 Ada.
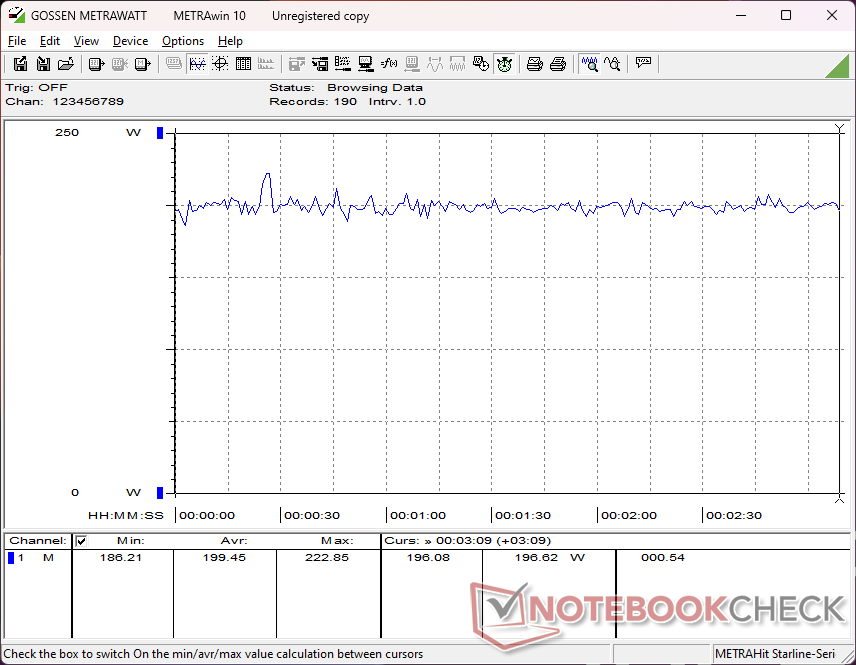
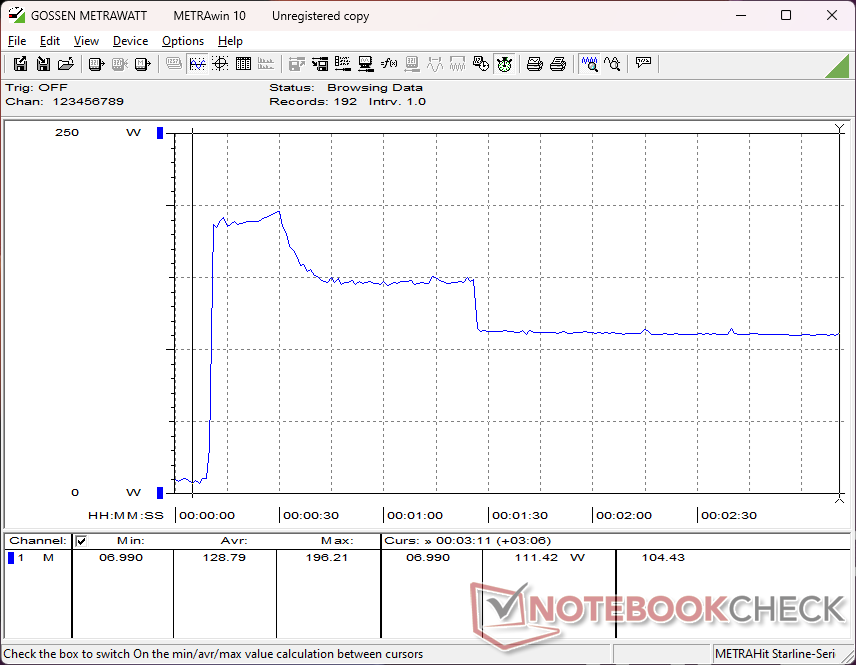
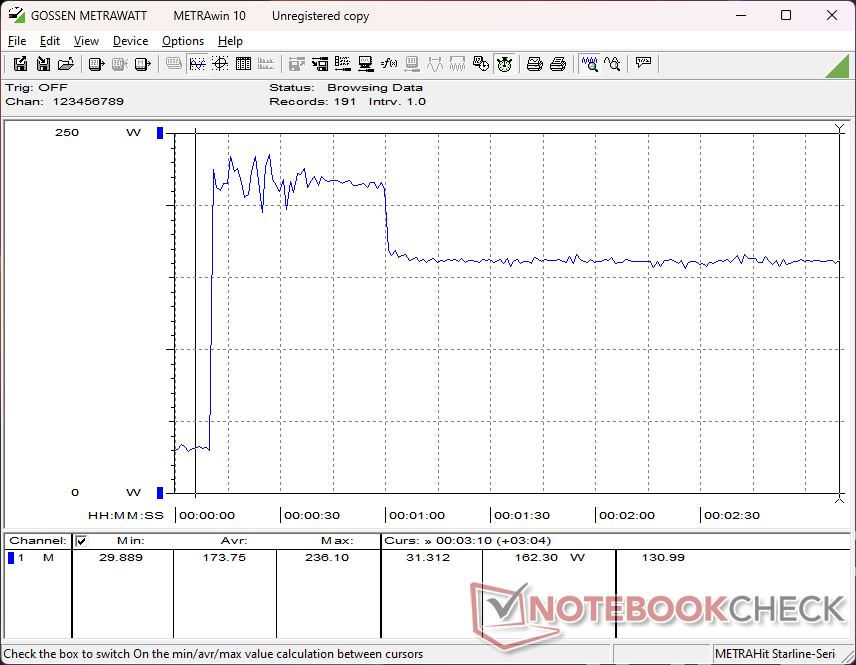
Het verbruik bij het draaien van Prime95 of CineBench R15 xT zou merkbaar hoger zijn op ons apparaat in vergelijking met het model van vorig jaar, vanwege het hogere Turbo Boost-potentieel van onze Core i9-14900HX processor. Na ongeveer een minuut daalde het verbruik echter tot bijna hetzelfde niveau als wat we gemeten hadden op het model van vorig jaar, zoals te zien is in de onderstaande vergelijkingsgrafiek die overeenkomt met onze CineBench R15 xT-lusobservaties van hierboven. Ons hogere initiële Turbo Boost-potentieel is dus het belangrijkste voordeel tussen de nieuwere Core i9-14900HX en de oudere Core i9-13950HX.
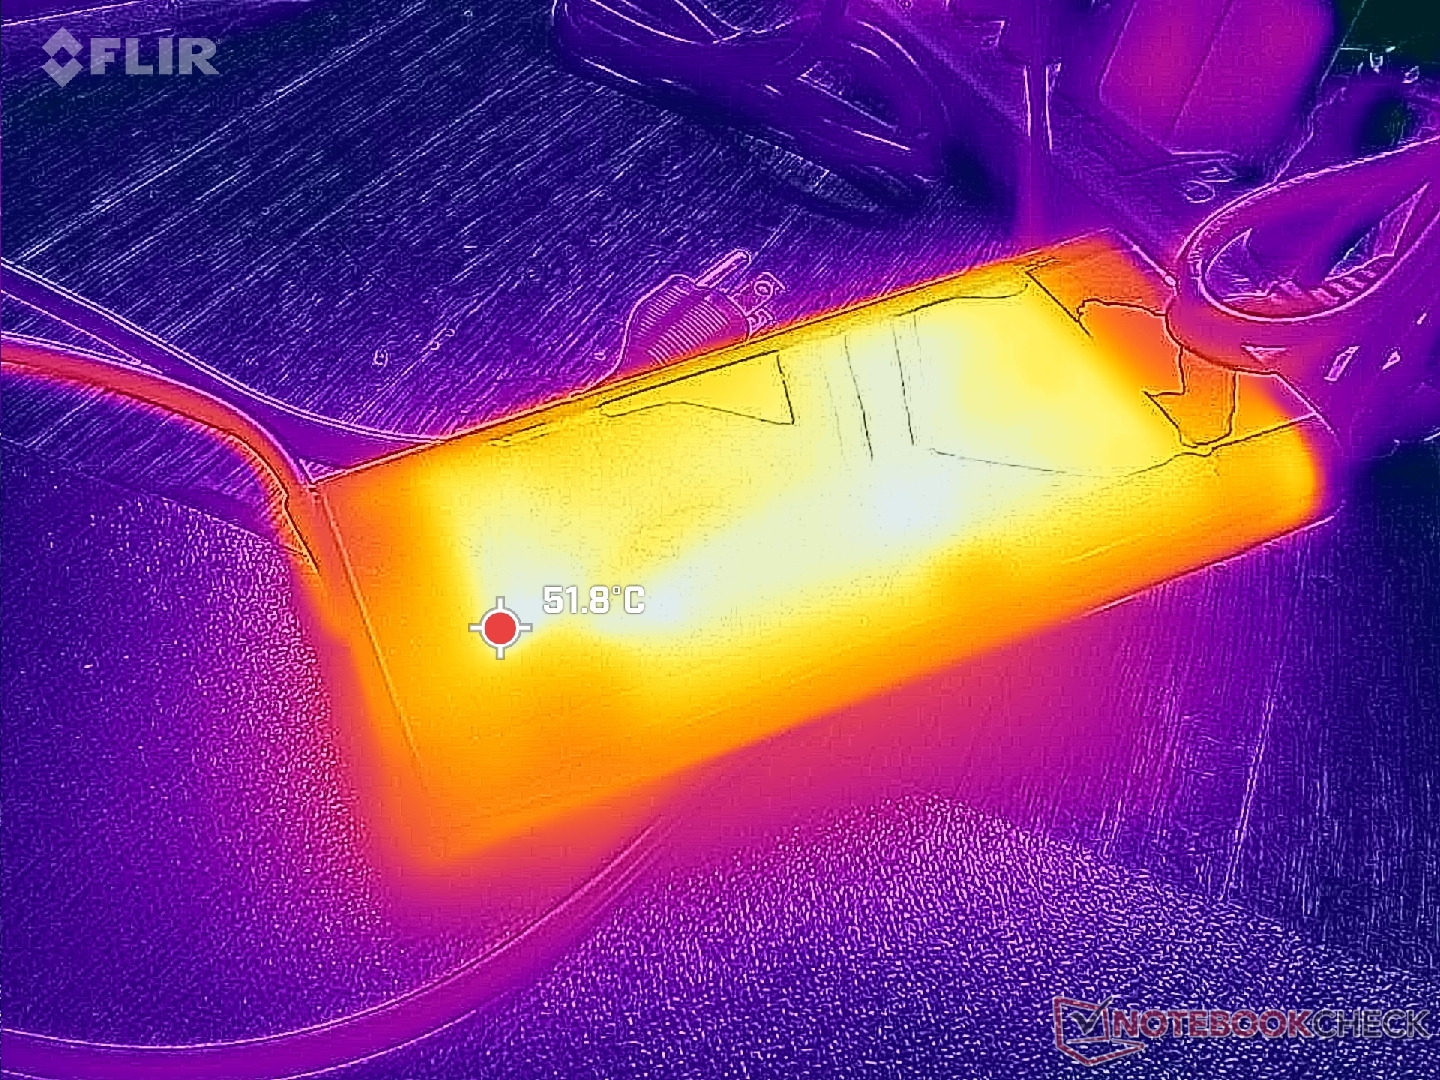
We zijn in staat om een maximaal verbruik van 236 W te registreren van de grote (~18 x 8,8 x 2,5 cm) 230 W AC-adapter wanneer de CPU en GPU elk op 100% gebruik staan.
| Uit / Standby | |
| Inactief | |
| Belasting |
|
Key:
min: | |
| HP ZBook Fury 16 G11 i9-14900HX, NVIDIA RTX 3500 Ada Generation Laptop GPU, SK hynix PC801 HFS001TEJ9X101N, IPS, 3840x2400, 16" | HP ZBook Fury 16 G10 i9-13950HX, NVIDIA RTX 5000 Ada Generation Laptop GPU, SK hynix PC801 HFS001TEJ9X101N, IPS, 3840x2400, 16" | HP ZBook Fury 16 G9 i9-12950HX, RTX A5500 Laptop GPU, Micron 3400 1TB MTFDKBA1T0TFH, IPS, 3840x2400, 16" | Dell Precision 5690 Ultra 9 185H, NVIDIA RTX 5000 Ada Generation Laptop GPU, 2x Samsung PM9A1 1TB (RAID 0), OLED, 3840x2400, 16" | Lenovo ThinkPad P16 G2 21FA000FGE i7-13700HX, NVIDIA RTX 2000 Ada Generation Laptop GPU, SK hynix PC801 HFS001TEJ9X162N, IPS LED, 2560x1600, 16" | Lenovo ThinkPad P1 G6 21FV001KUS i7-13800H, NVIDIA GeForce RTX 4080 Laptop GPU, Kioxia XG8 KXG8AZNV1T02, OLED, 3480x2400, 16" | Asus ProArt Studiobook 16 OLED H7604 i9-13980HX, NVIDIA GeForce RTX 4070 Laptop GPU, Phison EM2804TBMTCB47, OLED, 3200x2000, 16" | |
|---|---|---|---|---|---|---|---|
| Power Consumption | -34% | -77% | -1% | 4% | 7% | -24% | |
| Idle Minimum * | 8.6 | 15.3 -78% | 19.5 -127% | 7.9 8% | 9.3 -8% | 8 7% | 12.8 -49% |
| Idle Average * | 14.8 | 18.2 -23% | 29 -96% | 12 19% | 14.1 5% | 9.5 36% | 19.9 -34% |
| Idle Maximum * | 15.7 | 28 -78% | 40.7 -159% | 28.6 -82% | 15.5 1% | 23.7 -51% | 20.3 -29% |
| Load Average * | 129.4 | 137.9 -7% | 142.1 -10% | 98.8 24% | 133.6 -3% | 97.2 25% | 131.4 -2% |
| Cyberpunk 2077 ultra external monitor * | 192.6 | ||||||
| Cyberpunk 2077 ultra * | 199.4 | ||||||
| Load Maximum * | 236.1 | 202 14% | 224.4 5% | 174.8 26% | 179.6 24% | 197.2 16% | 246.8 -5% |
| Witcher 3 ultra * | 189.4 | 188.6 | 144.5 | 144.9 | 144 | 196.5 |
* ... kleiner is beter
Power Consumption Cyberpunk / Stress Test
Power Consumption external Monitor
Levensduur batterij
De looptijden zijn vergelijkbaar met die van de ZBook Fury 16 G11 van vorig jaar, zo niet iets korter, waarschijnlijk door het hogere Turbo Boost-plafond voor de Raptor Lake-HX Refresh CPU. Concurrerende modellen zoals de Precision 5690 of ThinkPad P16 G2 gaan in vergelijking elk minstens een uur of zo langer mee.
Het opladen van lege naar volle capaciteit met de meegeleverde netstroomadapter gaat met iets meer dan 60 minuten relatief snel.
| HP ZBook Fury 16 G11 i9-14900HX, NVIDIA RTX 3500 Ada Generation Laptop GPU, 95 Wh | HP ZBook Fury 16 G10 i9-13950HX, NVIDIA RTX 5000 Ada Generation Laptop GPU, 95 Wh | HP ZBook Fury 16 G9 i9-12950HX, RTX A5500 Laptop GPU, 95 Wh | Dell Precision 5690 Ultra 9 185H, NVIDIA RTX 5000 Ada Generation Laptop GPU, 98 Wh | Lenovo ThinkPad P16 G2 21FA000FGE i7-13700HX, NVIDIA RTX 2000 Ada Generation Laptop GPU, 94 Wh | Lenovo ThinkPad P1 G6 21FV001KUS i7-13800H, NVIDIA GeForce RTX 4080 Laptop GPU, 90 Wh | Asus ProArt Studiobook 16 OLED H7604 i9-13980HX, NVIDIA GeForce RTX 4070 Laptop GPU, 90 Wh | |
|---|---|---|---|---|---|---|---|
| Batterijduur | 8% | -10% | 37% | 28% | -37% | -17% | |
| WiFi v1.3 | 402 | 435 8% | 360 -10% | 549 37% | 515 28% | 252 -37% | 334 -17% |
| Reader / Idle | 319 | ||||||
| Load | 71 | 65 | |||||
| H.264 | 358 |
Pro
Contra
Verdict - Sterk ontwerp aangetast door beperkte turboboost
Wij zijn dol op het ontwerp van de ZBook Fury 16 G11. Hoewel hij hetzelfde is gebleven als de Fury 16 G9, zijn het onderhoudsgemak, de uitgebreide configureerbare opties, de ECC RAM-ondersteuning en het comfortabele toetsenbord en touchpad de juiste afvinklijstjes voor werkstationgebruikers.
De grootste problemen met de ZBook Fury 16 G11 zijn echter de prestaties. Wanneer een andere laptop zoals de Lenovo Legion 9 16IRX9 exact dezelfde Core i9-14900HX CPU tot 20 procent sneller kan laten draaien dan onze ZBook, dan kan de koeloplossing in de HP zeker een upgrade gebruiken om hogere Turbo Boost snelheden langer te ondersteunen. Ook de M.2 SSD's zouden om dezelfde reden baat kunnen hebben bij hitteverspreiders, omdat ze ook zouden haperen wanneer ze onder druk komen te staan. Deze beperkingen doen afbreuk aan de voordelen van de Core i9 CPU en PCIe4 SSD, omdat ze potentieel sneller kunnen presteren op concurrerende machines van Dell of Lenovo.
De ZBook Fury 16 G11 is slechts een kleine update ten opzichte van de ZBook Fury G10 van vorig jaar. Hoewel hij er nog steeds geweldig uitziet en goed aanvoelt, hebben de prestaties de neiging om te haperen bij zwaardere gebruiksscenario's.
Tot slot is het een beetje jammer dat het model geen Meteor Lake opties biedt voor geen lokale AI-versnelling. Toegegeven, zo'n functie is waarschijnlijk alleen aantrekkelijk voor een kleine subset van werkstationgebruikers, maar het zou geholpen hebben om de Fury 16 G11 verder te onderscheiden van de Fury 16 G10. U kunt in wezen dezelfde prestaties en functies krijgen van de nauwelijks een jaar oude Fury 16 G10 als op de nieuwste Fury 16 G11.
Prijs en beschikbaarheid
De ZBook Fury 16 G11 wordt momenteel geleverd voor ongeveer $3400 als hij geconfigureerd is met de Core i9-14900HX en RTX 3500 Ada, tot meer dan $5500 als hij volledig geconfigureerd is met de RTX 5000 Ada.
Hinweis: We hebben ons beoordelingssysteem kürzlich geactualiseerd en de resultaten van versie 8 zijn niet vergelijkbaar met de resultaten van versie 7. Meer informatie vindt u hier beschikbaar.
Opmerking: We hebben ons beoordelingssysteem onlangs bijgewerkt en de resultaten van versie 8 zijn niet vergelijkbaar met de resultaten van versie 7. Meer informatie is beschikbaar hier .
HP ZBook Fury 16 G11
- 12-08-2024 v8
Allen Ngo
 Total Sustainability Score:
 Transparantie
De selectie van te beoordelen apparaten wordt gemaakt door onze redactie. Het testexemplaar werd ten behoeve van deze beoordeling door de fabrikant of detailhandelaar in bruikleen aan de auteur verstrekt. De kredietverstrekker had geen invloed op deze recensie, noch ontving de fabrikant vóór publicatie een exemplaar van deze recensie. Er bestond geen verplichting om deze recensie te publiceren. Wij accepteren nooit een compensatie of betaling in ruil voor onze beoordelingen. Als onafhankelijk mediabedrijf is Notebookcheck niet onderworpen aan het gezag van fabrikanten, detailhandelaren of uitgevers.
[transparency_disclaimer]Dit is hoe Notebookcheck test
Elk jaar beoordeelt Notebookcheck onafhankelijk honderden laptops en smartphones met behulp van gestandaardiseerde procedures om ervoor te zorgen dat alle resultaten vergelijkbaar zijn. We hebben onze testmethoden al zo'n 20 jaar voortdurend ontwikkeld en daarbij de industriestandaard bepaald. In onze testlaboratoria wordt gebruik gemaakt van hoogwaardige meetapparatuur door ervaren technici en redacteuren. Deze tests omvatten een validatieproces in meerdere fasen. Ons complexe beoordelingssysteem is gebaseerd op honderden goed onderbouwde metingen en benchmarks, waardoor de objectiviteit behouden blijft. Meer informatie over onze testmethoden kunt u hier vinden.
Price comparison

