

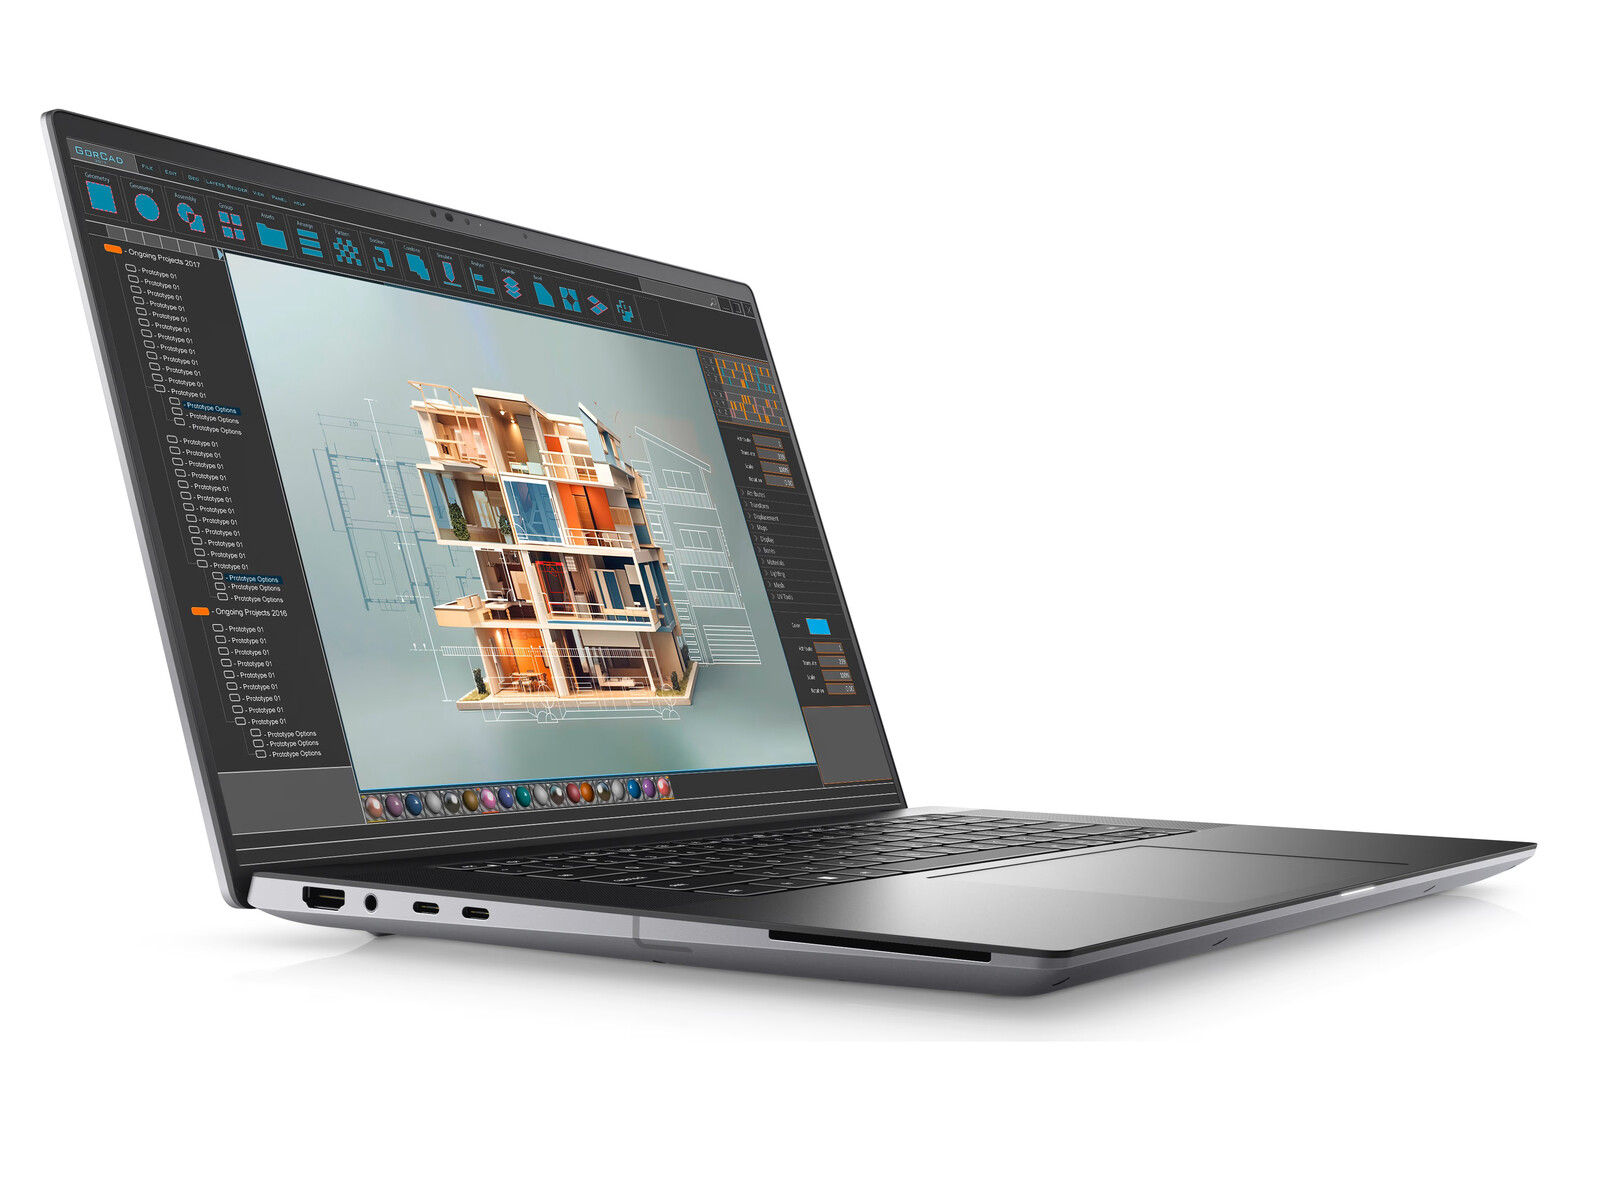
Dell Precision 5690 werkstation review: Klaar voor de AI-revolutie

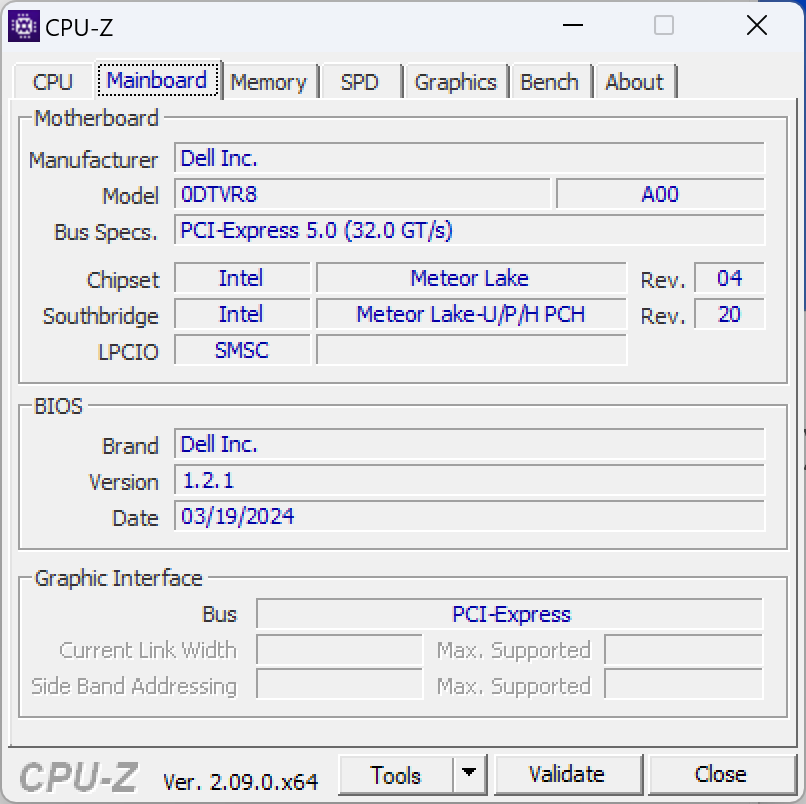
De Precision 5690 volgt de Precision 5680 van vorig jaar op door de oudere Raptor Lake-H CPU's te vervangen door nieuwere Meteor Lake-H CPU's, compleet met geïntegreerde NPU's. De twee modellen zijn verder identiek met hetzelfde beeldscherm en dezelfde GPU-opties. We raden u aan om onze recensie van de Precision 5680 om meer te weten te komen over de op de XPS 16 geïnspireerde fysieke kenmerken van de serie.
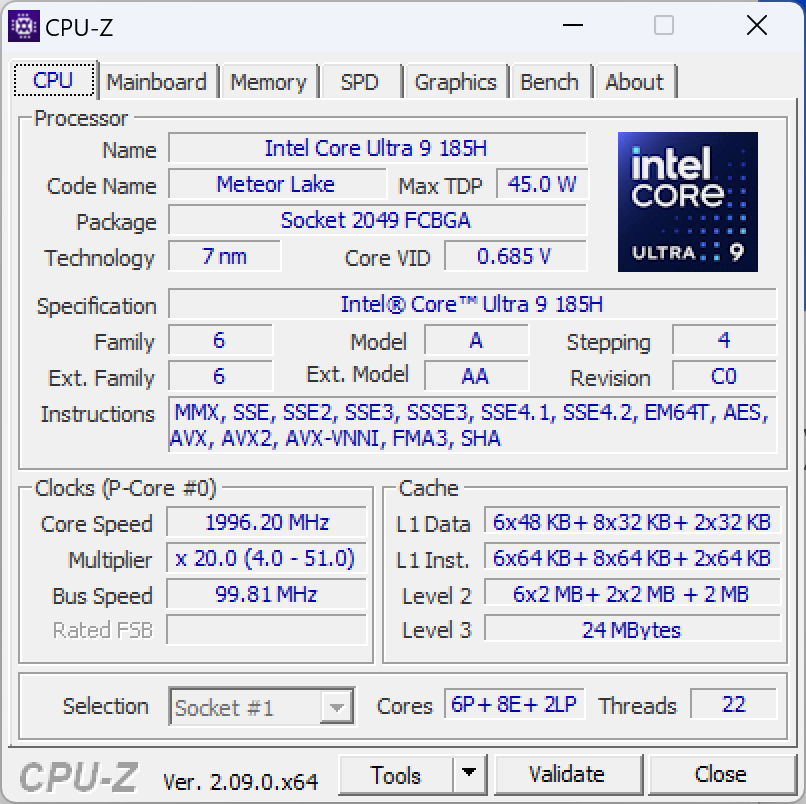
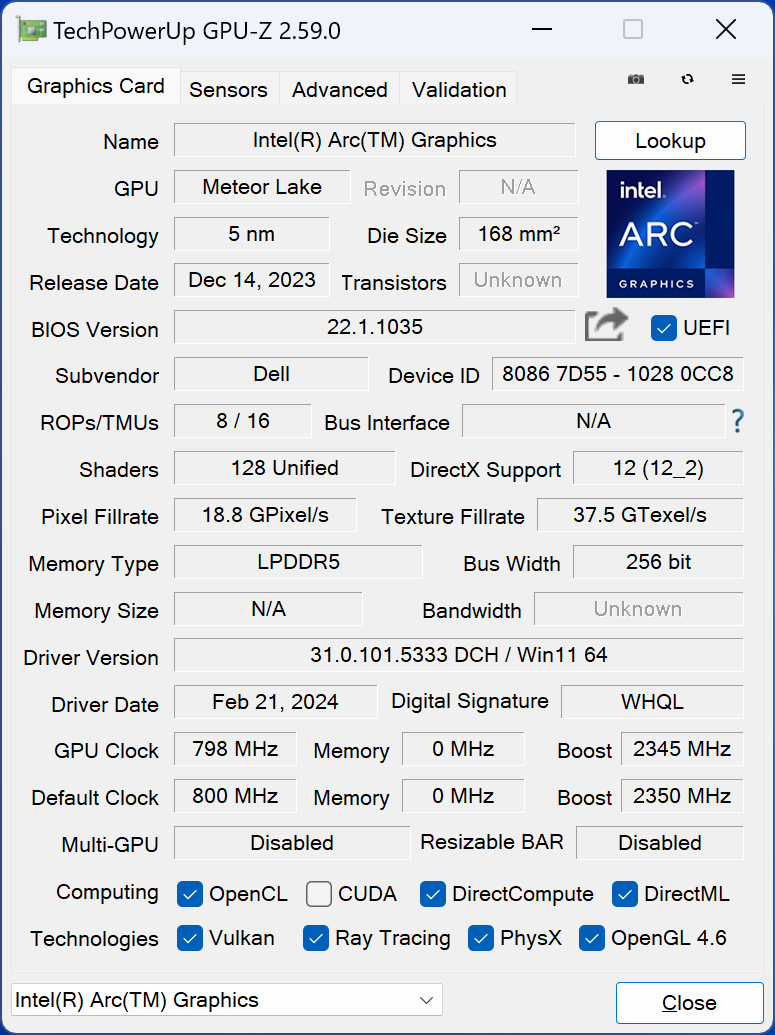
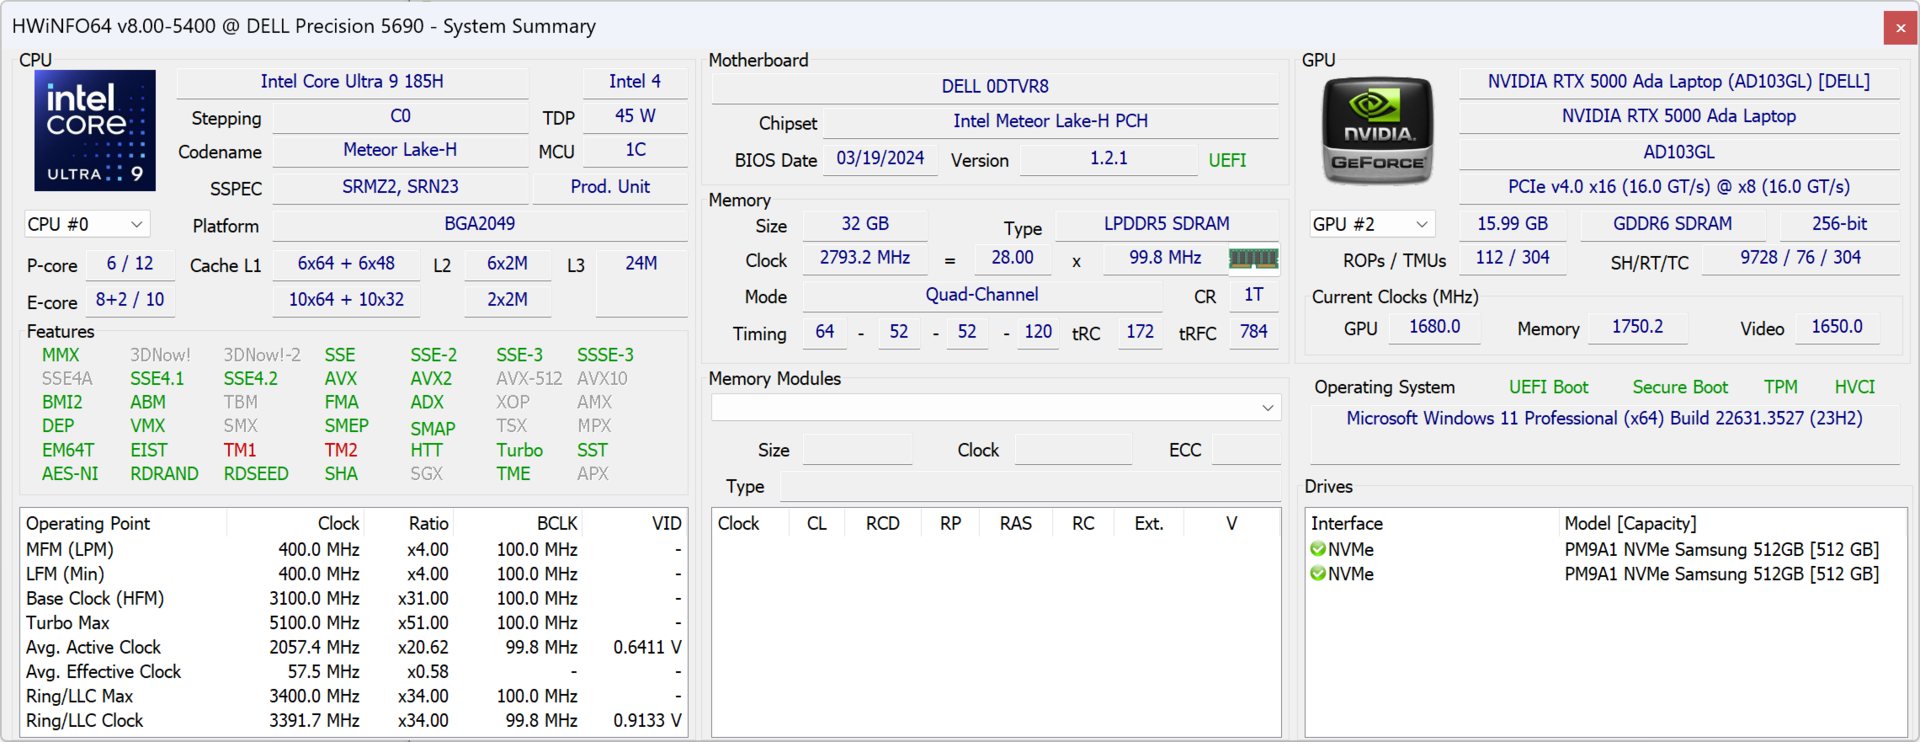
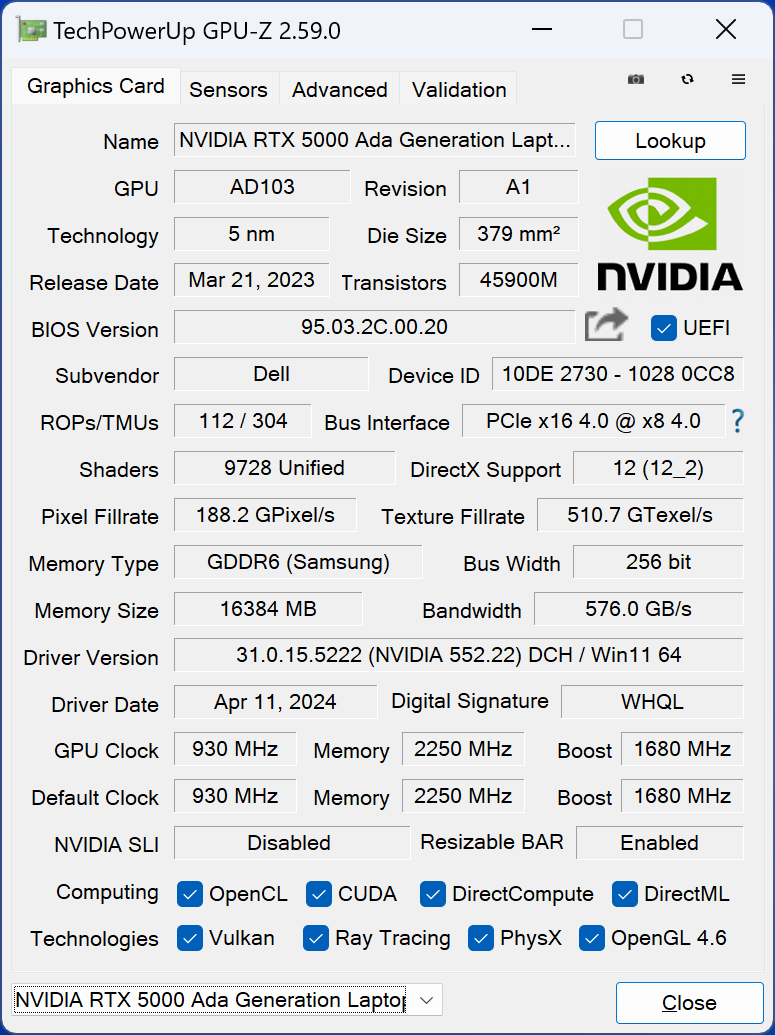
De door ons besproken unit is de meest geavanceerde configuratie met de Core Ultra 9 185H vPro CPU, Nvidia 5000 Ada GPU en een 16-inch 2400p OLED-touchscreen voor ongeveer $5900 USD. Kleinere SKU's beginnen met de Core Ultra 5 135H vPro, alleen geïntegreerde Arc graphics en een 1200p IPS-scherm voor slechts $2300.
Alternatieven voor de Precision 5690 zijn andere 16-inch werkstations zoals de Lenovo ThinkPad P16 G2, HP ZBook Fury 16 G10of de MSI CreatorPro Z16P.
Meer Dell beoordelingen:
Potentiële concurrenten in vergelijkings
Evaluatie | Datum | Model | Gewicht | Hoogte | Formaat | Resolutie | Beste prijs |
|---|---|---|---|---|---|---|---|
| 88.3 % v7 (old) | 05-2024 | Dell Precision 5690 Ultra 9 185H, NVIDIA RTX 5000 Ada Generation Laptop GPU | 2.3 kg | 22.17 mm | 16.00" | 3840x2400 | |
| 89 % v7 (old) | 08-2023 | Dell Precision 5000 5680 i9-13900H, NVIDIA RTX 5000 Ada Generation Laptop GPU | 2.3 kg | 22.17 mm | 16.00" | 3840x2400 | |
| 90.2 % v7 (old) | 03-2024 | Lenovo ThinkPad P16 G2 21FA000FGE i7-13700HX, NVIDIA RTX 2000 Ada Generation Laptop GPU | 3 kg | 30.23 mm | 16.00" | 2560x1600 | |
| 91.7 % v7 (old) | 10-2023 | Lenovo ThinkPad P1 G6-21FV000DGE i9-13900H, NVIDIA RTX 2000 Ada Generation Laptop GPU | 1.9 kg | 17.5 mm | 16.00" | 2560x1600 | |
| 92.3 % v7 (old) | 09-2023 | HP ZBook Fury 16 G10 i9-13950HX, NVIDIA RTX 5000 Ada Generation Laptop GPU | 2.6 kg | 28.5 mm | 16.00" | 3840x2400 | |
| 84.3 % v7 (old) | 11-2022 | MSI CreatorPro Z16P B12UKST i7-12700H, RTX A3000 Laptop GPU | 2.4 kg | 19 mm | 16.00" | 2560x1600 |
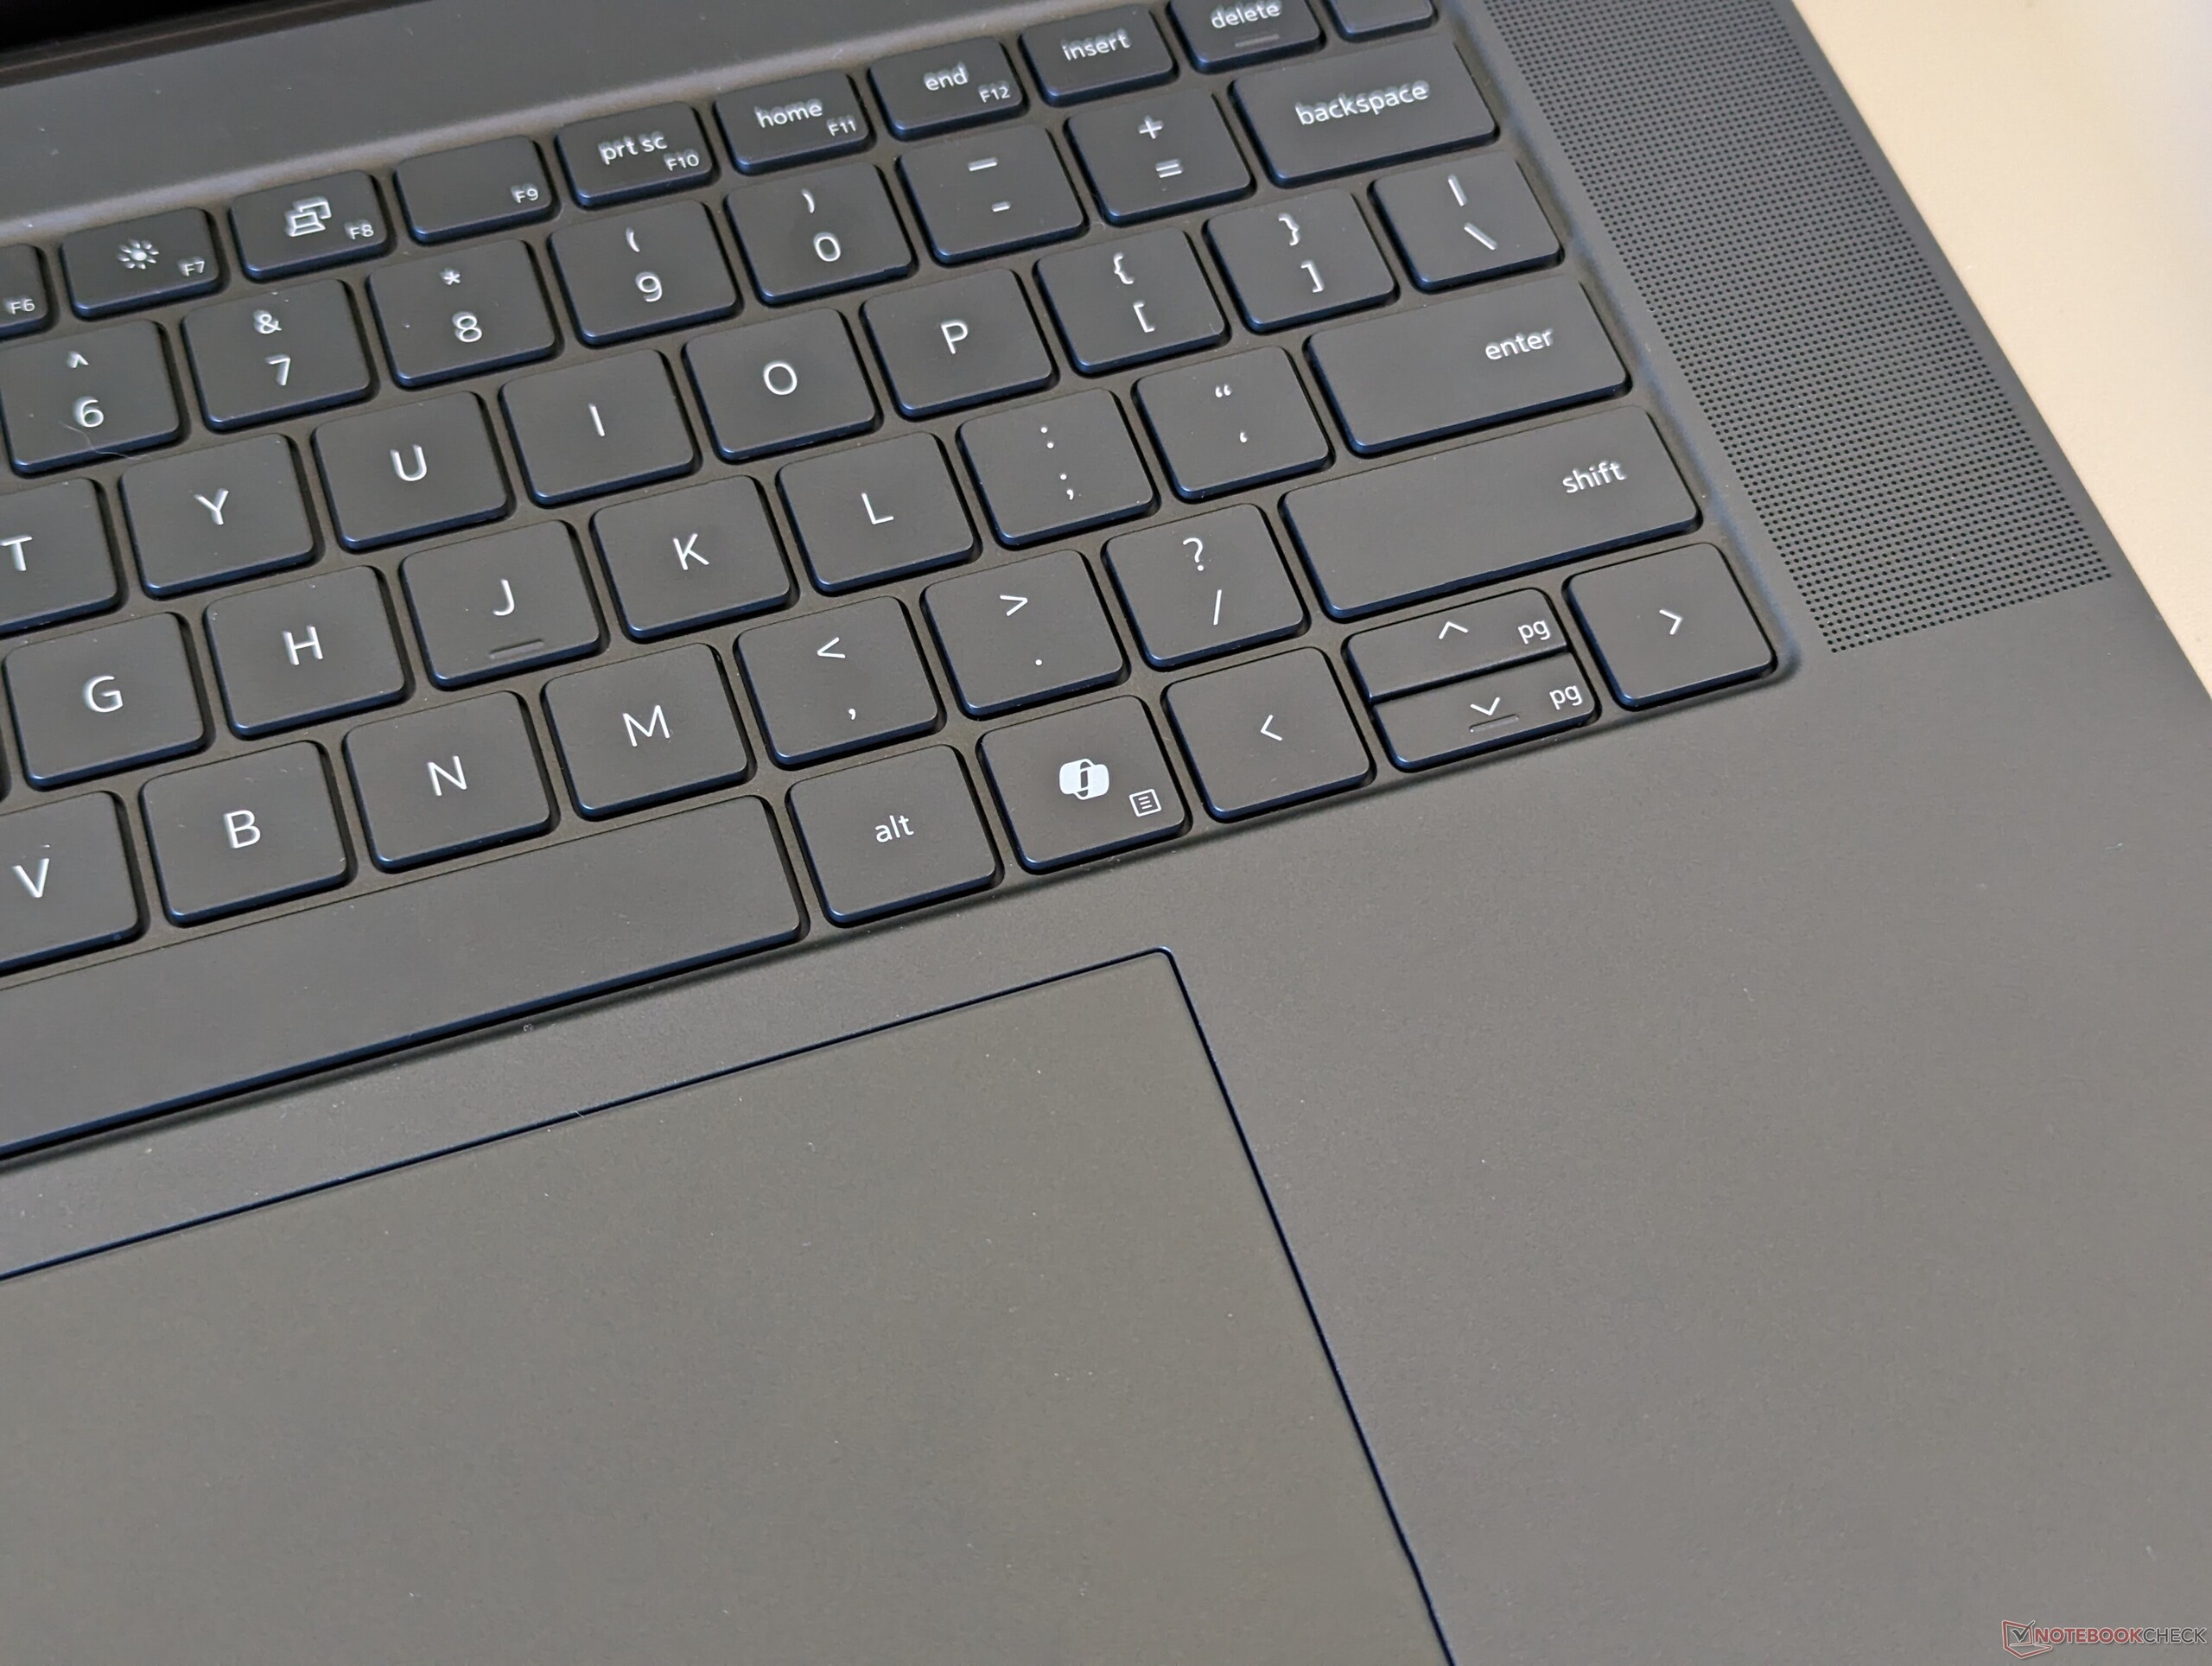
Behuizing - Geïnspireerd door XPS 16
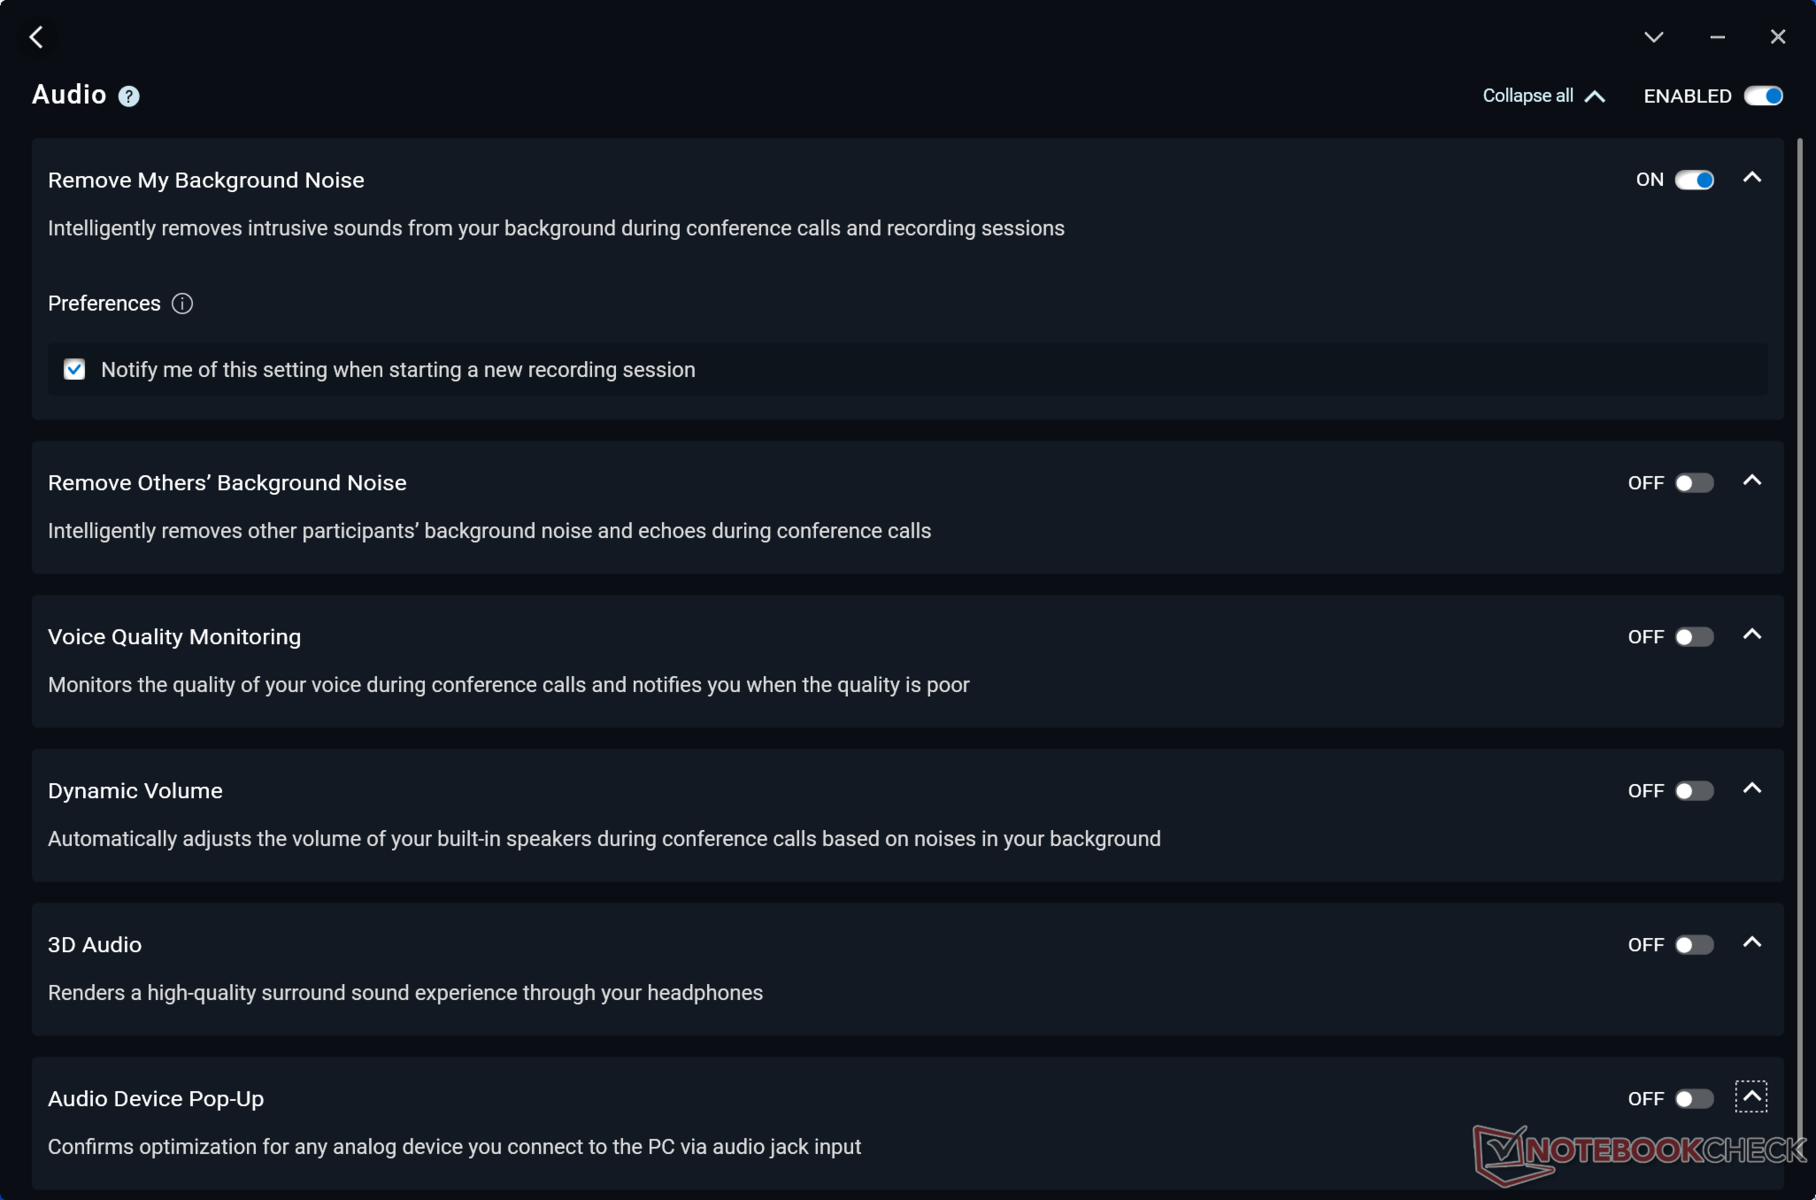
Het toetsenbord bevat nu een speciale Microsoft Co-Pilot-toets in plaats van de rechter Ctrl-toets om de Precision 5690 visueel te onderscheiden van de 5680.
Connectiviteit


Communicatie
WLAN is geüpgraded van de Intel AX211 naar de Intel BE200 om Wi-Fi 7 connectiviteit te ondersteunen. De overgrote meerderheid van de gebruikers is echter nog steeds beperkt tot Wi-Fi 6E of oudere netwerken en dus zullen de meesten voorlopig geen prestatievoordelen merken.
Webcam

")
")
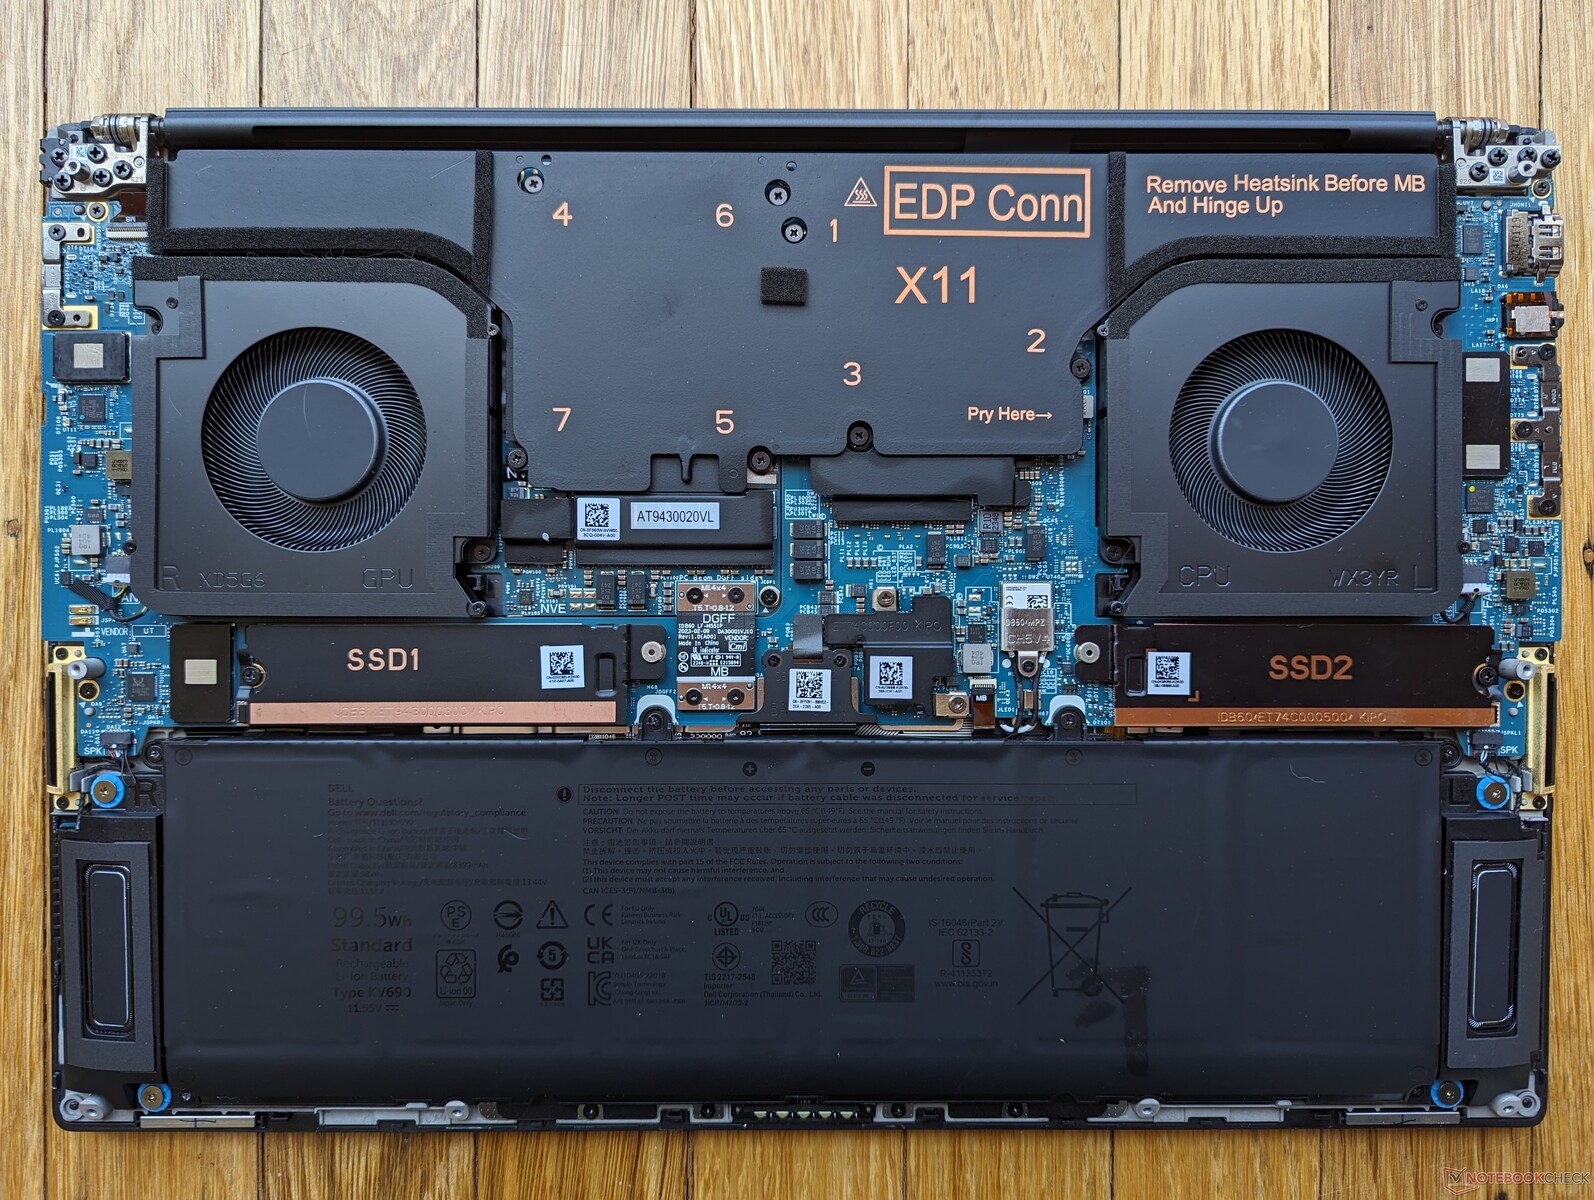
Onderhoud
Er zijn geen noemenswaardige interne verschillen tussen de Precision 5690 en de oudere 5680.

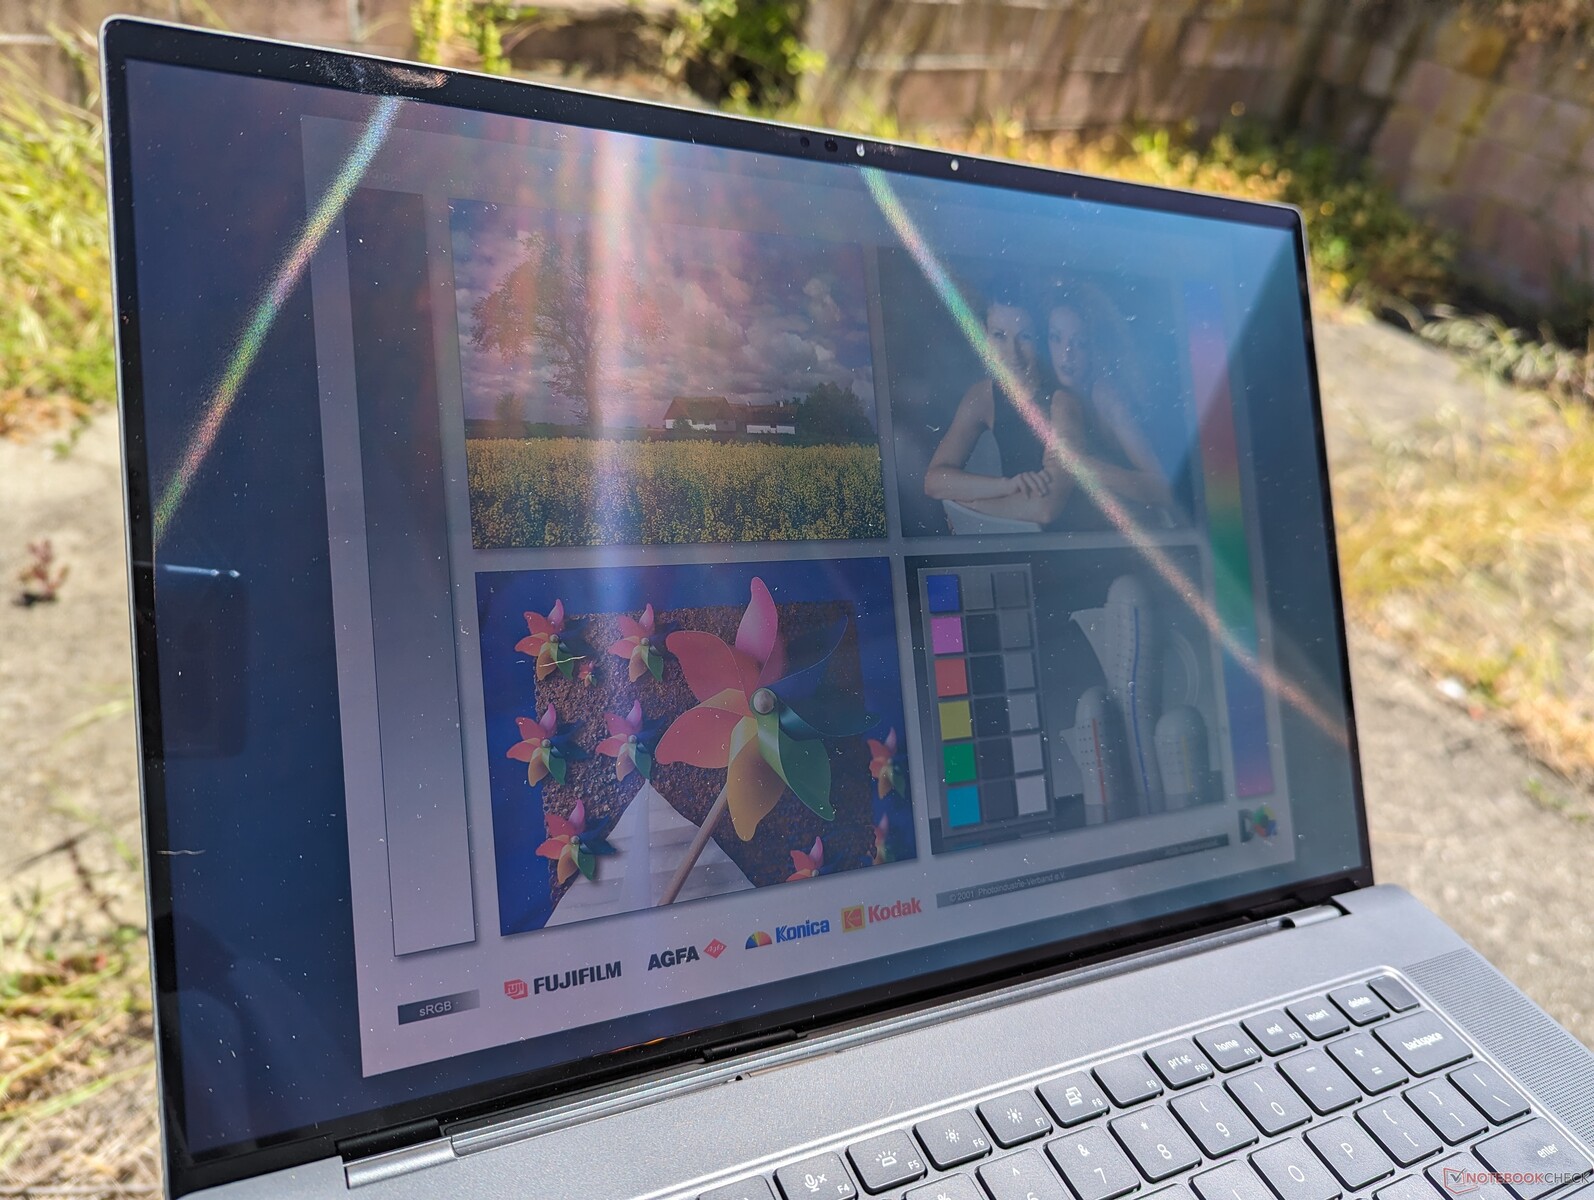
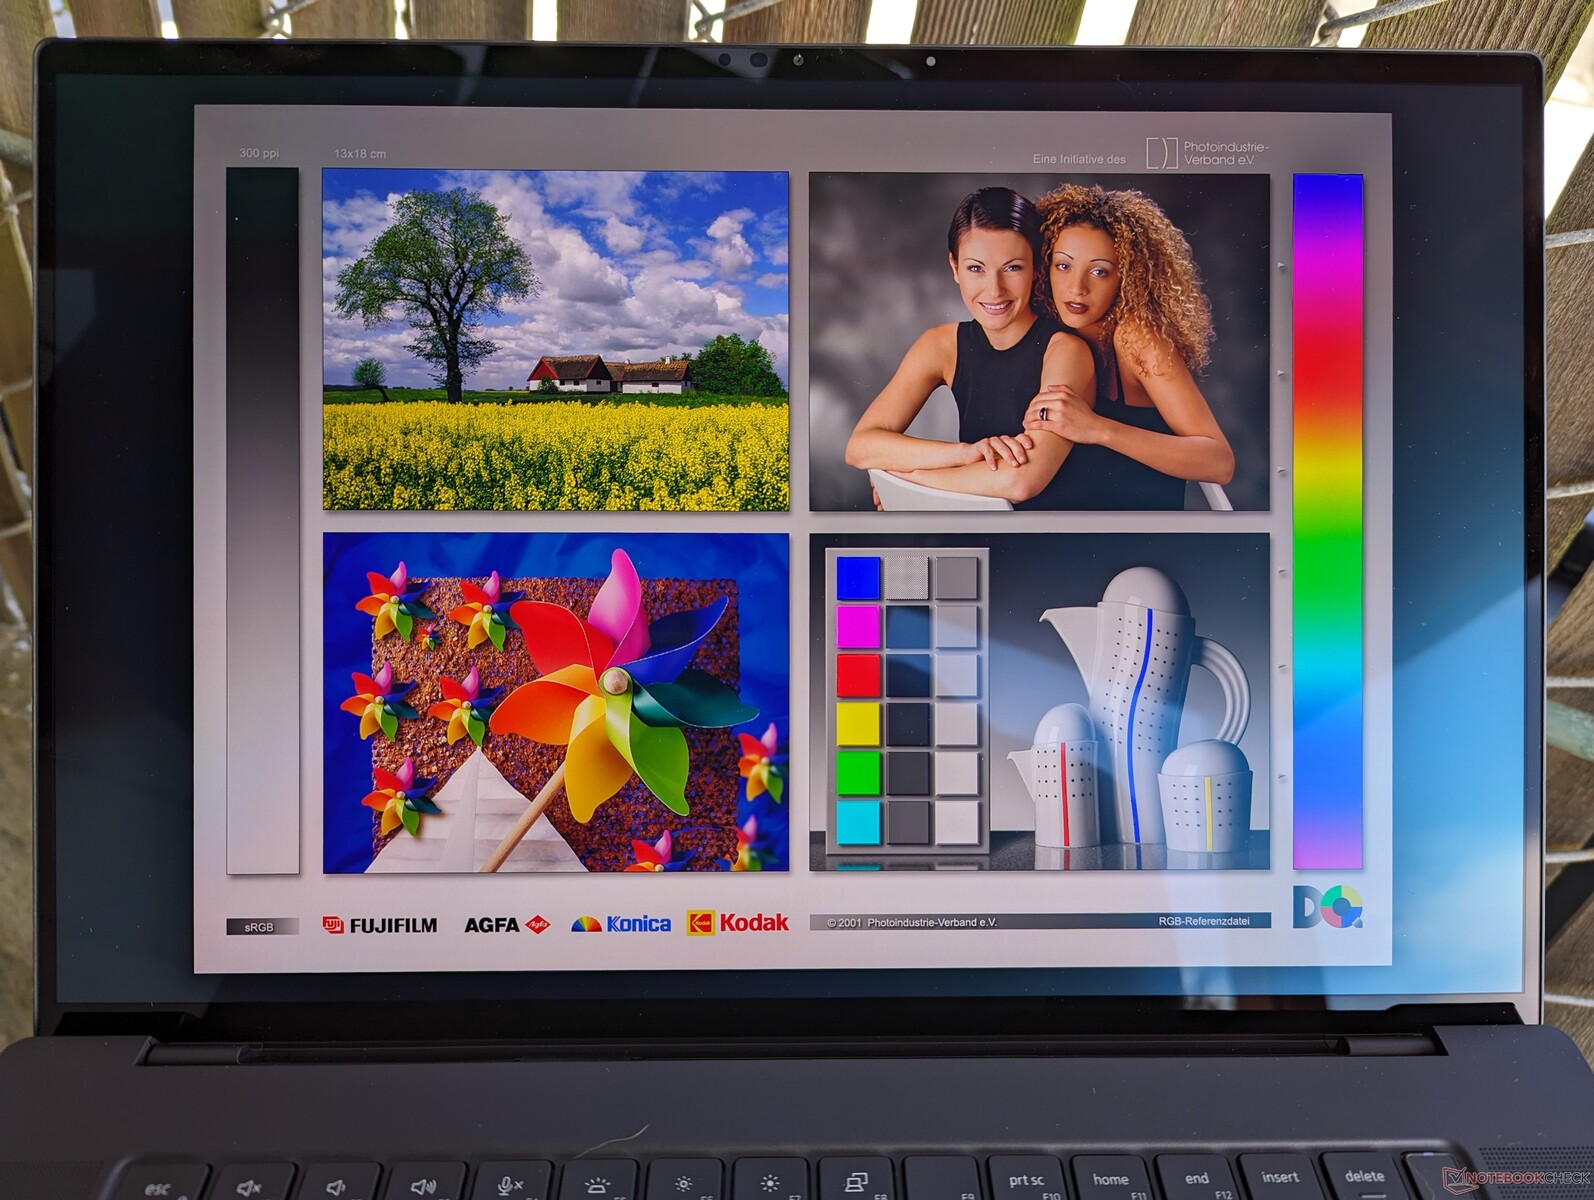
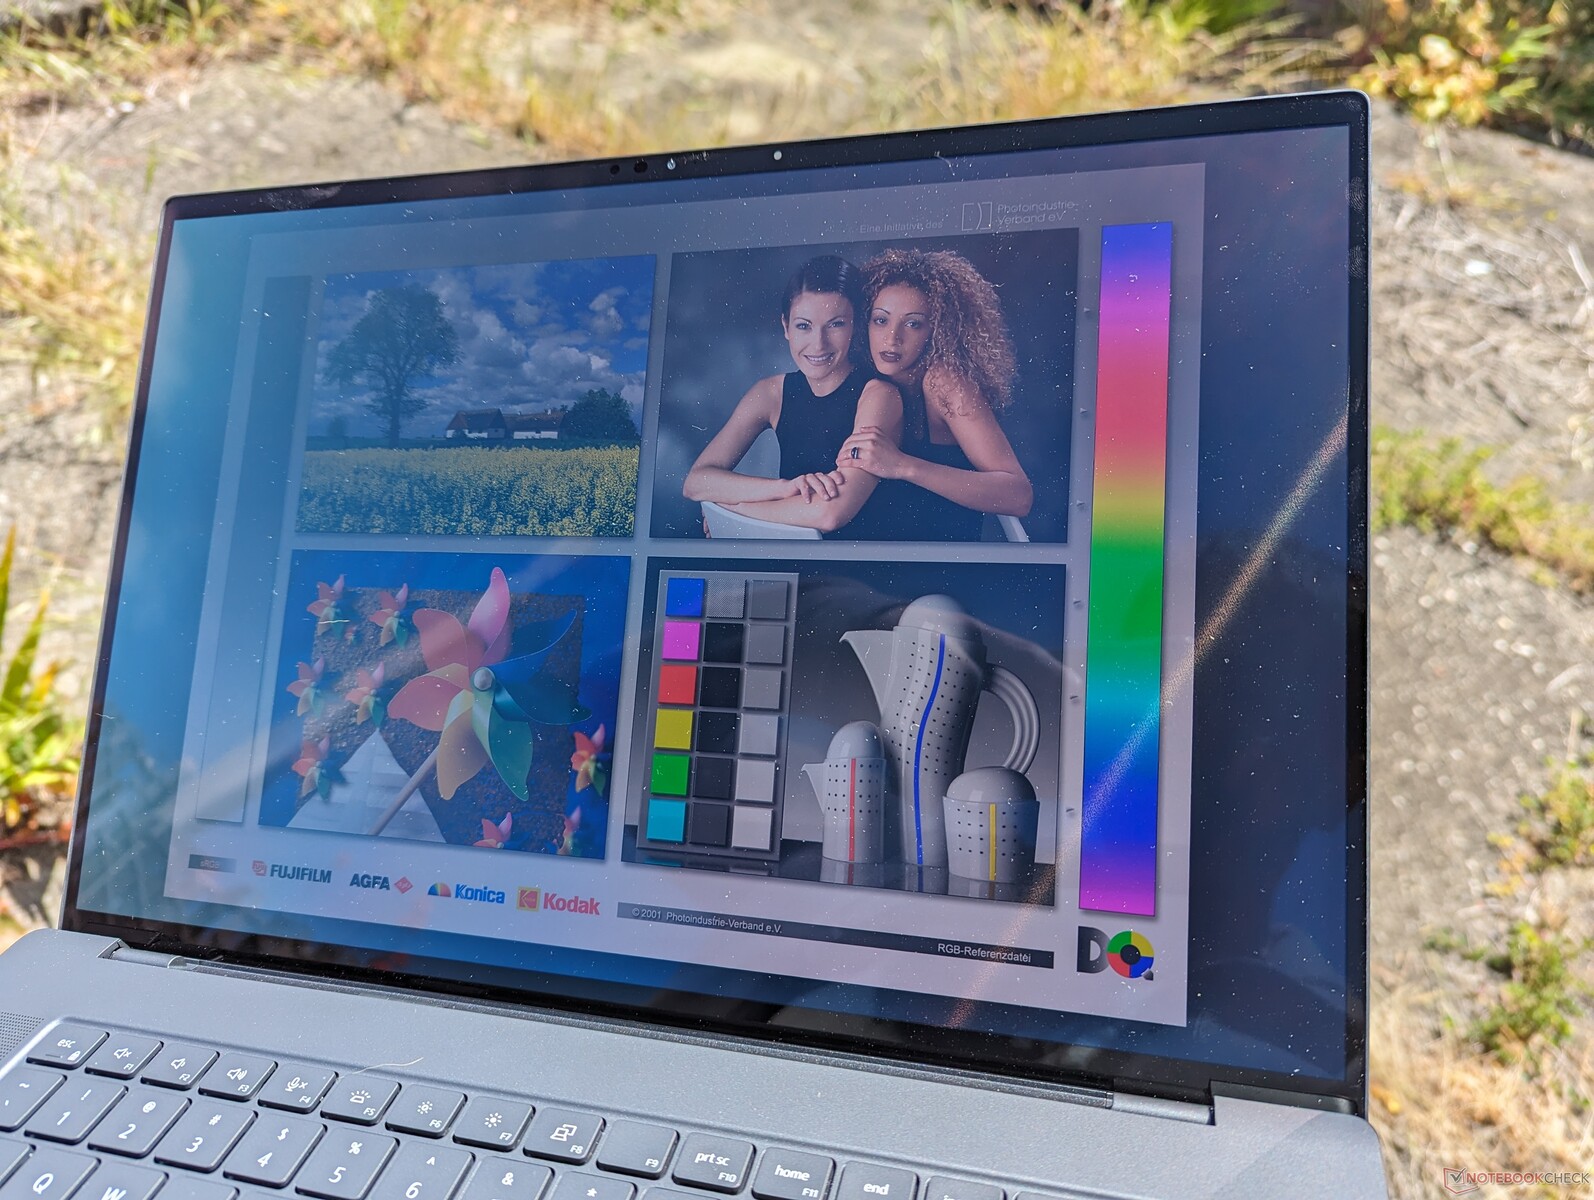
Beeldscherm - HDR OLED bij 60 Hz
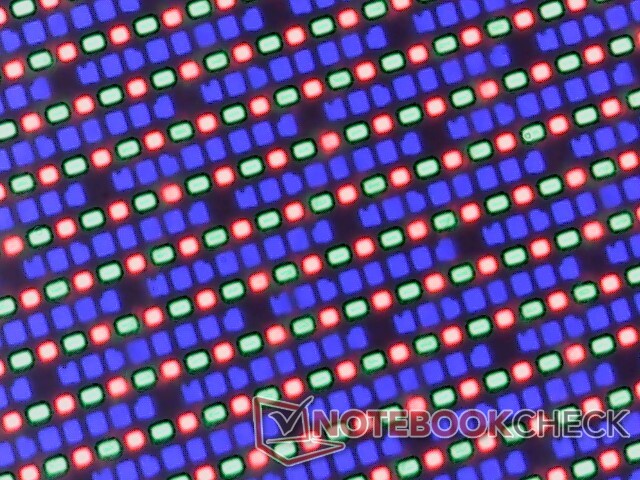
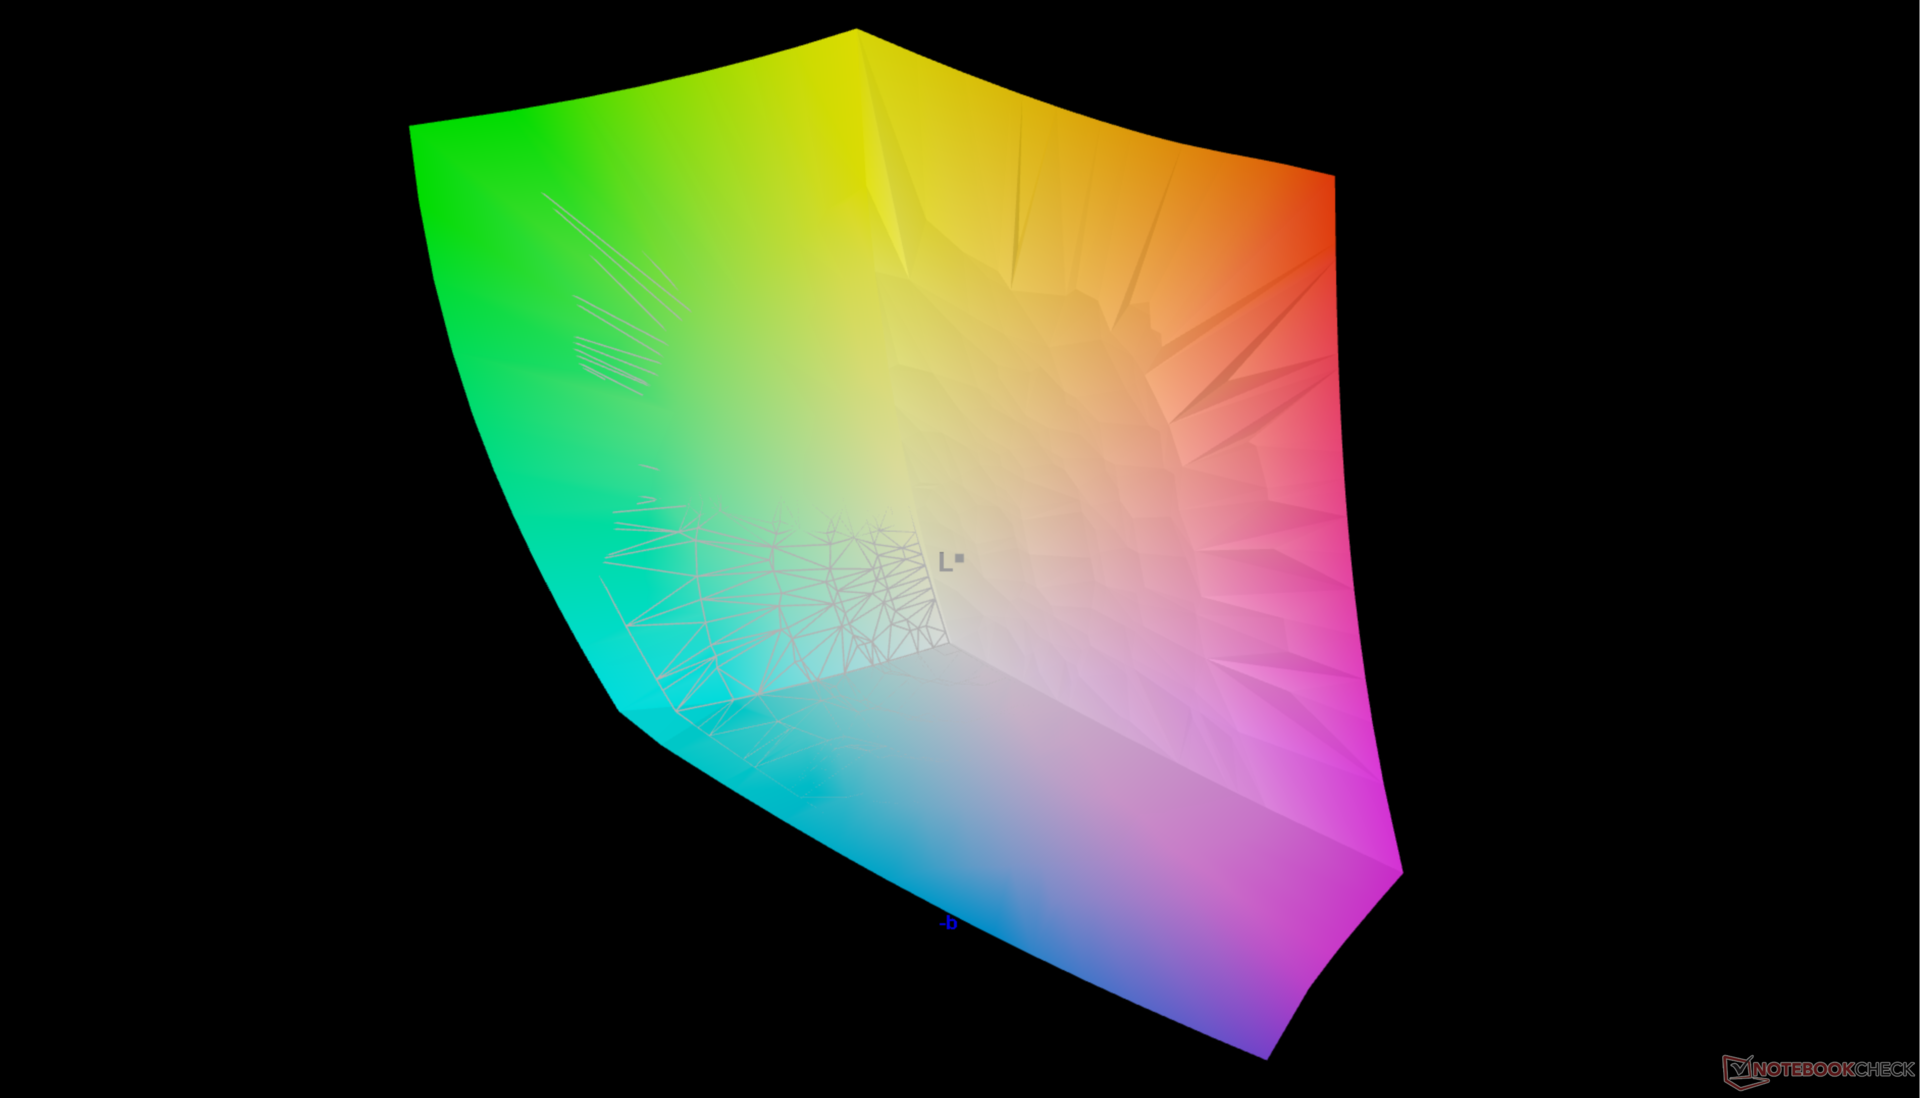
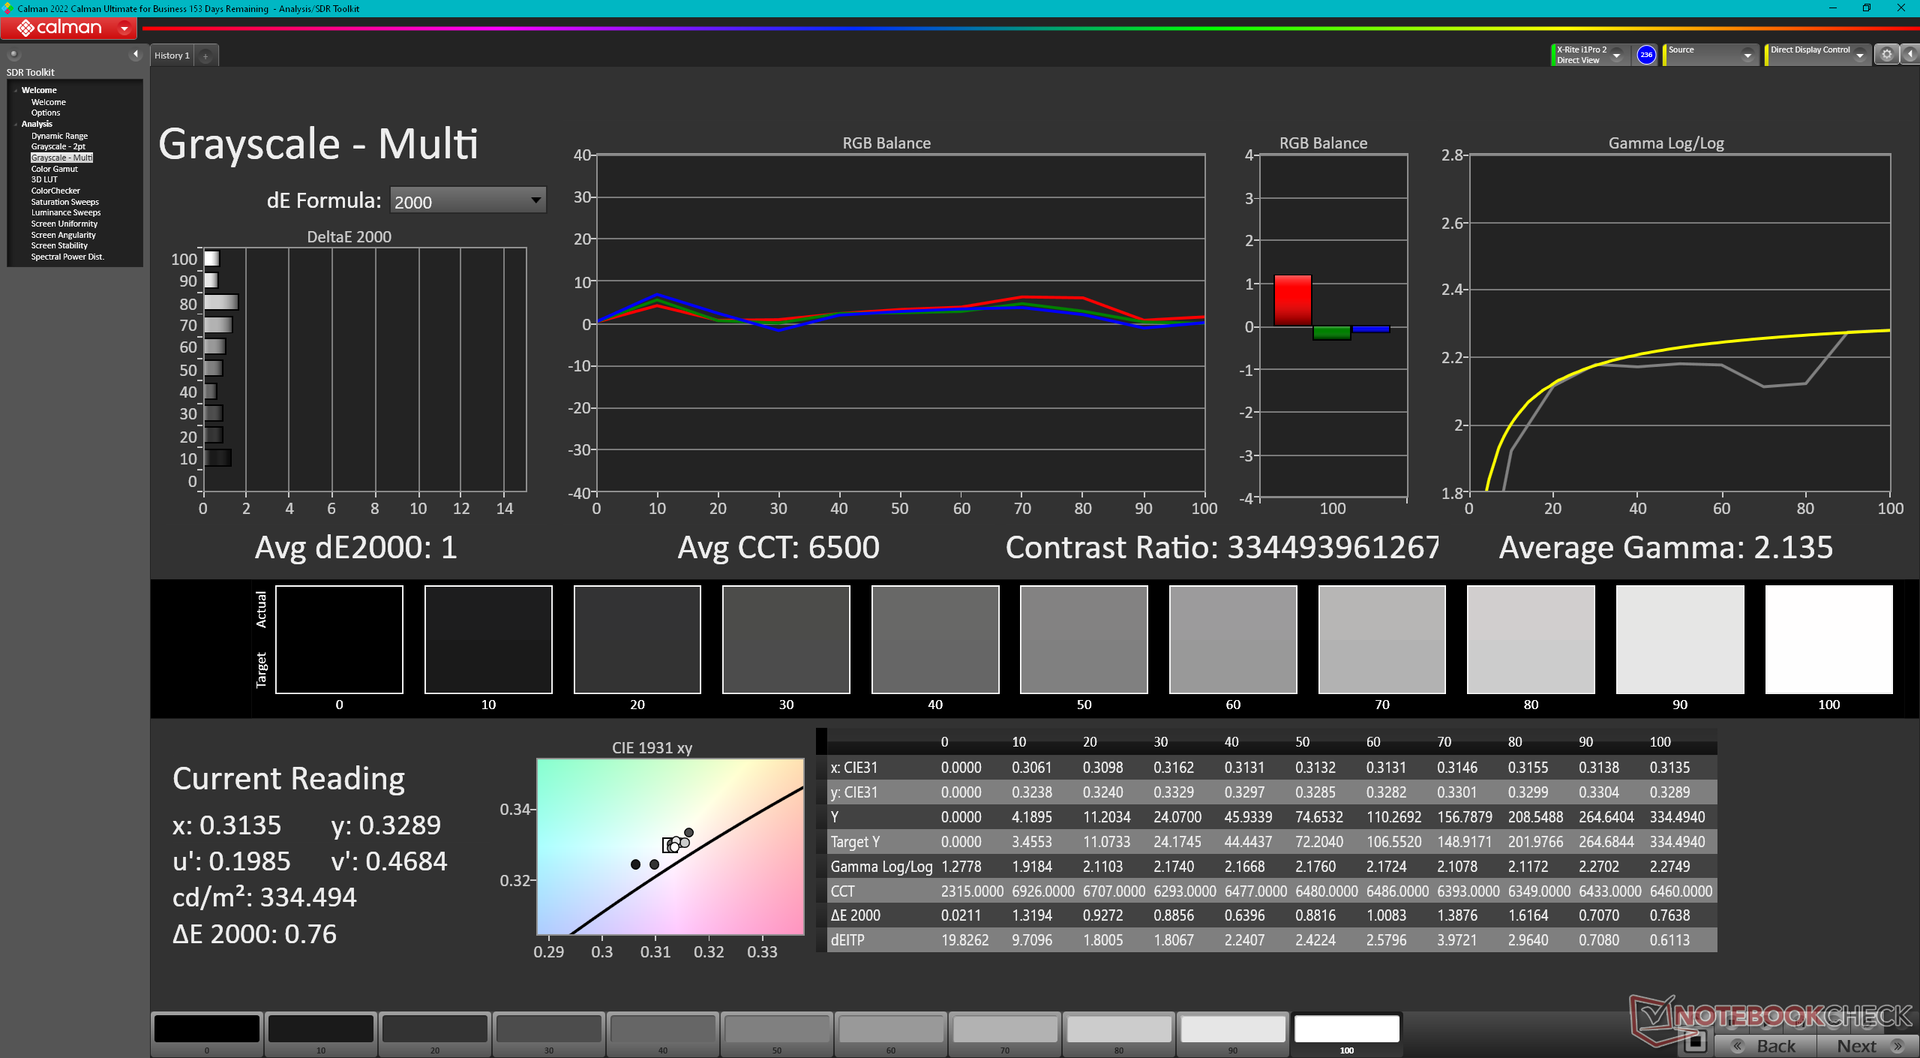
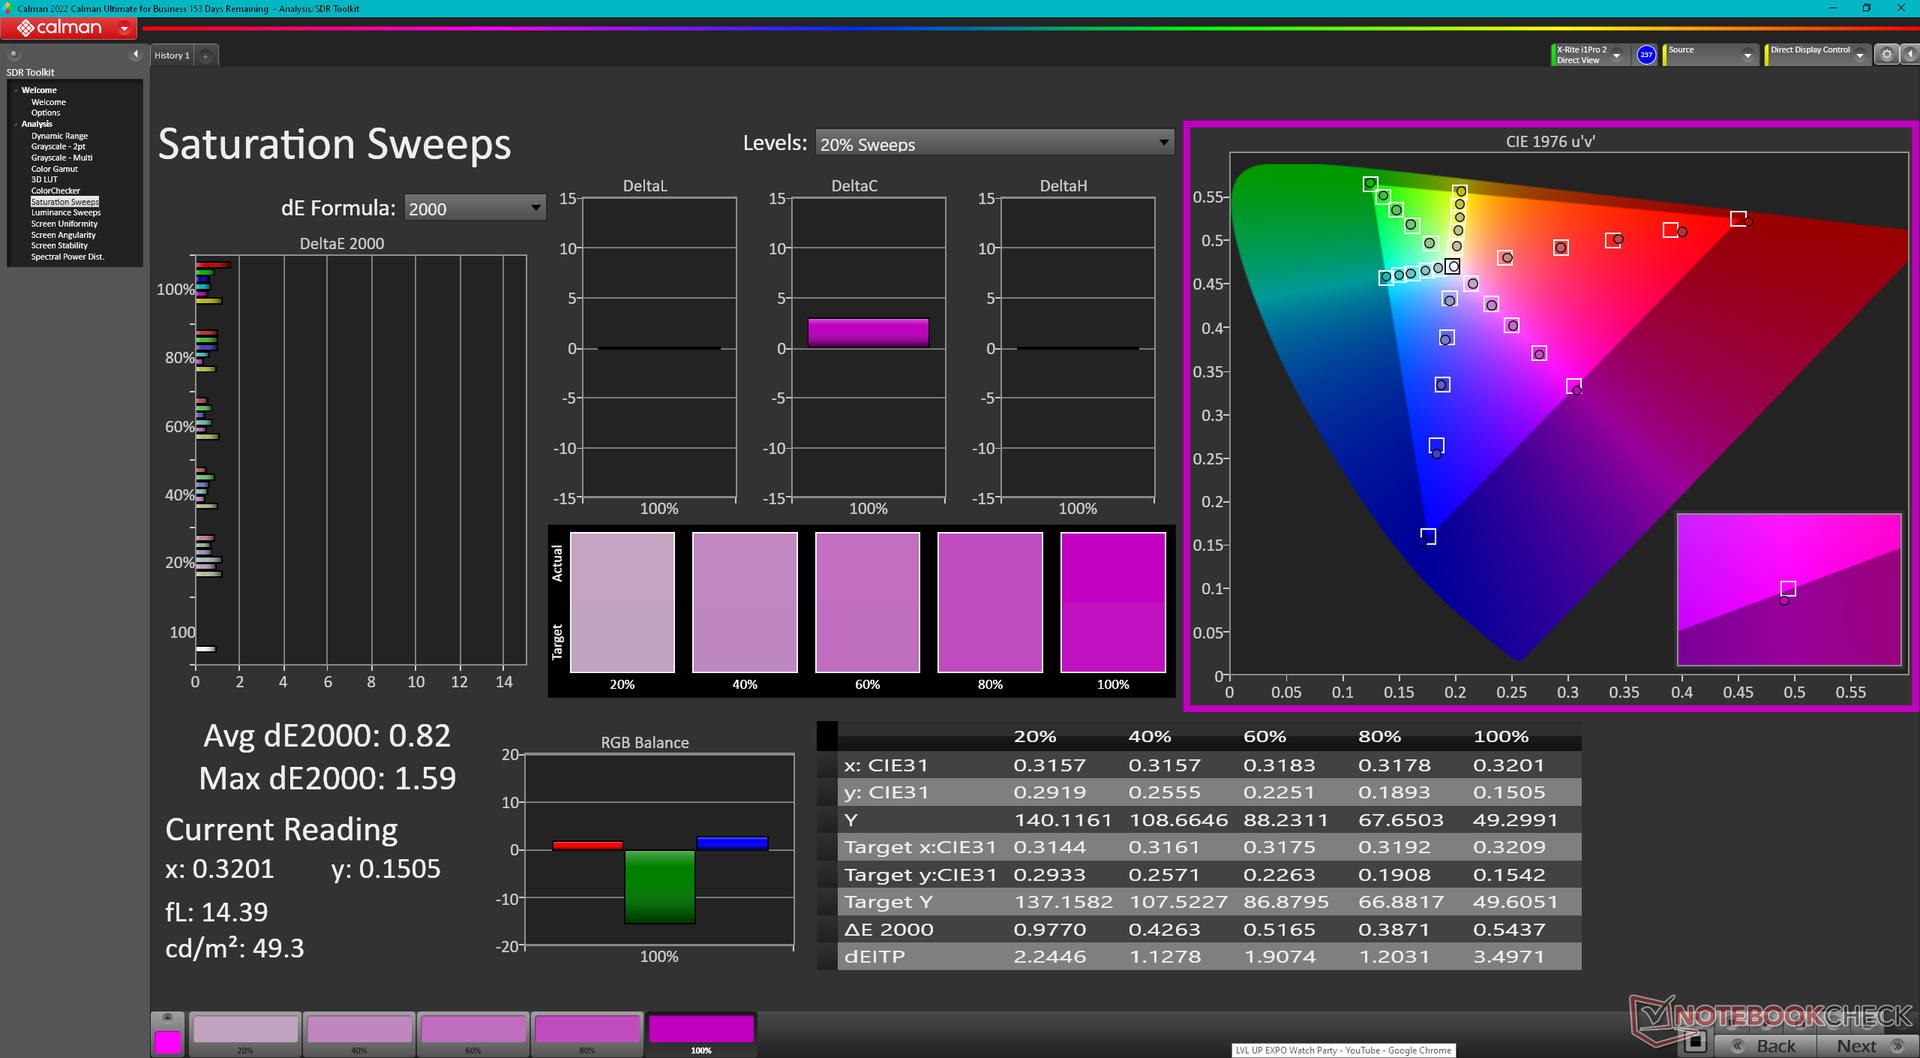
Het 2024-model maakt gebruik van hetzelfde 4K Samsung 160YV03 OLED-paneel en D3KJF onderdeelnummer als vorig jaar, zodat de visuele ervaring ongewijzigd blijft. Aan de ene kant is dit uitstekend, omdat het OLED-paneel vooraf gekalibreerd wordt geleverd met volledige DCI-P3-kleuren en touch-ondersteuning. Aan de andere kant zou het geweldig zijn geweest om hogere vernieuwingsfrequenties met adaptieve opties te zien, aangezien de standaard 60 Hz vernieuwingsfrequentie begint te verouderen.
De maximale helderheid in SDR- en HDR-modi kan respectievelijk 350 nits en 600 nits bereiken.
| |||||||||||||||||||||||||
Helderheidsverdeling: 97 %
Helderheid in Batterij-modus: 348.1 cd/m²
Contrast: ∞:1 (Zwart: 0 cd/m²)
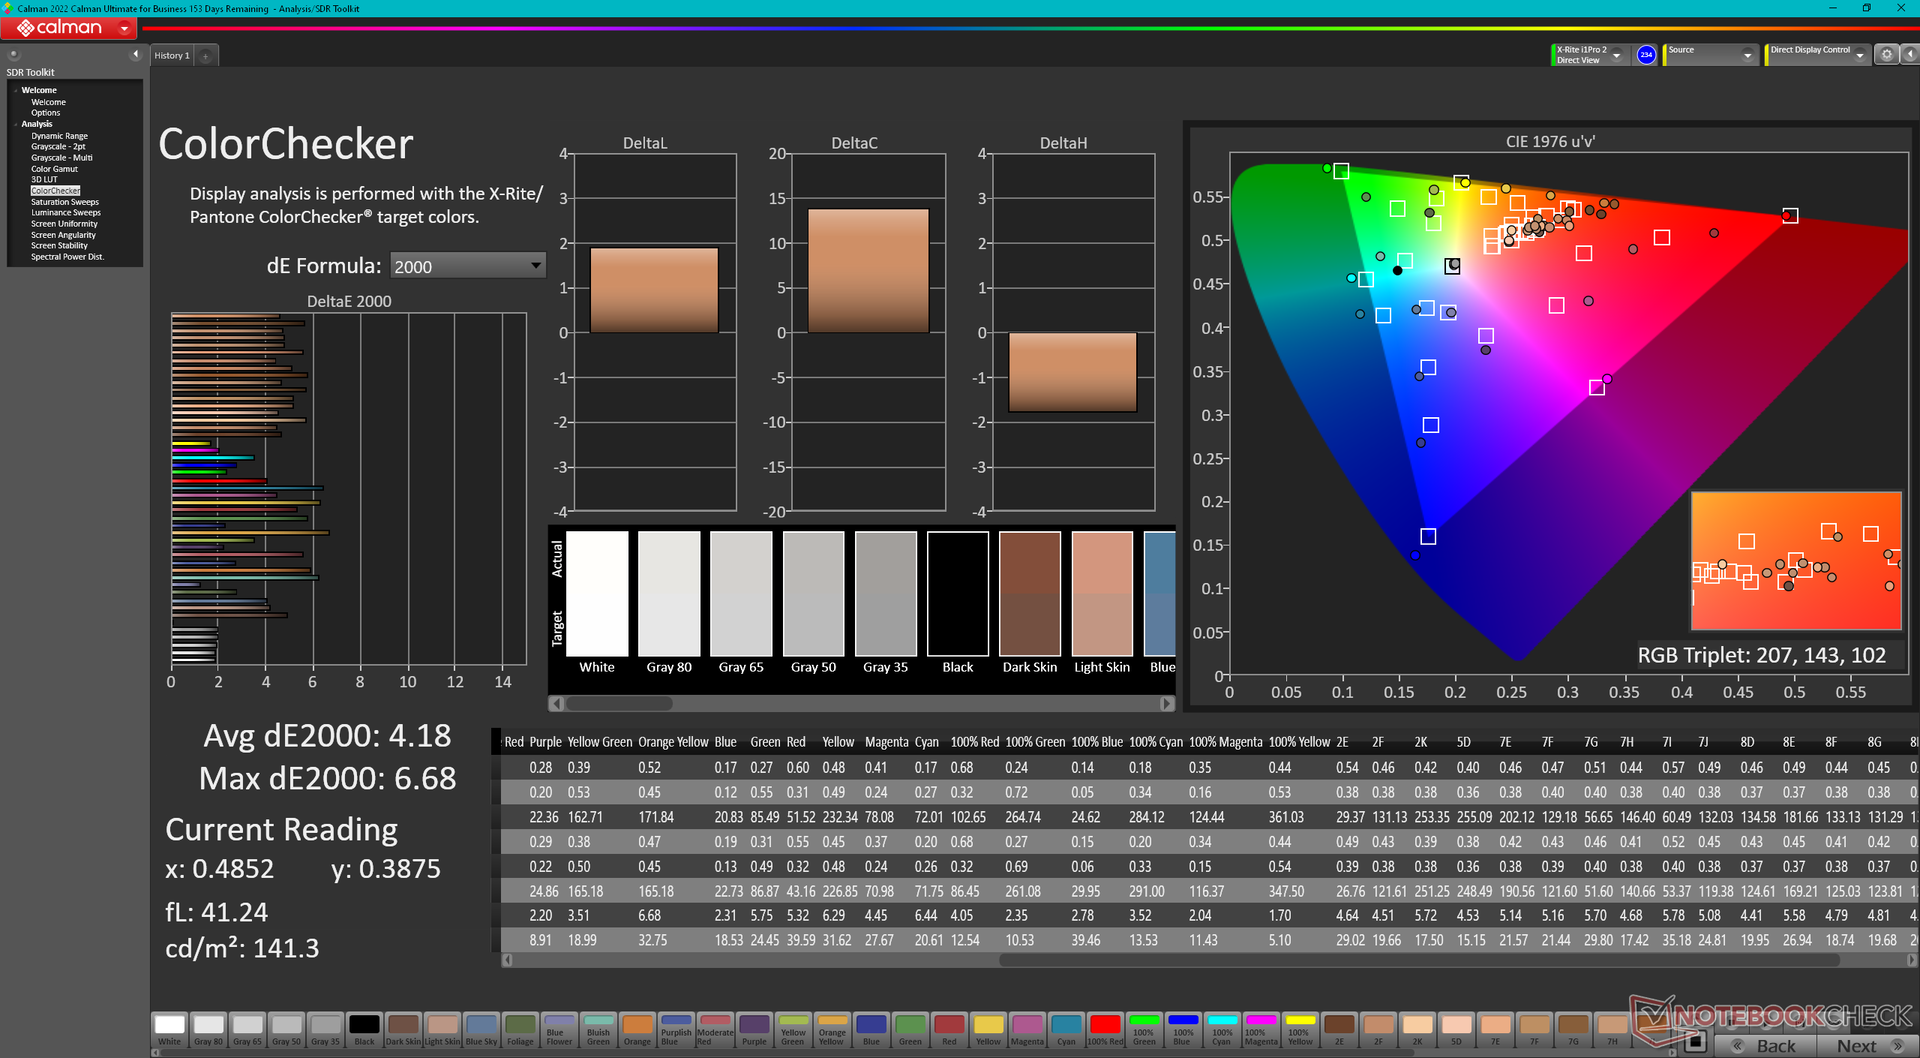
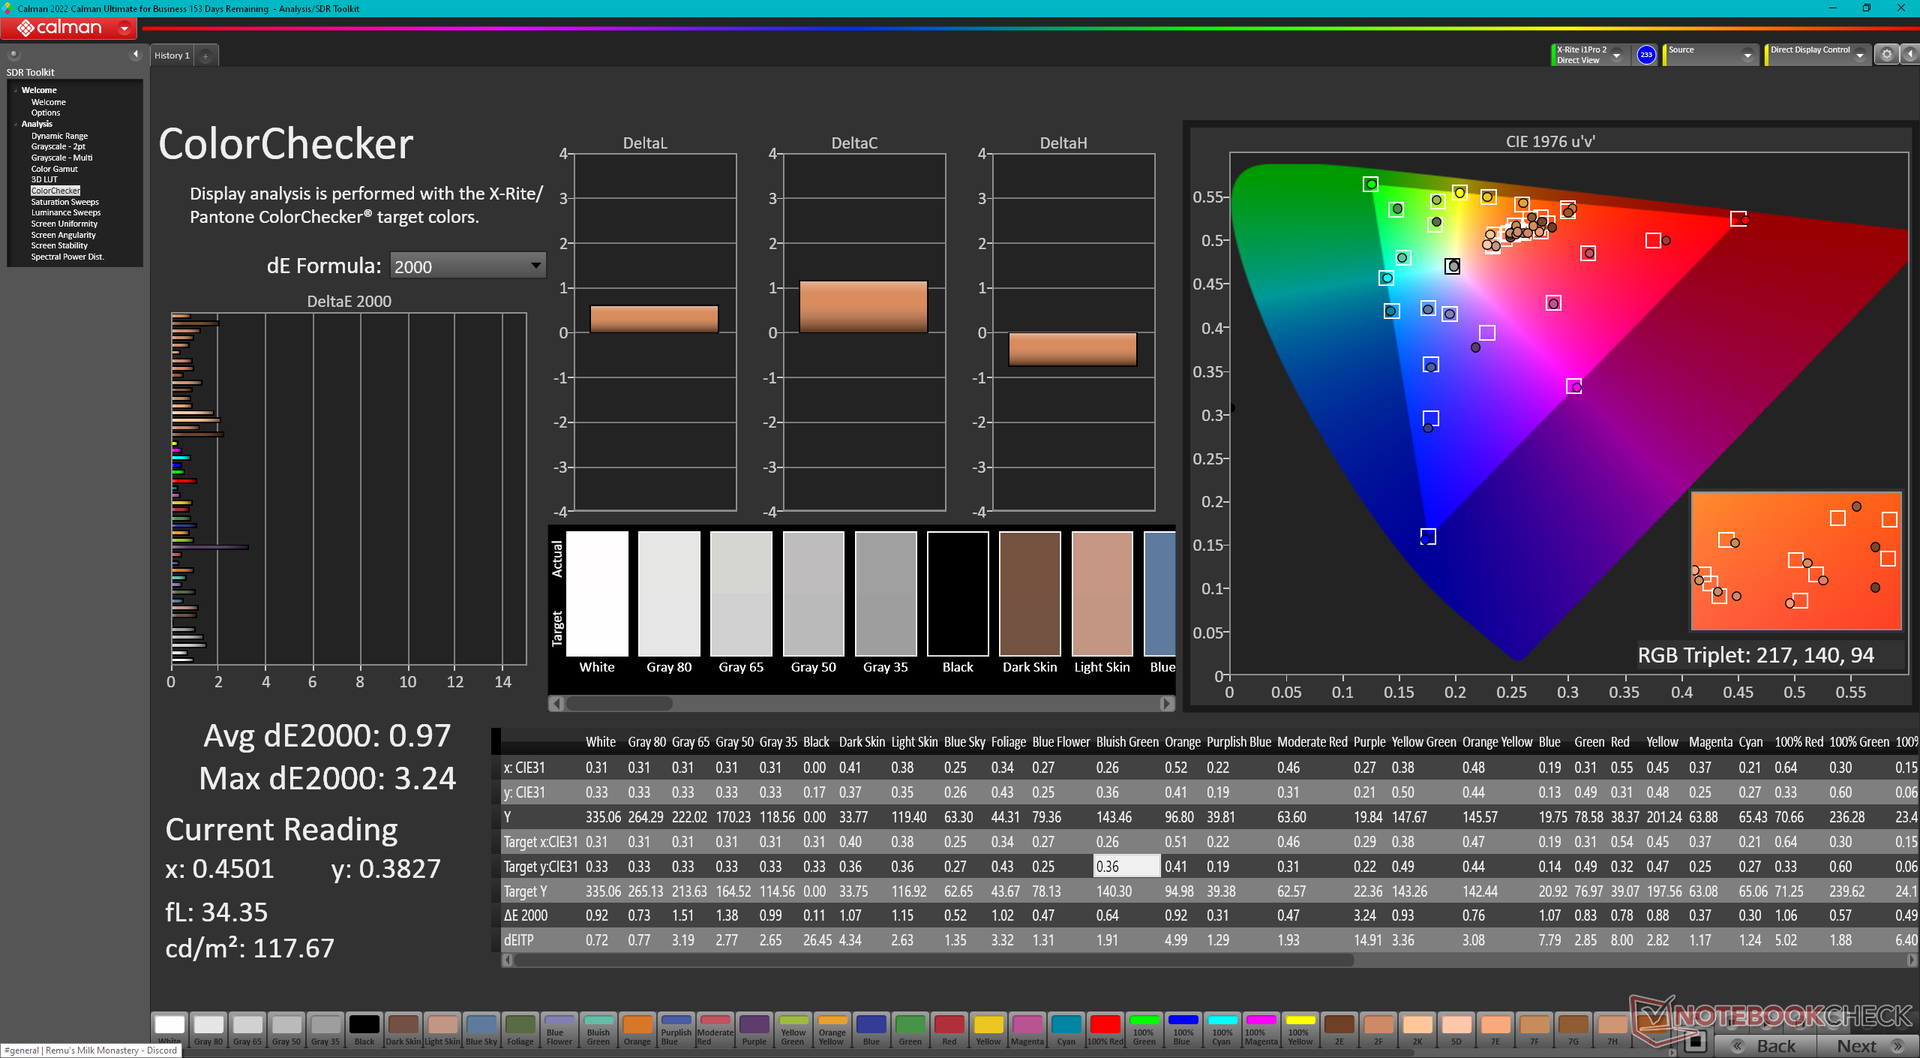
ΔE Color 4.18 | 0.5-29.43 Ø4.87, calibrated: 0.97
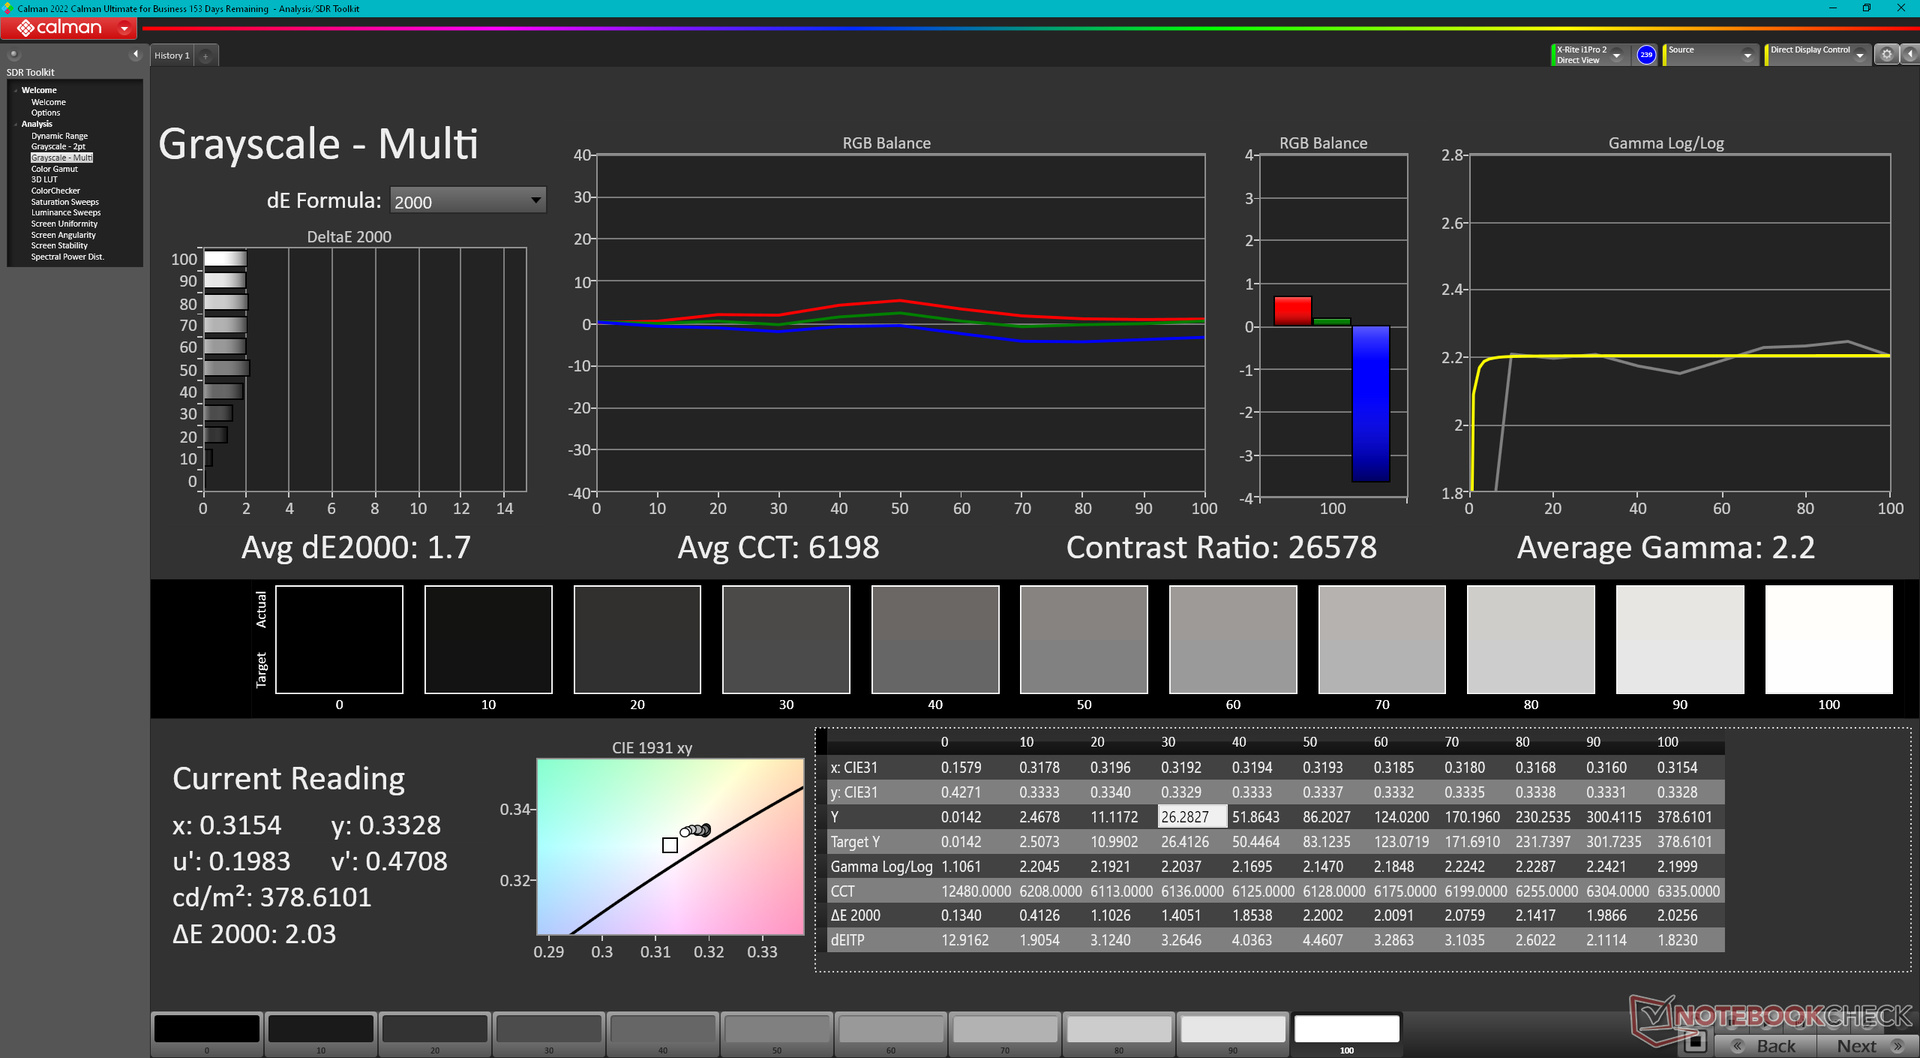
ΔE Greyscale 1.7 | 0.5-98 Ø5.1
96.6% AdobeRGB 1998 (Argyll 2.2.0 3D)
100% sRGB (Argyll 2.2.0 3D)
99.8% Display P3 (Argyll 2.2.0 3D)
Gamma: 2.2
| Dell Precision 5690 Samsung 160YV03, OLED, 3840x2400, 16" | Dell Precision 5000 5680 Samsung 160YV03, OLED, 3840x2400, 16" | Lenovo ThinkPad P16 G2 21FA000FGE MNG007DA1-9, IPS LED, 2560x1600, 16" | Lenovo ThinkPad P1 G6-21FV000DGE NE160QDM-NY1, IPS, 2560x1600, 16" | HP ZBook Fury 16 G10 AUO87A8, IPS, 3840x2400, 16" | MSI CreatorPro Z16P B12UKST B160QAN02.N, IPS, 2560x1600, 16" | |
|---|---|---|---|---|---|---|
| Display | 0% | -18% | -20% | -4% | -4% | |
| Display P3 Coverage | 99.8 | 99.9 0% | 71 -29% | 68.1 -32% | 98 -2% | 97.6 -2% |
| sRGB Coverage | 100 | 100 0% | 99.2 -1% | 97.5 -2% | 99.9 0% | 99.9 0% |
| AdobeRGB 1998 Coverage | 96.6 | 97.5 1% | 73.2 -24% | 70.2 -27% | 86.2 -11% | 87.4 -10% |
| Response Times | -1% | -574% | -586% | -533% | -494% | |
| Response Time Grey 50% / Grey 80% * | 1.7 ? | 1.68 ? 1% | 12.8 ? -653% | 13.7 ? -706% | 11.9 ? -600% | 12.8 ? -653% |
| Response Time Black / White * | 1.7 ? | 1.77 ? -4% | 10.1 ? -494% | 9.6 ? -465% | 9.6 ? -465% | 7.4 ? -335% |
| PWM Frequency | 60 ? | 60 ? 0% | ||||
| Screen | -11% | -15% | 33% | 36% | 22% | |
| Brightness middle | 348.1 | 345.7 -1% | 510 47% | 521 50% | 514.6 48% | 407 17% |
| Brightness | 351 | 349 -1% | 517 47% | 484 38% | 495 41% | 388 11% |
| Brightness Distribution | 97 | 98 1% | 89 -8% | 89 -8% | 90 -7% | 88 -9% |
| Black Level * | 0.37 | 0.36 | 0.46 | 0.36 | ||
| Colorchecker dE 2000 * | 4.18 | 3.59 14% | 2.6 38% | 1.2 71% | 2.4 43% | 1.3 69% |
| Colorchecker dE 2000 max. * | 6.68 | 7.02 -5% | 5.2 22% | 2.5 63% | 4.86 27% | 2.5 63% |
| Colorchecker dE 2000 calibrated * | 0.97 | 0.99 -2% | 2.3 -137% | 1 -3% | 0.4 59% | 0.7 28% |
| Greyscale dE 2000 * | 1.7 | 3.1 -82% | 3.6 -112% | 1.4 18% | 1 41% | 2.1 -24% |
| Gamma | 2.2 100% | 2.13 103% | 2.26 97% | 2.25 98% | 2.3 96% | 2.26 97% |
| CCT | 6198 105% | 6448 101% | 5969 109% | 6682 97% | 6553 99% | 6437 101% |
| Contrast | 1378 | 1447 | 1119 | 1131 | ||
| Totaal Gemiddelde (Programma / Instellingen) | -4% /
-6% | -202% /
-109% | -191% /
-84% | -167% /
-69% | -159% /
-70% |
* ... kleiner is beter
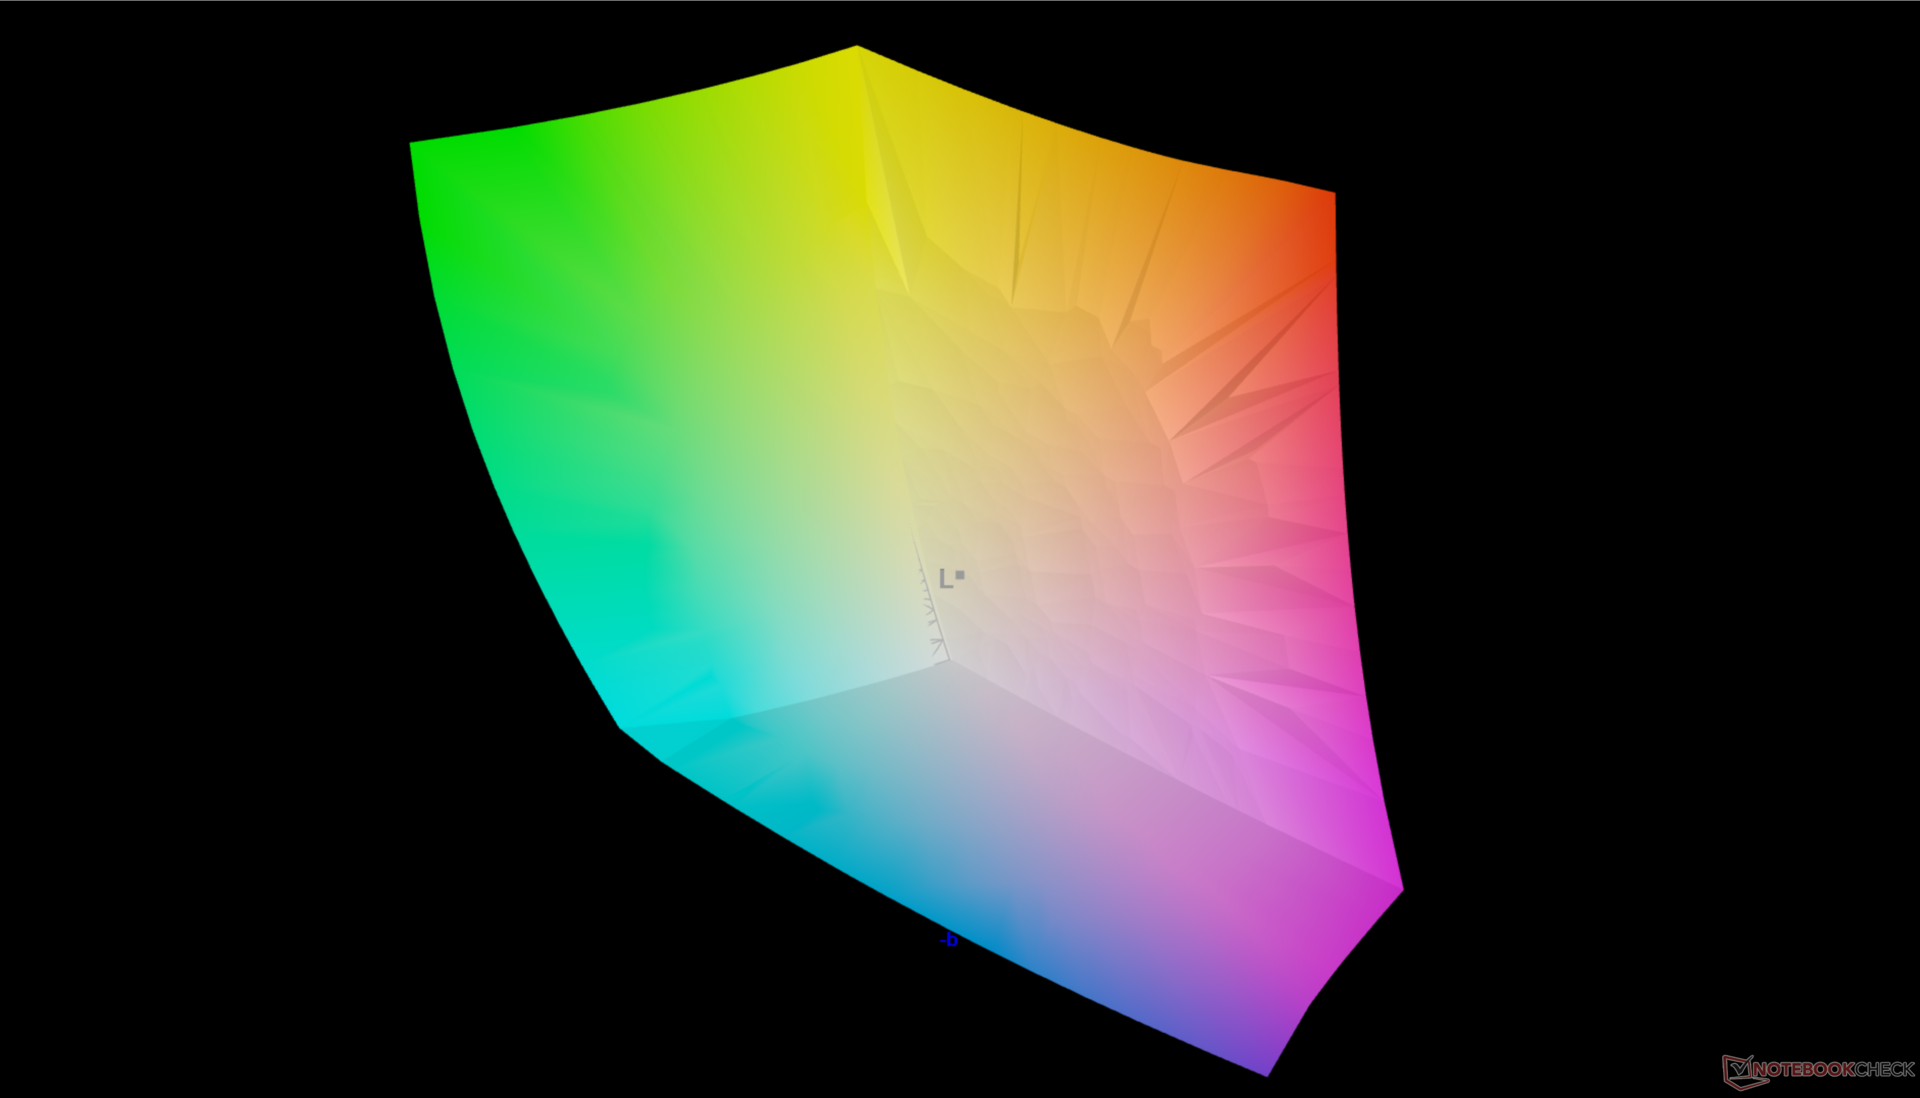
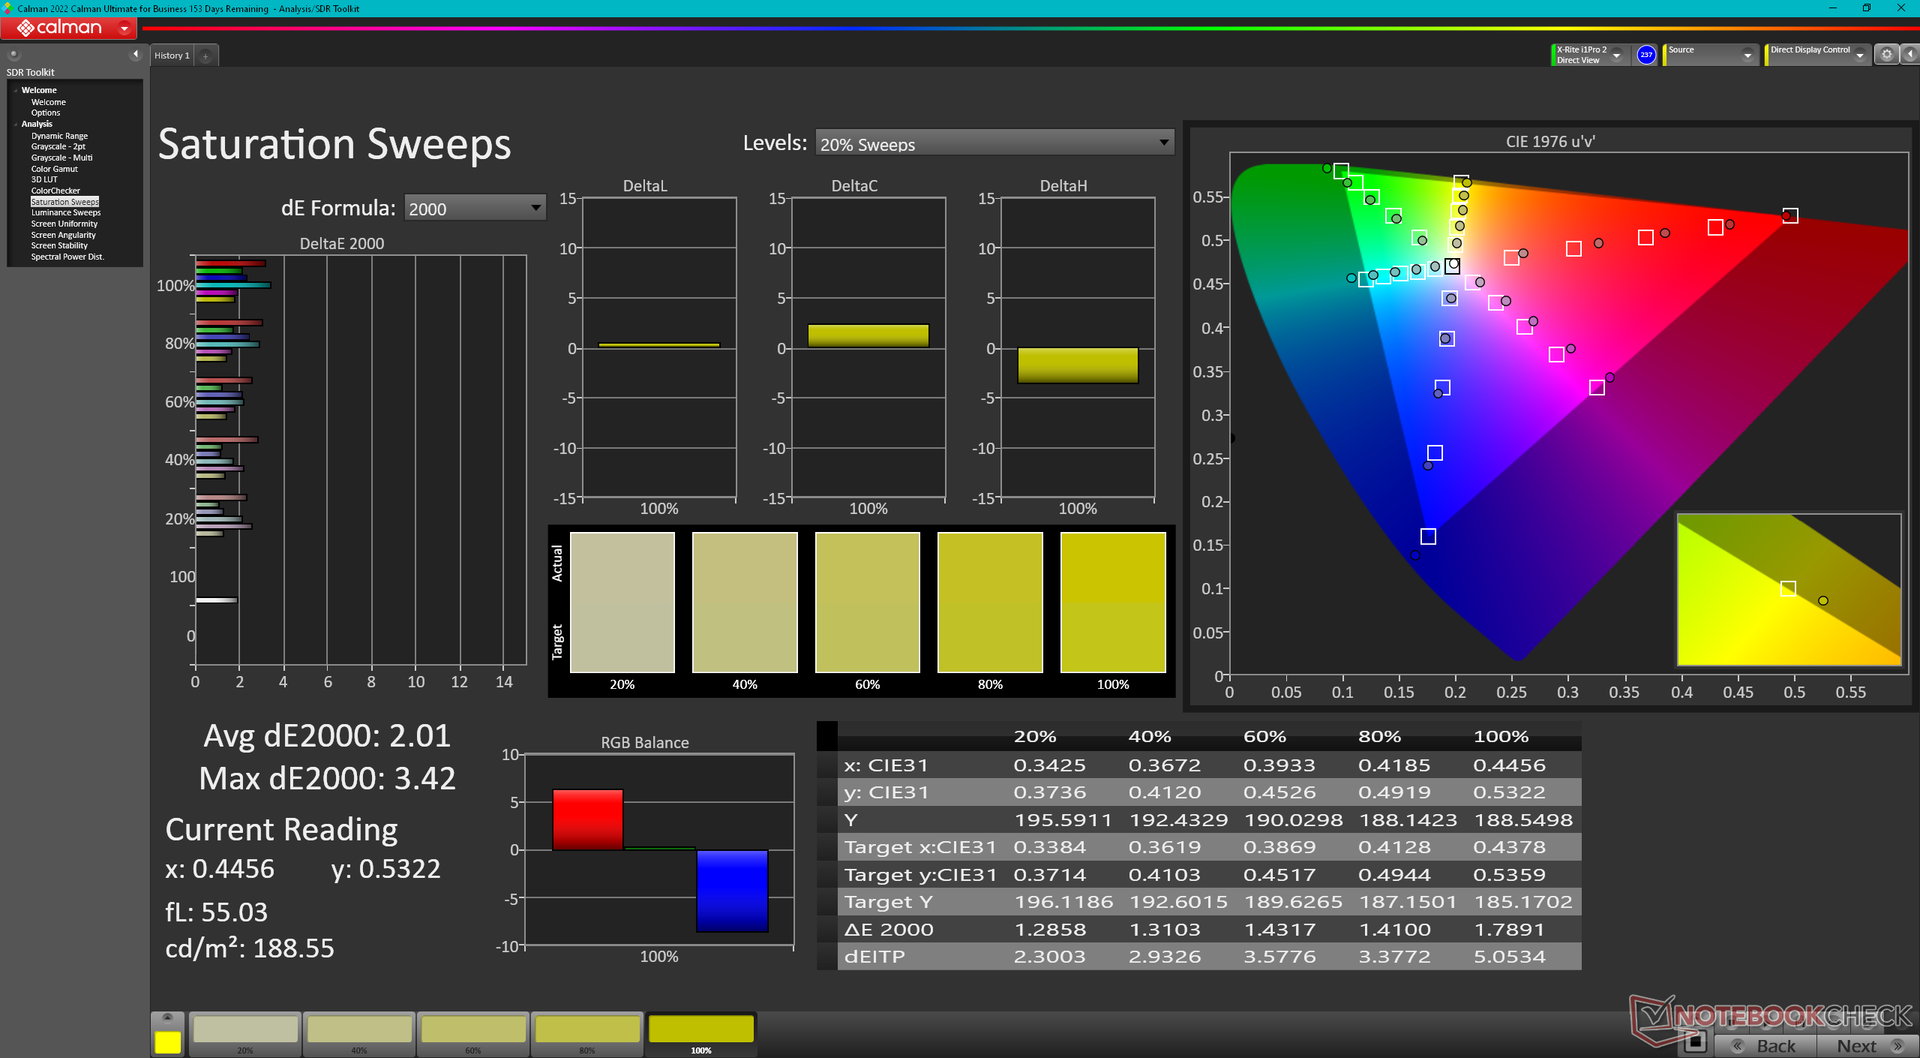
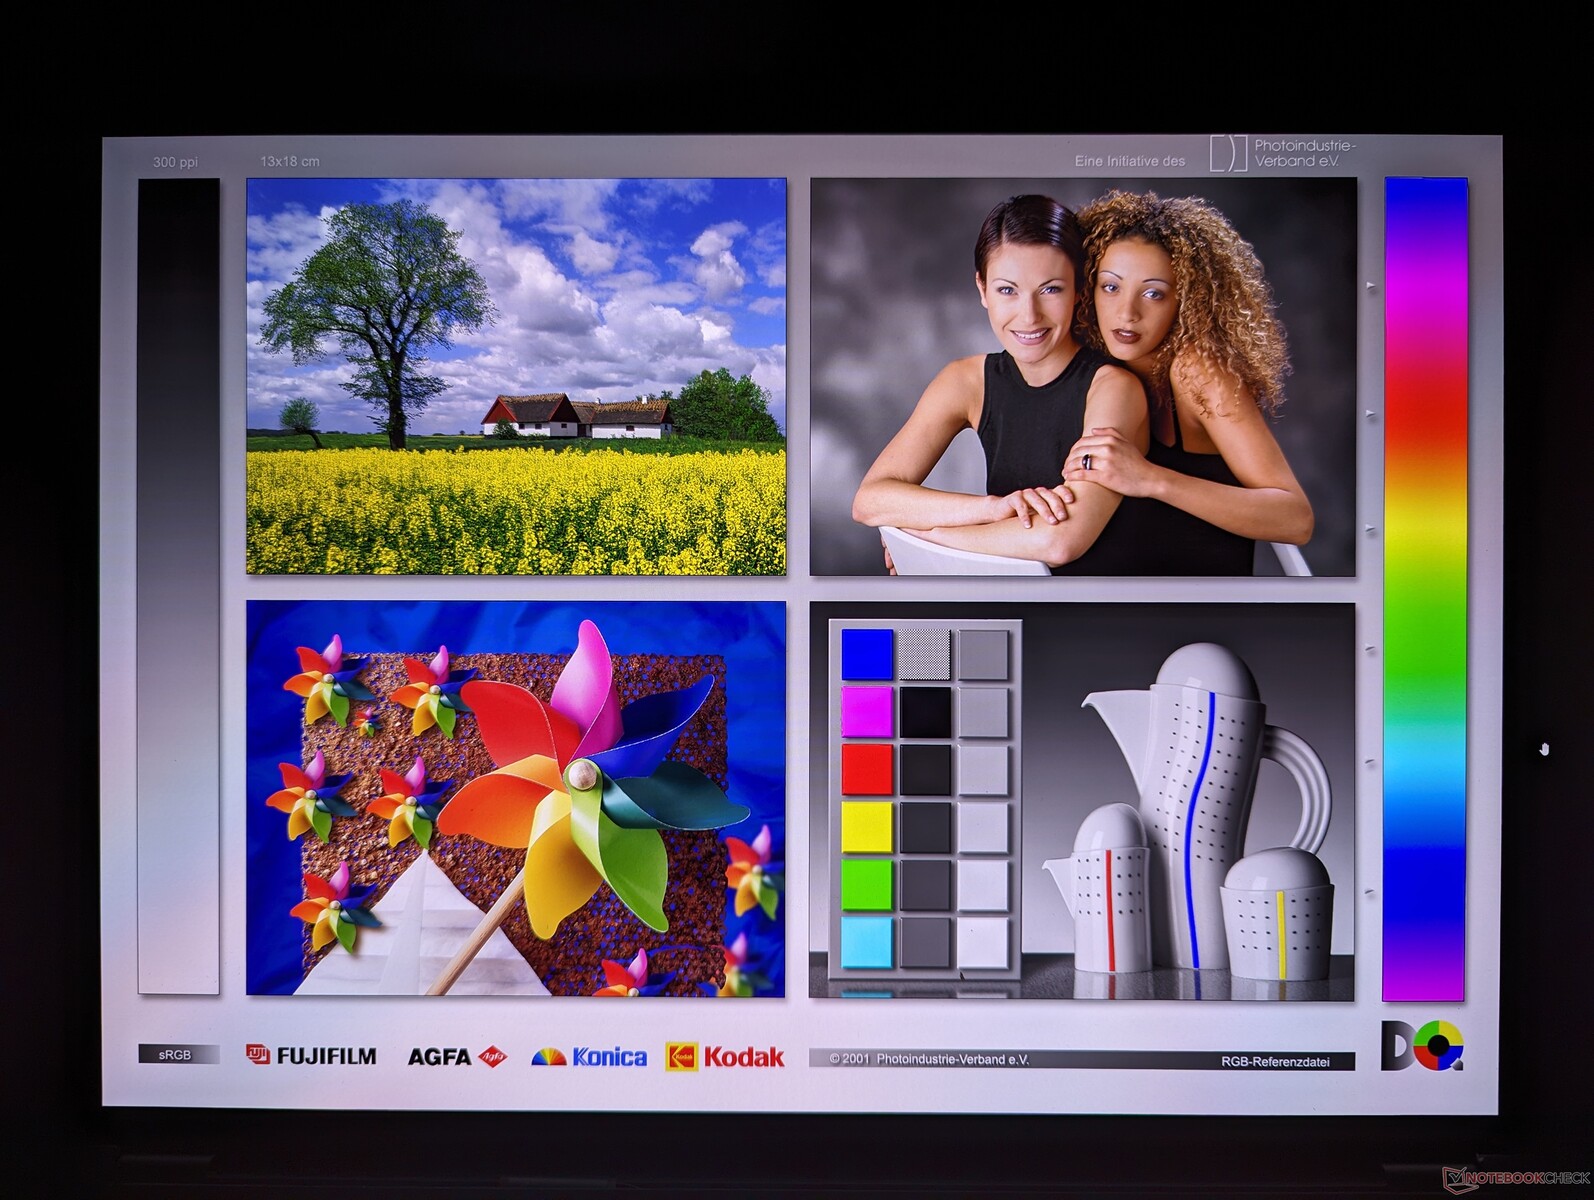
Het beeldscherm is goed gekalibreerd ten opzichte van de P3-standaard met gemiddelde grijswaarden en kleuren DeltaE-waarden van respectievelijk slechts 1,7 en 4,18.
Responstijd Scherm
| ↔ Responstijd Zwart naar Wit | ||
|---|---|---|
| 1.7 ms ... stijging ↗ en daling ↘ gecombineerd | ↗ 0.74 ms stijging | 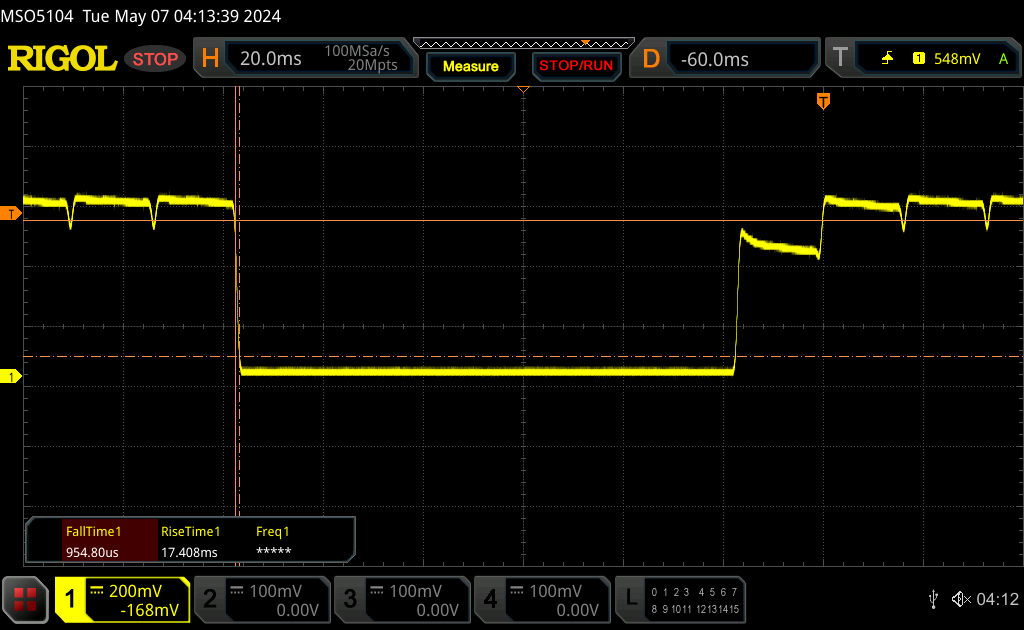 |
| ↘ 0.96 ms daling | ||
| Het scherm vertoonde erg snelle responstijden in onze tests en zou zeer geschikt moeten zijn voor snelle games. Ter vergelijking: alle testtoestellen variëren van 0.1 (minimum) tot 240 (maximum) ms. » 7 % van alle toestellen zijn beter. Dit betekent dat de gemeten responstijd beter is dan het gemiddelde (20.8 ms) van alle geteste toestellen. | ||
| ↔ Responstijd 50% Grijs naar 80% Grijs | ||
| 1.7 ms ... stijging ↗ en daling ↘ gecombineerd | ↗ 0.88 ms stijging | 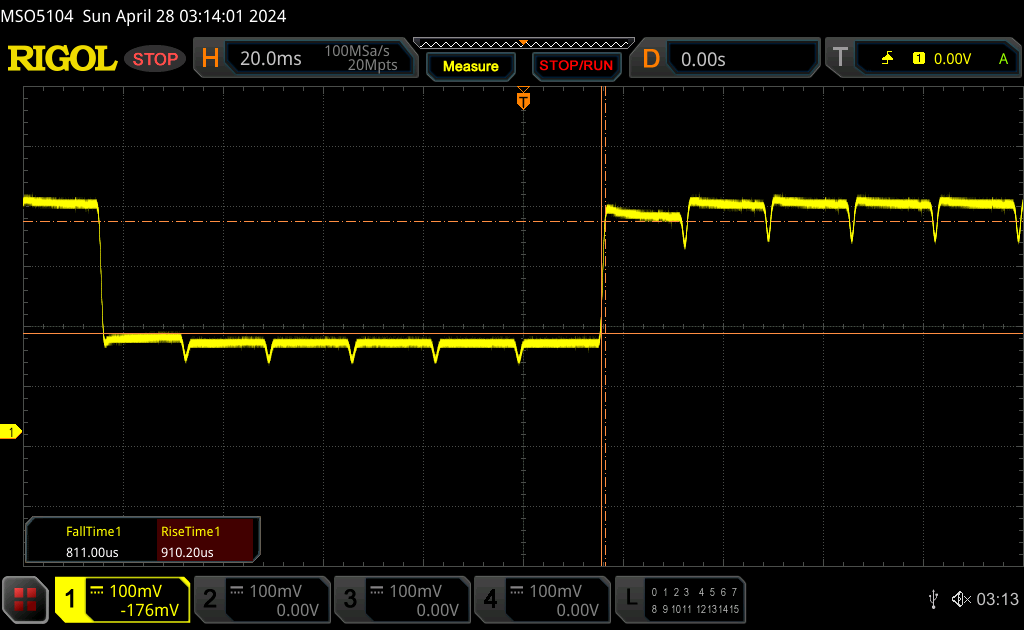 |
| ↘ 0.82 ms daling | ||
| Het scherm vertoonde erg snelle responstijden in onze tests en zou zeer geschikt moeten zijn voor snelle games. Ter vergelijking: alle testtoestellen variëren van 0.165 (minimum) tot 636 (maximum) ms. » 6 % van alle toestellen zijn beter. Dit betekent dat de gemeten responstijd beter is dan het gemiddelde (32.5 ms) van alle geteste toestellen. | ||
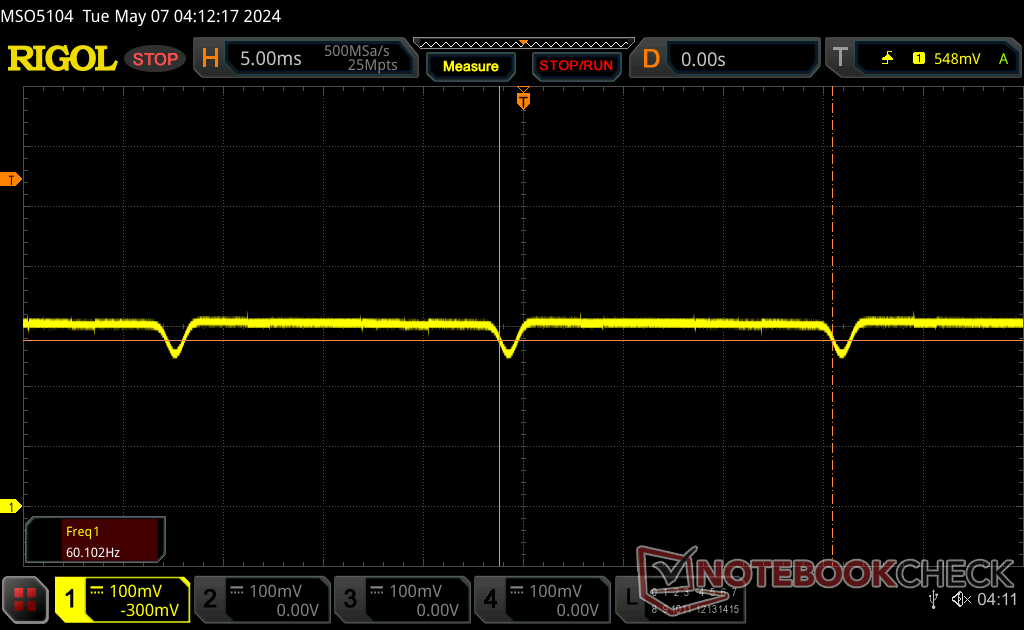
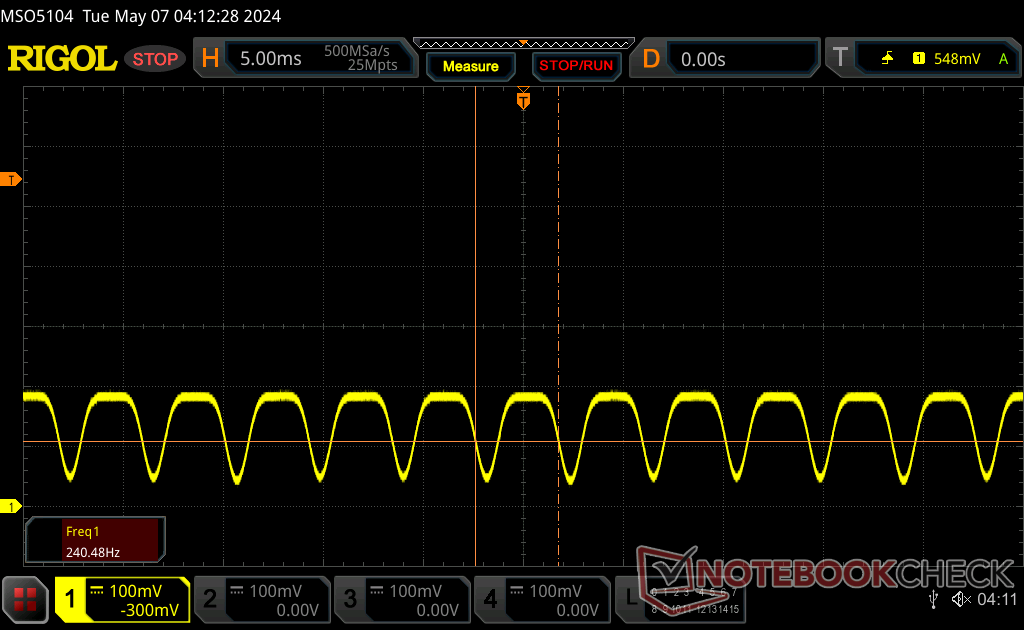
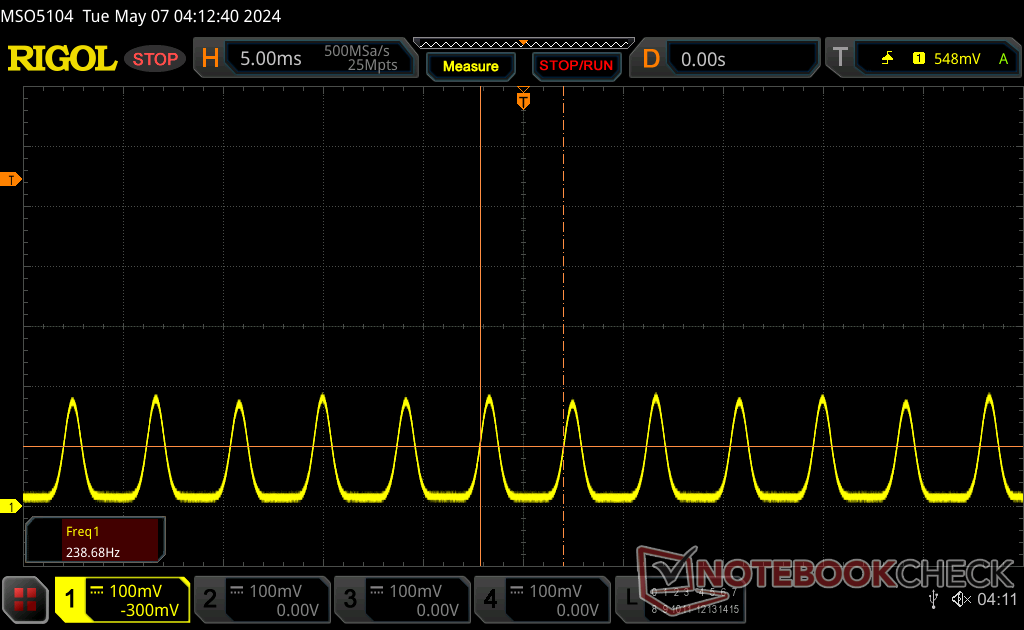
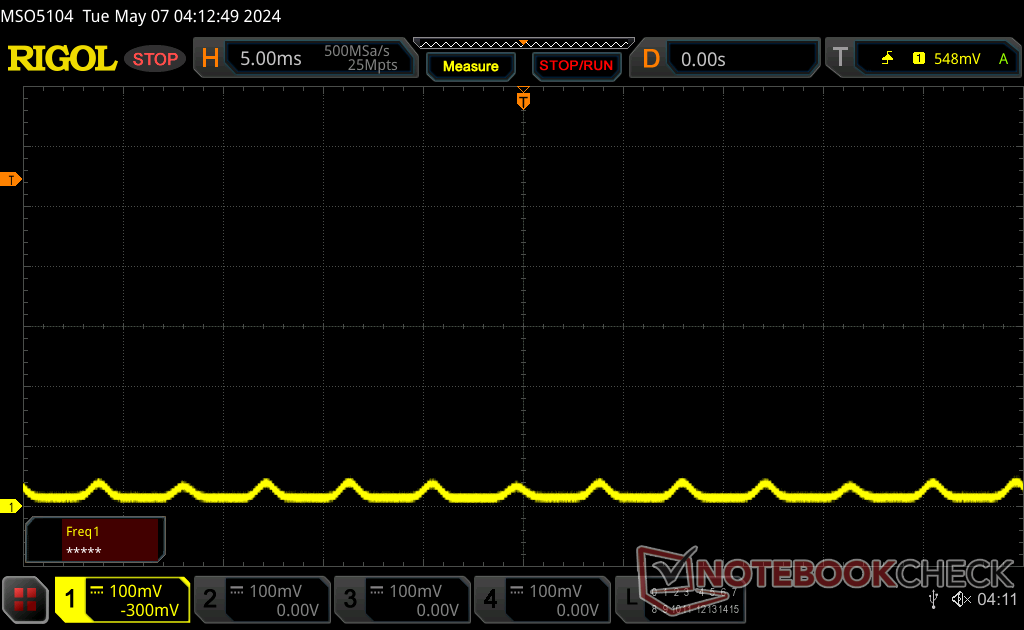
Screen Flickering / PWM (Pulse-Width Modulation)
| Screen flickering / PWM waargenomen | 60 Hz | ≤ 100 % helderheid instelling | 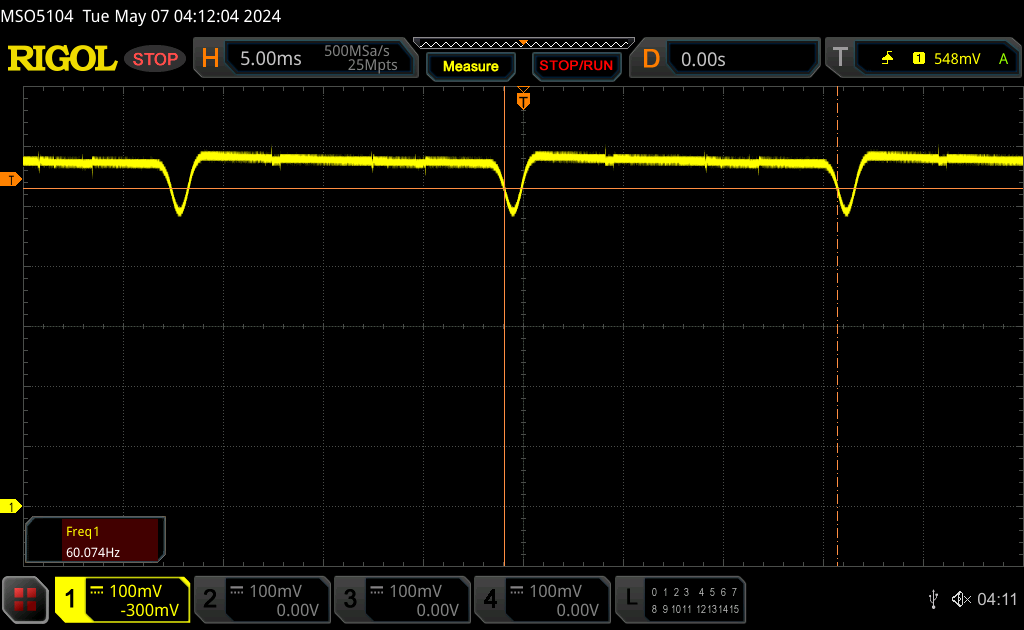 |
De achtergrondverlichting van het scherm flikkert op 60 Hz (in het slechtste geval, bijvoorbeeld bij gebruik van PWM) aan een helderheid van 100 % en lager. Boven deze helderheid zou er geen flickering / PWM mogen optreden. De frequentie van 60 Hz is erg laag en kan dus aanleiding geven tot geïrriteerde ogen en hoofdpijn bij langer gebruik. Ter vergelijking: 53 % van alle geteste toestellen maakten geen gebruik van PWM om de schermhelderheid te verlagen. Als het wel werd gebruikt, werd een gemiddelde van 8516 (minimum: 5 - maximum: 343500) Hz waargenomen. | |||

Prestaties
Testomstandigheden
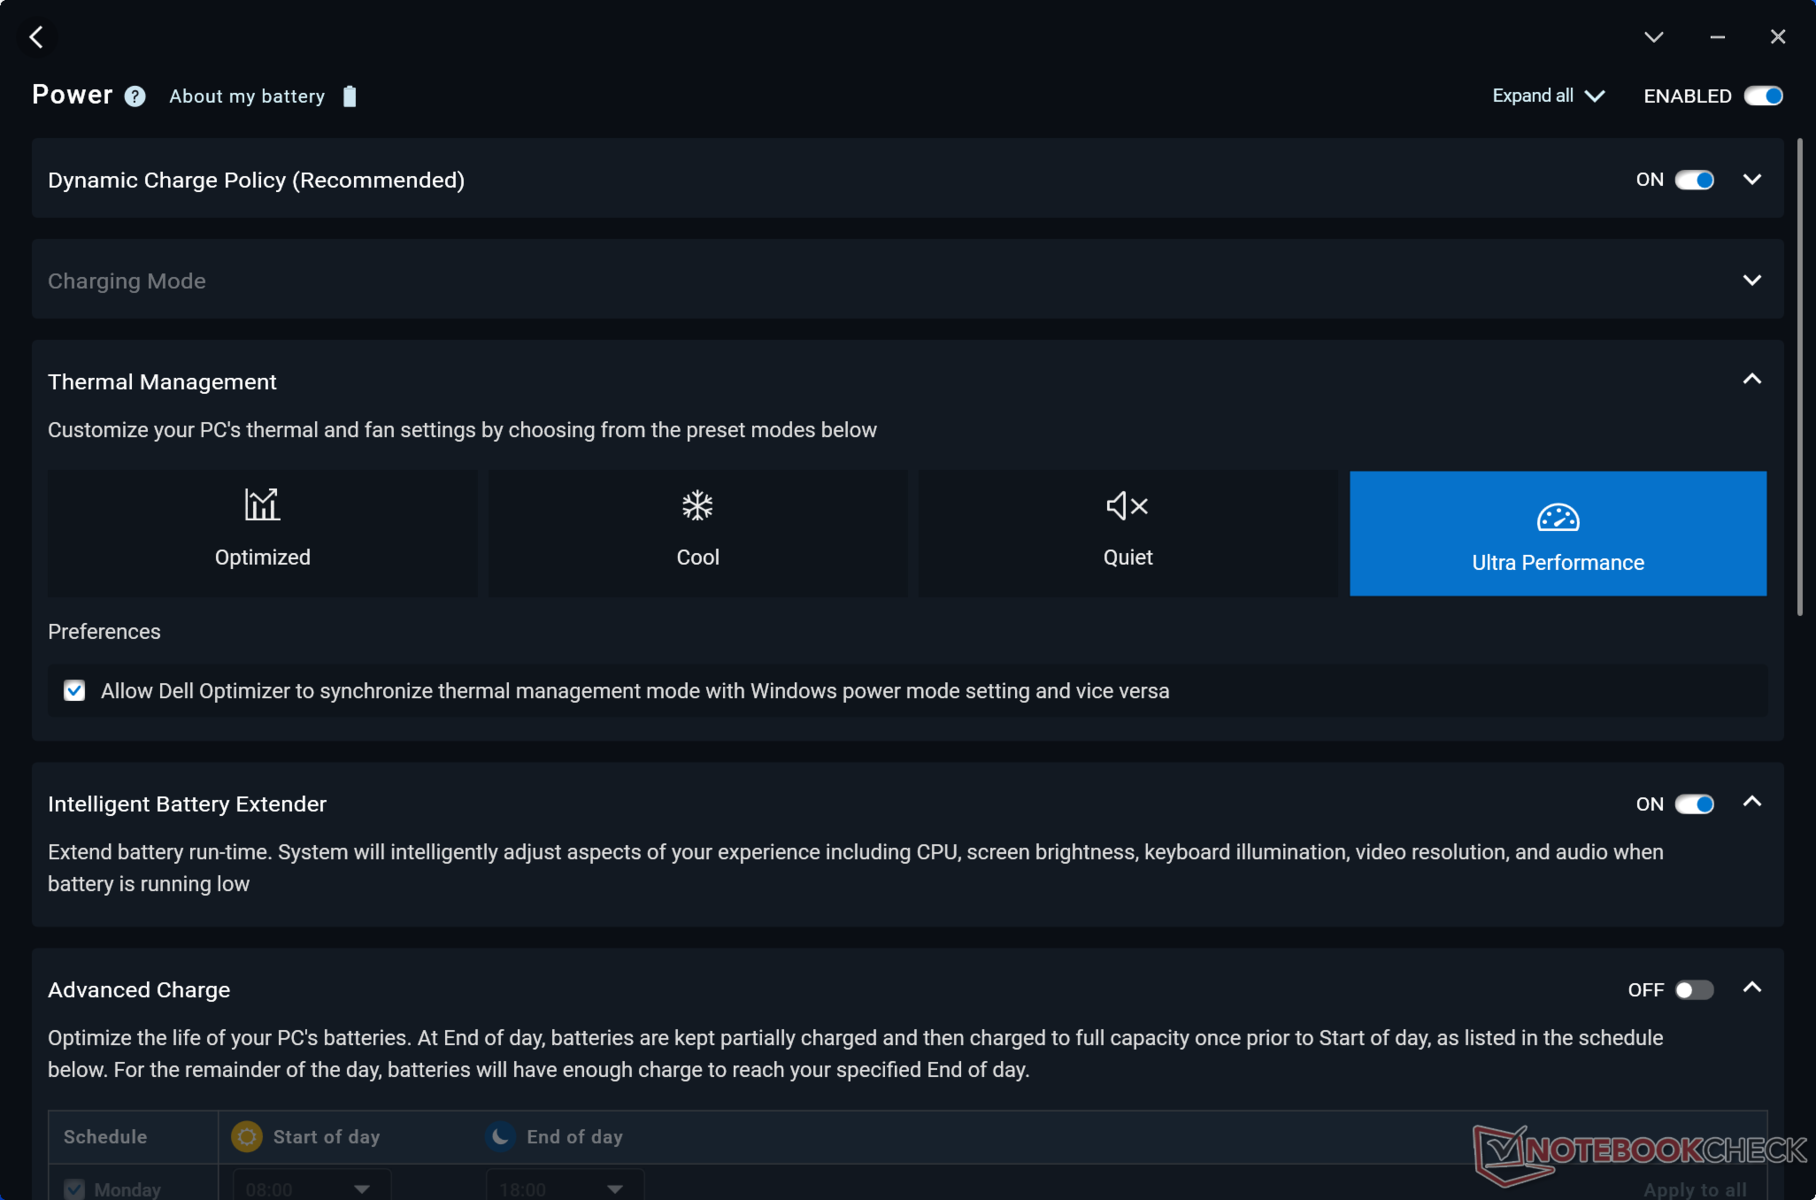
We hebben Dell Optimizer ingesteld op de Ultra Performance-modus voordat we de onderstaande benchmarks uitvoerden. We hebben ook ECC VRAM uitgeschakeld via het Nvidia Configuratiescherm. Het inschakelen van ECC VRAM vermindert het toegankelijke geheugen met ongeveer 1 GB.
Processor
De Core Ultra 9 185H presteert bijna identiek aan de Core i9-13900H in zowel single- als multi-threaded werkbelastingen. Hij profiteert meer van Turbo Boost voor die snellere eerste uitbarsting van snelheid, maar dit voordeel is slechts tijdelijk voordat hij zich vestigt op vergelijkbare prestatieniveaus als de oudere Core i9 Precision 5680, zoals blijkt uit de onderstaande vergelijkingsgrafiek.
Downgraden naar de Core Ultra 7 165H en Ultra 5 135H zal naar verwachting de processorprestaties met respectievelijk 5 tot 10 procent en 40 tot 50 procent beïnvloeden, wat betekent dat de prestatiekloof tussen de Core Ultra 5 en Ultra 7 aanzienlijk groter is dan tussen de Core Ultra 7 en Ultra 9. De Precision 5690 bevat geen 14e generatie Raptor Lake-HX CPU's die de prestaties nog sneller zouden hebben verbeterd dan de Core Ultra 9 185H. Daar staat tegenover dat de Core Ultra CPU's geïntegreerde NPU's bevatten om lokale AI-taken te versnellen wanneer deze in de nabije toekomst gemakkelijker beschikbaar worden.
Cinebench R15 Multi Loop
Cinebench R23: Multi Core | Single Core
Cinebench R20: CPU (Multi Core) | CPU (Single Core)
Cinebench R15: CPU Multi 64Bit | CPU Single 64Bit
Blender: v2.79 BMW27 CPU
7-Zip 18.03: 7z b 4 | 7z b 4 -mmt1
Geekbench 6.4: Multi-Core | Single-Core
Geekbench 5.5: Multi-Core | Single-Core
HWBOT x265 Benchmark v2.2: 4k Preset
LibreOffice : 20 Documents To PDF
R Benchmark 2.5: Overall mean
| Geekbench 6.4 / Multi-Core | |
| HP ZBook Fury 16 G10 | |
| Dell Precision 5000 5680 | |
| Dell Precision 5690 | |
| Dell XPS 16 9640 | |
| Gemiddeld Intel Core Ultra 9 185H (9140 - 14540, n=19) | |
| Lenovo ThinkPad P1 G6-21FV000DGE | |
| Lenovo ThinkPad P16s G2 21K9000CGE | |
| Samsung Galaxy Book4 Pro 360 | |
| Lenovo ThinkPad P16v G1 AMD | |
| Geekbench 6.4 / Single-Core | |
| HP ZBook Fury 16 G10 | |
| Lenovo ThinkPad P1 G6-21FV000DGE | |
| Dell Precision 5000 5680 | |
| Lenovo ThinkPad P16v G1 AMD | |
| Dell Precision 5690 | |
| Lenovo ThinkPad P16s G2 21K9000CGE | |
| Gemiddeld Intel Core Ultra 9 185H (1490 - 2573, n=19) | |
| Dell XPS 16 9640 | |
| Samsung Galaxy Book4 Pro 360 | |
Cinebench R23: Multi Core | Single Core
Cinebench R20: CPU (Multi Core) | CPU (Single Core)
Cinebench R15: CPU Multi 64Bit | CPU Single 64Bit
Blender: v2.79 BMW27 CPU
7-Zip 18.03: 7z b 4 | 7z b 4 -mmt1
Geekbench 6.4: Multi-Core | Single-Core
Geekbench 5.5: Multi-Core | Single-Core
HWBOT x265 Benchmark v2.2: 4k Preset
LibreOffice : 20 Documents To PDF
R Benchmark 2.5: Overall mean
* ... kleiner is beter
AIDA64: FP32 Ray-Trace | FPU Julia | CPU SHA3 | CPU Queen | FPU SinJulia | FPU Mandel | CPU AES | CPU ZLib | FP64 Ray-Trace | CPU PhotoWorxx
| Performance Rating | |
| HP ZBook Fury 16 G10 | |
| Dell Precision 5690 | |
| Lenovo ThinkPad P16 G2 21FA000FGE | |
| Gemiddeld Intel Core Ultra 9 185H | |
| Dell Precision 5000 5680 | |
| MSI CreatorPro Z16P B12UKST | |
| Lenovo ThinkPad P1 G6-21FV000DGE | |
| AIDA64 / FP32 Ray-Trace | |
| HP ZBook Fury 16 G10 | |
| Dell Precision 5690 | |
| Lenovo ThinkPad P16 G2 21FA000FGE | |
| Gemiddeld Intel Core Ultra 9 185H (9220 - 18676, n=19) | |
| Lenovo ThinkPad P1 G6-21FV000DGE | |
| Dell Precision 5000 5680 | |
| MSI CreatorPro Z16P B12UKST | |
| AIDA64 / FPU Julia | |
| HP ZBook Fury 16 G10 | |
| Dell Precision 5690 | |
| Lenovo ThinkPad P16 G2 21FA000FGE | |
| Gemiddeld Intel Core Ultra 9 185H (48865 - 96463, n=19) | |
| Lenovo ThinkPad P1 G6-21FV000DGE | |
| Dell Precision 5000 5680 | |
| MSI CreatorPro Z16P B12UKST | |
| AIDA64 / CPU SHA3 | |
| HP ZBook Fury 16 G10 | |
| Dell Precision 5690 | |
| Lenovo ThinkPad P16 G2 21FA000FGE | |
| Gemiddeld Intel Core Ultra 9 185H (2394 - 4534, n=19) | |
| Lenovo ThinkPad P1 G6-21FV000DGE | |
| MSI CreatorPro Z16P B12UKST | |
| Dell Precision 5000 5680 | |
| AIDA64 / CPU Queen | |
| HP ZBook Fury 16 G10 | |
| Dell Precision 5000 5680 | |
| Lenovo ThinkPad P1 G6-21FV000DGE | |
| Lenovo ThinkPad P16 G2 21FA000FGE | |
| MSI CreatorPro Z16P B12UKST | |
| Dell Precision 5690 | |
| Gemiddeld Intel Core Ultra 9 185H (66785 - 95241, n=19) | |
| AIDA64 / FPU SinJulia | |
| HP ZBook Fury 16 G10 | |
| Lenovo ThinkPad P16 G2 21FA000FGE | |
| Dell Precision 5690 | |
| Gemiddeld Intel Core Ultra 9 185H (7255 - 11392, n=19) | |
| Lenovo ThinkPad P1 G6-21FV000DGE | |
| Dell Precision 5000 5680 | |
| MSI CreatorPro Z16P B12UKST | |
| AIDA64 / FPU Mandel | |
| HP ZBook Fury 16 G10 | |
| Dell Precision 5690 | |
| Lenovo ThinkPad P16 G2 21FA000FGE | |
| Gemiddeld Intel Core Ultra 9 185H (24004 - 48020, n=19) | |
| Lenovo ThinkPad P1 G6-21FV000DGE | |
| Dell Precision 5000 5680 | |
| MSI CreatorPro Z16P B12UKST | |
| AIDA64 / CPU AES | |
| MSI CreatorPro Z16P B12UKST | |
| HP ZBook Fury 16 G10 | |
| Gemiddeld Intel Core Ultra 9 185H (53116 - 154066, n=19) | |
| Dell Precision 5690 | |
| Lenovo ThinkPad P16 G2 21FA000FGE | |
| Lenovo ThinkPad P1 G6-21FV000DGE | |
| Dell Precision 5000 5680 | |
| AIDA64 / CPU ZLib | |
| HP ZBook Fury 16 G10 | |
| Dell Precision 5690 | |
| Gemiddeld Intel Core Ultra 9 185H (678 - 1341, n=19) | |
| Lenovo ThinkPad P16 G2 21FA000FGE | |
| Lenovo ThinkPad P1 G6-21FV000DGE | |
| MSI CreatorPro Z16P B12UKST | |
| Dell Precision 5000 5680 | |
| AIDA64 / FP64 Ray-Trace | |
| HP ZBook Fury 16 G10 | |
| Lenovo ThinkPad P16 G2 21FA000FGE | |
| Dell Precision 5690 | |
| Lenovo ThinkPad P1 G6-21FV000DGE | |
| Gemiddeld Intel Core Ultra 9 185H (4428 - 10078, n=19) | |
| Dell Precision 5000 5680 | |
| MSI CreatorPro Z16P B12UKST | |
| AIDA64 / CPU PhotoWorxx | |
| Dell Precision 5690 | |
| Gemiddeld Intel Core Ultra 9 185H (44547 - 53918, n=19) | |
| Dell Precision 5000 5680 | |
| MSI CreatorPro Z16P B12UKST | |
| HP ZBook Fury 16 G10 | |
| Lenovo ThinkPad P16 G2 21FA000FGE | |
| Lenovo ThinkPad P1 G6-21FV000DGE | |
Stresstest
Bij het starten van de Prime95-stress ging de CPU omhoog naar 3,7 GHz en 120 W, totdat een paar seconden later een kerntemperatuur van 100 C werd bereikt. Daarna daalde hij naar 3 GHz en 73 W en bleef relatief constant. Zowel de kerntemperatuur als het stroomverbruik van het pakket waren iets hoger dan wat we registreerden op de Precision 5680.
Het stroomverbruik van de GPU-kaart tijdens het draaien Witcher 3 stabiel op 72 W, ook al staat de GPU vermeld op 90 W in het Nvidia Control Center. De resultaten zijn vergelijkbaar met die van het model van vorig jaar.
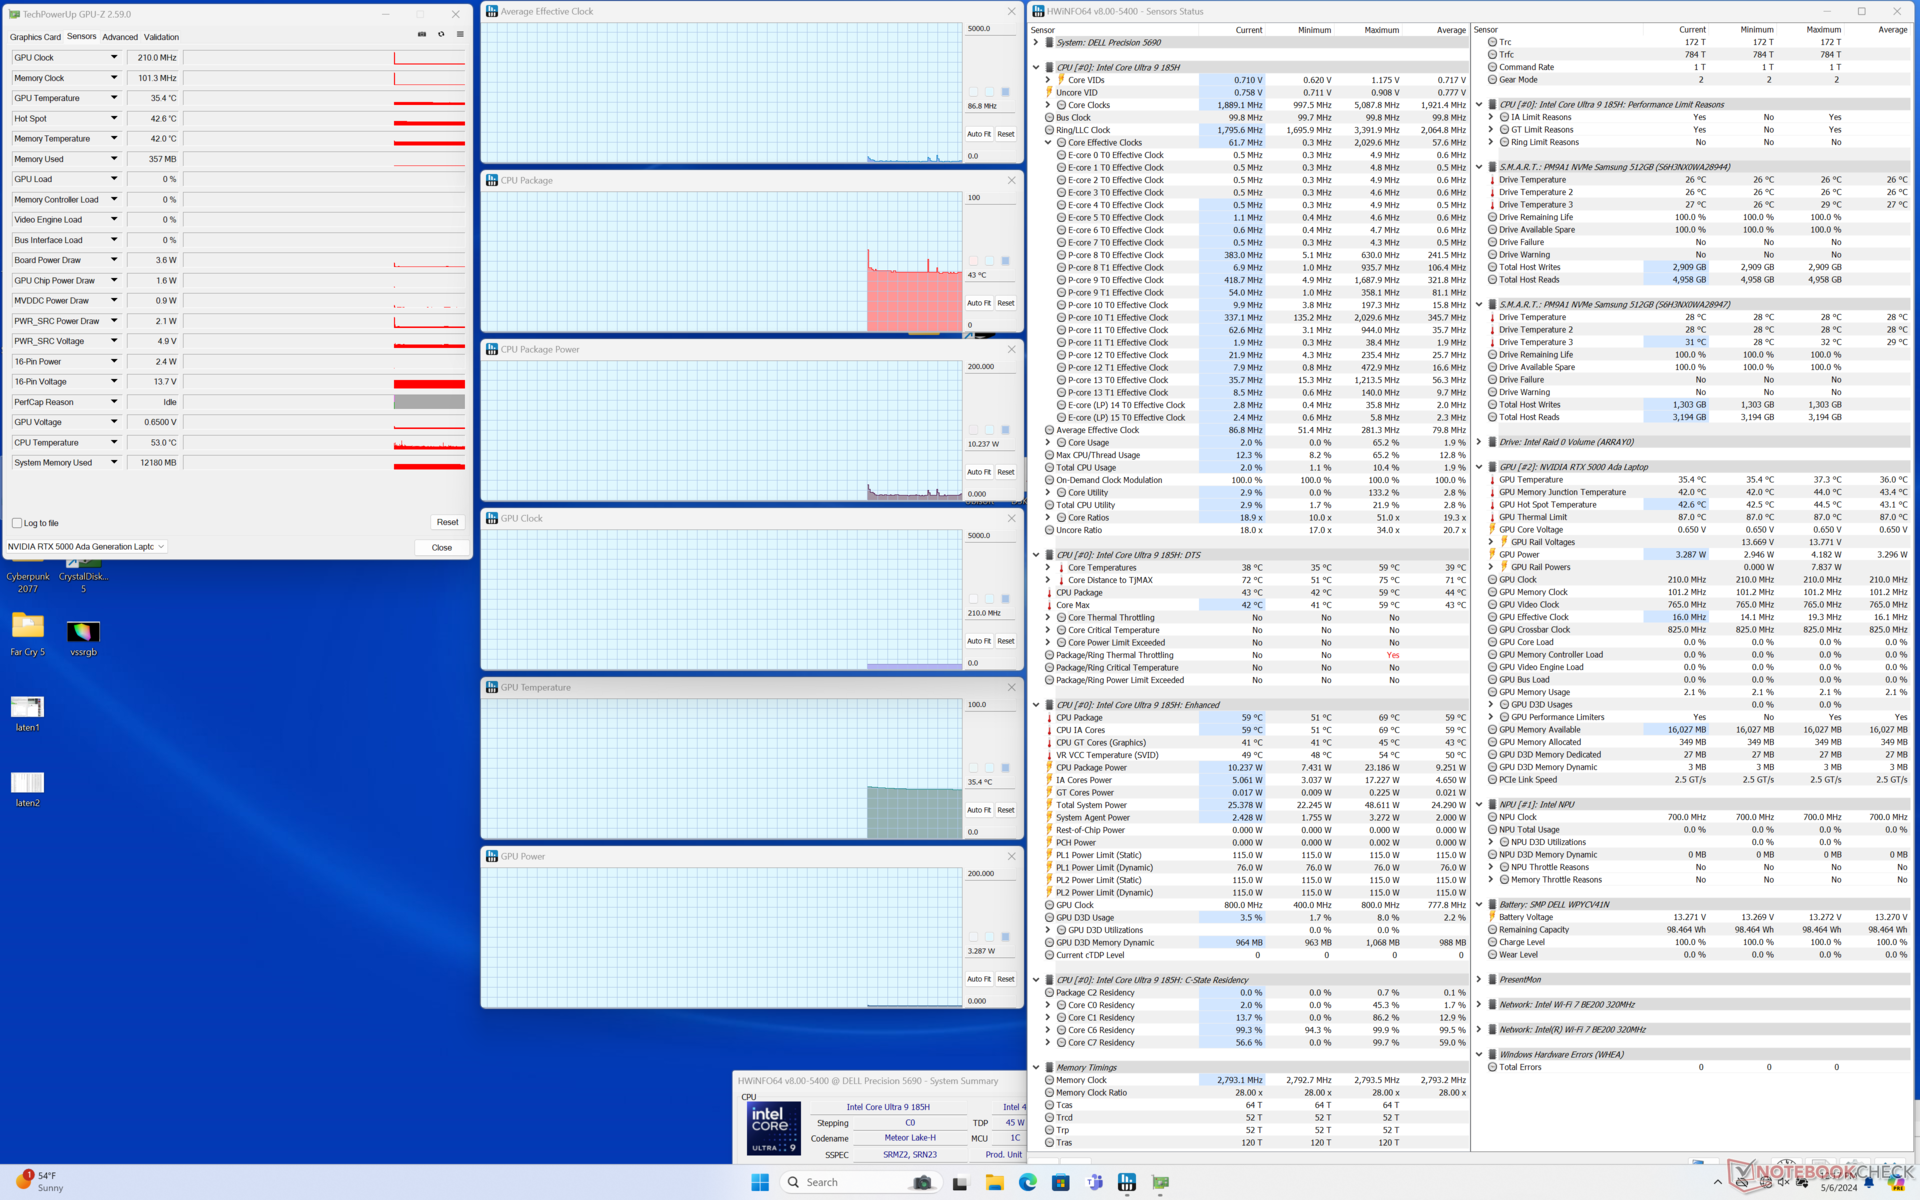
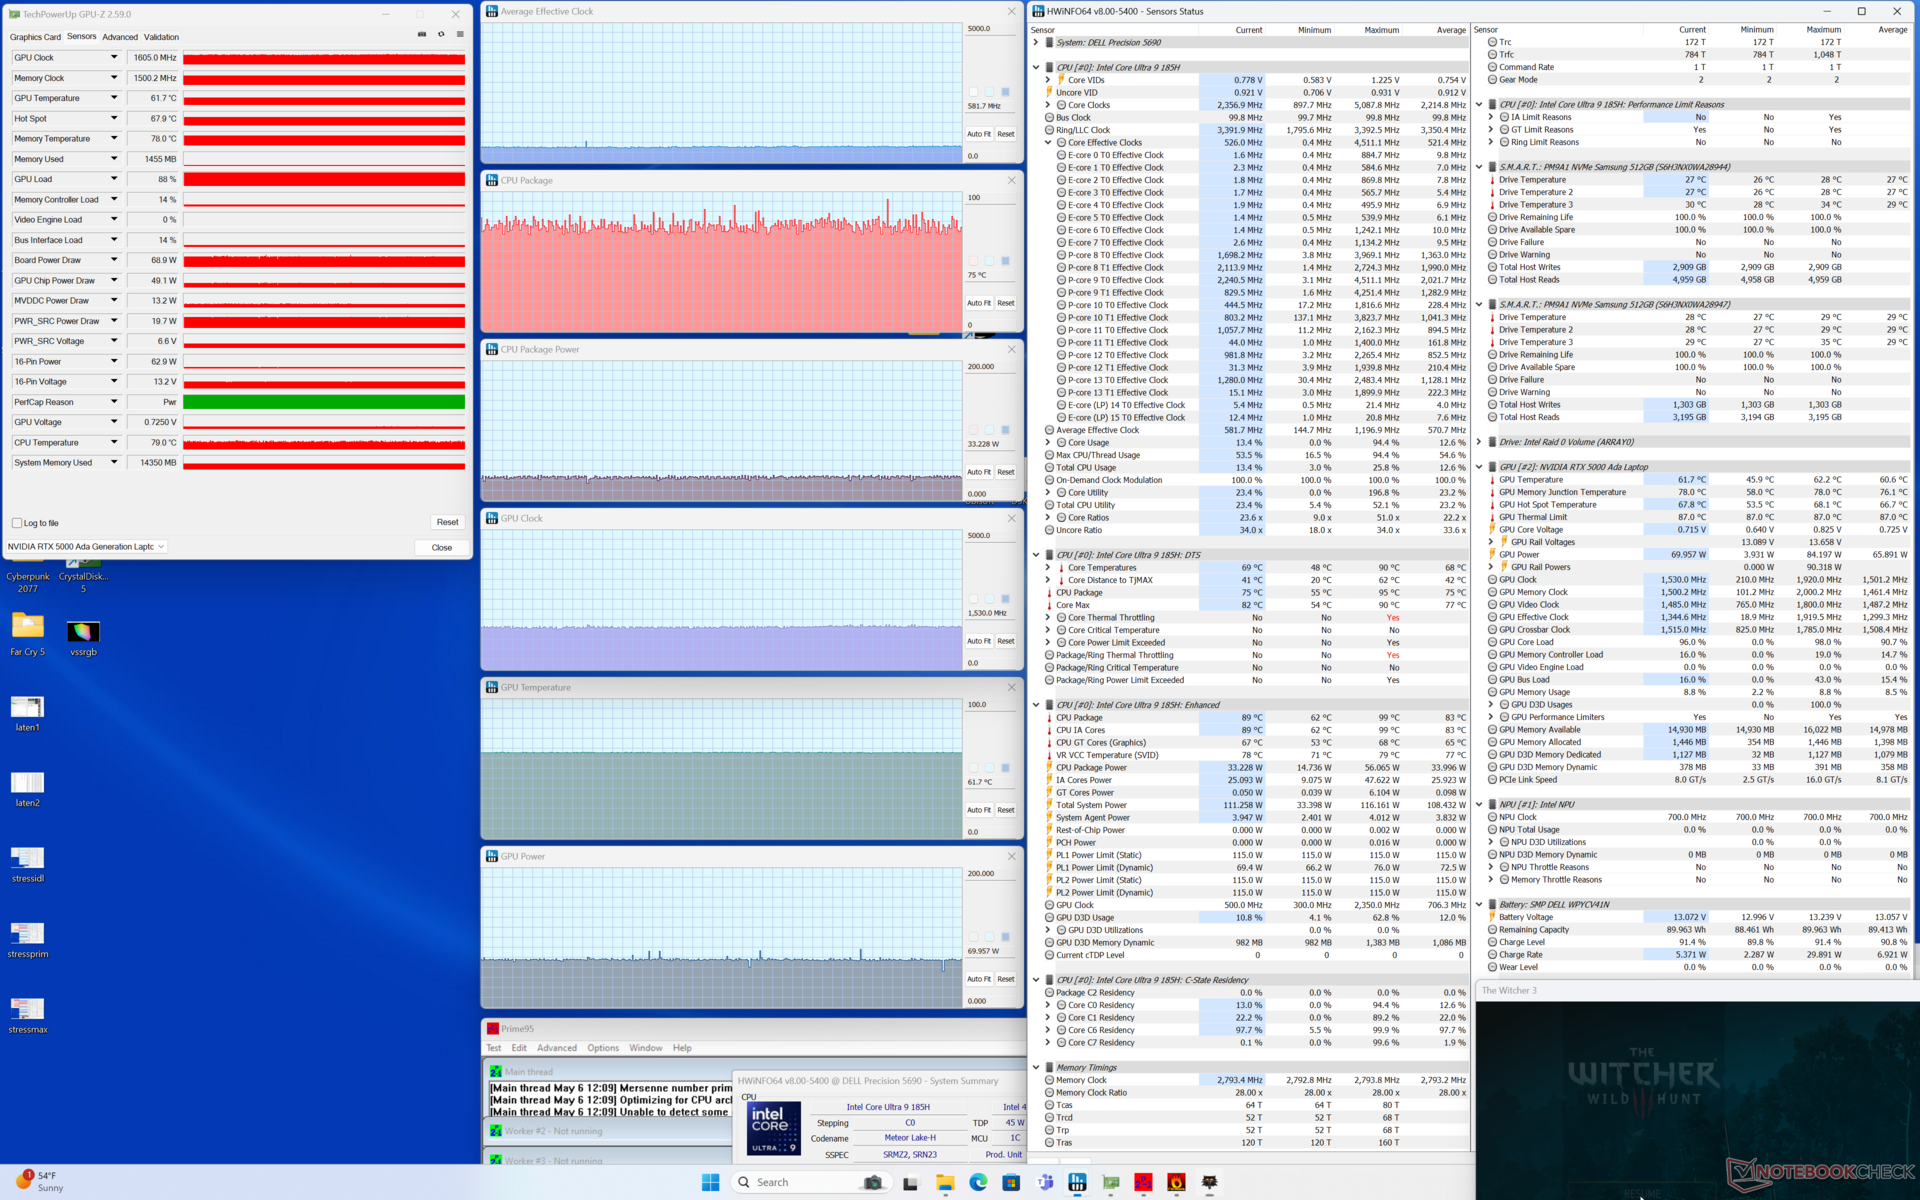
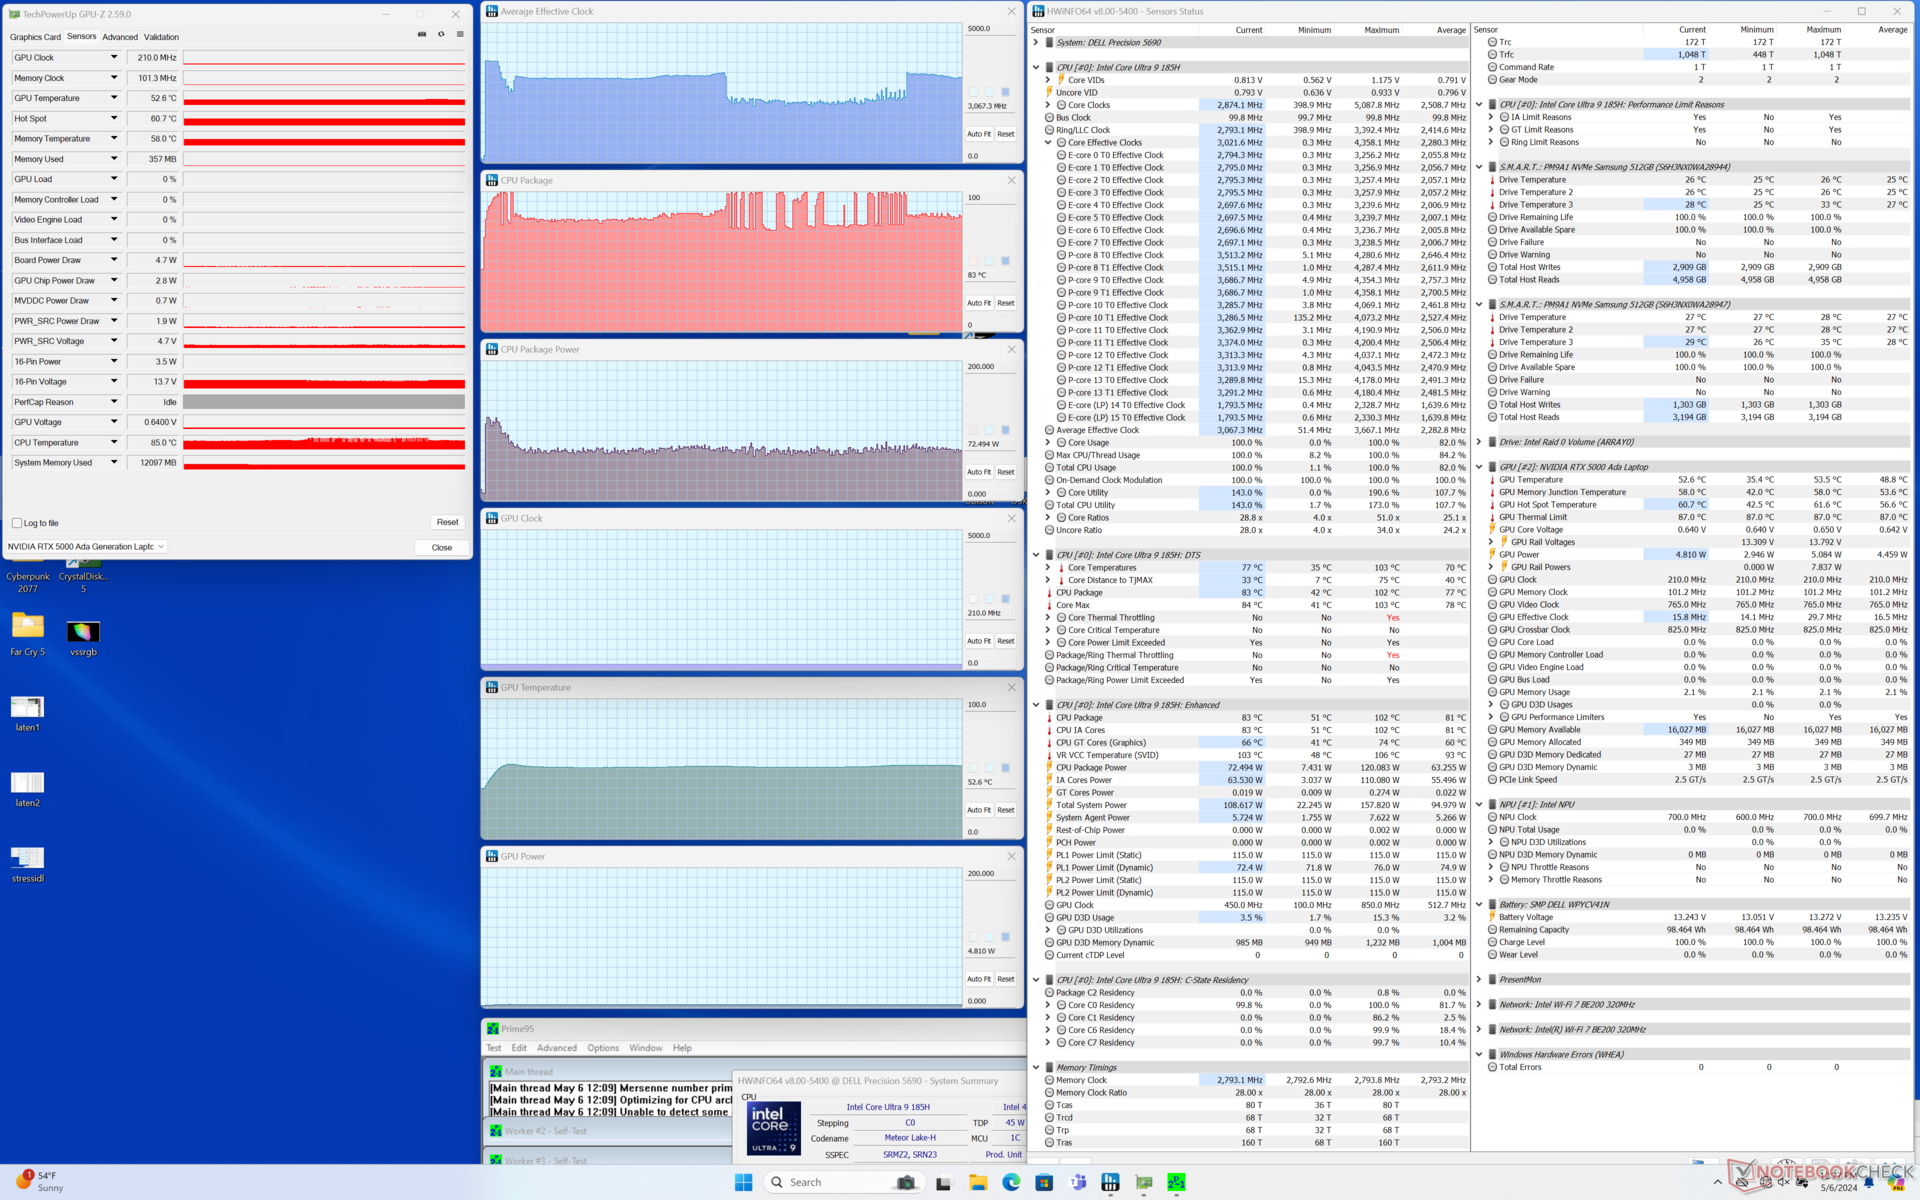
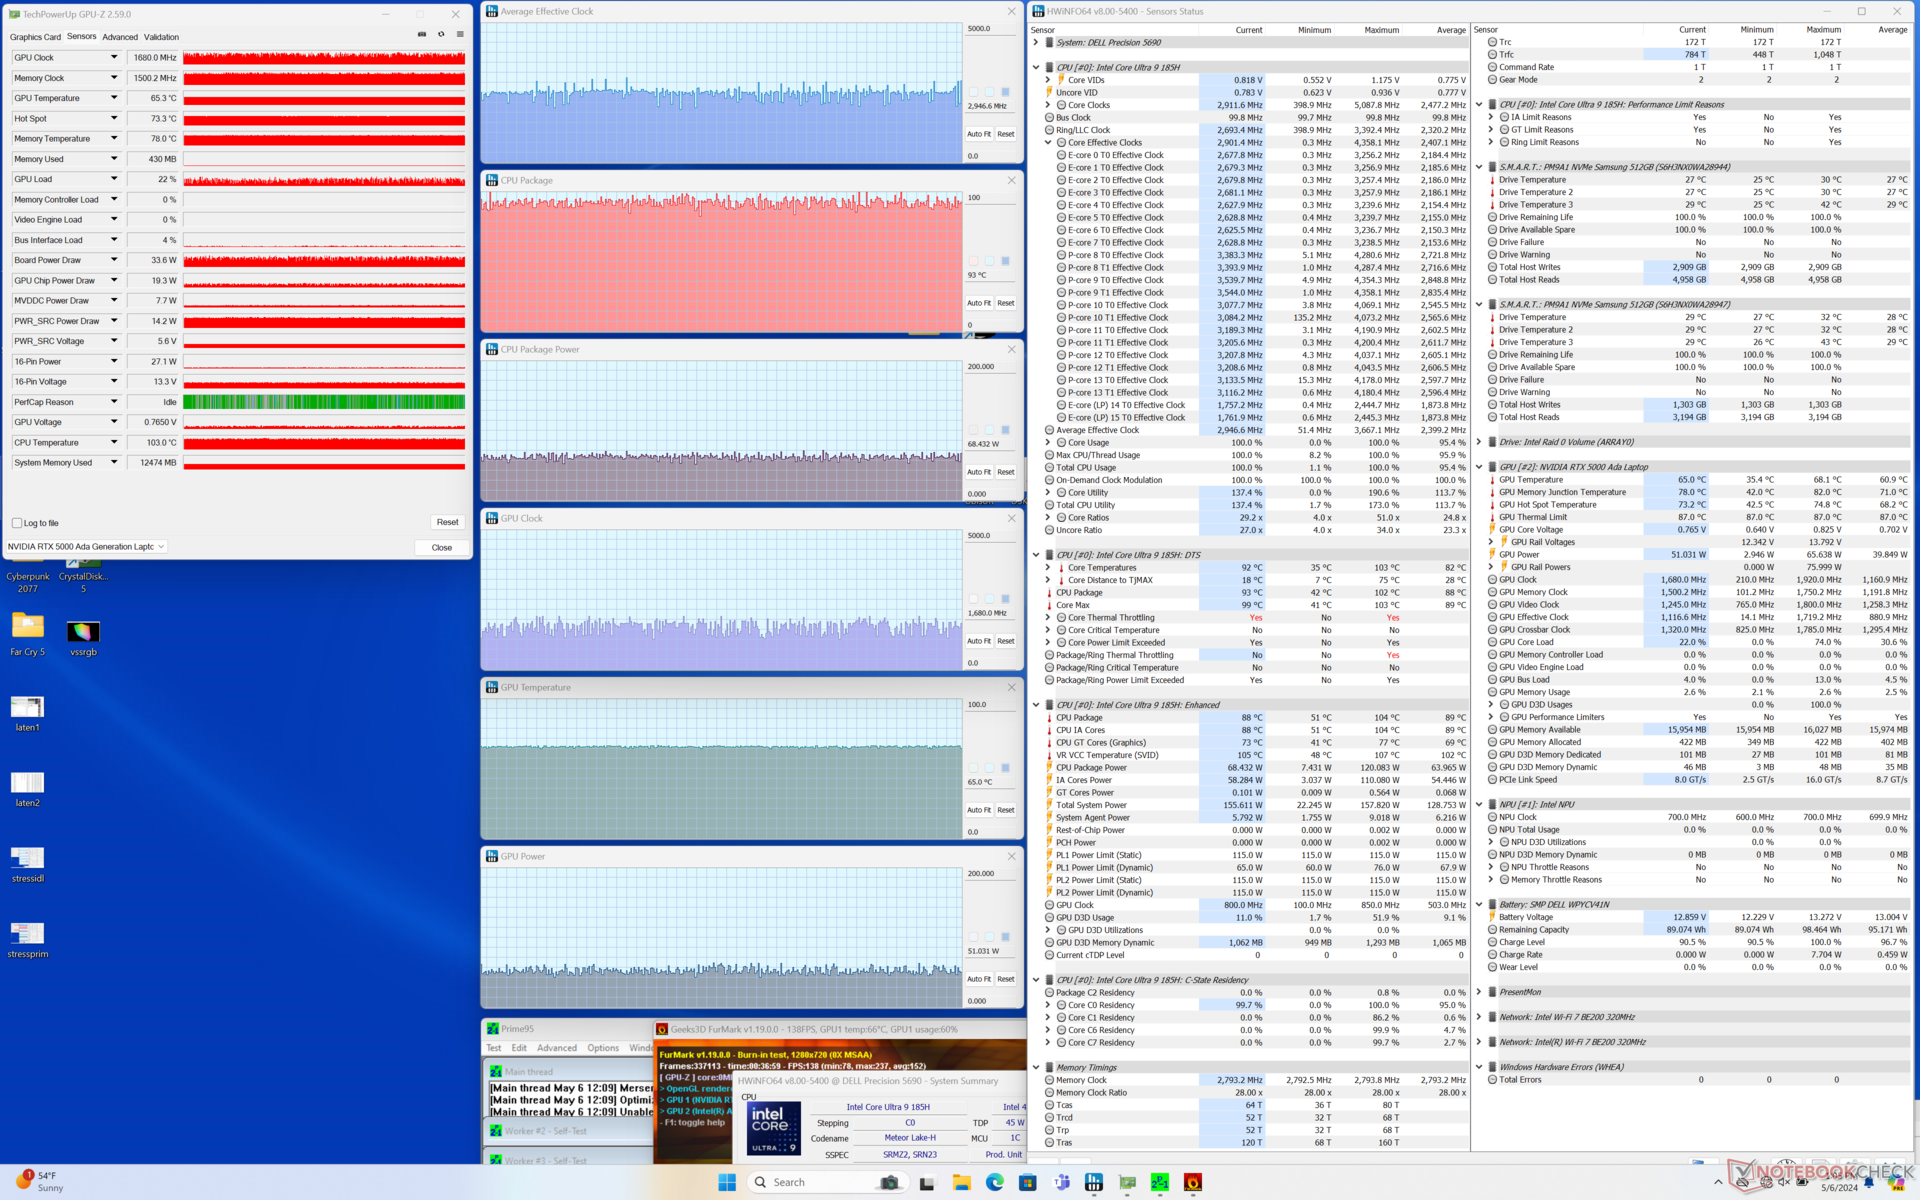
| CPU-klok (GHz) | GPU-klok (MHz) | Gemiddelde CPU-temperatuur (°C) | Gemiddelde GPU-temperatuur (°C) | |
| Systeem inactief | -- | -- | 43 | 35 |
| Prime95-stress | 3.0 | -- | 83 | 53 |
| Prime95 + FurMark Stress | ~3.0 | ~1680 | 93 | 65 |
| Witcher 3 Spanning | ~0.6 | 1530 | 75 | 62 |
Systeemprestaties
PCMark 10 scores zijn in essentie identiek aan wat we op de Precision 5680 vastlegden en suggereren geen grote prestatieverschillen tussen de twee modellen als het aankomt op traditionele taken.
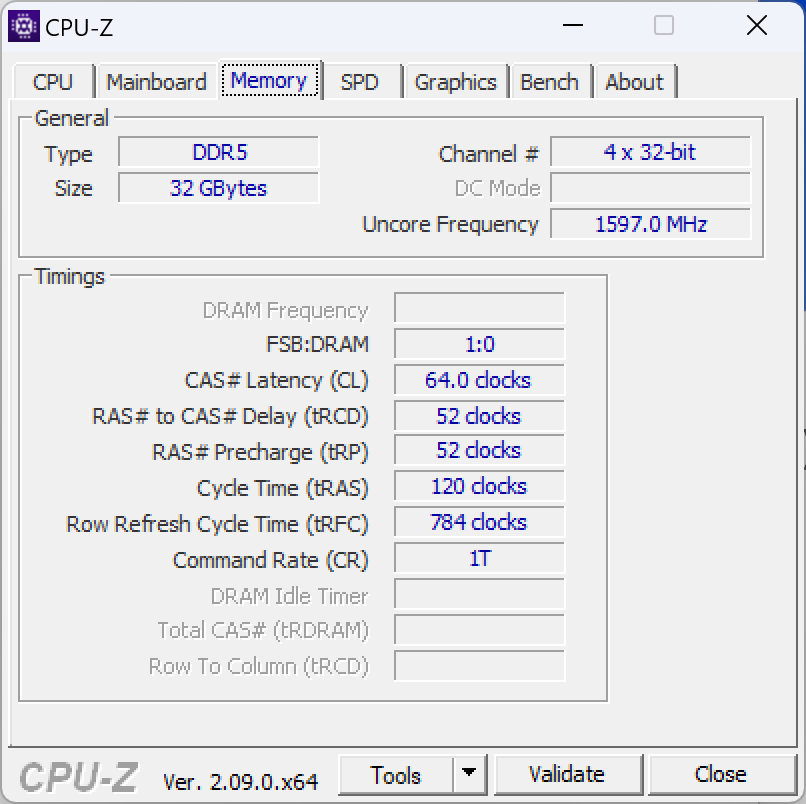
Het systeem-RAM is dit jaar iets sneller (7467 vs. 6000 MT/s) en dit wordt weerspiegeld in de verbeterde AIDA64 benchmarkresultaten.

CrossMark: Overall | Productivity | Creativity | Responsiveness
WebXPRT 3: Overall
WebXPRT 4: Overall
Mozilla Kraken 1.1: Total
| PCMark 10 / Score | |
| Dell Precision 5000 5680 | |
| HP ZBook Fury 16 G10 | |
| Dell Precision 5690 | |
| Gemiddeld Intel Core Ultra 9 185H, Nvidia RTX 5000 Ada Generation Laptop GPU (n=1) | |
| Lenovo ThinkPad P1 G6-21FV000DGE | |
| Lenovo ThinkPad P16 G2 21FA000FGE | |
| MSI CreatorPro Z16P B12UKST | |
| PCMark 10 / Essentials | |
| Dell Precision 5000 5680 | |
| Lenovo ThinkPad P1 G6-21FV000DGE | |
| HP ZBook Fury 16 G10 | |
| Dell Precision 5690 | |
| Gemiddeld Intel Core Ultra 9 185H, Nvidia RTX 5000 Ada Generation Laptop GPU (n=1) | |
| Lenovo ThinkPad P16 G2 21FA000FGE | |
| MSI CreatorPro Z16P B12UKST | |
| PCMark 10 / Productivity | |
| Dell Precision 5000 5680 | |
| Dell Precision 5690 | |
| Gemiddeld Intel Core Ultra 9 185H, Nvidia RTX 5000 Ada Generation Laptop GPU (n=1) | |
| Lenovo ThinkPad P1 G6-21FV000DGE | |
| Lenovo ThinkPad P16 G2 21FA000FGE | |
| MSI CreatorPro Z16P B12UKST | |
| HP ZBook Fury 16 G10 | |
| PCMark 10 / Digital Content Creation | |
| HP ZBook Fury 16 G10 | |
| Dell Precision 5000 5680 | |
| Dell Precision 5690 | |
| Gemiddeld Intel Core Ultra 9 185H, Nvidia RTX 5000 Ada Generation Laptop GPU (n=1) | |
| Lenovo ThinkPad P1 G6-21FV000DGE | |
| MSI CreatorPro Z16P B12UKST | |
| Lenovo ThinkPad P16 G2 21FA000FGE | |
| CrossMark / Overall | |
| MSI CreatorPro Z16P B12UKST | |
| Dell Precision 5000 5680 | |
| HP ZBook Fury 16 G10 | |
| Lenovo ThinkPad P1 G6-21FV000DGE | |
| Lenovo ThinkPad P16 G2 21FA000FGE | |
| Dell Precision 5690 | |
| Gemiddeld Intel Core Ultra 9 185H, Nvidia RTX 5000 Ada Generation Laptop GPU (n=1) | |
| CrossMark / Productivity | |
| HP ZBook Fury 16 G10 | |
| MSI CreatorPro Z16P B12UKST | |
| Dell Precision 5000 5680 | |
| Lenovo ThinkPad P1 G6-21FV000DGE | |
| Dell Precision 5690 | |
| Gemiddeld Intel Core Ultra 9 185H, Nvidia RTX 5000 Ada Generation Laptop GPU (n=1) | |
| Lenovo ThinkPad P16 G2 21FA000FGE | |
| CrossMark / Creativity | |
| Dell Precision 5000 5680 | |
| Lenovo ThinkPad P16 G2 21FA000FGE | |
| HP ZBook Fury 16 G10 | |
| MSI CreatorPro Z16P B12UKST | |
| Lenovo ThinkPad P1 G6-21FV000DGE | |
| Dell Precision 5690 | |
| Gemiddeld Intel Core Ultra 9 185H, Nvidia RTX 5000 Ada Generation Laptop GPU (n=1) | |
| CrossMark / Responsiveness | |
| MSI CreatorPro Z16P B12UKST | |
| HP ZBook Fury 16 G10 | |
| Lenovo ThinkPad P1 G6-21FV000DGE | |
| Dell Precision 5000 5680 | |
| Dell Precision 5690 | |
| Gemiddeld Intel Core Ultra 9 185H, Nvidia RTX 5000 Ada Generation Laptop GPU (n=1) | |
| Lenovo ThinkPad P16 G2 21FA000FGE | |
| WebXPRT 3 / Overall | |
| Dell Precision 5000 5680 | |
| HP ZBook Fury 16 G10 | |
| Lenovo ThinkPad P16 G2 21FA000FGE | |
| Lenovo ThinkPad P1 G6-21FV000DGE | |
| MSI CreatorPro Z16P B12UKST | |
| Dell Precision 5690 | |
| Gemiddeld Intel Core Ultra 9 185H, Nvidia RTX 5000 Ada Generation Laptop GPU (n=1) | |
| WebXPRT 4 / Overall | |
| Lenovo ThinkPad P1 G6-21FV000DGE | |
| HP ZBook Fury 16 G10 | |
| Dell Precision 5000 5680 | |
| Dell Precision 5690 | |
| Gemiddeld Intel Core Ultra 9 185H, Nvidia RTX 5000 Ada Generation Laptop GPU (n=1) | |
| MSI CreatorPro Z16P B12UKST | |
| Mozilla Kraken 1.1 / Total | |
| MSI CreatorPro Z16P B12UKST | |
| Dell Precision 5690 | |
| Gemiddeld Intel Core Ultra 9 185H, Nvidia RTX 5000 Ada Generation Laptop GPU (n=1) | |
| Lenovo ThinkPad P16 G2 21FA000FGE | |
| Dell Precision 5000 5680 | |
| Lenovo ThinkPad P1 G6-21FV000DGE | |
| HP ZBook Fury 16 G10 | |
* ... kleiner is beter
| PCMark 10 Score | 8065 punten | |
Help | ||
| AIDA64 / Memory Copy | |
| Dell Precision 5690 | |
| Gemiddeld Intel Core Ultra 9 185H (69929 - 95718, n=19) | |
| Dell Precision 5000 5680 | |
| MSI CreatorPro Z16P B12UKST | |
| HP ZBook Fury 16 G10 | |
| Lenovo ThinkPad P16 G2 21FA000FGE | |
| Lenovo ThinkPad P1 G6-21FV000DGE | |
| AIDA64 / Memory Read | |
| Dell Precision 5690 | |
| Gemiddeld Intel Core Ultra 9 185H (64619 - 87768, n=19) | |
| Dell Precision 5000 5680 | |
| MSI CreatorPro Z16P B12UKST | |
| HP ZBook Fury 16 G10 | |
| Lenovo ThinkPad P16 G2 21FA000FGE | |
| Lenovo ThinkPad P1 G6-21FV000DGE | |
| AIDA64 / Memory Write | |
| Dell Precision 5000 5680 | |
| Dell Precision 5690 | |
| Gemiddeld Intel Core Ultra 9 185H (51114 - 93871, n=19) | |
| MSI CreatorPro Z16P B12UKST | |
| HP ZBook Fury 16 G10 | |
| Lenovo ThinkPad P16 G2 21FA000FGE | |
| Lenovo ThinkPad P1 G6-21FV000DGE | |
| AIDA64 / Memory Latency | |
| Gemiddeld Intel Core Ultra 9 185H (121.4 - 259, n=19) | |
| Dell Precision 5690 | |
| HP ZBook Fury 16 G10 | |
| Lenovo ThinkPad P16 G2 21FA000FGE | |
| MSI CreatorPro Z16P B12UKST | |
| Dell Precision 5000 5680 | |
| Lenovo ThinkPad P1 G6-21FV000DGE | |
* ... kleiner is beter
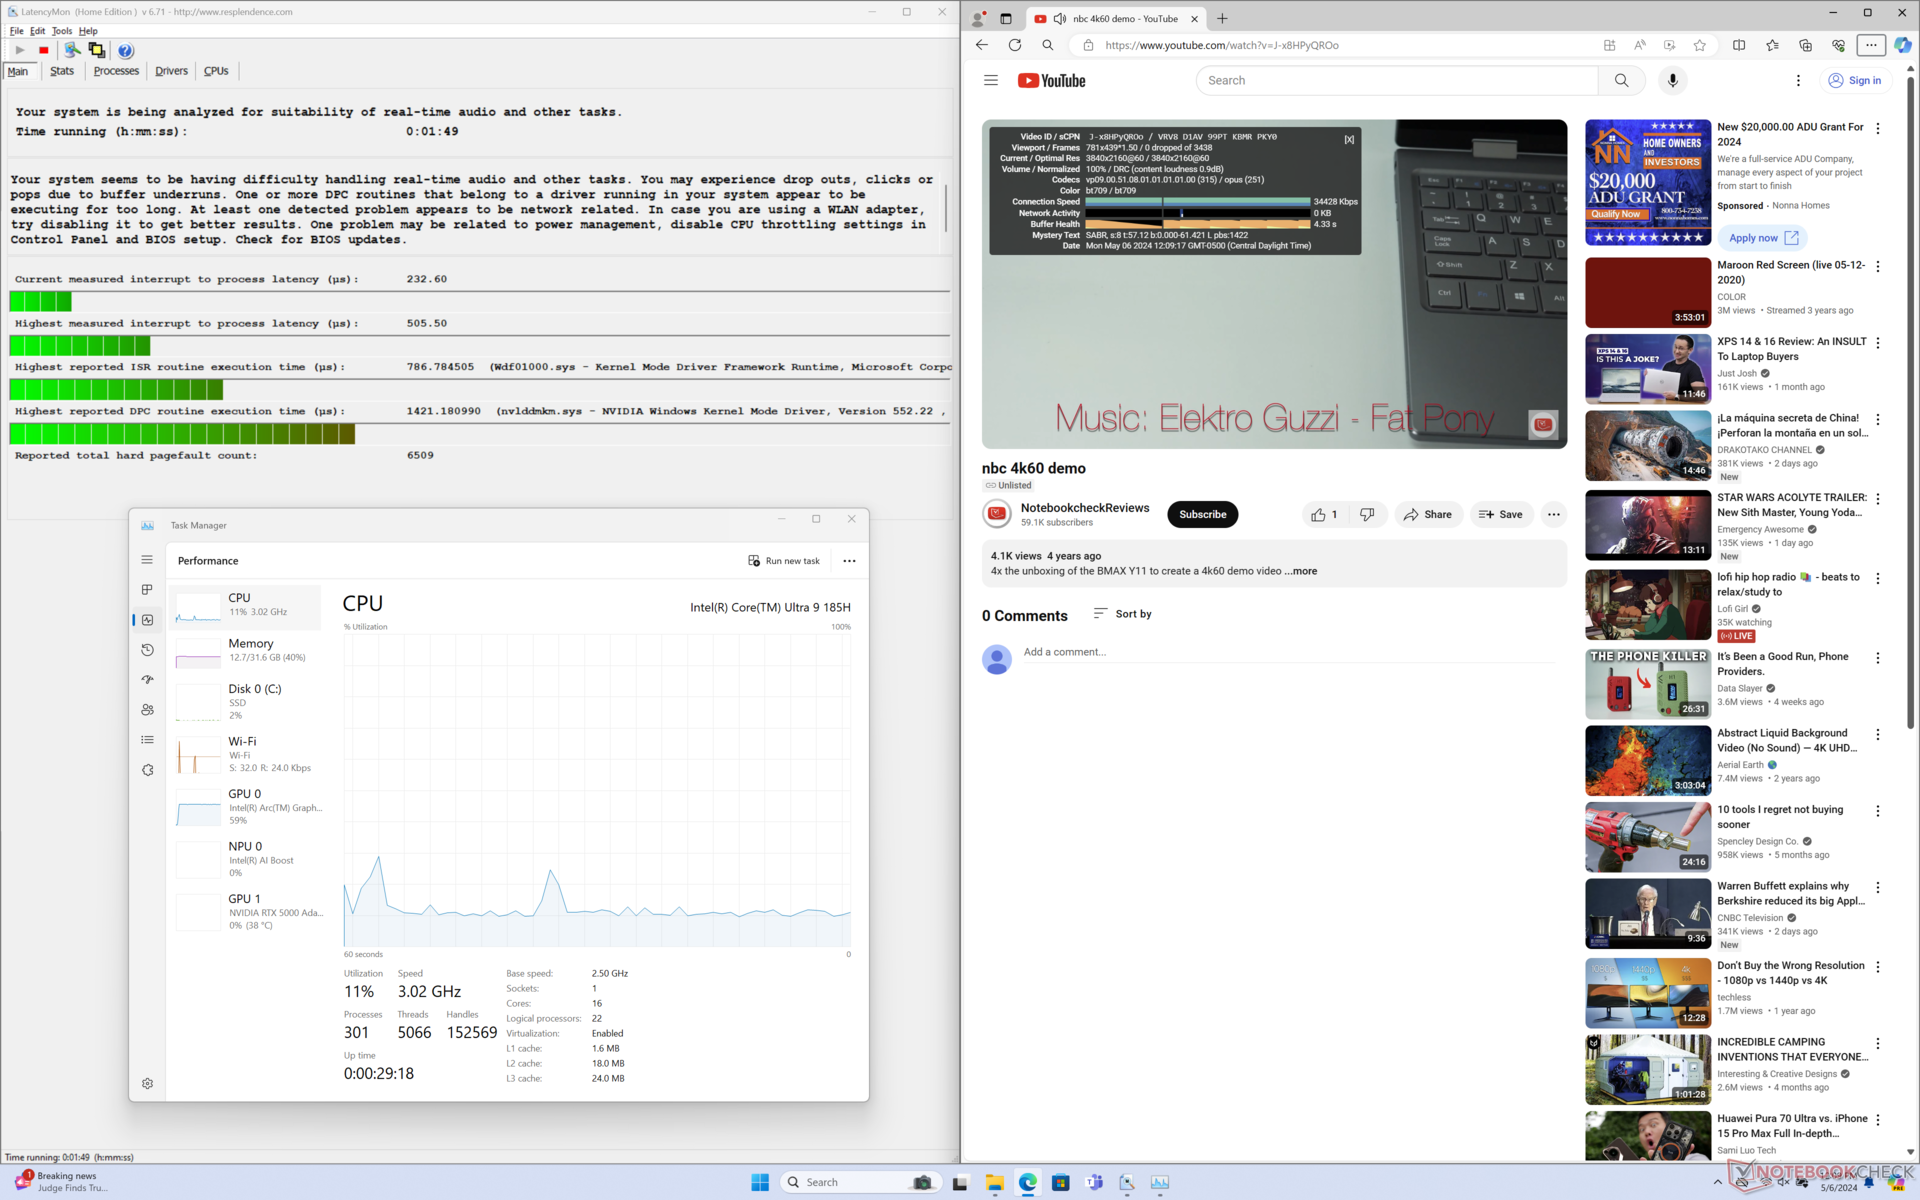
DPC latentie
LatencyMon laat slechts kleine DPC-problemen zien bij het openen van meerdere browsertabbladen van onze startpagina. het afspelen van 4K-video's met 60 FPS verloopt verder perfect, zonder dropped frames.

| DPC Latencies / LatencyMon - interrupt to process latency (max), Web, Youtube, Prime95 | |
| HP ZBook Fury 16 G10 | |
| Lenovo ThinkPad P1 G6-21FV000DGE | |
| Dell Precision 5000 5680 | |
| Lenovo ThinkPad P16 G2 21FA000FGE | |
| MSI CreatorPro Z16P B12UKST | |
| Dell Precision 5690 | |
* ... kleiner is beter
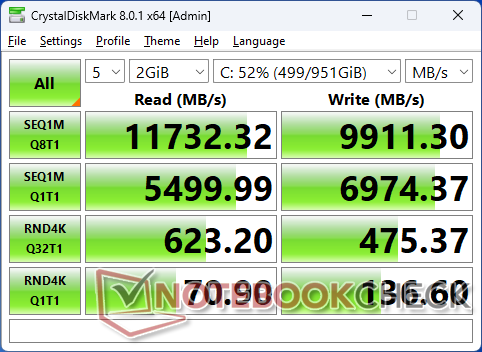
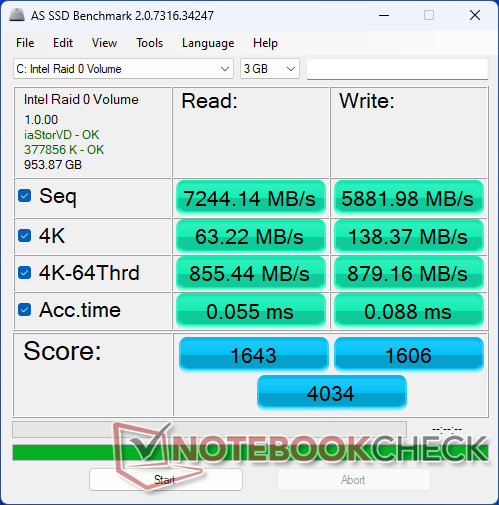
Opslagapparaten
Ons testapparaat wordt geleverd met twee Samsung PM9A1 PCIe4 x4 NVMe SSD's in RAID 0-configuratie voor lees- en schrijfsnelheden van respectievelijk meer dan 12000 MB/s en 9000 MB/s. De prestaties zijn stabiel zonder throttled tijdens het uitvoeren van DiskSpd in een lus.

| Drive Performance Rating - Percent | |
| MSI CreatorPro Z16P B12UKST -8! | |
| Lenovo ThinkPad P1 G6-21FV000DGE | |
| Dell Precision 5690 | |
| HP ZBook Fury 16 G10 | |
| Dell Precision 5000 5680 | |
| Lenovo ThinkPad P16 G2 21FA000FGE | |
* ... kleiner is beter
Disk Throttling: DiskSpd Read Loop, Queue Depth 8
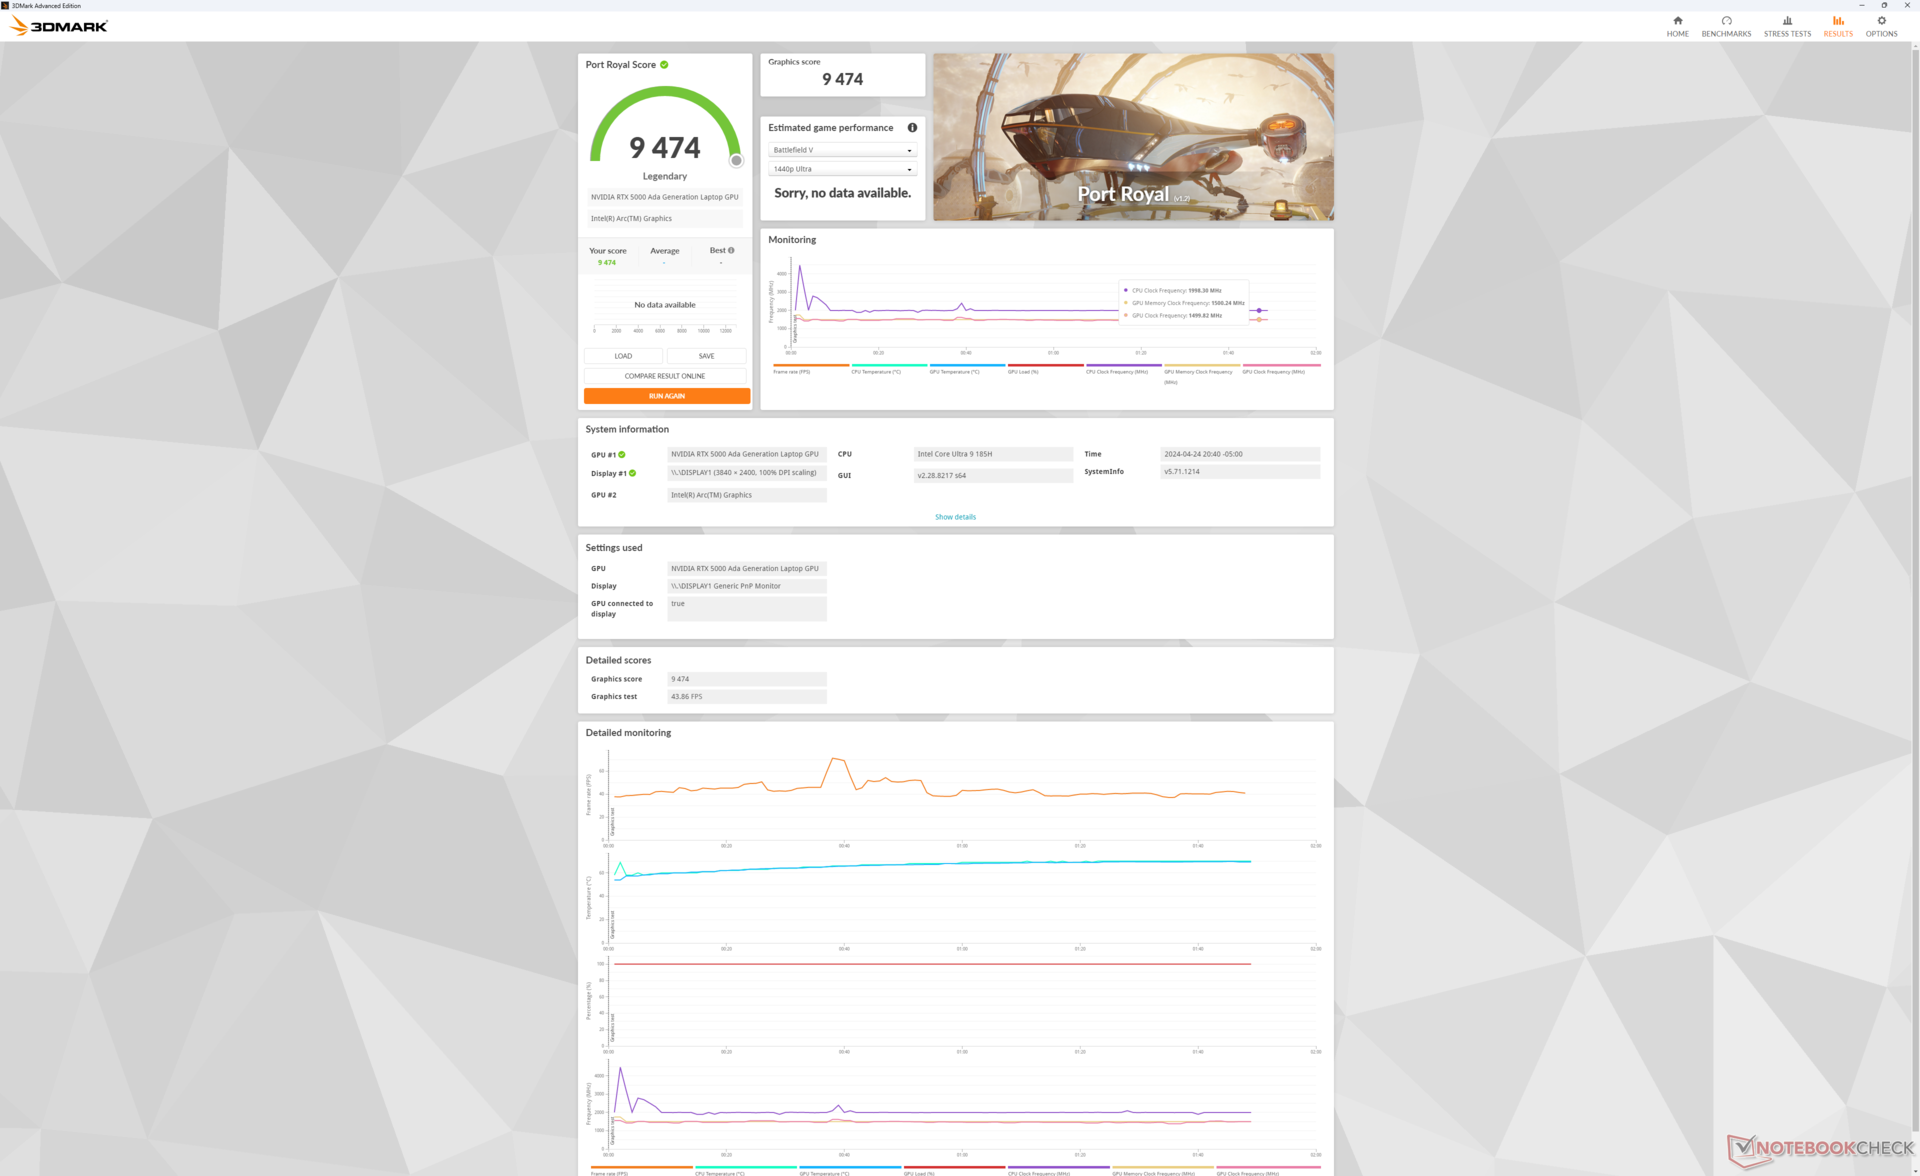
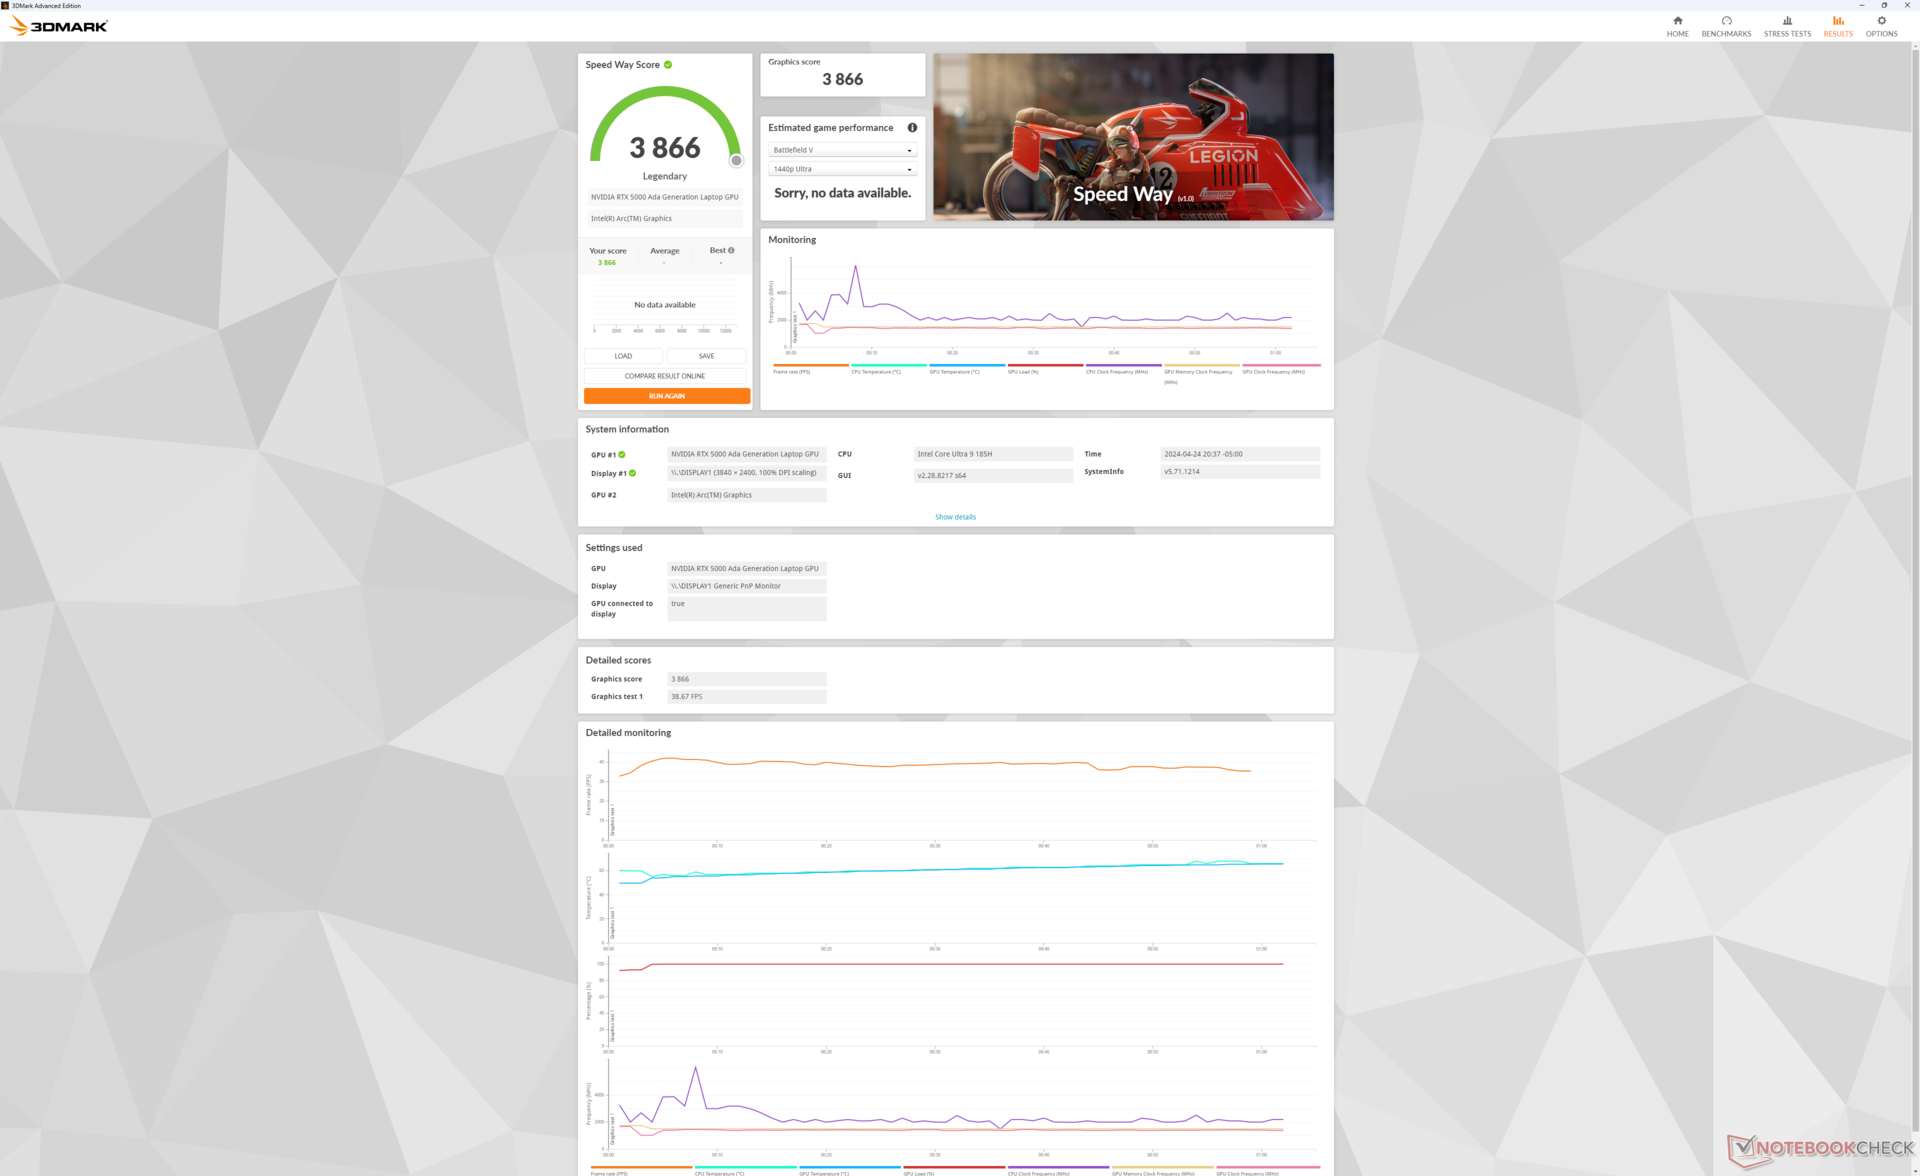
GPU-prestaties - Tot RTX 5000 Ada
De GPU-opties van Nvidia zijn niet veranderd ten opzichte van vroeger en dus is de RTX 5000 Ada nog steeds de top-of-the-line optie. Deze GPU is afgeleid van de GeForce RTX 4090 en bevat daarom 16 GB VRAM in plaats van 12 GB bij configuratie met de langzamere RTX 4000 Ada of 3500 Ada. Gebruikers kunnen kiezen uit een groot aantal RTX Ada GPU's, waaronder de RTX 1000 Ada en onze RTX 5000 Ada configuratie.
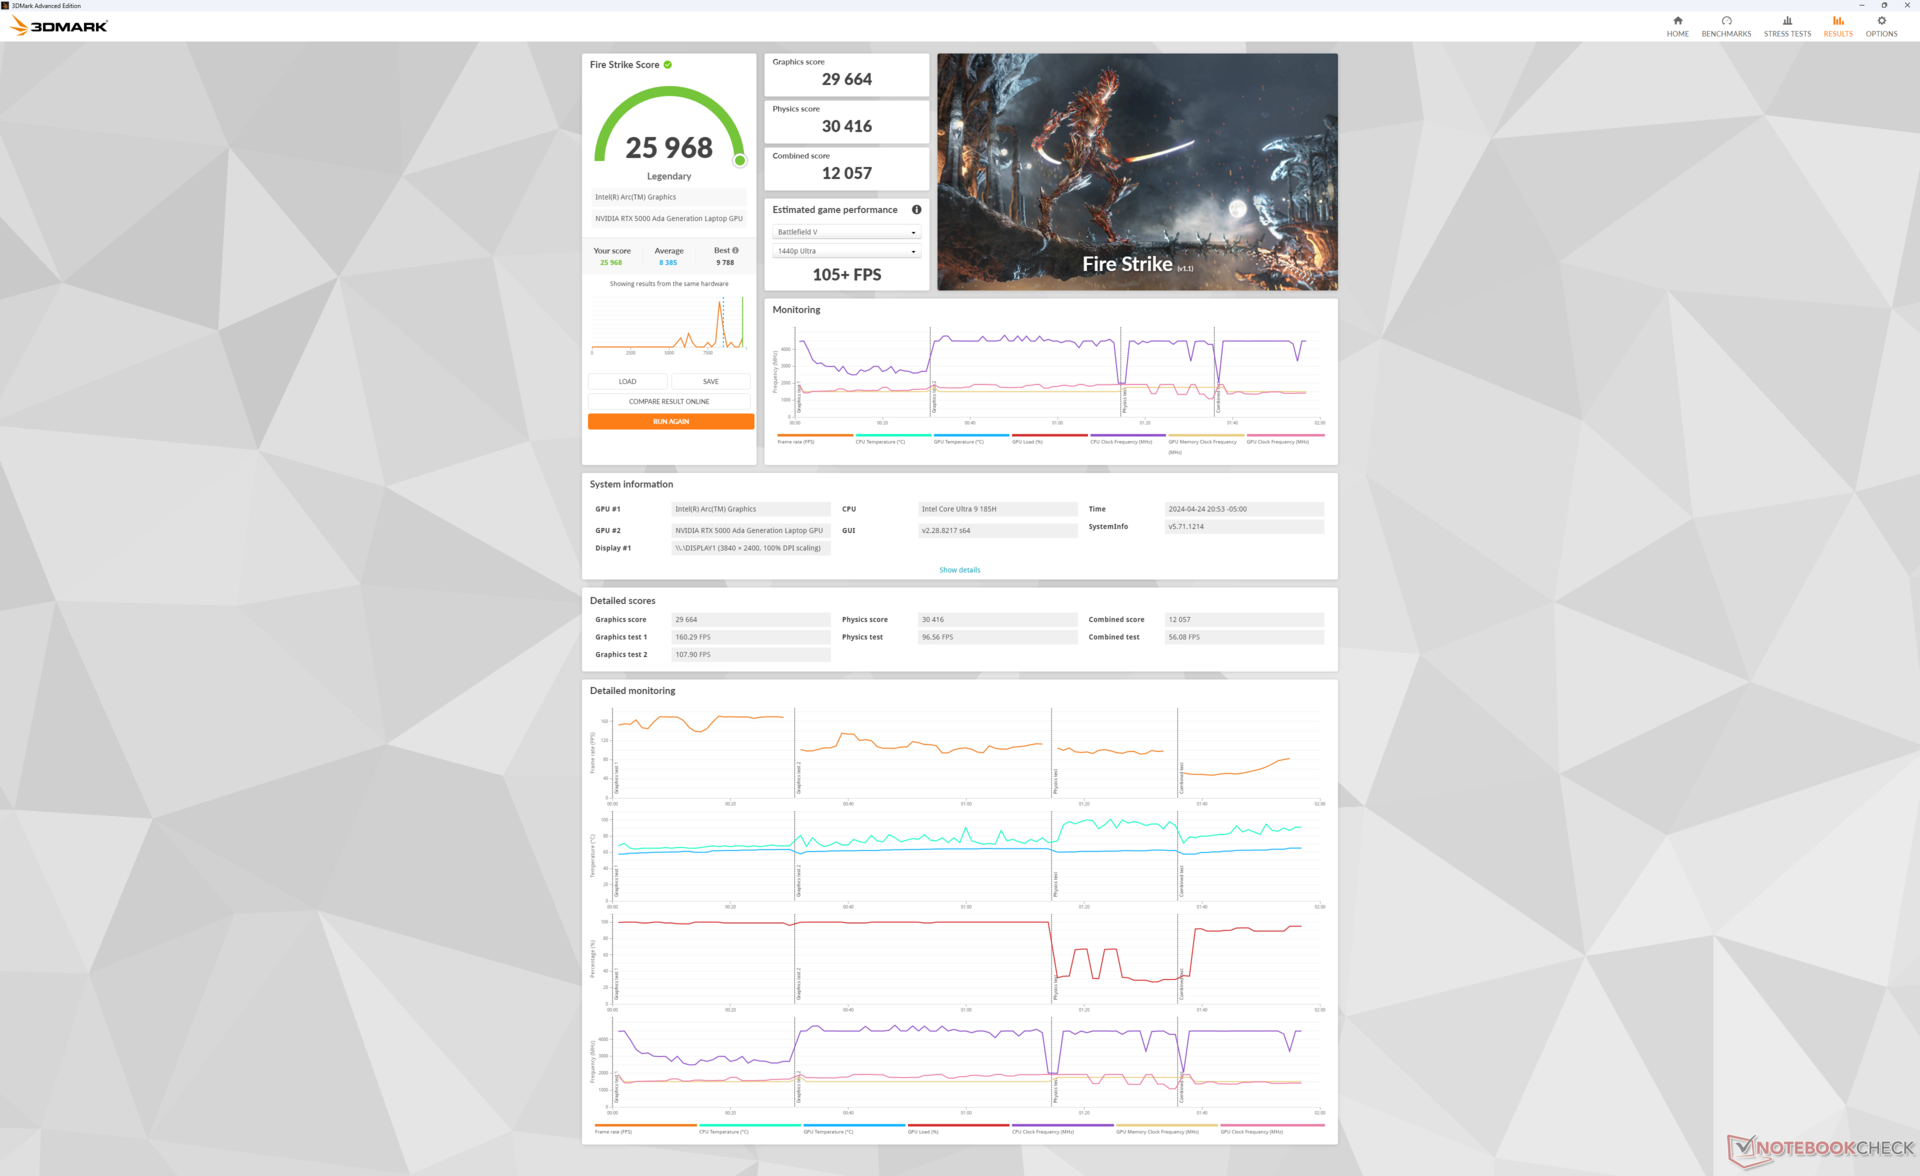
| Vermogen | Grafische Score | Fysieke Score | Gecombineerde Score |
| Prestatiemodus | 29664 | 30416 | 12057 |
| Evenwichtige modus | 29771 (-0%) | 27199 (-11%) | 11770 (-2%) |
| Batterijvoeding | 26674 (-10%) | 20268 (-33%) | 9539 (-21%) |
Het draaien in de gebalanceerde modus heeft invloed op de processorprestaties, terwijl de grafische prestaties hetzelfde blijven, zoals onze bovenstaande Fire Strike resultaten laten zien.
| 3DMark Performance Rating - Percent | |
| HP ZBook Fury 16 G10 -2! | |
| Gemiddeld Nvidia RTX 5000 Ada Generation Laptop GPU | |
| Dell Precision 5690 -2! | |
| Dell Precision 5000 5680 -2! | |
| Asus ProArt StudioBook 16 W7600H5A-2BL2 -20! | |
| HP ZBook Fury 16 G9 -2! | |
| Dell XPS 16 9640 -35! | |
| Lenovo ThinkPad P1 G6-21FV000DGE -16! | |
| Lenovo ThinkPad P16 G2 21FA000FGE -18! | |
| MSI CreatorPro Z16P B12UKST -17! | |
| Lenovo ThinkPad P16v G1 AMD -16! | |
| Lenovo ThinkPad P16 G1 21D6001DMB -18! | |
| Lenovo ThinkPad P1 G4-20Y30017GE -18! | |
| Lenovo ThinkPad P16s G2 21K9000CGE -18! | |
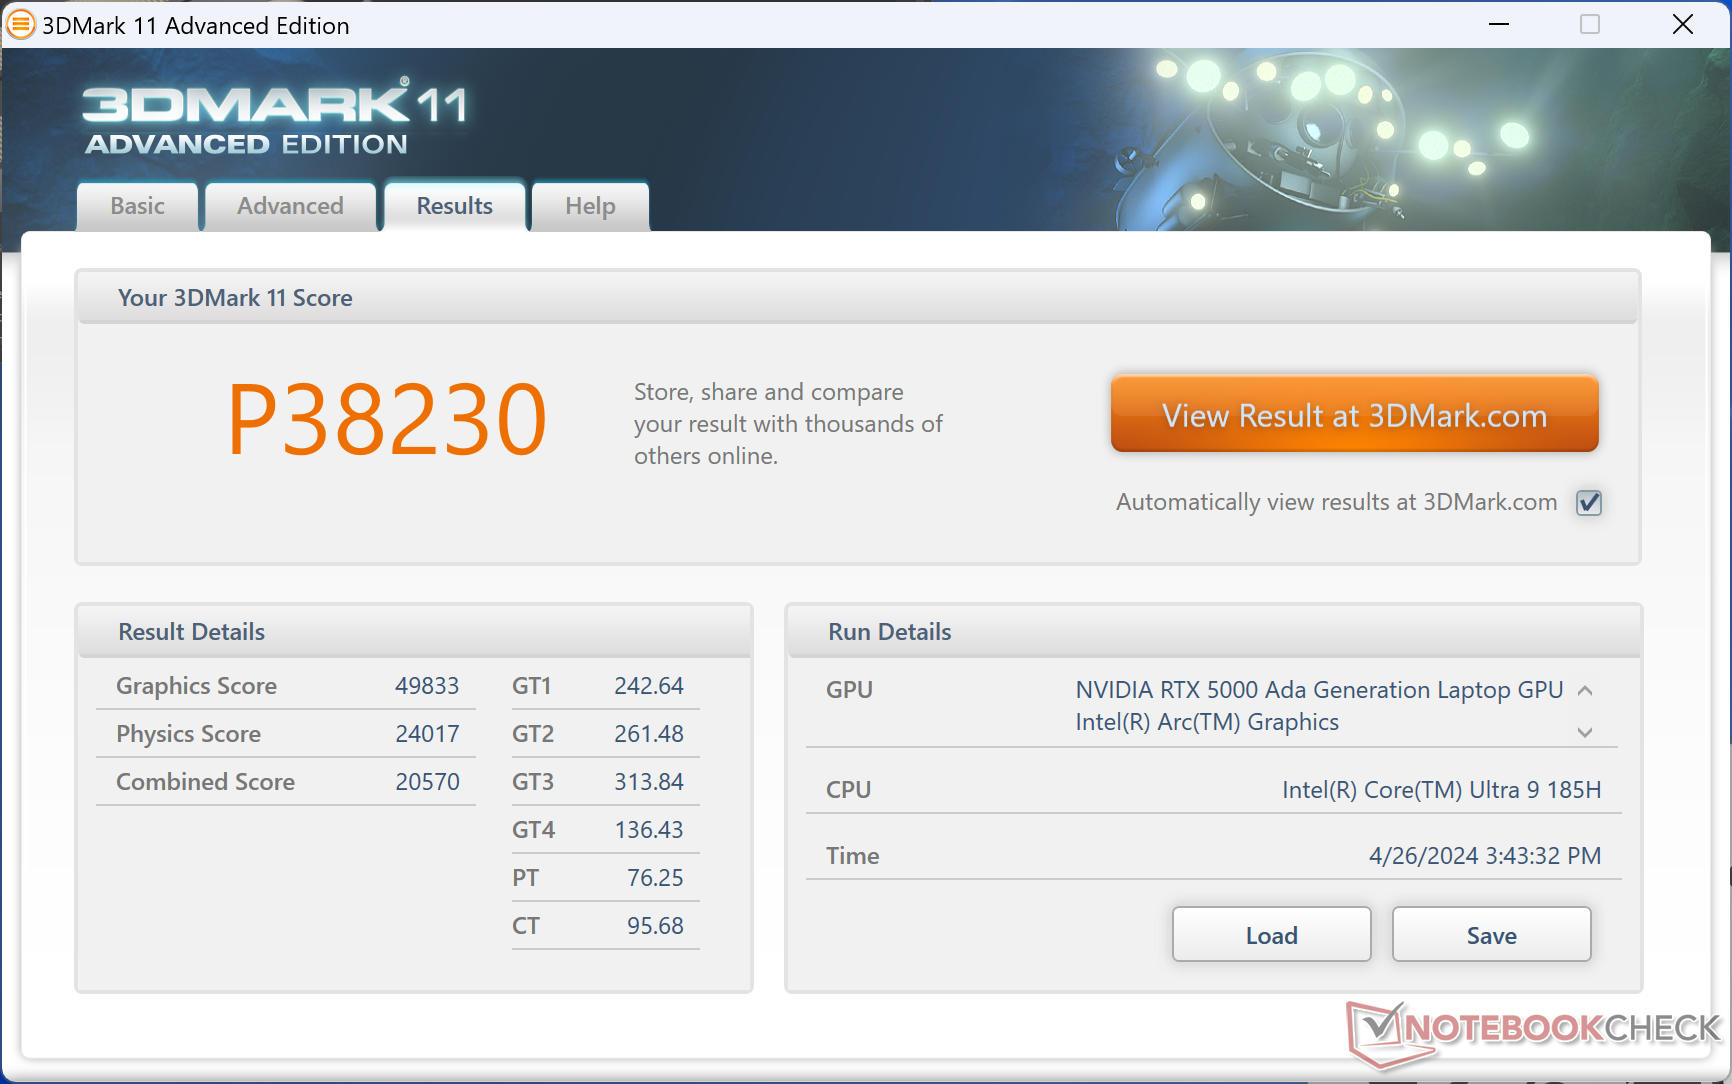
| 3DMark 11 Performance | 38230 punten | |
| 3DMark Fire Strike Score | 25968 punten | |
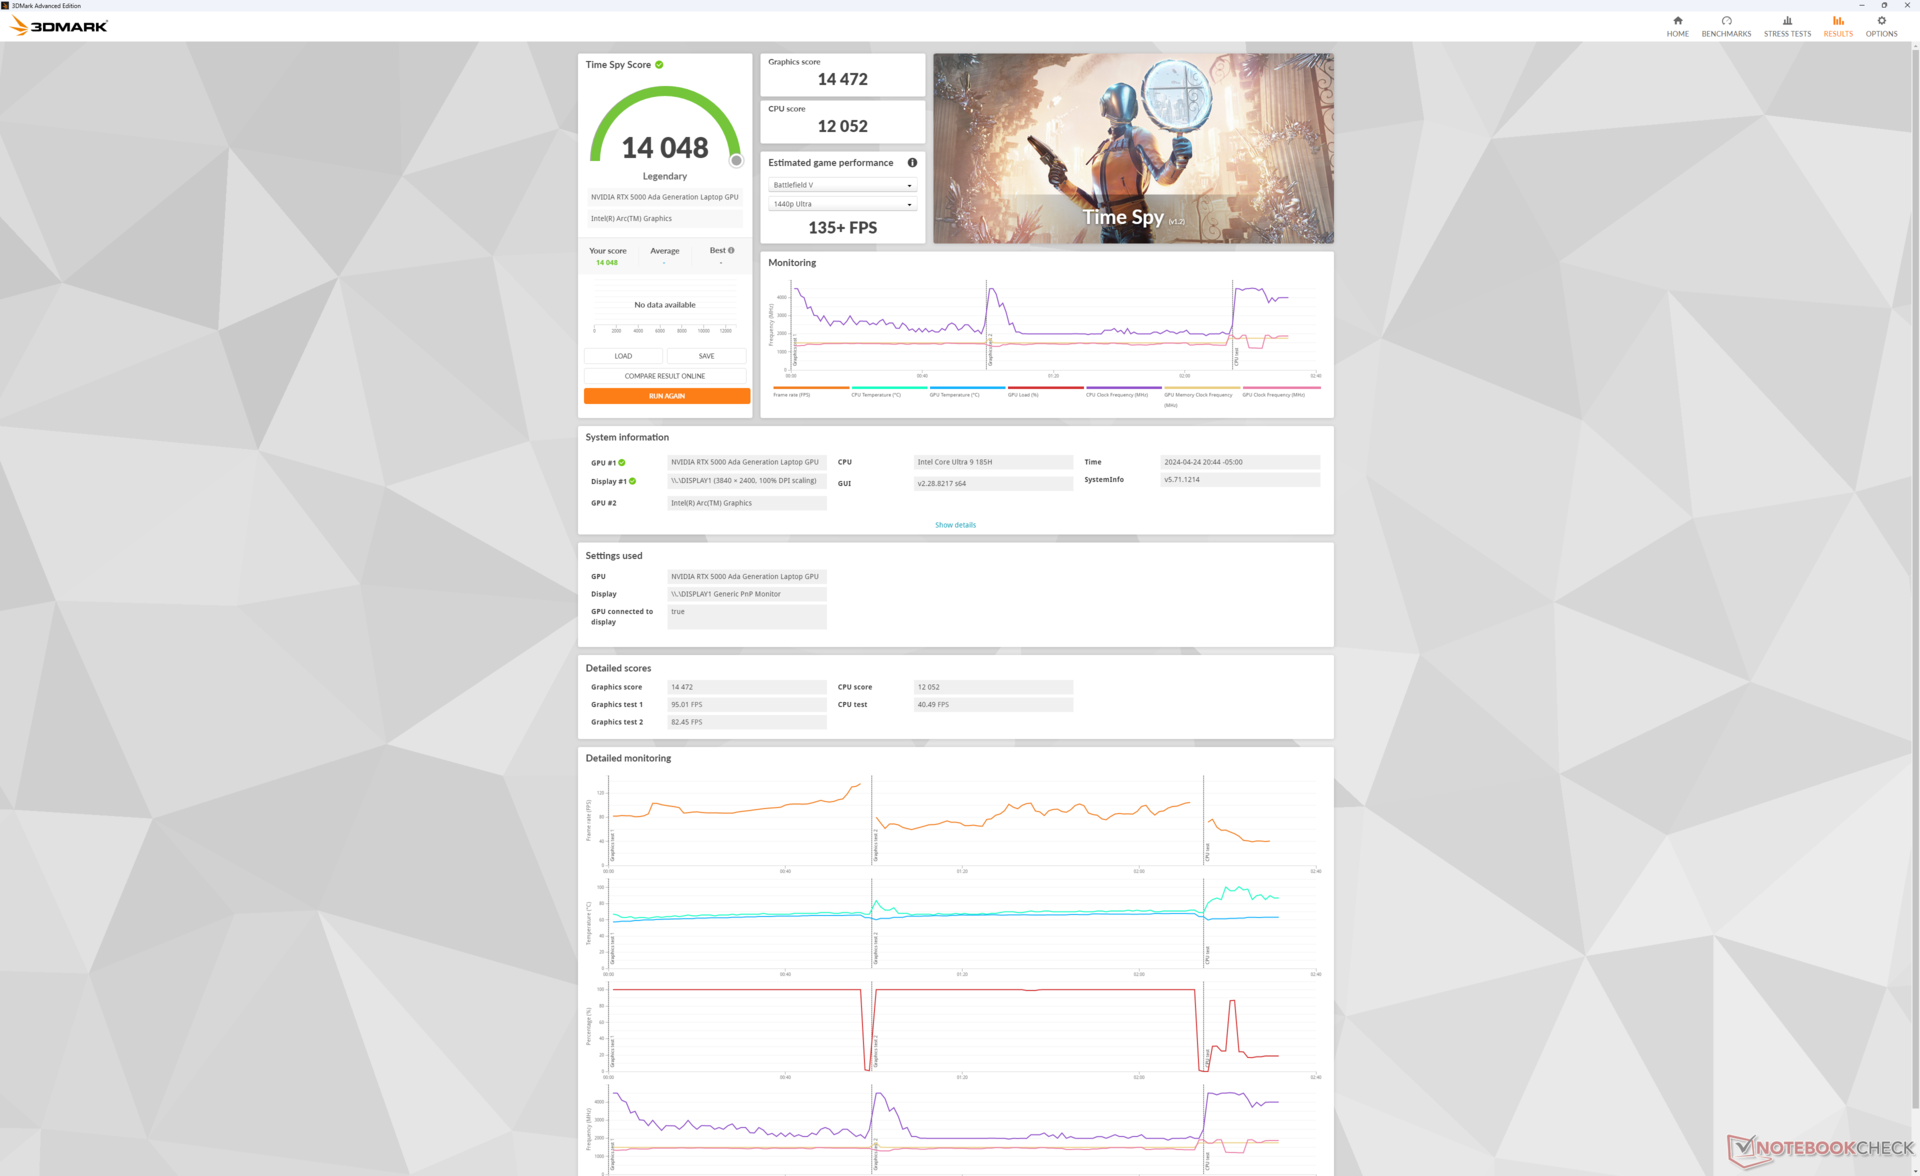
| 3DMark Time Spy Score | 14048 punten | |
Help | ||
* ... kleiner is beter
| Performance Rating - Percent | |
| HP ZBook Fury 16 G10 | |
| Dell Precision 5000 5680 -1! | |
| Dell Precision 5690 | |
| Lenovo ThinkPad P16 G2 21FA000FGE | |
| Lenovo ThinkPad P1 G6-21FV000DGE | |
| MSI CreatorPro Z16P B12UKST | |
| The Witcher 3 - 1920x1080 Ultra Graphics & Postprocessing (HBAO+) | |
| HP ZBook Fury 16 G10 | |
| Dell Precision 5690 | |
| Dell Precision 5000 5680 | |
| Lenovo ThinkPad P16 G2 21FA000FGE | |
| Lenovo ThinkPad P1 G6-21FV000DGE | |
| MSI CreatorPro Z16P B12UKST | |
| Final Fantasy XV Benchmark - 1920x1080 High Quality | |
| HP ZBook Fury 16 G10 | |
| Dell Precision 5690 | |
| Dell Precision 5000 5680 | |
| Lenovo ThinkPad P16 G2 21FA000FGE | |
| Lenovo ThinkPad P1 G6-21FV000DGE | |
| MSI CreatorPro Z16P B12UKST | |
| Strange Brigade - 1920x1080 ultra AA:ultra AF:16 | |
| HP ZBook Fury 16 G10 | |
| Dell Precision 5690 | |
| Lenovo ThinkPad P16 G2 21FA000FGE | |
| Lenovo ThinkPad P1 G6-21FV000DGE | |
| MSI CreatorPro Z16P B12UKST | |
| Dota 2 Reborn - 1920x1080 ultra (3/3) best looking | |
| HP ZBook Fury 16 G10 | |
| Lenovo ThinkPad P16 G2 21FA000FGE | |
| MSI CreatorPro Z16P B12UKST | |
| Dell Precision 5000 5680 | |
| Dell Precision 5690 | |
| Lenovo ThinkPad P1 G6-21FV000DGE | |
| X-Plane 11.11 - 1920x1080 high (fps_test=3) | |
| HP ZBook Fury 16 G10 | |
| Lenovo ThinkPad P1 G6-21FV000DGE | |
| Lenovo ThinkPad P16 G2 21FA000FGE | |
| Dell Precision 5000 5680 | |
| MSI CreatorPro Z16P B12UKST | |
| Dell Precision 5690 | |
| Baldur's Gate 3 | |
| 1920x1080 High Preset | |
| Dell Precision 5690 | |
| Gemiddeld Nvidia RTX 5000 Ada Generation Laptop GPU (n=1) | |
| Dell XPS 16 9640 | |
| 1920x1080 Ultra Preset | |
| Dell Precision 5690 | |
| Gemiddeld Nvidia RTX 5000 Ada Generation Laptop GPU (n=1) | |
| Dell XPS 16 9640 | |
| 2560x1440 Ultra Preset | |
| Dell Precision 5690 | |
| Gemiddeld Nvidia RTX 5000 Ada Generation Laptop GPU (n=1) | |
| Dell XPS 16 9640 | |
| 3840x2160 Ultra Preset | |
| Dell Precision 5690 | |
| Gemiddeld Nvidia RTX 5000 Ada Generation Laptop GPU (n=1) | |
| 3840x2160 Ultra Preset + Quality DLSS | |
| Dell Precision 5690 | |
| Gemiddeld Nvidia RTX 5000 Ada Generation Laptop GPU (n=1) | |
| Cyberpunk 2077 2.2 Phantom Liberty | |
| 1920x1080 High Preset (FSR off) | |
| Dell Precision 5690 | |
| Gemiddeld Nvidia RTX 5000 Ada Generation Laptop GPU (n=1) | |
| Dell XPS 16 9640 | |
| Lenovo ThinkPad P16v G1 AMD | |
| 1920x1080 Ultra Preset (FSR off) | |
| Dell Precision 5690 | |
| Gemiddeld Nvidia RTX 5000 Ada Generation Laptop GPU (n=1) | |
| Dell XPS 16 9640 | |
| Lenovo ThinkPad P16v G1 AMD | |
| 2560x1440 Ultra Preset (FSR off) | |
| Dell Precision 5690 | |
| Gemiddeld Nvidia RTX 5000 Ada Generation Laptop GPU (n=1) | |
| Dell XPS 16 9640 | |
| 3840x2160 Ultra Preset (FSR off) | |
| Dell Precision 5690 | |
| Gemiddeld Nvidia RTX 5000 Ada Generation Laptop GPU (n=1) | |
| 1920x1080 Ray Tracing Ultra Preset (DLSS off) | |
| Dell Precision 5690 | |
| Gemiddeld Nvidia RTX 5000 Ada Generation Laptop GPU (n=1) | |
| Tiny Tina's Wonderlands | |
| 1920x1080 High Preset (DX12) | |
| HP ZBook Fury 16 G10 | |
| Gemiddeld Nvidia RTX 5000 Ada Generation Laptop GPU (145.5 - 171.7, n=3) | |
| Dell Precision 5000 5680 | |
| Dell Precision 5690 | |
| HP ZBook Fury 16 G9 | |
| 1920x1080 Badass Preset (DX12) | |
| HP ZBook Fury 16 G10 | |
| Gemiddeld Nvidia RTX 5000 Ada Generation Laptop GPU (124 - 139.4, n=3) | |
| Dell Precision 5000 5680 | |
| Dell Precision 5690 | |
| HP ZBook Fury 16 G9 | |
| 2560x1440 Badass Preset (DX12) | |
| HP ZBook Fury 16 G10 | |
| Gemiddeld Nvidia RTX 5000 Ada Generation Laptop GPU (87.1 - 99.4, n=3) | |
| Dell Precision 5000 5680 | |
| Dell Precision 5690 | |
| HP ZBook Fury 16 G9 | |
| 3840x2160 Badass Preset (DX12) | |
| HP ZBook Fury 16 G10 | |
| Gemiddeld Nvidia RTX 5000 Ada Generation Laptop GPU (48.4 - 53.9, n=3) | |
| Dell Precision 5000 5680 | |
| Dell Precision 5690 | |
| HP ZBook Fury 16 G9 | |
Witcher 3 FPS Chart
| lage | gem. | hoge | ultra | QHD | 4K DLSS | 4K | |
|---|---|---|---|---|---|---|---|
| The Witcher 3 (2015) | 411.3 | 351.2 | 258.7 | 137.6 | 103.9 | ||
| Dota 2 Reborn (2015) | 169.4 | 149.2 | 150.1 | 139.9 | 130 | ||
| Final Fantasy XV Benchmark (2018) | 196.6 | 165.4 | 132.5 | 103.8 | 63.2 | ||
| X-Plane 11.11 (2018) | 132.8 | 113.9 | 88.7 | 74.8 | |||
| Far Cry 5 (2018) | 144 | 134 | 127 | 119 | 113 | 72 | |
| Strange Brigade (2018) | 405 | 314 | 276 | 252 | 190.6 | 105.3 | |
| Tiny Tina's Wonderlands (2022) | 196.5 | 179.4 | 145.5 | 124 | 87.1 | 48.4 | |
| F1 22 (2022) | 228 | 224 | 217 | 91.1 | 60.1 | 29.6 | |
| Baldur's Gate 3 (2023) | 172.3 | 155.2 | 139.2 | 134.6 | 100.5 | 87.8 | 53.3 |
| Cyberpunk 2077 2.2 Phantom Liberty (2023) | 125 | 116.6 | 94.6 | 108.5 | 63.7 | 28.8 |
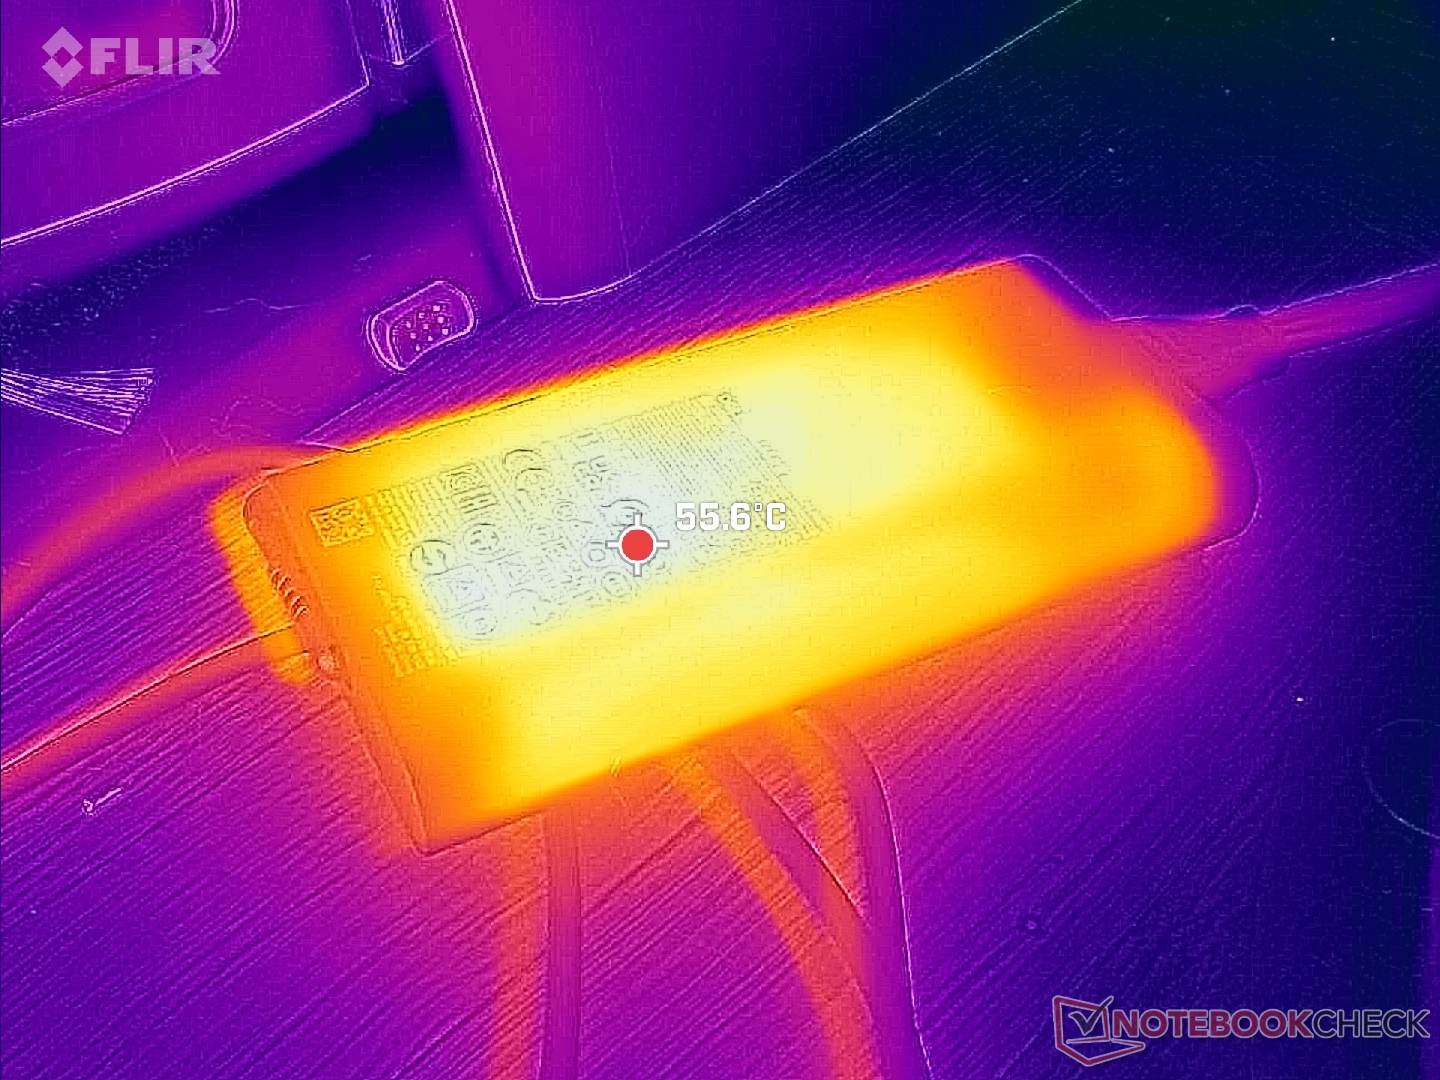
Uitstoot
Systeemgeluid - Luid en krachtig
Het geluid van de ventilator is gevoelig voor het geselecteerde vermogensprofiel. In de stille modus blijft het ventilatorgeluid bijvoorbeeld onder de 25 dB(A) tegen een stille achtergrond van 23,4 dB(A). Omgekeerd hebben de ventilatoren de neiging om sneller te pulseren tot 30 dB(A) als ze in de standen Gebalanceerd of Prestaties staan, zelfs tijdens alledaagse taken zoals surfen op het web.
Het plafond van het ventilatorgeluid is verder hetzelfde als wat we op de Precision 5680 vaststelden op 51 dB(A), wat net zo luid is als veel gaming laptops. Dit maximum kan worden bereikt wanneer GPU-intensieve belastingen langer dan enkele minuten worden uitgevoerd.
Geluidsniveau
| Onbelast |
| 23.6 / 24.9 / 30.9 dB (A) |
| Belasting |
| 40.4 / 51.9 dB (A) |
 | ||
30 dB stil 40 dB(A) hoorbaar 50 dB(A) luid |
||
min: | ||
| Dell Precision 5690 NVIDIA RTX 5000 Ada Generation Laptop GPU, Ultra 9 185H, 2x Samsung PM9A1 1TB (RAID 0) | Dell Precision 5000 5680 NVIDIA RTX 5000 Ada Generation Laptop GPU, i9-13900H, 2x SK hynix PC801 HFS512GEJ9X101N RAID 0 | Lenovo ThinkPad P16 G2 21FA000FGE NVIDIA RTX 2000 Ada Generation Laptop GPU, i7-13700HX, SK hynix PC801 HFS001TEJ9X162N | Lenovo ThinkPad P1 G6-21FV000DGE NVIDIA RTX 2000 Ada Generation Laptop GPU, i9-13900H, SK Hynix PC711 1TB HFS001TDE9X084N | HP ZBook Fury 16 G10 NVIDIA RTX 5000 Ada Generation Laptop GPU, i9-13950HX, SK hynix PC801 HFS001TEJ9X101N | MSI CreatorPro Z16P B12UKST RTX A3000 Laptop GPU, i7-12700H, Samsung PM9A1 MZVL21T0HCLR | |
|---|---|---|---|---|---|---|
| Noise | 6% | -1% | 3% | 6% | -0% | |
| uit / omgeving * | 23.4 | 22.8 3% | 23.5 -0% | 24.5 -5% | 22.9 2% | 24.1 -3% |
| Idle Minimum * | 23.6 | 23 3% | 23.5 -0% | 24.5 -4% | 22.9 3% | 27.1 -15% |
| Idle Average * | 24.9 | 23 8% | 29.2 -17% | 24.5 2% | 22.9 8% | 27.1 -9% |
| Idle Maximum * | 30.9 | 23 26% | 29.5 5% | 24.5 21% | 28.5 8% | 27.1 12% |
| Load Average * | 40.4 | 37.2 8% | 32.7 19% | 48 -19% | 40.6 -0% | 42.9 -6% |
| Witcher 3 ultra * | 48.3 | 51 -6% | 50.6 -5% | 40.7 16% | 44.1 9% | 44 9% |
| Load Maximum * | 51.9 | 51 2% | 56.6 -9% | 48 8% | 45.8 12% | 47 9% |
* ... kleiner is beter
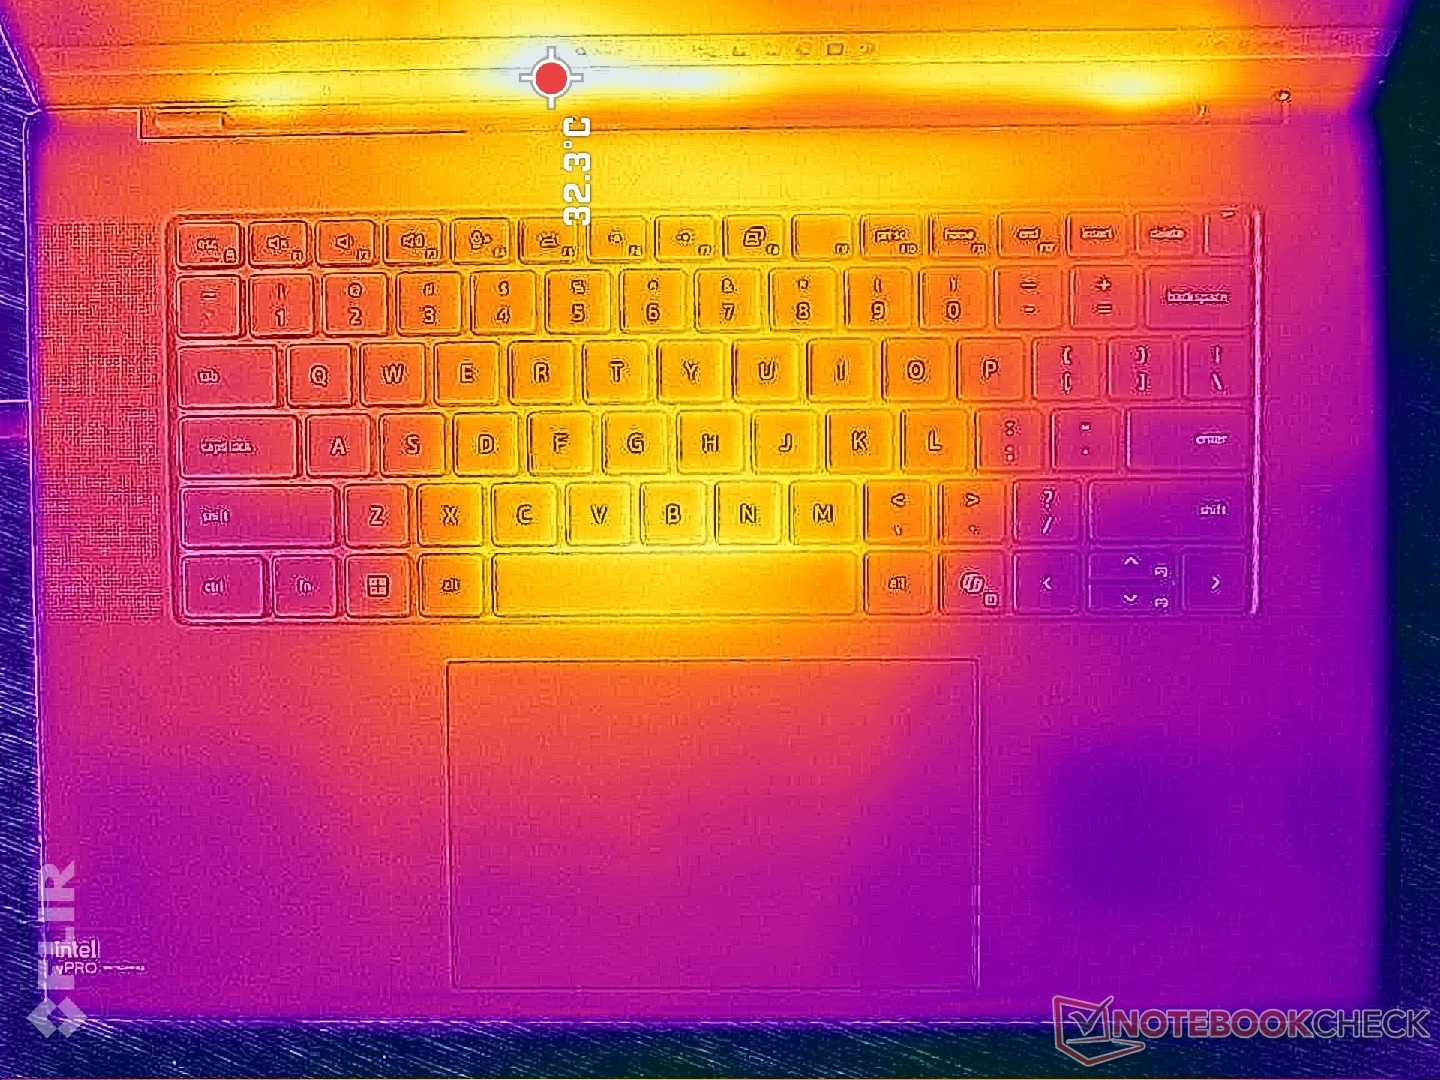
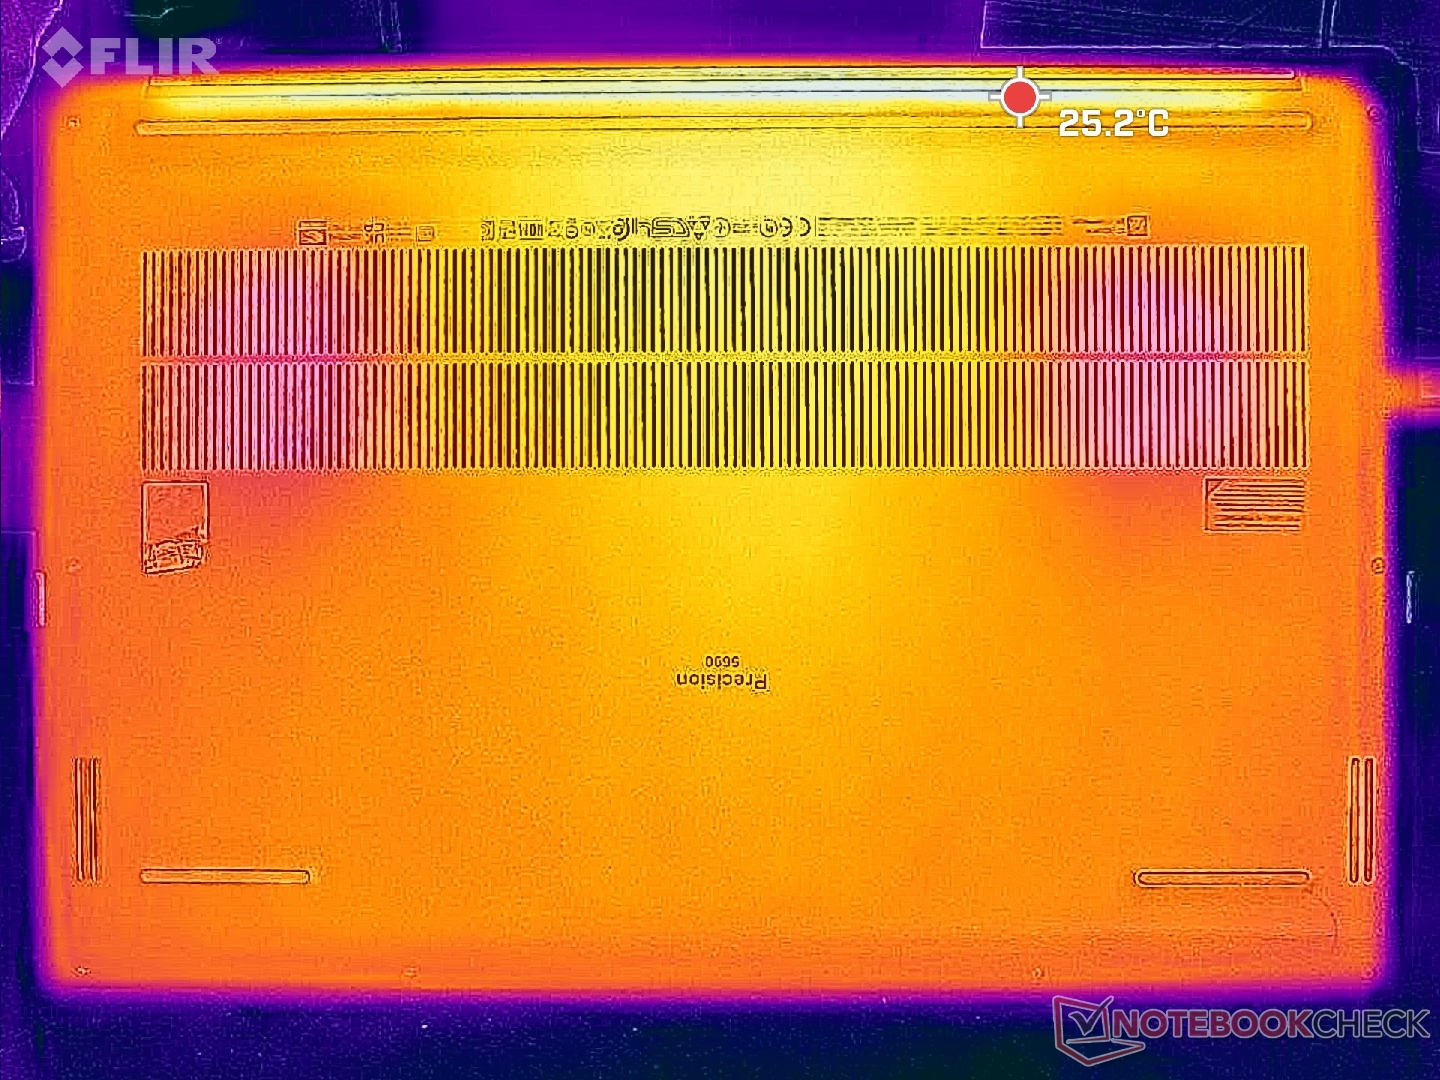
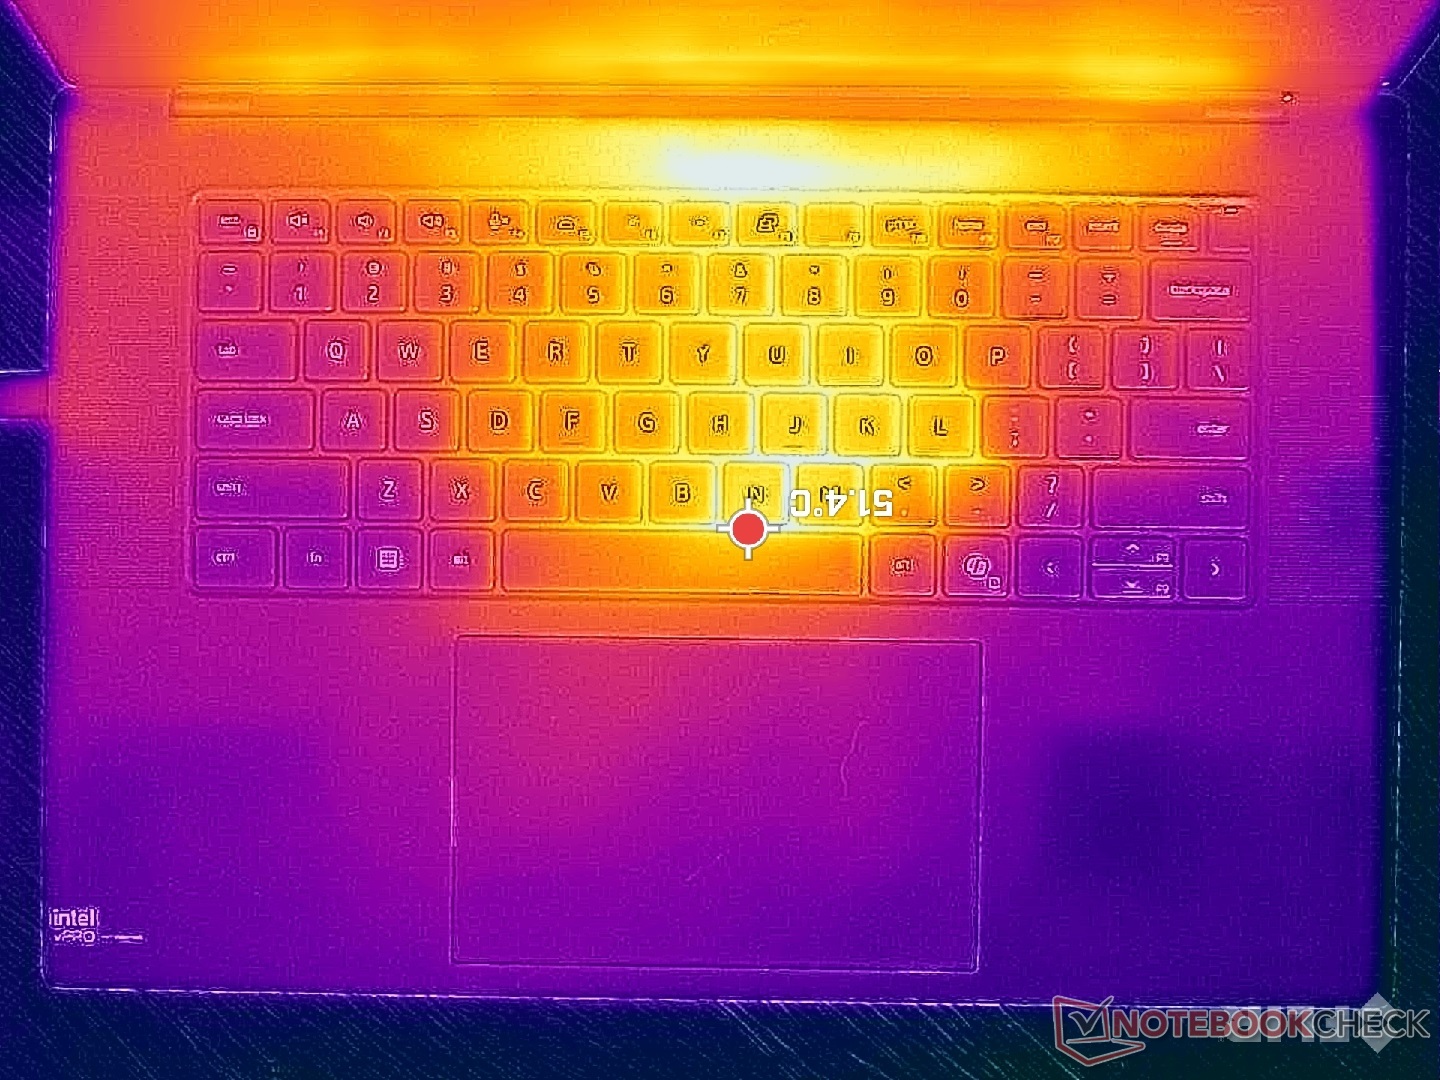
Temperatuur
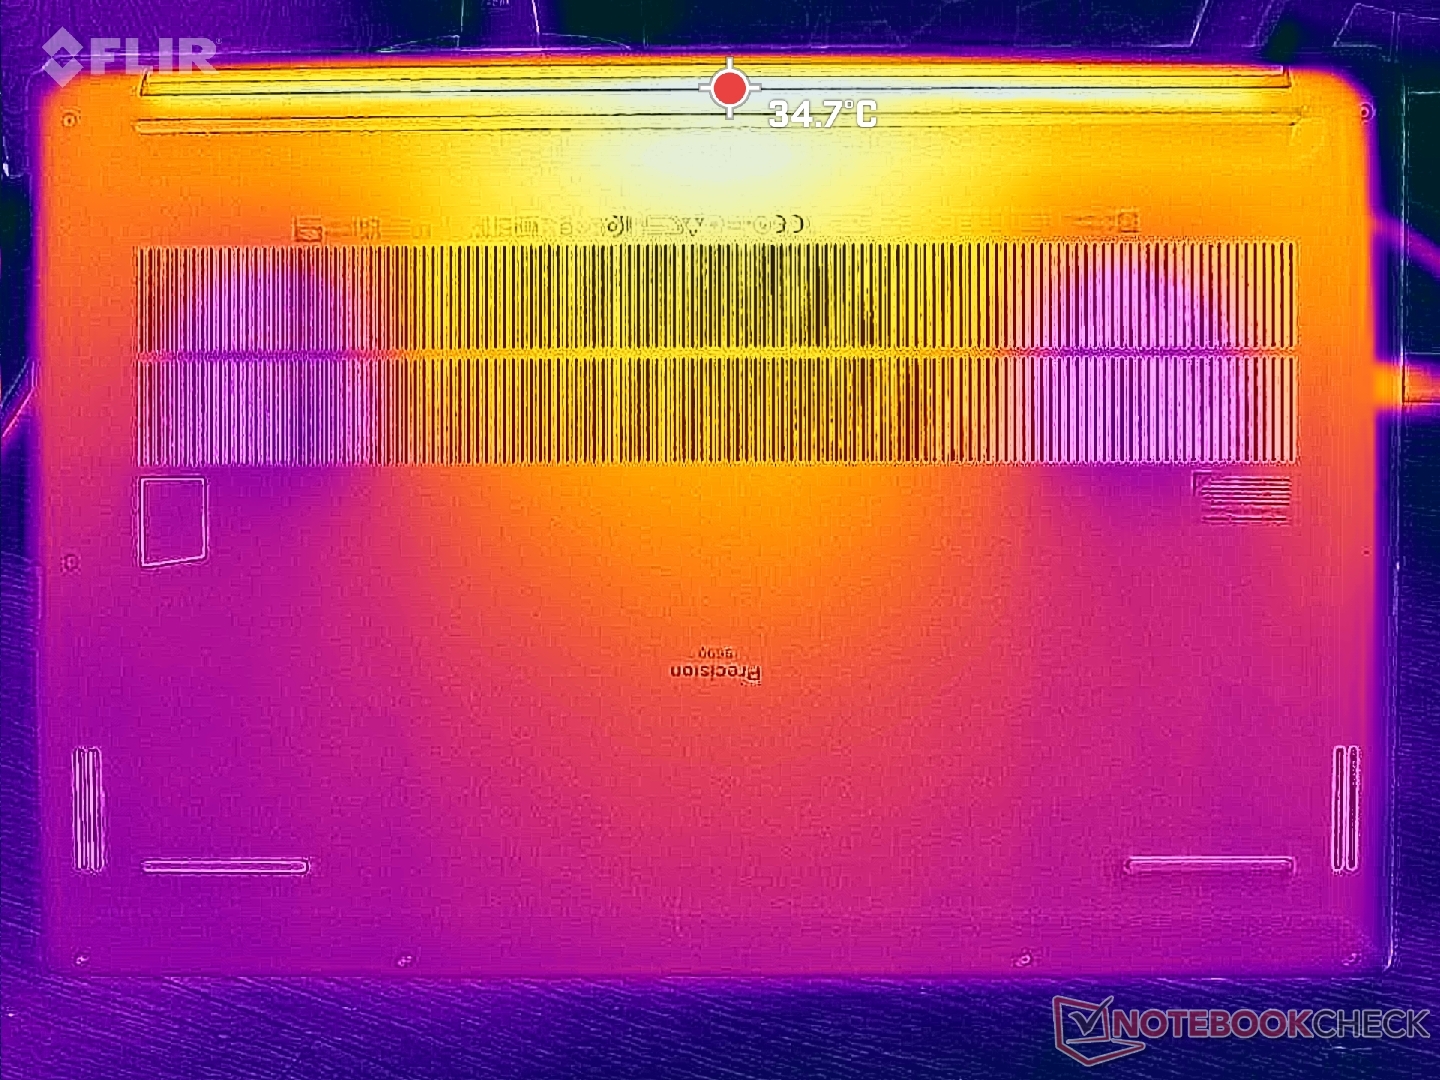
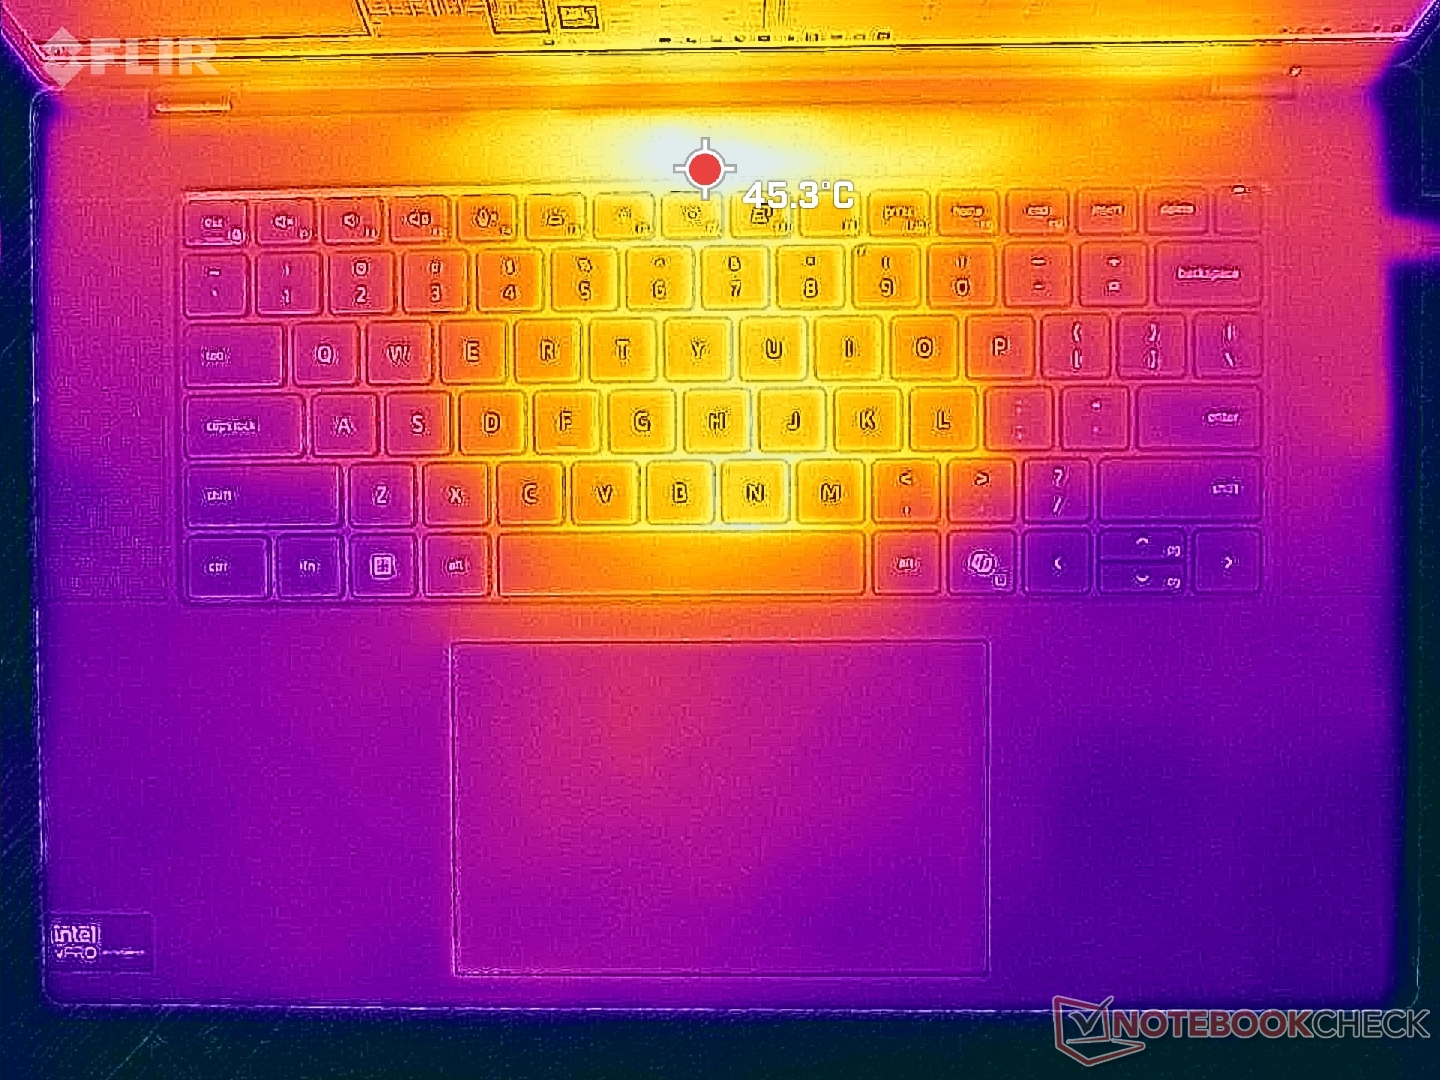
De ontwikkeling van de oppervlaktetemperatuur is symmetrisch met warme plekken van 43 C tot 47 C in de buurt van het midden van het toetsenbord. De onderkant van de behuizing blijft merkbaar koeler dan het toetsenbord, zelfs bij zware belastingen.
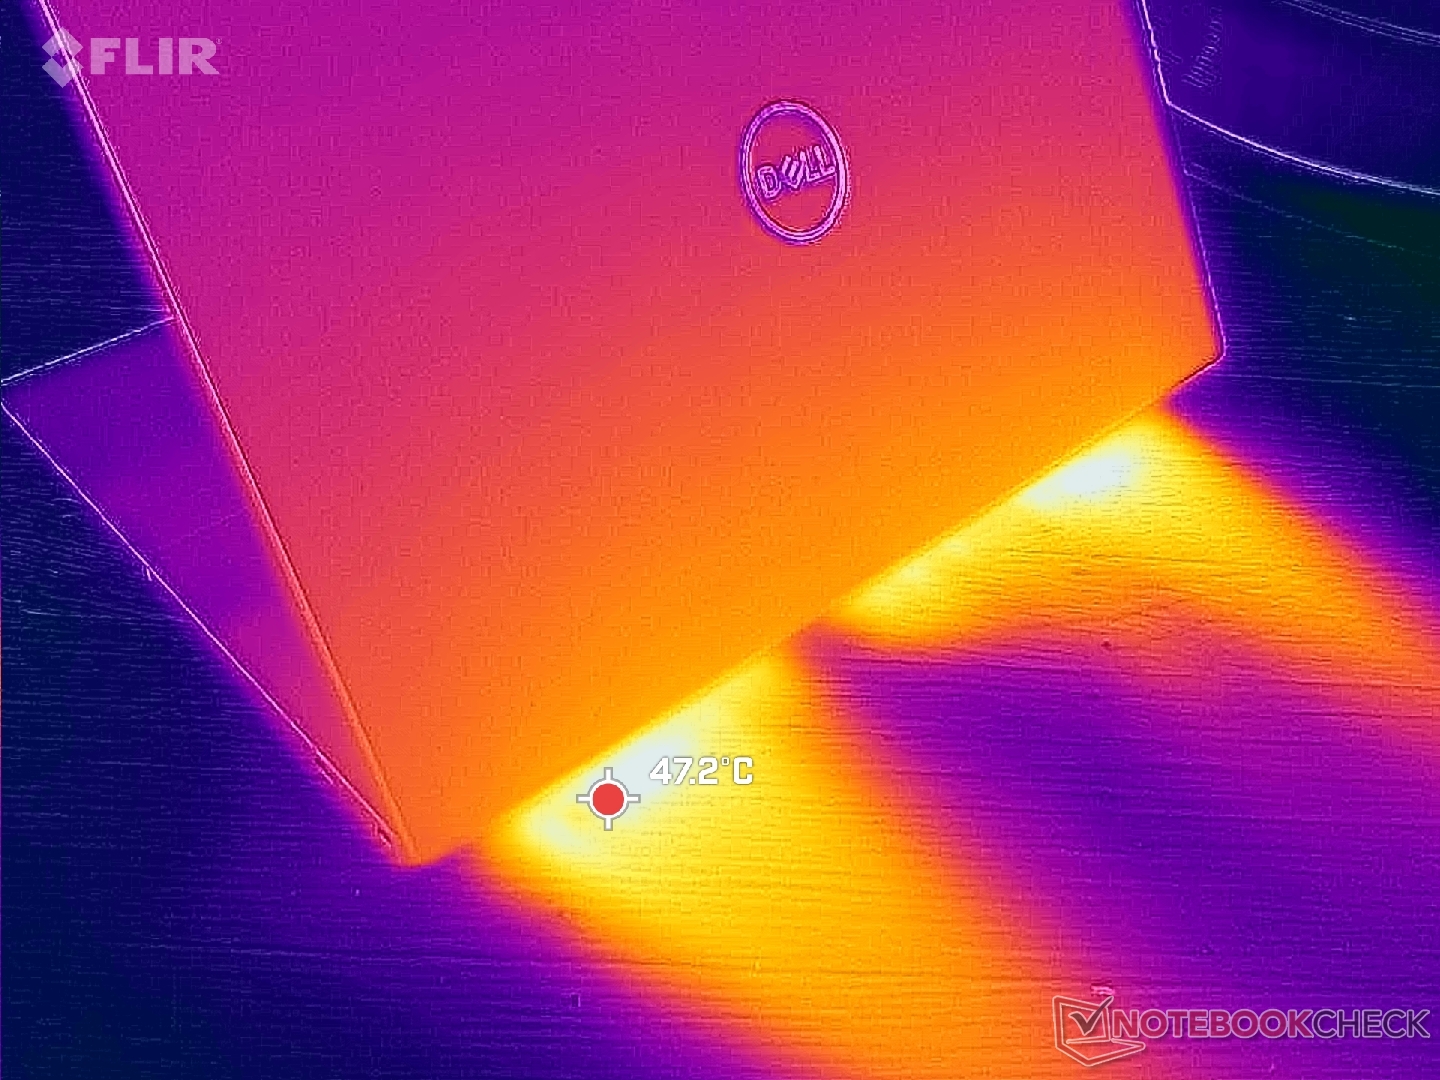
(-) De maximumtemperatuur aan de bovenzijde bedraagt 46.6 °C / 116 F, vergeleken met het gemiddelde van 38.2 °C / 101 F, variërend van 22.2 tot 69.8 °C voor de klasse Workstation.
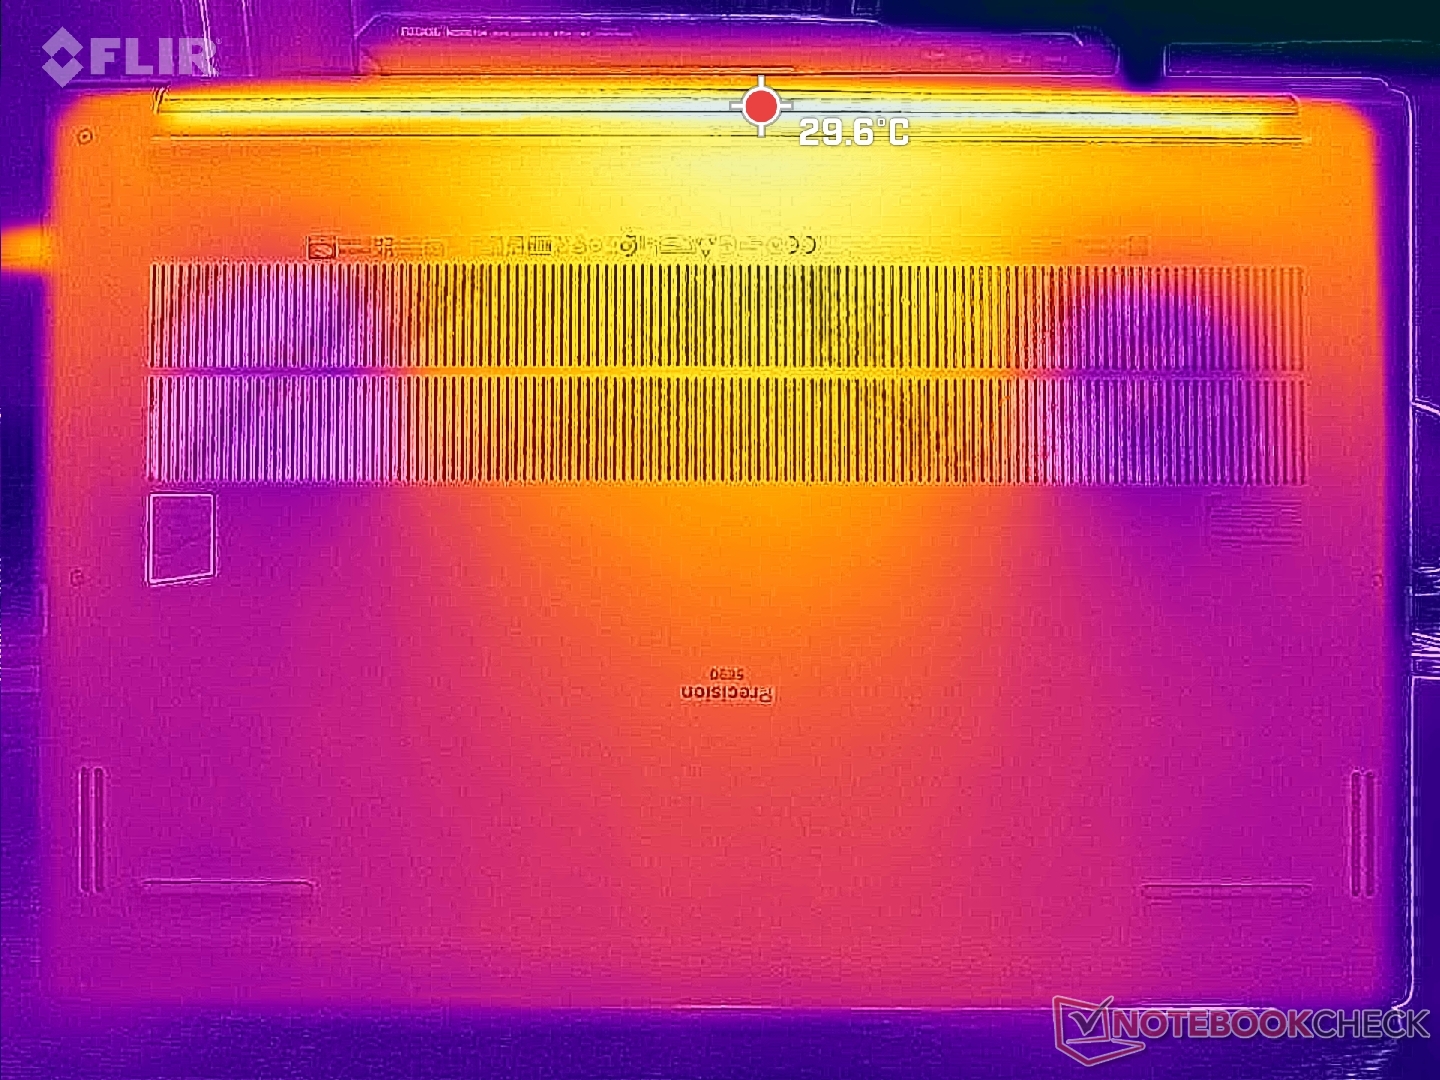
(+) De bodem warmt op tot een maximum van 33 °C / 91 F, vergeleken met een gemiddelde van 41.2 °C / 106 F
(+) Bij onbelast gebruik bedraagt de gemiddelde temperatuur voor de bovenzijde 29.2 °C / 85 F, vergeleken met het apparaatgemiddelde van 32 °C / 90 F.
(±) Bij het spelen van The Witcher 3 is de gemiddelde temperatuur voor de bovenzijde 34 °C / 93 F, vergeleken met het apparaatgemiddelde van 32 °C / 90 F.
(+) De palmsteunen en het touchpad zijn met een maximum van ###max## °C / 81.7 F koeler dan de huidtemperatuur en voelen daarom koel aan.
(±) De gemiddelde temperatuur van de handpalmsteun van soortgelijke toestellen bedroeg 27.8 °C / 82 F (+0.2 °C / 0.3 F).
| Dell Precision 5690 Intel Core Ultra 9 185H, Nvidia RTX 5000 Ada Generation Laptop GPU | Dell Precision 5000 5680 Intel Core i9-13900H, Nvidia RTX 5000 Ada Generation Laptop GPU | Lenovo ThinkPad P16 G2 21FA000FGE Intel Core i7-13700HX, NVIDIA RTX 2000 Ada Generation Laptop GPU | Lenovo ThinkPad P1 G6-21FV000DGE Intel Core i9-13900H, NVIDIA RTX 2000 Ada Generation Laptop GPU | HP ZBook Fury 16 G10 Intel Core i9-13950HX, Nvidia RTX 5000 Ada Generation Laptop GPU | MSI CreatorPro Z16P B12UKST Intel Core i7-12700H, NVIDIA RTX A3000 Laptop GPU | |
|---|---|---|---|---|---|---|
| Heat | -7% | 2% | -13% | -16% | -24% | |
| Maximum Upper Side * | 46.6 | 50.2 -8% | 47.2 -1% | 47.1 -1% | 44.8 4% | 56.3 -21% |
| Maximum Bottom * | 33 | 32 3% | 39.5 -20% | 56.5 -71% | 50 -52% | 68.3 -107% |
| Idle Upper Side * | 32.4 | 37.4 -15% | 28.1 13% | 28.1 13% | 34.4 -6% | 25.2 22% |
| Idle Bottom * | 29.4 | 31.2 -6% | 25.3 14% | 27.6 6% | 31.8 -8% | 25.9 12% |
* ... kleiner is beter
Luidsprekers
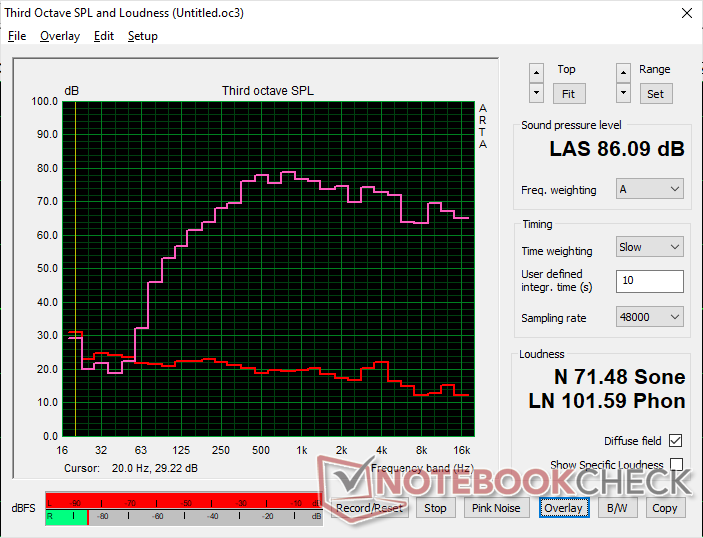
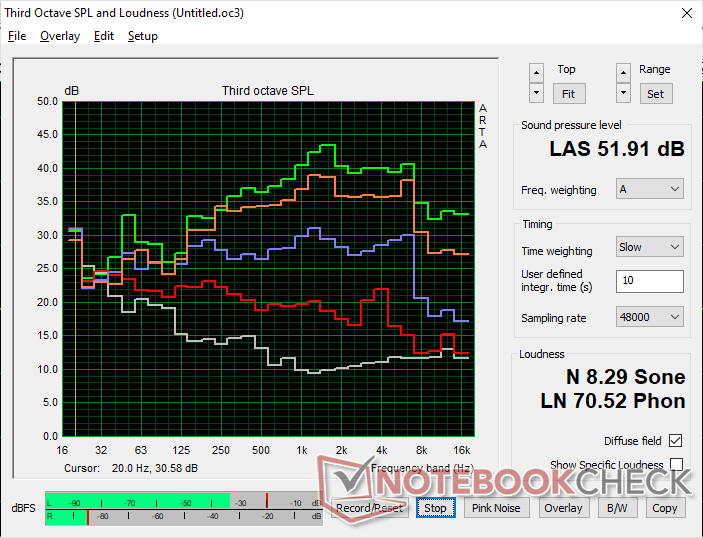
Dell Precision 5690 audioanalyse
(+) | luidsprekers kunnen relatief luid spelen (86.1 dB)
Bas 100 - 315 Hz
(±) | verminderde zeebaars - gemiddeld 9.4% lager dan de mediaan
(±) | lineariteit van de lage tonen is gemiddeld (7.6% delta ten opzichte van de vorige frequentie)
Midden 400 - 2000 Hz
(+) | evenwichtige middens - slechts 4.7% verwijderd van de mediaan
(+) | de middentonen zijn lineair (4.8% delta ten opzichte van de vorige frequentie)
Hoog 2 - 16 kHz
(+) | evenwichtige hoogtepunten - slechts 3.4% verwijderd van de mediaan
(±) | lineariteit van de hoogtepunten is gemiddeld (7.3% delta ten opzichte van de vorige frequentie)
Algemeen 100 - 16.000 Hz
(+) | het totale geluid is lineair (11.1% verschil met de mediaan)
Vergeleken met dezelfde klasse
» 10% van alle geteste apparaten in deze klasse waren beter, 3% vergelijkbaar, 87% slechter
» De beste had een delta van 7%, het gemiddelde was 18%, de slechtste was 35%
Vergeleken met alle geteste toestellen
» 6% van alle geteste apparaten waren beter, 2% gelijk, 93% slechter
» De beste had een delta van 4%, het gemiddelde was 24%, de slechtste was 134%
Apple MacBook Pro 16 2021 M1 Pro audioanalyse
(+) | luidsprekers kunnen relatief luid spelen (84.7 dB)
Bas 100 - 315 Hz
(+) | goede baars - slechts 3.8% verwijderd van de mediaan
(+) | de lage tonen zijn lineair (5.2% delta naar de vorige frequentie)
Midden 400 - 2000 Hz
(+) | evenwichtige middens - slechts 1.3% verwijderd van de mediaan
(+) | de middentonen zijn lineair (2.1% delta ten opzichte van de vorige frequentie)
Hoog 2 - 16 kHz
(+) | evenwichtige hoogtepunten - slechts 1.9% verwijderd van de mediaan
(+) | de hoge tonen zijn lineair (2.7% delta naar de vorige frequentie)
Algemeen 100 - 16.000 Hz
(+) | het totale geluid is lineair (4.6% verschil met de mediaan)
Vergeleken met dezelfde klasse
» 0% van alle geteste apparaten in deze klasse waren beter, 0% vergelijkbaar, 100% slechter
» De beste had een delta van 5%, het gemiddelde was 18%, de slechtste was 45%
Vergeleken met alle geteste toestellen
» 0% van alle geteste apparaten waren beter, 0% gelijk, 100% slechter
» De beste had een delta van 4%, het gemiddelde was 24%, de slechtste was 134%
Energiebeheer
Stroomverbruik
Inactiviteit op de desktop kan zo laag zijn als 8 W bij de instelling voor minimale helderheid tot 29 W bij de instelling voor maximale helderheid met een volledig witte achtergrond. Dit bereik is groter dan bij de meeste IPS-laptops door de manier waarop OLED werkt. Taken zoals surfen op het web, tekstverwerken of het invoeren van spreadsheets kunnen de batterij sneller leegmaken dan men zou verwachten, omdat deze vensters meestal wit van kleur zijn. Door de helderheid te verlagen of donkerdere kleuren te kiezen, kan de batterij langer meegaan dan bij een IPS-alternatief.
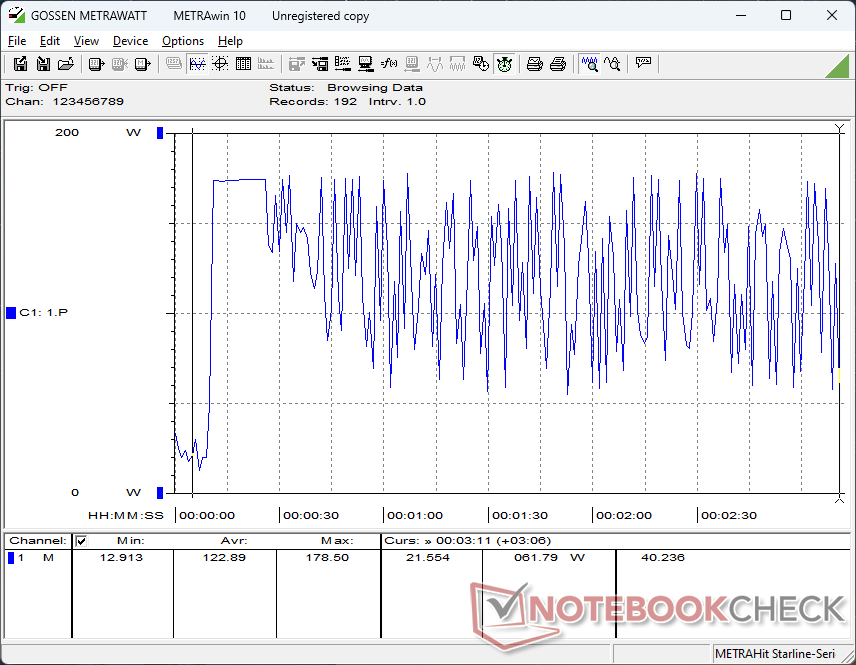
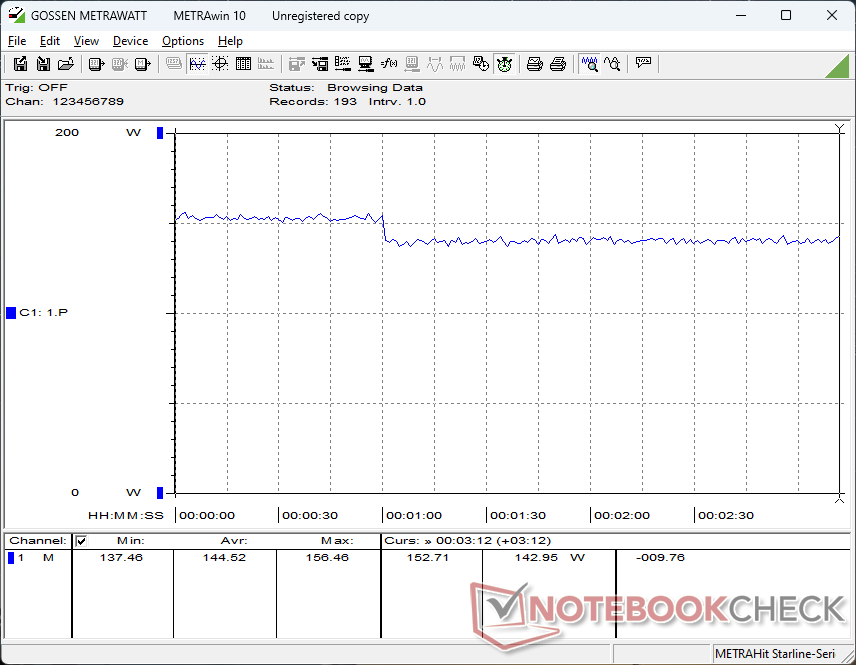
Het stroomverbruik bij hogere belastingen zoals Witcher 3 zou bijna hetzelfde zijn als wat we op de oudere Precision 5680 vaststelden. Dit bevestigt onze bovenstaande benchmarkgegevens die ook slechts marginale prestatieverschillen laten zien tussen de twee modellen.
Vreemd genoeg schommelde het verbruik wild tijdens het uitvoeren van Prime95 stress, zelfs na meerdere hertests. De prestaties lijken anders constant te zijn.
| Uit / Standby | |
| Inactief | |
| Belasting |
|
Key:
min: | |
| Dell Precision 5690 Ultra 9 185H, NVIDIA RTX 5000 Ada Generation Laptop GPU, 2x Samsung PM9A1 1TB (RAID 0), OLED, 3840x2400, 16" | Dell Precision 5000 5680 i9-13900H, NVIDIA RTX 5000 Ada Generation Laptop GPU, 2x SK hynix PC801 HFS512GEJ9X101N RAID 0, OLED, 3840x2400, 16" | Lenovo ThinkPad P16 G2 21FA000FGE i7-13700HX, NVIDIA RTX 2000 Ada Generation Laptop GPU, SK hynix PC801 HFS001TEJ9X162N, IPS LED, 2560x1600, 16" | Lenovo ThinkPad P1 G6-21FV000DGE i9-13900H, NVIDIA RTX 2000 Ada Generation Laptop GPU, SK Hynix PC711 1TB HFS001TDE9X084N, IPS, 2560x1600, 16" | HP ZBook Fury 16 G10 i9-13950HX, NVIDIA RTX 5000 Ada Generation Laptop GPU, SK hynix PC801 HFS001TEJ9X101N, IPS, 3840x2400, 16" | MSI CreatorPro Z16P B12UKST i7-12700H, RTX A3000 Laptop GPU, Samsung PM9A1 MZVL21T0HCLR, IPS, 2560x1600, 16" | |
|---|---|---|---|---|---|---|
| Power Consumption | 6% | -5% | 10% | -39% | -9% | |
| Idle Minimum * | 7.9 | 8 -1% | 9.3 -18% | 8.3 -5% | 15.3 -94% | 10.8 -37% |
| Idle Average * | 12 | 10.4 13% | 14.1 -18% | 14.5 -21% | 18.2 -52% | 16.3 -36% |
| Idle Maximum * | 28.6 | 30.5 -7% | 15.5 46% | 15.3 47% | 28 2% | 16.9 41% |
| Load Average * | 98.8 | 75.4 24% | 133.6 -35% | 91.8 7% | 137.9 -40% | 111.7 -13% |
| Witcher 3 ultra * | 144.5 | 134 7% | 144.9 -0% | 104.7 28% | 189.4 -31% | 152.1 -5% |
| Load Maximum * | 174.8 | 175 -0% | 179.6 -3% | 164.5 6% | 202 -16% | 177.4 -1% |
* ... kleiner is beter
Power Consumption Witcher 3 / Stresstest
Power Consumption external Monitor
Levensduur batterij
De gebruikstijden zijn ongeveer hetzelfde als voorheen, zo niet iets korter. Onze WLAN-test zou iets meer dan 9 uur duren, terwijl de Precision 5680 dichter bij de 10 uur zou zitten onder vergelijkbare omstandigheden.
| Dell Precision 5690 Ultra 9 185H, NVIDIA RTX 5000 Ada Generation Laptop GPU, 98 Wh | Dell Precision 5000 5680 i9-13900H, NVIDIA RTX 5000 Ada Generation Laptop GPU, 98 Wh | Lenovo ThinkPad P16 G2 21FA000FGE i7-13700HX, NVIDIA RTX 2000 Ada Generation Laptop GPU, 94 Wh | Lenovo ThinkPad P1 G6-21FV000DGE i9-13900H, NVIDIA RTX 2000 Ada Generation Laptop GPU, 90 Wh | HP ZBook Fury 16 G10 i9-13950HX, NVIDIA RTX 5000 Ada Generation Laptop GPU, 95 Wh | MSI CreatorPro Z16P B12UKST i7-12700H, RTX A3000 Laptop GPU, 90 Wh | |
|---|---|---|---|---|---|---|
| Batterijduur | 8% | -6% | 3% | -21% | -37% | |
| WiFi v1.3 | 549 | 592 8% | 515 -6% | 567 3% | 435 -21% | 348 -37% |
| Reader / Idle | 1072 | |||||
| Load | 101 | 67 | ||||
| H.264 | 674 |
Pro
Contra
Verdict - Klaar voor de AI-revolutie
De Precision 5680 kwam uit met een slank nieuw ontwerp dat is afgeleid van de XPS 16 compleet met vPro CPU's en high-end Nvidia RTX Ada grafische kaarten. Het zou vervolgens een van de snelste 16-inch werkstations worden die beschikbaar zijn in verhouding tot zijn formaat en gewicht. Het probleem hier is dat de Precision 5680 nauwelijks een half jaar oud is en nog steeds vrij vers. De nieuwere Precision 5690 biedt hetzelfde chassis, GPU, beeldscherm, energieverbruik, batterijduur en processorprestaties als de Precision 5680. Als u een beetje geld wilt besparen, dan kan de Precision 5680 van vorig jaar in wezen dezelfde gebruikerservaring en prestaties bieden voor minder.
)(()()
De belangrijkste onderscheidende factor tussen de 2024 Precision 5690 en de 2023 Precision 5680 is de geïntegreerde NPU op de CPU's uit de Meteor Lake-H serie. Het nieuwere Dell model is daarom "AI ready" als Windows geoptimaliseerd wordt voor lokale AI-taken. Als u bijvoorbeeld Co-Pilot al gebruikt of verwacht in de nabije toekomst meer AI-verbeterde toepassingen te gaan draaien, dan zou de Precision 5690 een duidelijke voorsprong moeten hebben dankzij de NPU-versnelling. Anders zullen de meeste "traditionele" taken niet merkbaar sneller worden uitgevoerd op het nieuwste model.
Prijs en beschikbaarheid
Dell levert de Precision 5690 nu vanaf $2290 voor de Core Ultra 5 135H CPU, alleen geïntegreerde graphics en een 1200p IPS-scherm tot ruim boven de $5000 als hij is geconfigureerd met de Core Ultra 9 185H, RTX 5000 Ada en een 2400p OLED-touchscreen.
Dell Precision 5690
- 08-05-2024 v7 (old)
Allen Ngo
Transparantie
De selectie van te beoordelen apparaten wordt gemaakt door onze redactie. Het testexemplaar werd ten behoeve van deze beoordeling door de fabrikant of detailhandelaar in bruikleen aan de auteur verstrekt. De kredietverstrekker had geen invloed op deze recensie, noch ontving de fabrikant vóór publicatie een exemplaar van deze recensie. Er bestond geen verplichting om deze recensie te publiceren. Wij accepteren nooit een compensatie of betaling in ruil voor onze beoordelingen. Als onafhankelijk mediabedrijf is Notebookcheck niet onderworpen aan het gezag van fabrikanten, detailhandelaren of uitgevers.
[transparency_disclaimer]Dit is hoe Notebookcheck test
Elk jaar beoordeelt Notebookcheck onafhankelijk honderden laptops en smartphones met behulp van gestandaardiseerde procedures om ervoor te zorgen dat alle resultaten vergelijkbaar zijn. We hebben onze testmethoden al zo'n 20 jaar voortdurend ontwikkeld en daarbij de industriestandaard bepaald. In onze testlaboratoria wordt gebruik gemaakt van hoogwaardige meetapparatuur door ervaren technici en redacteuren. Deze tests omvatten een validatieproces in meerdere fasen. Ons complexe beoordelingssysteem is gebaseerd op honderden goed onderbouwde metingen en benchmarks, waardoor de objectiviteit behouden blijft. Meer informatie over onze testmethoden kunt u hier vinden.
Price comparison

