Dell XPS 13 9345 Snapdragon X Elite test: De Intel Core Ultra 7 ondermijnen

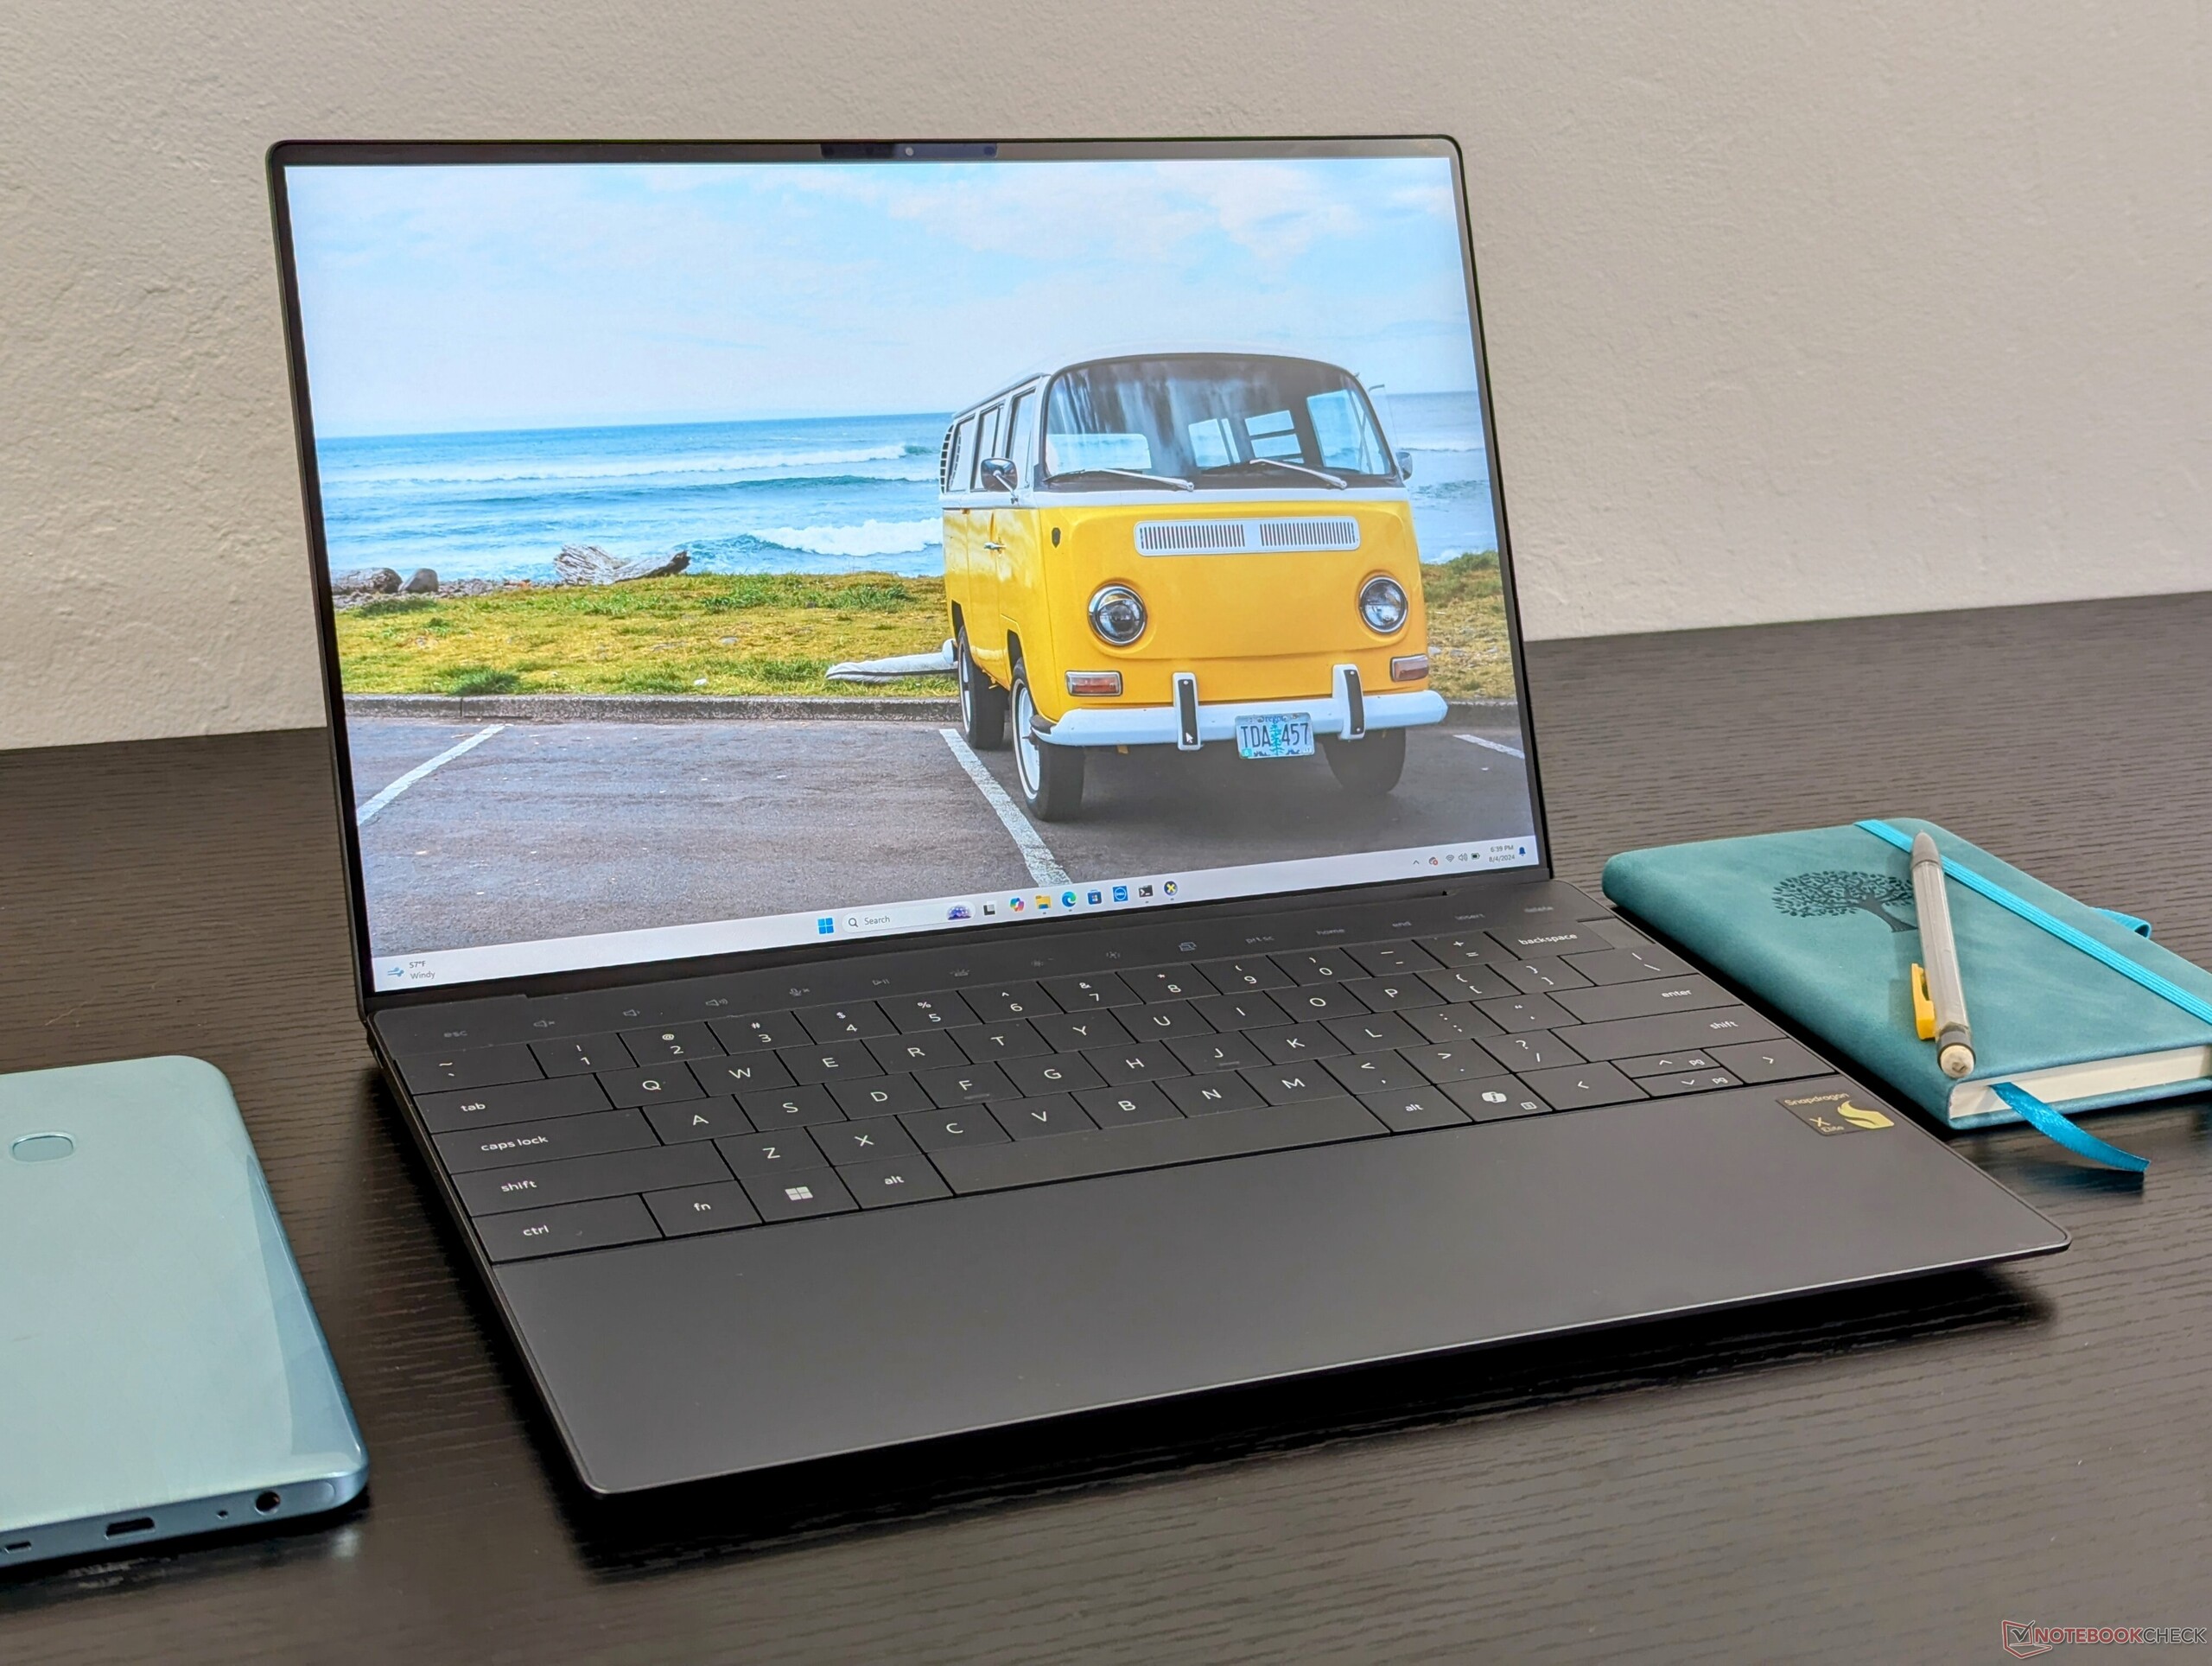
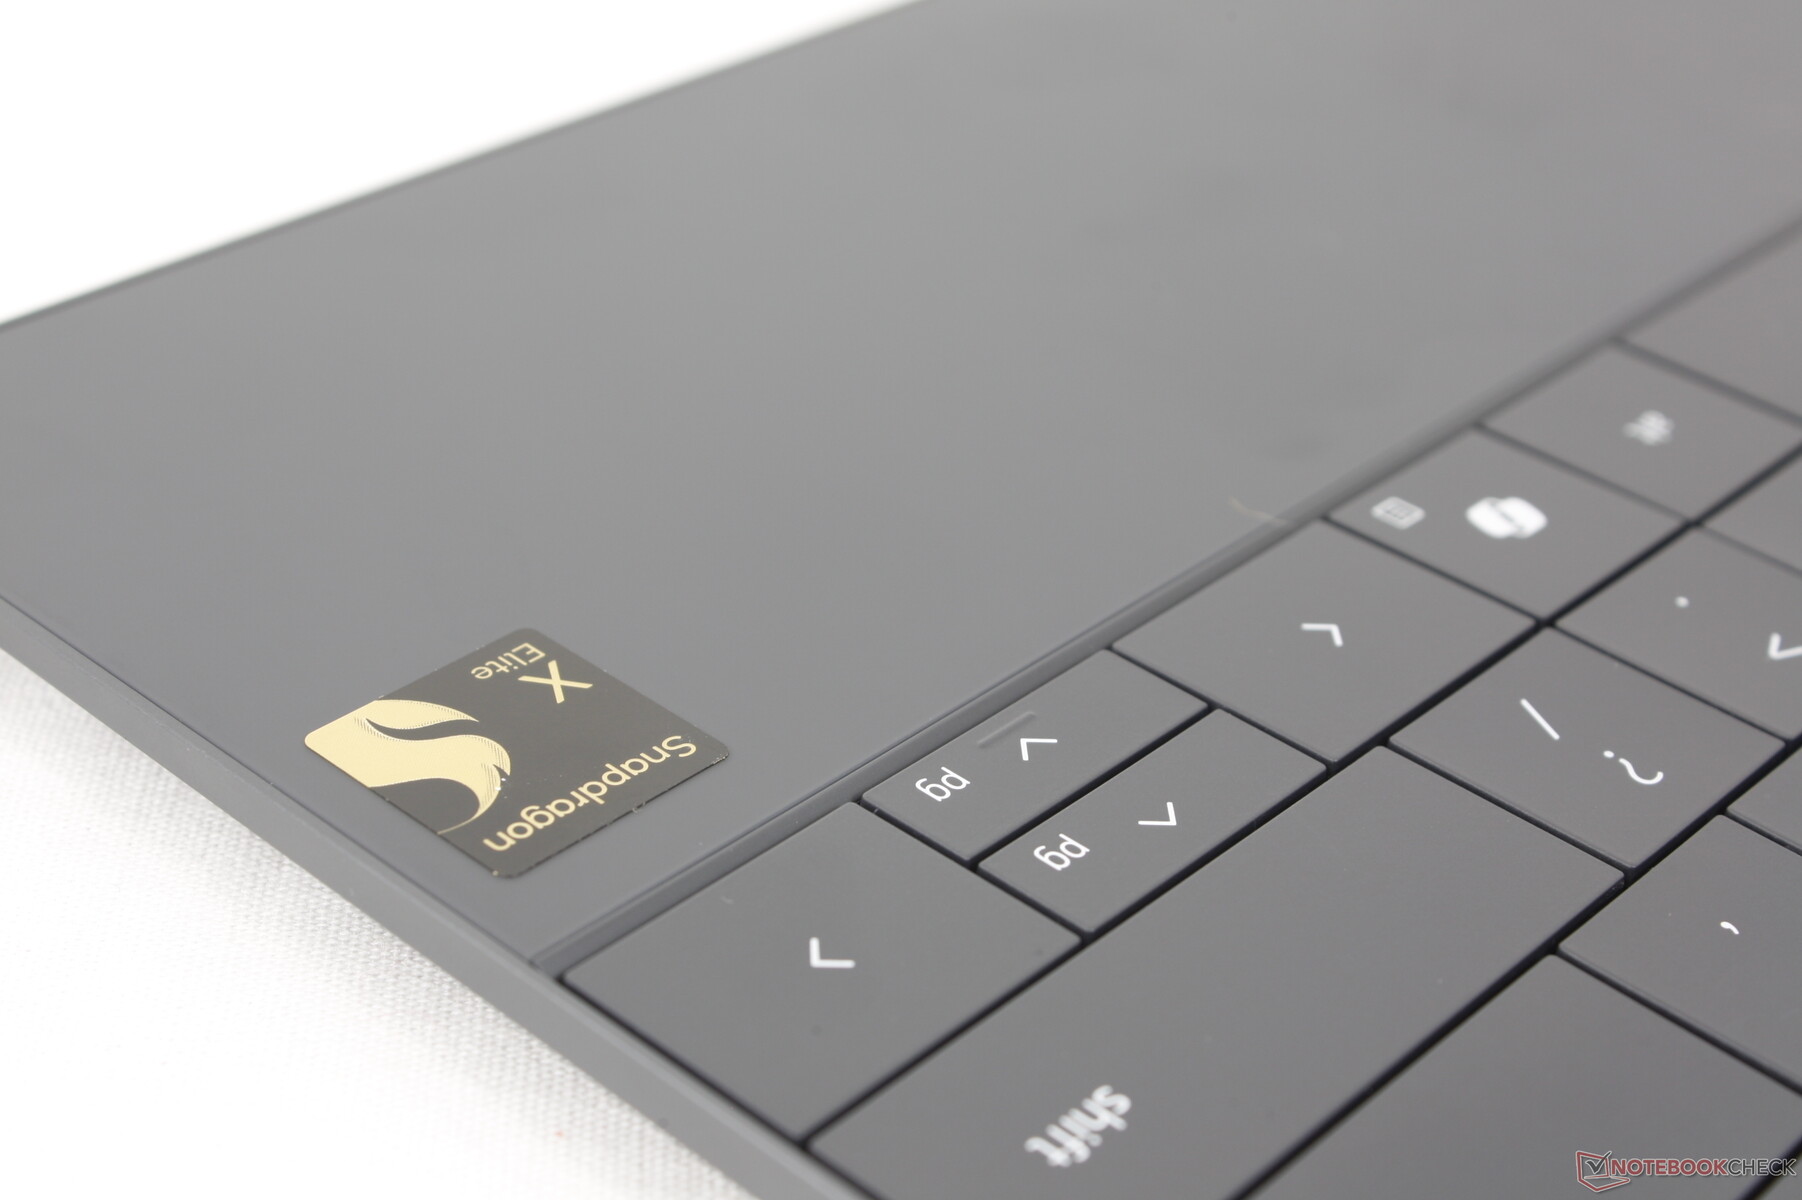
Wat is een betere manier om met een processor te pronken dan het debuut op een van Dell's populairste consumentenlaptops? Het chassis van de XPS 13 Plus 9320/9340 is omgebouwd met de nieuwste Snapdragon X Elite CPU om bij het kleine handjevol Windows-laptops met Qualcomm-processor te horen die dit jaar uitkomen. Het Snapdragon-model, dat de XPS 13 9345 wordt genoemd, is verder visueel identiek aan de bestaande XPS 13 Plus 9320 of 9340 met traditionele Intel CPU's.
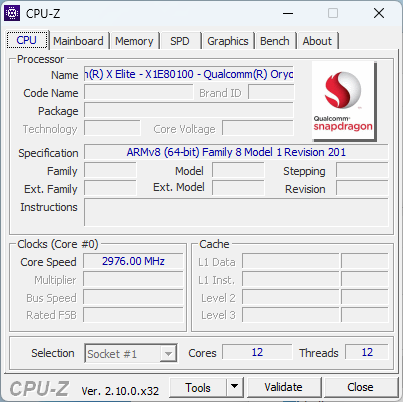
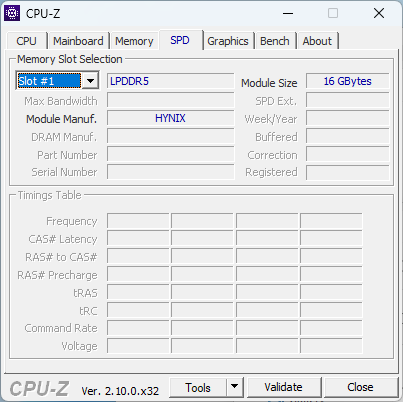
Onze reviewconfiguratie is uitgerust met de Snapdragon X1 Elite X1E-80-100, 16 GB LPDDR5X-8448 RAM en een 1200p 120 Hz IPS-scherm voor ongeveer 1300 USD. Er zijn OLED-schermen in het hogere segment beschikbaar en in sommige regio's kan een tweede Snapdragon X1 Plus X1P processoroptie worden geleverd, maar de geïntegreerde GPU blijft over de hele linie hetzelfde.
Alternatieven voor de XPS 13 9345 zijn onder andere de Microsoft Surface Pro of Samsung Galaxy Book4 Edge 16 beide met dezelfde Snapdragon X1 Elite X1E-80-100 processor. Natuurlijk concurreert het ook rechtstreeks met meer conventionele 13-inch en 14-inch subnotebooks voor kantoor, zoals de Lenovo ThinkBook 13x G4, Asus ZenBook S13of Dell's eigen XPS 13 9340.
Meer Dell beoordelingen:
Potentiële concurrenten in vergelijkings
Evaluatie | Versie | Datum | Model | Gewicht | Hoogte | Formaat | Resolutie | Beste prijs |
|---|---|---|---|---|---|---|---|---|
| 84.5 % | v8 | 08-2024 | Dell XPS 13 9345 SD X Elite X1E-80-100, Adreno X1-85 3.8 TFLOPS | 1.2 kg | 15.3 mm | 13.40" | 1920x1200 | |
| 86.5 % v7 (old) | v7 (old) | 05-2024 | Dell XPS 13 9340 Core Ultra 7 Ultra 7 155H, Arc 8-Core | 1.2 kg | 15.3 mm | 13.40" | 1920x1200 | |
| 86.2 % | v8 | 07-2024 | Microsoft Surface Laptop 7 13.8 Copilot+ SD X Elite X1E-80-100, Adreno X1-85 3.8 TFLOPS | 1.3 kg | 17.5 mm | 13.80" | 2304x1536 | |
| 90.1 % v7 (old) | v7 (old) | 05-2024 | Lenovo ThinkBook 13x G4 21KR0008GE Ultra 5 125H, Arc 7-Core | 1.2 kg | 12.9 mm | 13.50" | 2880x1920 | |
| 82.3 % | v8 | 07-2024 | HP EliteBook Ultra G1q 14 SD X Elite X1E-78-100, Adreno X1-85 3.8 TFLOPS | 1.3 kg | 11.2 mm | 14.00" | 2240x1400 | |
| 85.4 % v7 (old) | v7 (old) | 05-2023 | Asus ZenBook S13 OLED UX5304 i7-1355U, Iris Xe G7 96EUs | 1 kg | 11.8 mm | 13.30" | 2880x1800 |
Hinweis: We hebben ons beoordelingssysteem kürzlich geactualiseerd en de resultaten van versie 8 zijn niet vergelijkbaar met de resultaten van versie 7. Meer informatie vindt u hier beschikbaar.
Opmerking: We hebben ons beoordelingssysteem onlangs bijgewerkt en de resultaten van versie 8 zijn niet vergelijkbaar met de resultaten van versie 7. Meer informatie is beschikbaar hier .
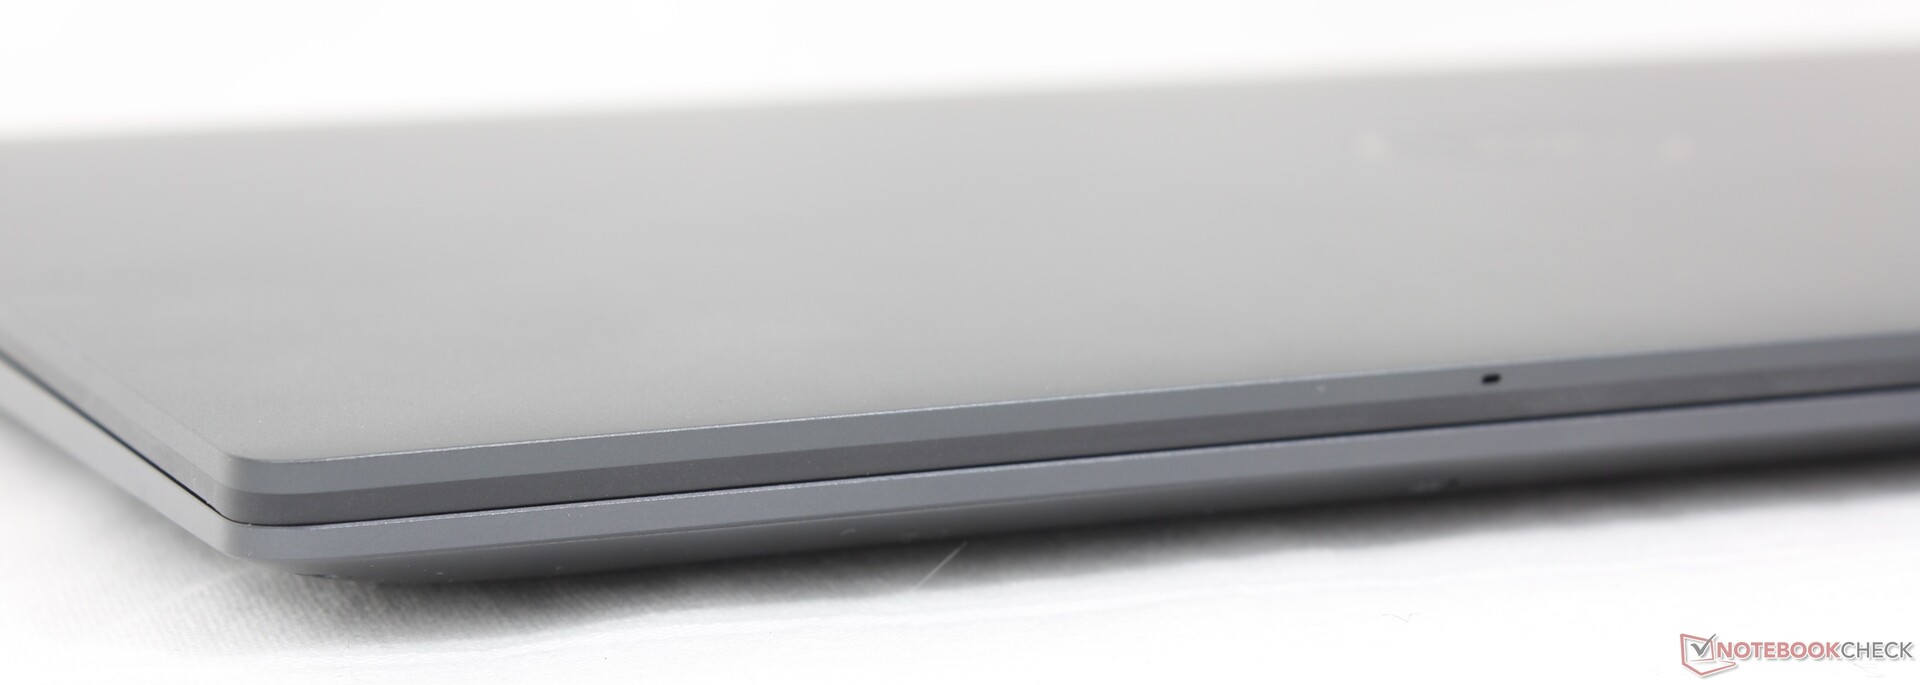
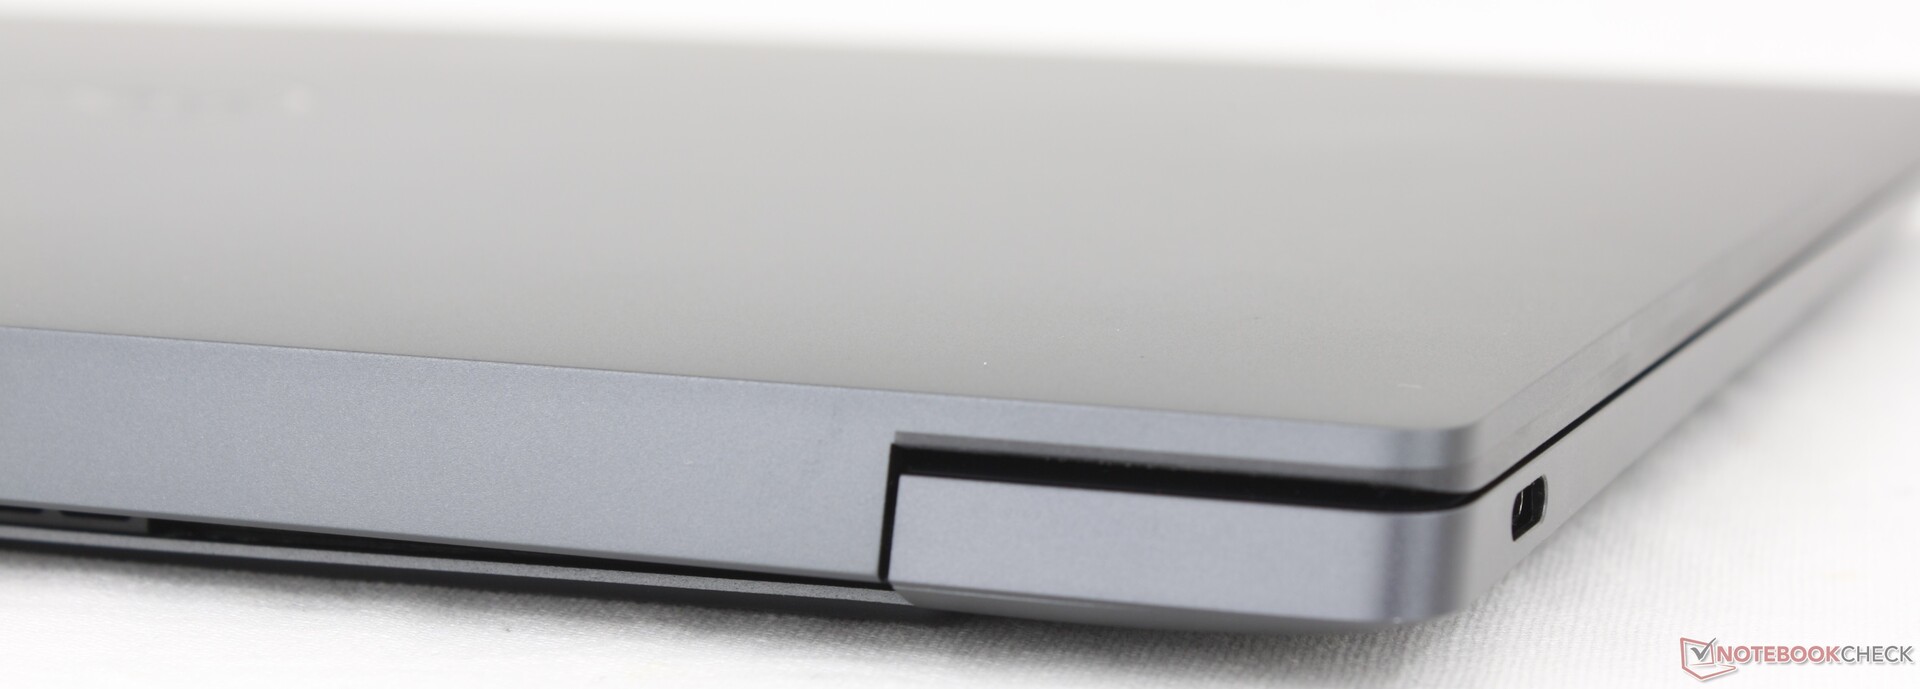
Geval - Vertrouwd uiterlijk en gevoel
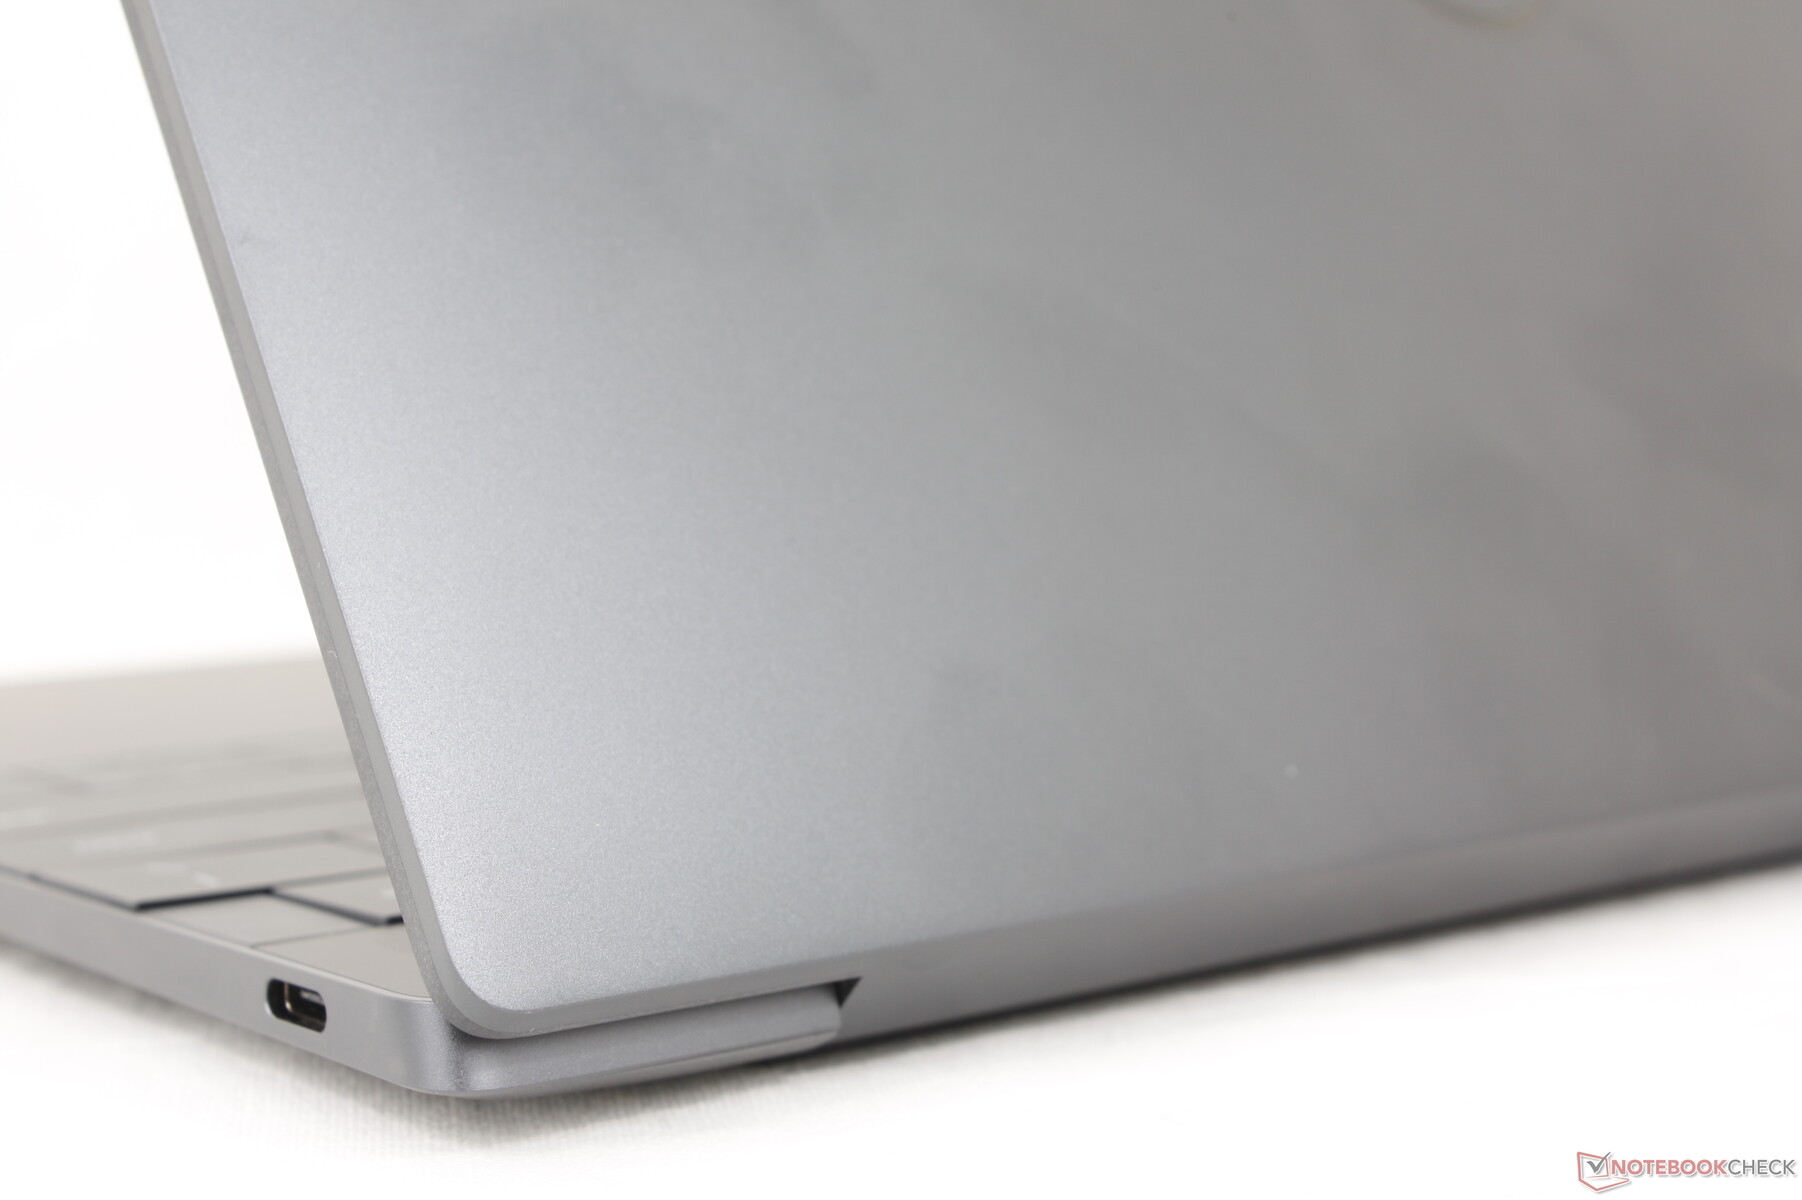
Er zijn geen externe verschillen tussen het Qualcomm-model en het Intel-model, dus zijn onze opmerkingen over het Intel-model ook hier van toepassing. Enkele nieuwe kleuropties zouden leuk geweest zijn, maar dezelfde Platinum en Graphite opties zijn van toepassing. Wij geven de voorkeur aan de Platinum optie omdat de helderwitte kleur vingerafdrukken beter verdoezelt dan de donkere Graphite optie van ons Qualcomm testtoestel, vooral langs de palmsteunen en de buitenste klep.
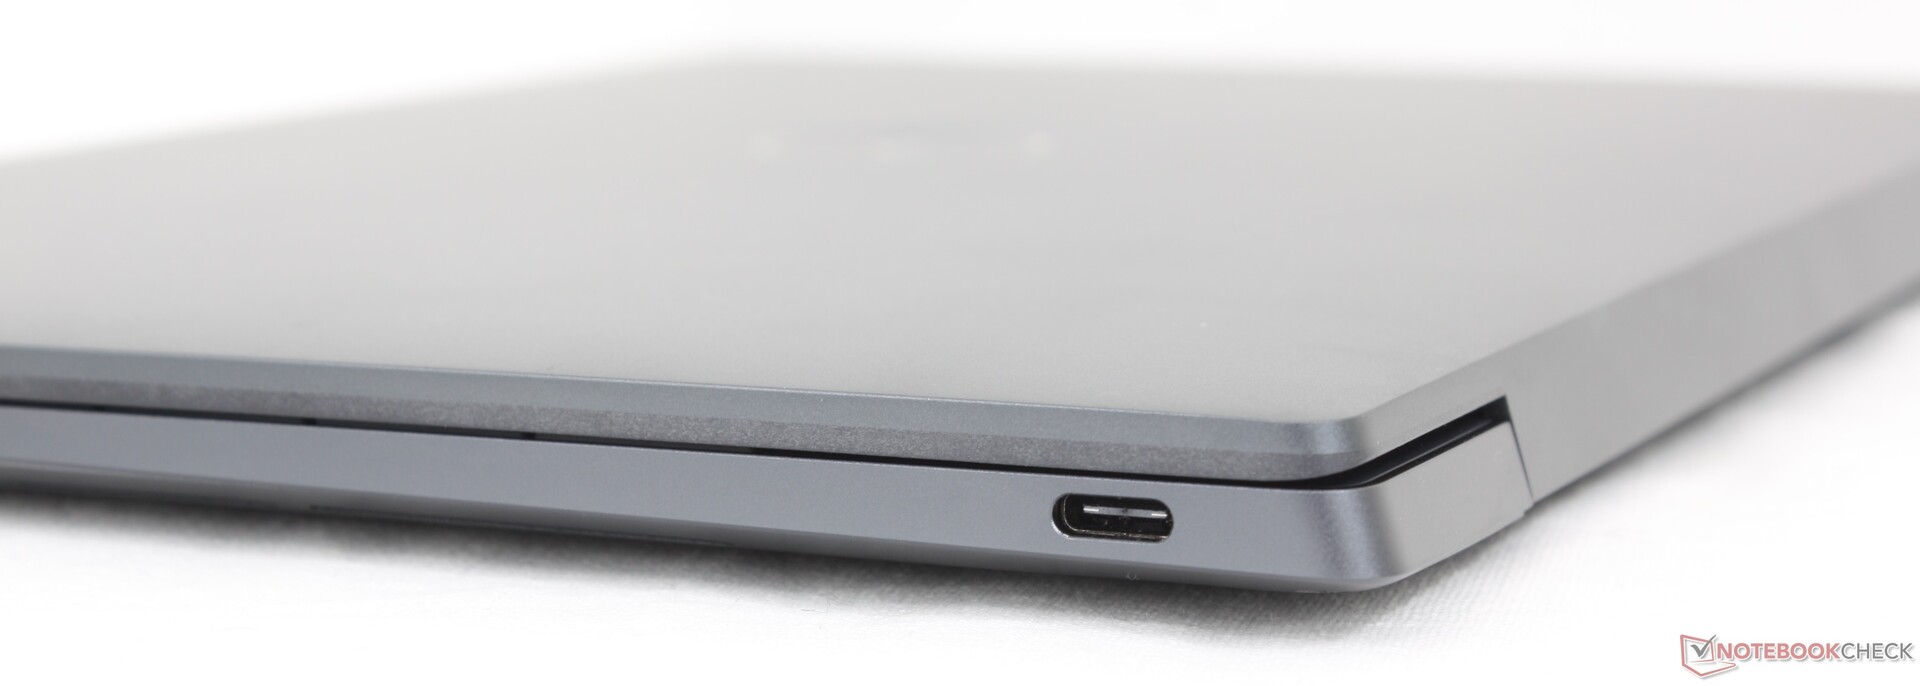
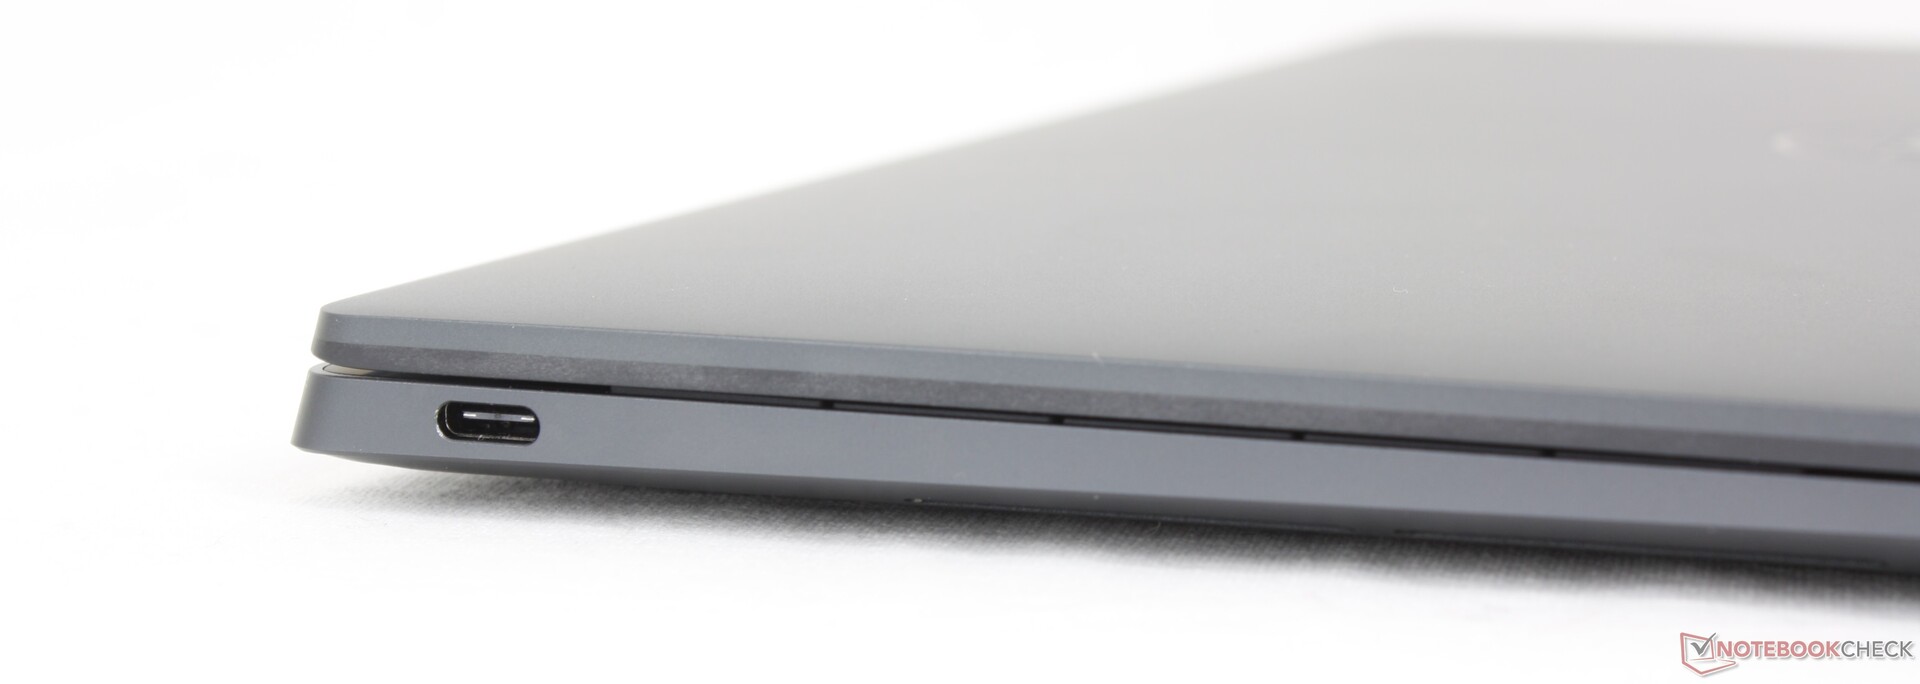
Connectiviteit
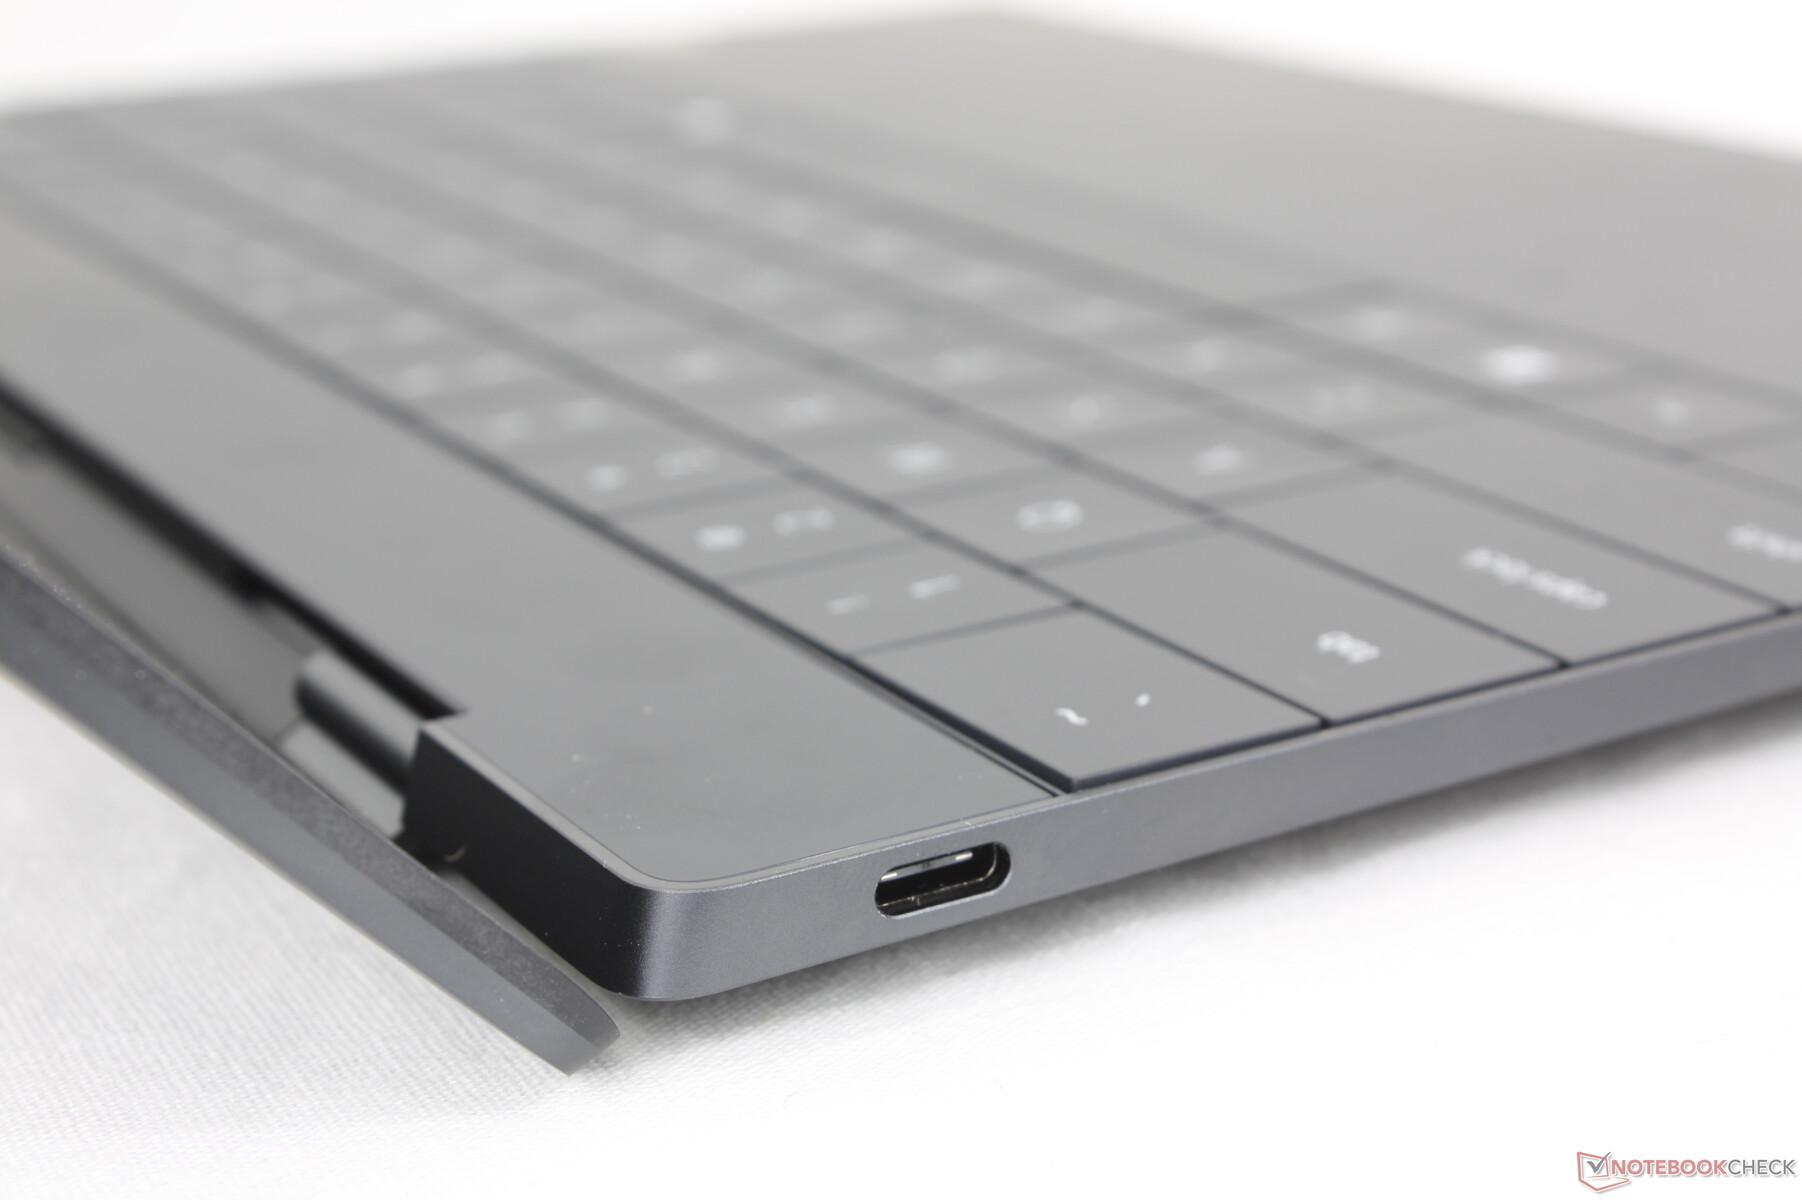
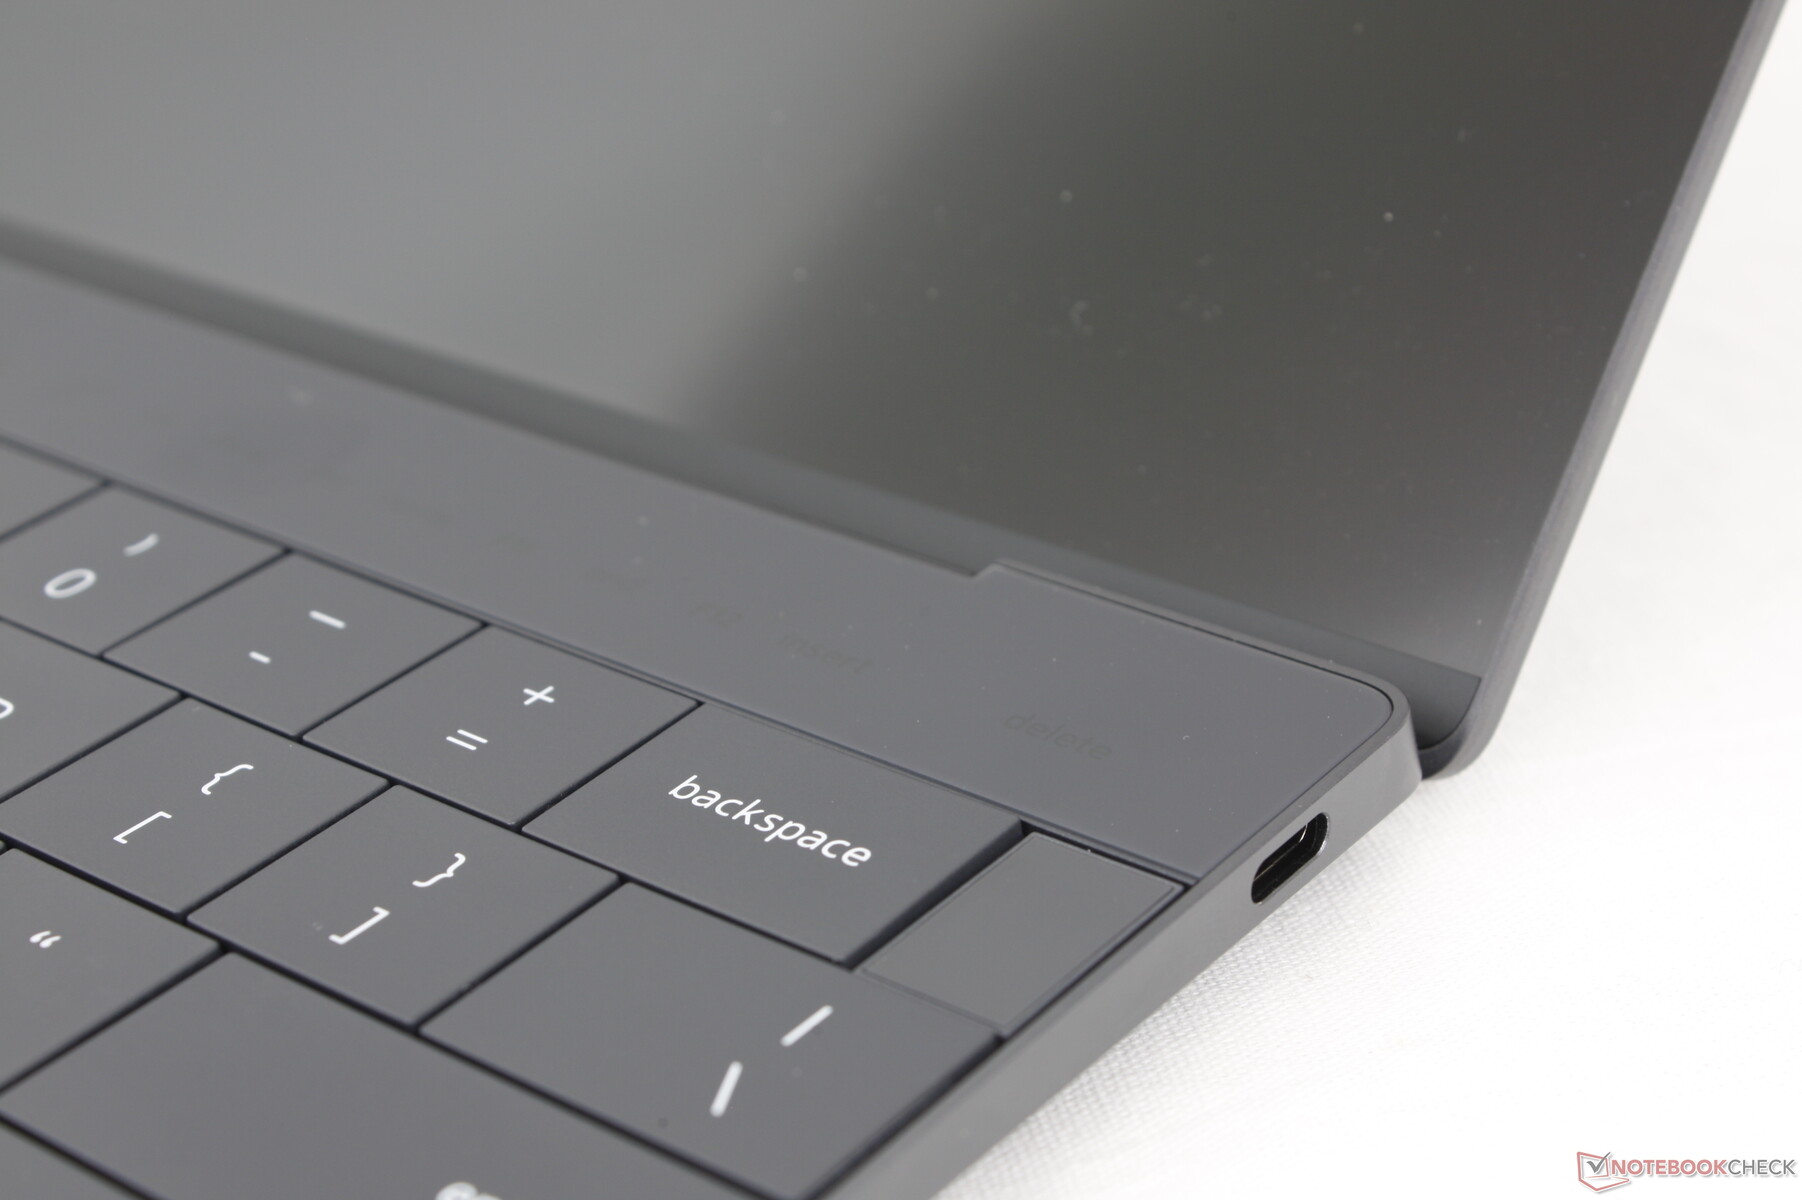
Er zijn twee USB-C 4.0-poorten, net als op de Intel-versie van de XPS 13. De poorten hier hebben echter geen Thunderbolt-ondersteuning en dus is eGPU-compatibiliteit niet gegarandeerd. Toen we onze Aorus RTX 2080 Ti Gaming Boxaan te sluiten, kon de Qualcomm-laptop de eGPU bijvoorbeeld niet herkennen, terwijl een Thunderbolt-compatibele pc deze automatisch zou herkennen via Apparaatbeheer. Qualcomm heeft gezegd dat alle ondersteuning en toepasselijke stuurprogramma's aan de individuele eGPU-makers worden overgelaten, wat niet veelbelovend is voor bestaande eGPU-eigenaars.
Communicatie
Dell heeft de BE200 van de Intel XPS 13 vervangen door de FastConnect 7800 van de Qualcomm XPS 13. De module ondersteunt Wi-Fi 7-connectiviteit, wat in de meeste huishoudens nog niet gebruikelijk is. De prestaties zijn desondanks stabiel in combinatie met onze Wi-Fi 6E AXE11000 testrouter.
Webcam
Het model wordt standaard geleverd met dezelfde 2 MP webcam als op de XPS 13 9340, in plaats van de 1 MP webcam op de oorspronkelijke XPS 13 9320. IR is ook ingebouwd om Windows Hello gezichtsherkenning te ondersteunen. Er is echter nog steeds geen cameraklep of uitschakelaar aanwezig.


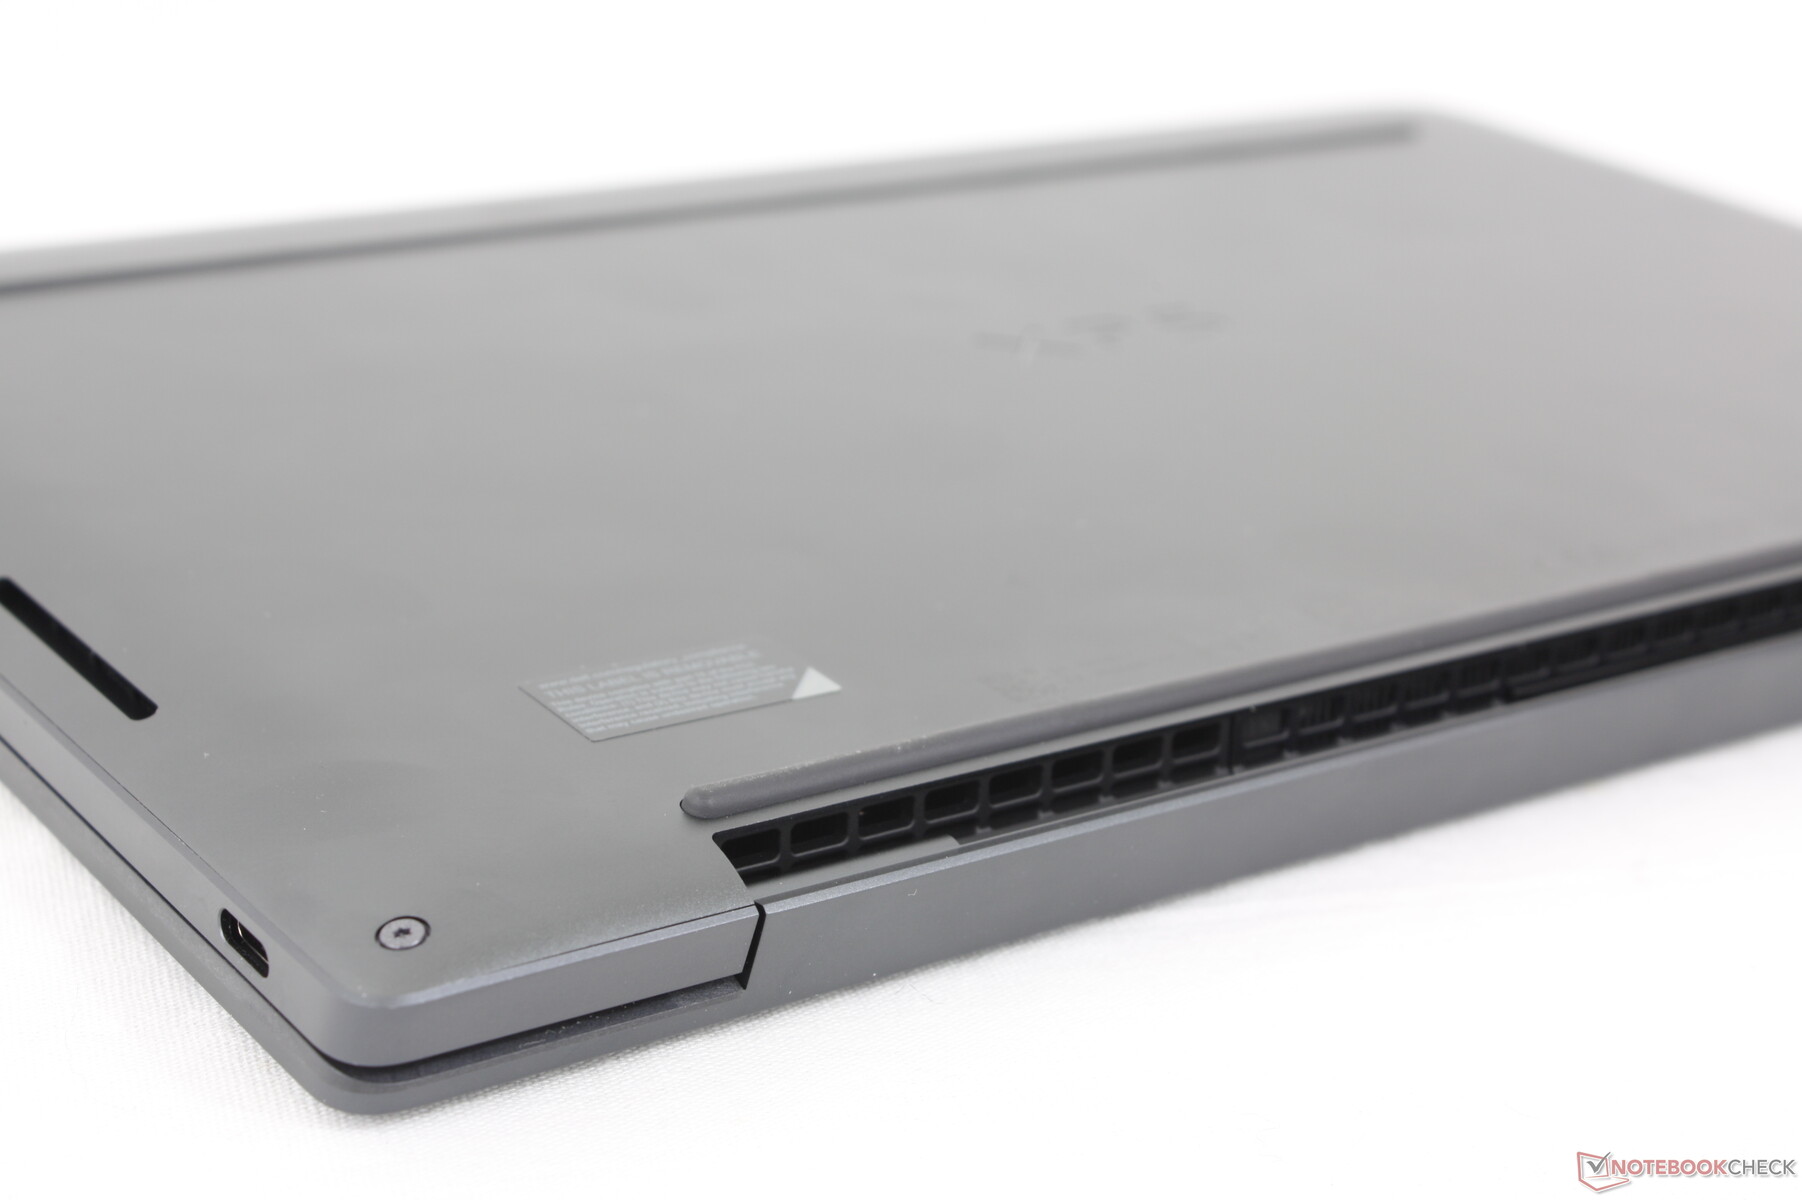
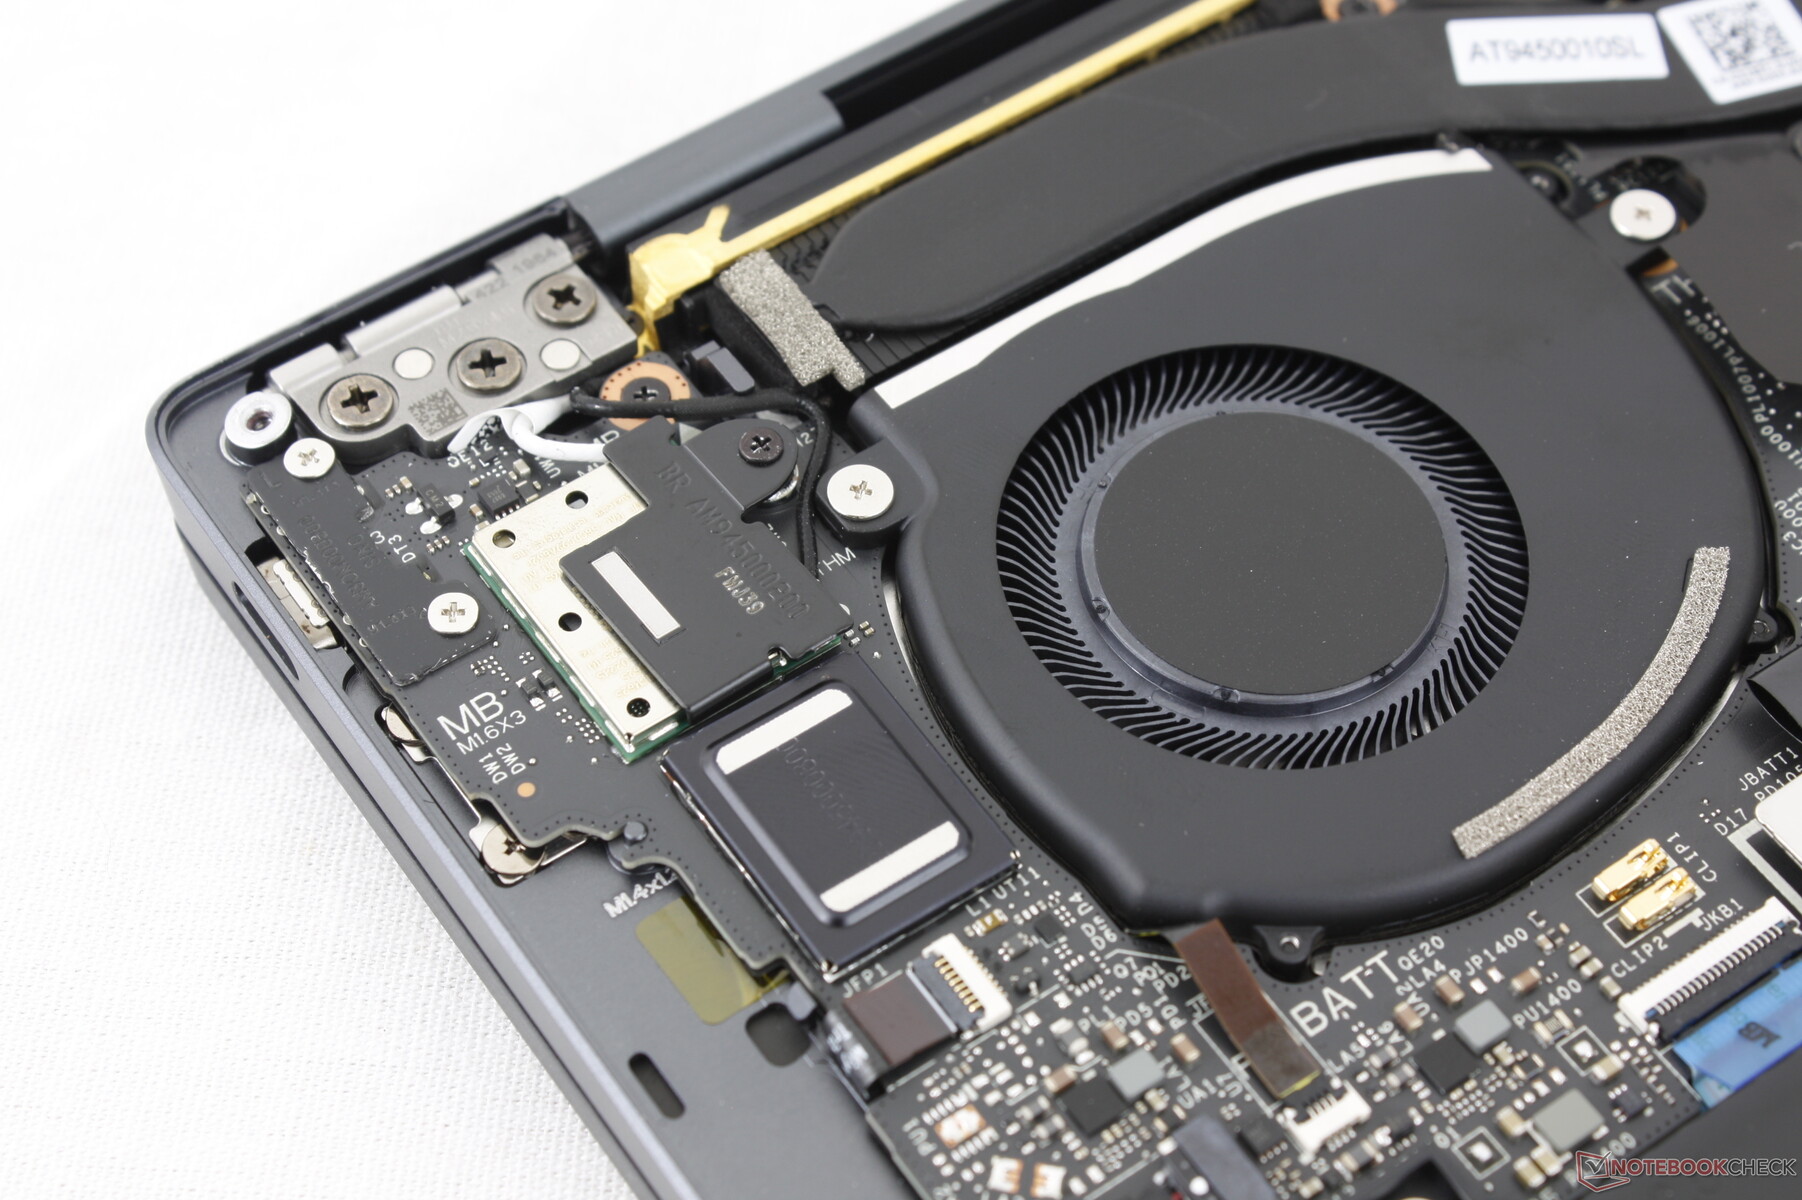
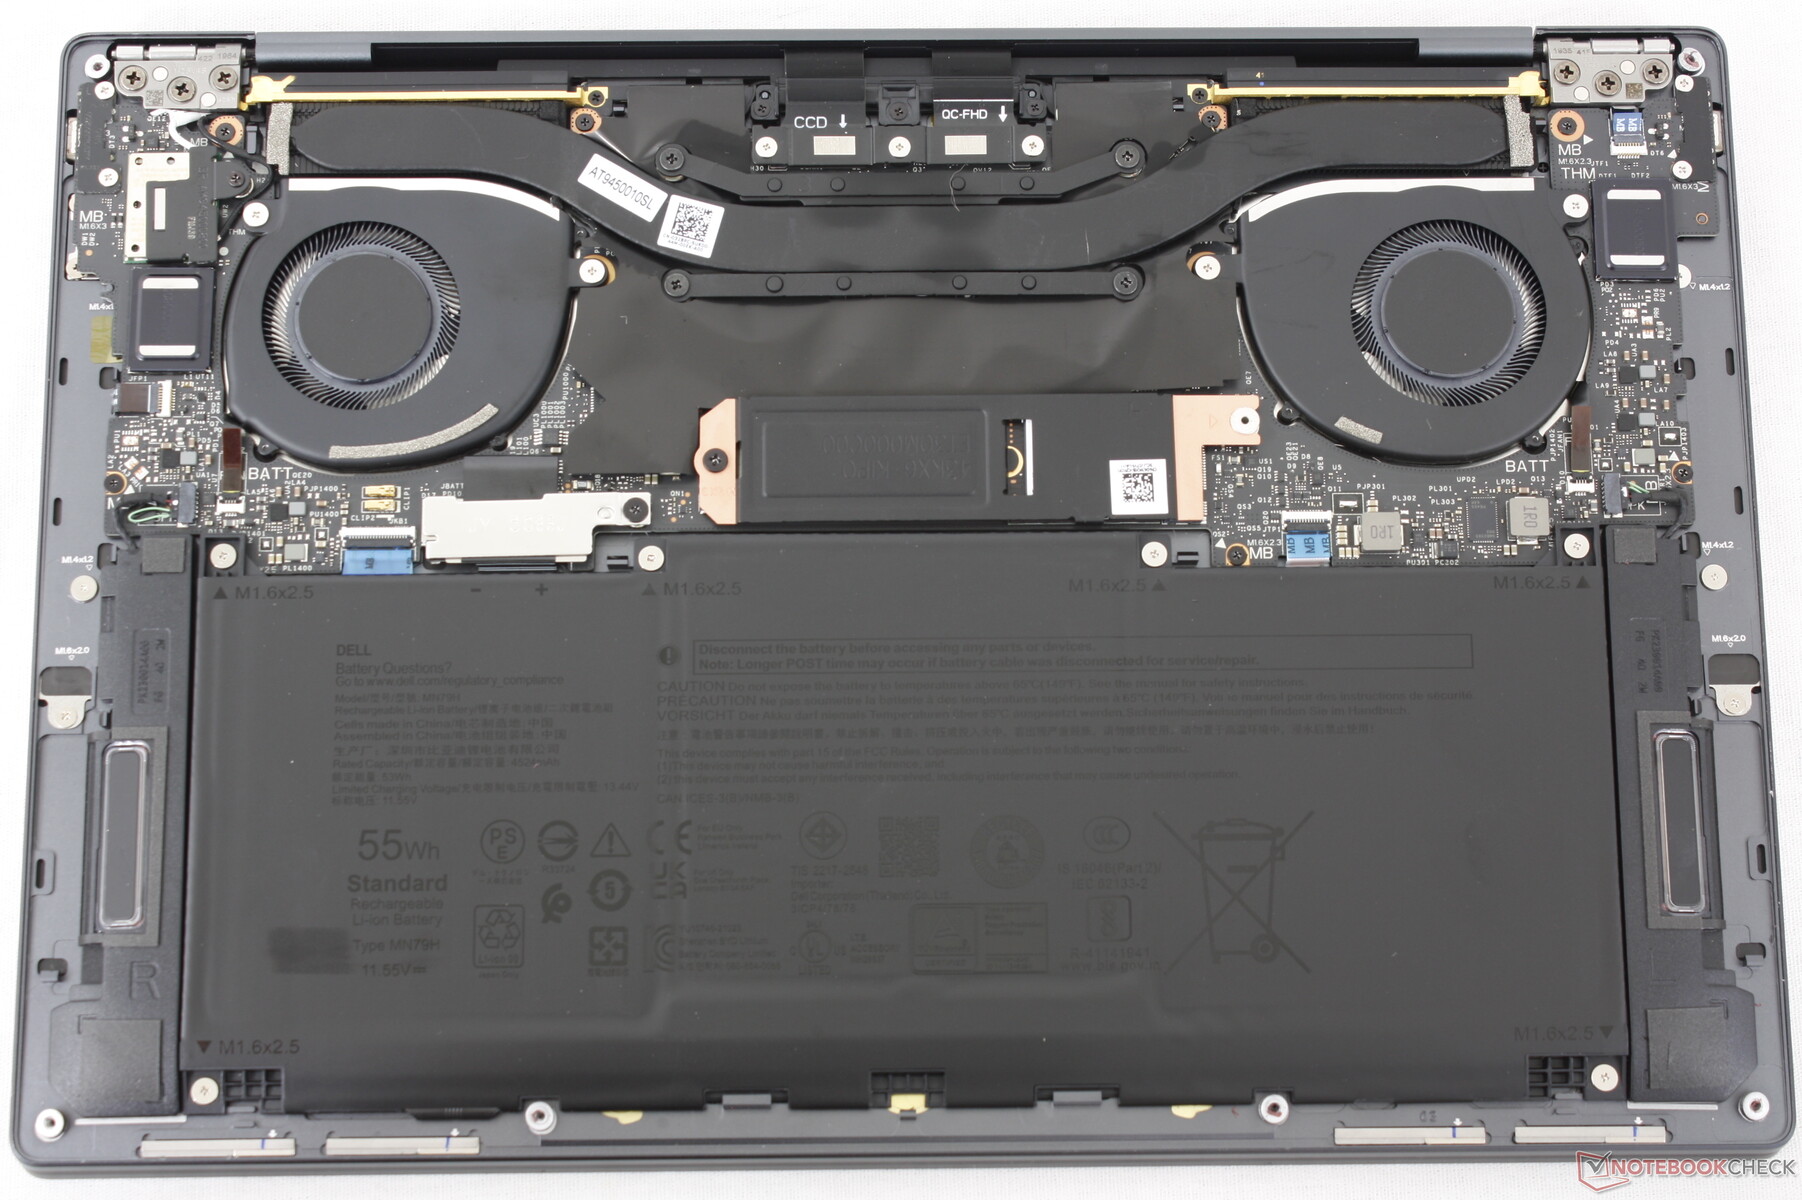
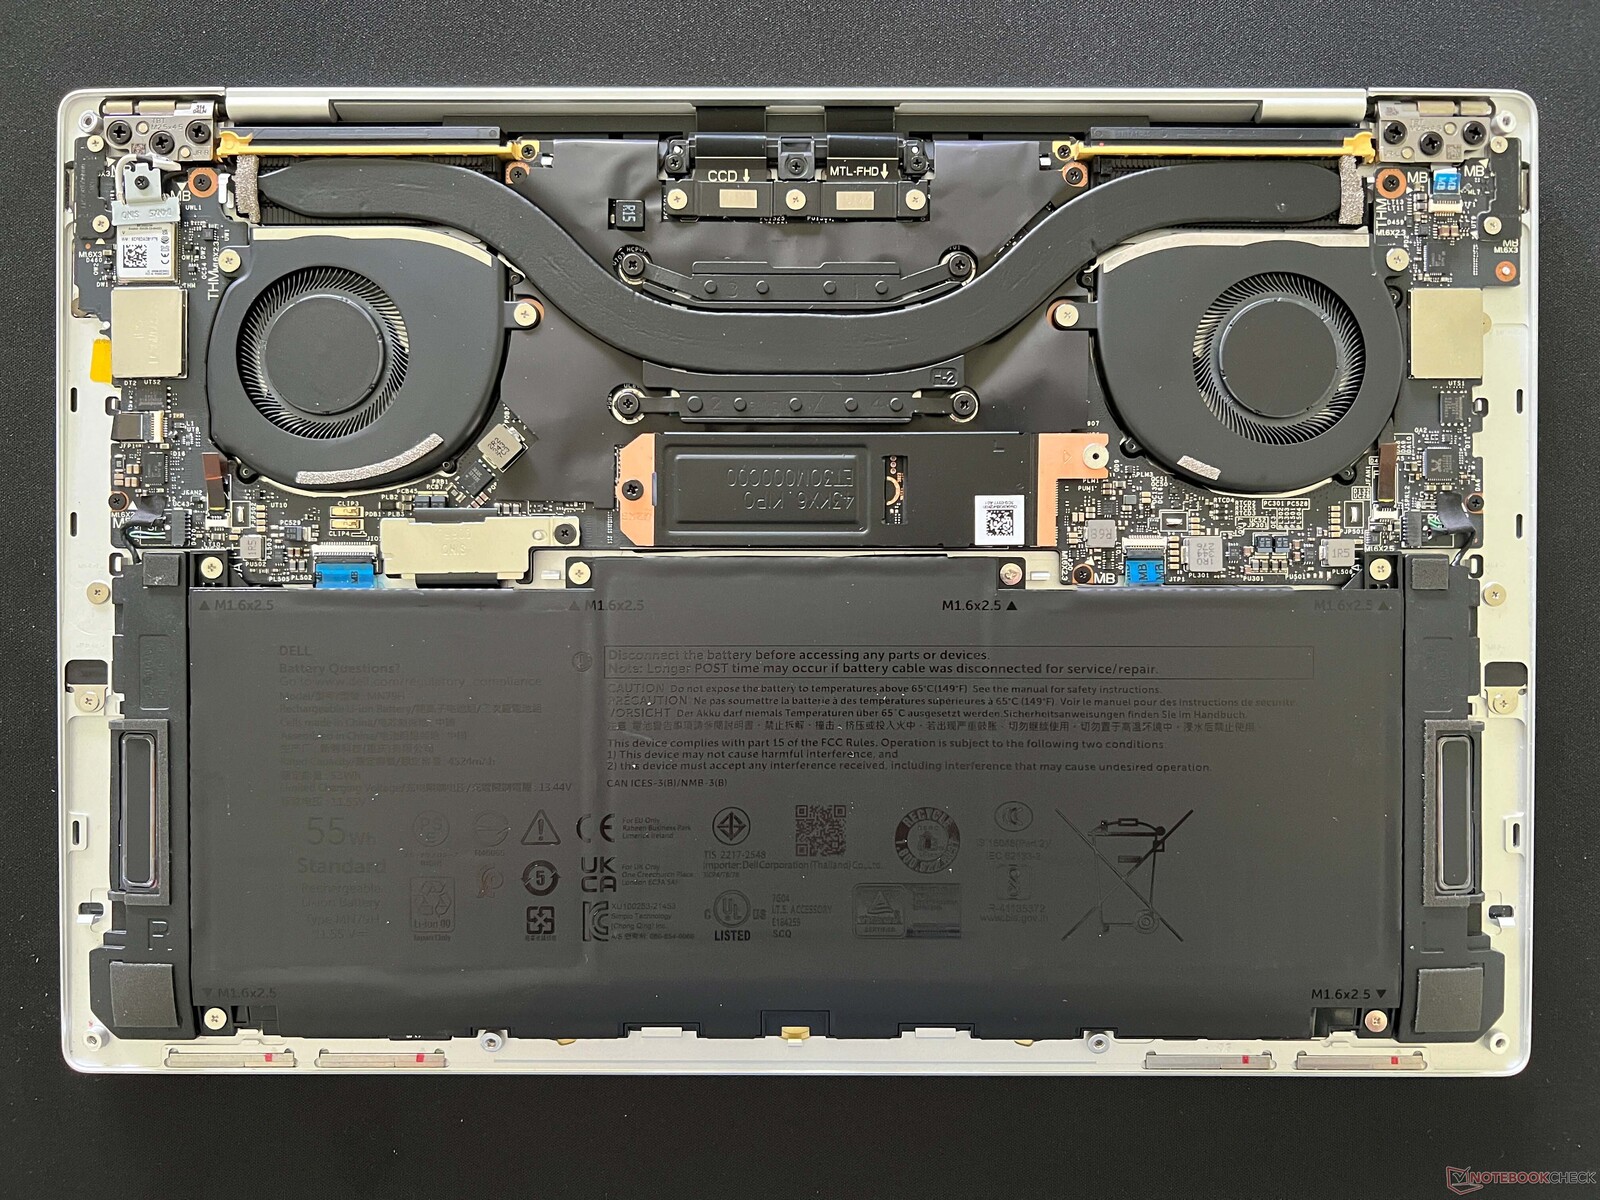
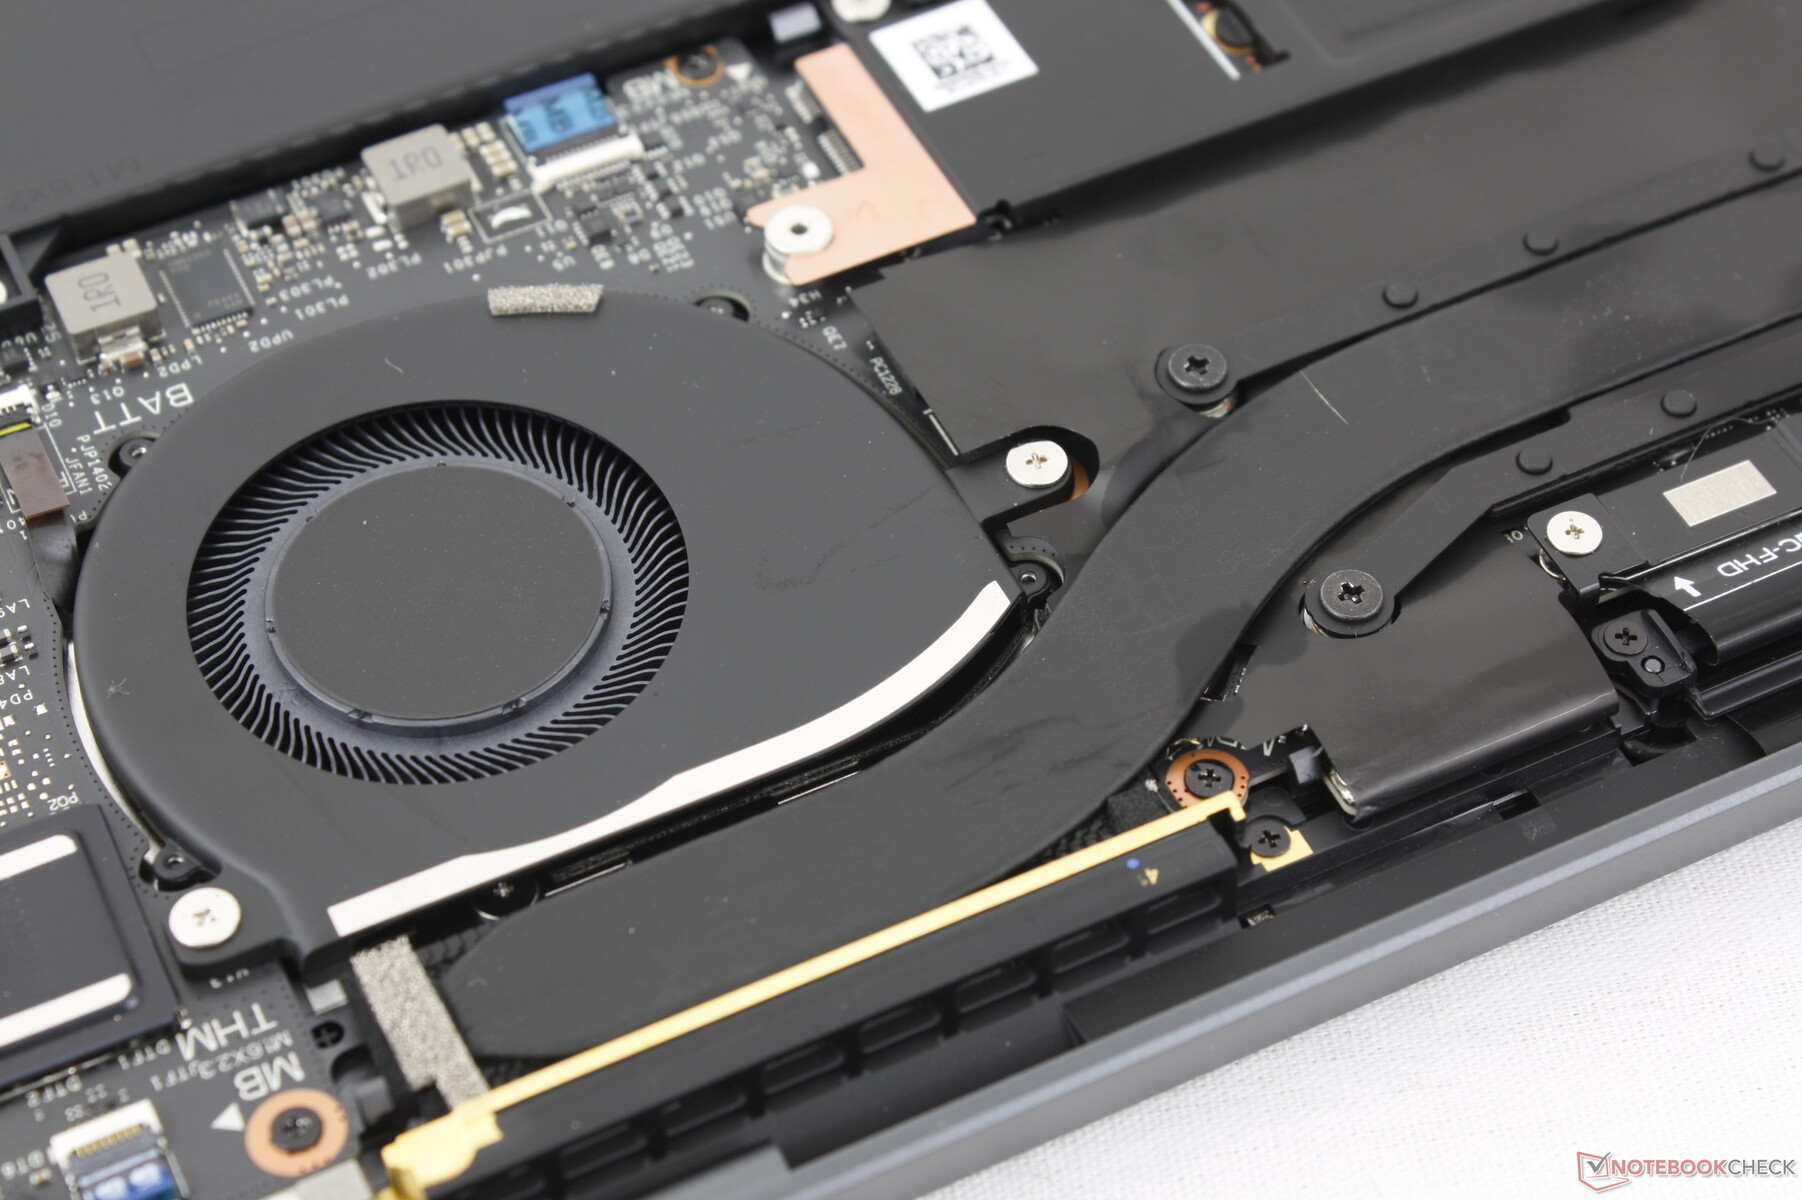
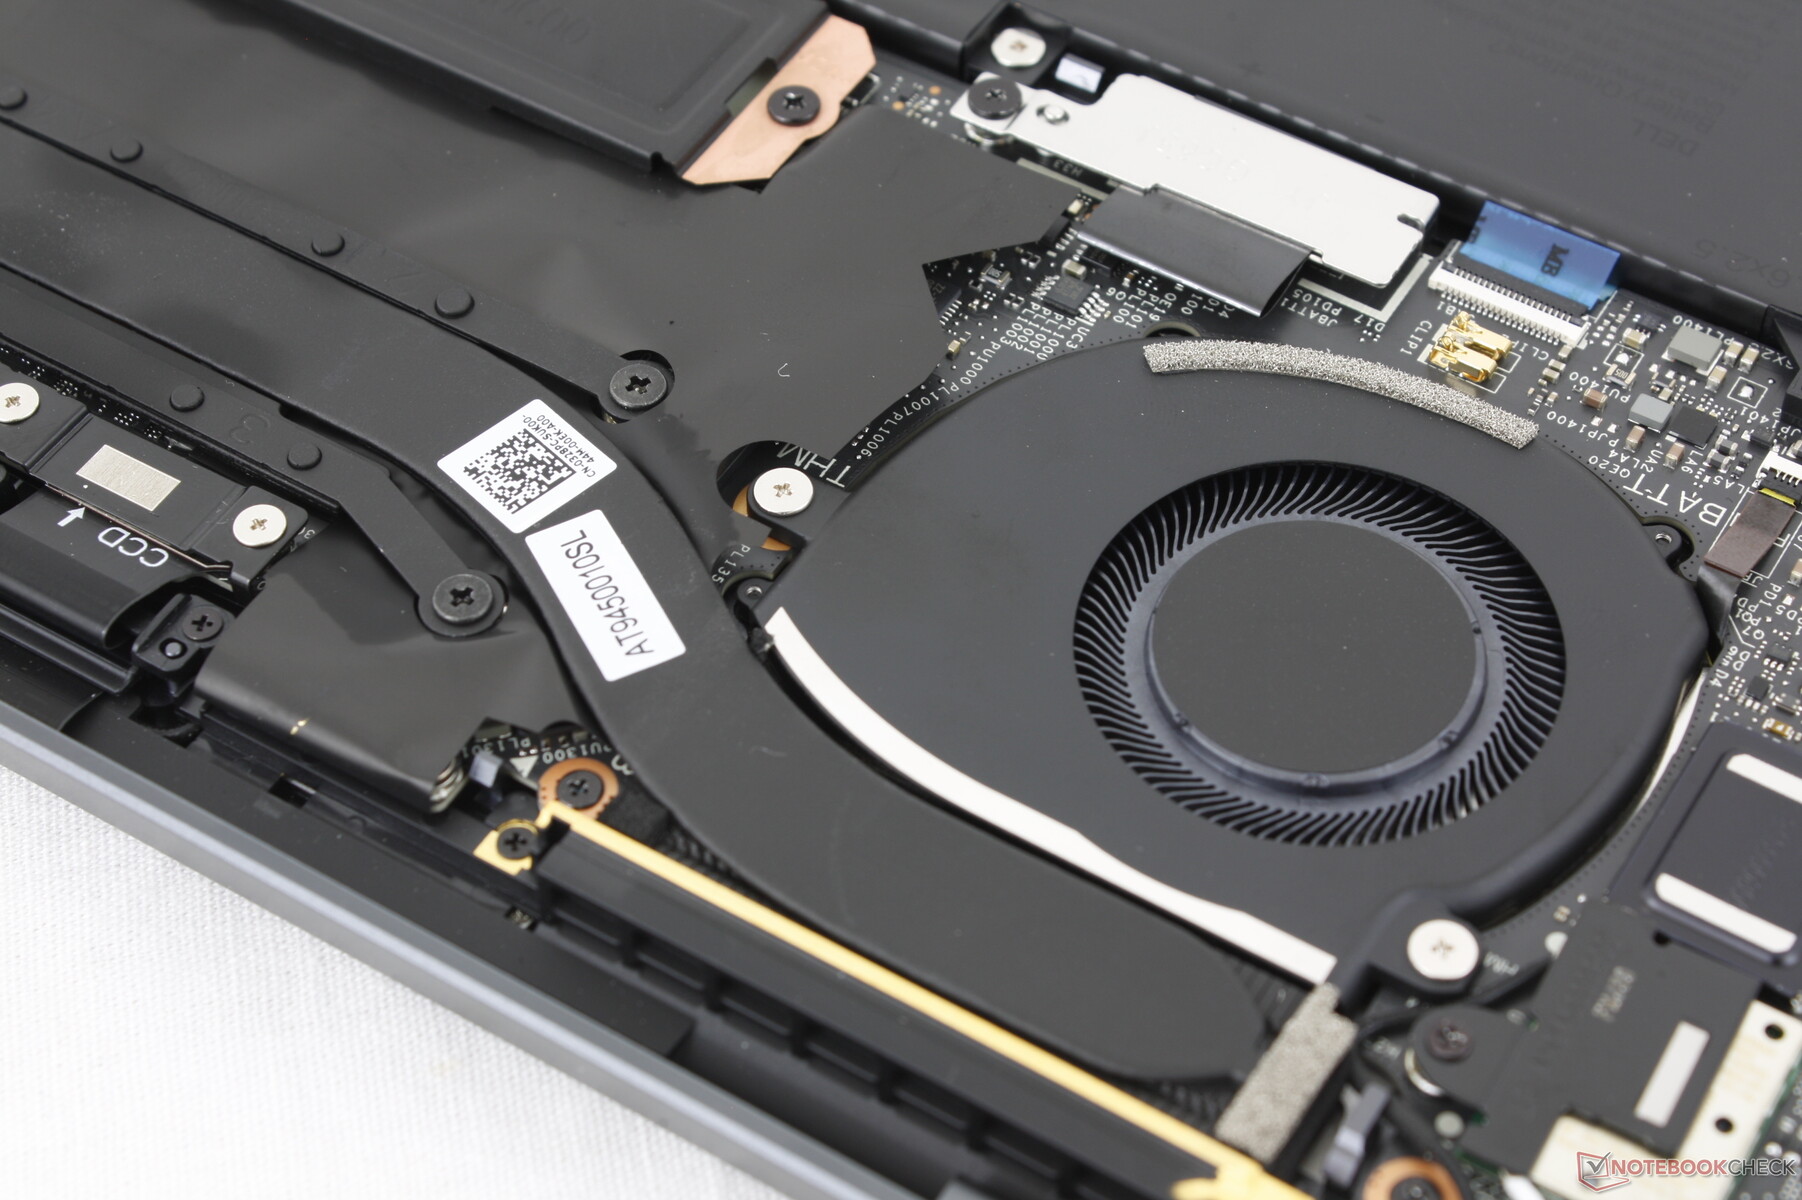
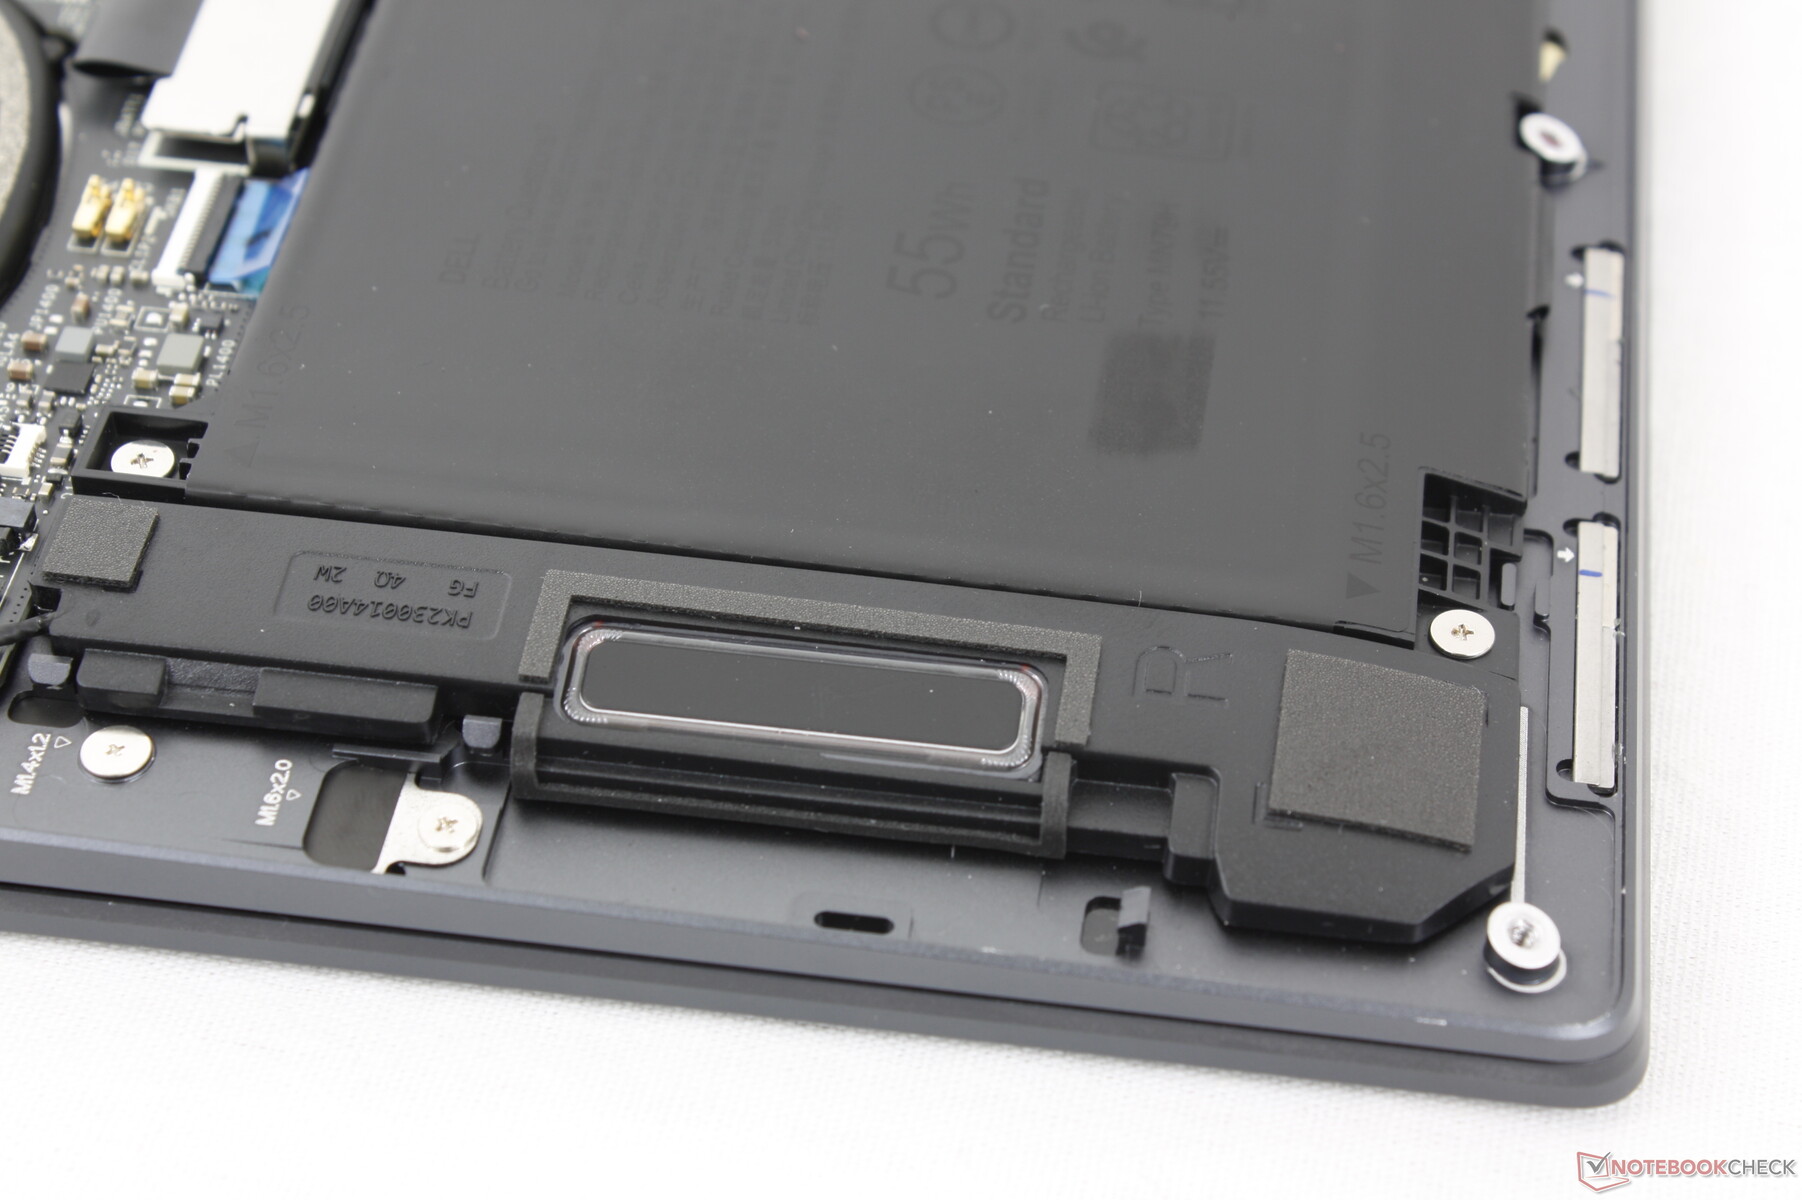
Onderhoud
Voor het verwijderen van het bodempaneel is alleen een Torx-schroevendraaier nodig. Er is verder niets om te upgraden behalve de enkele M.2 SSD, aangezien zowel RAM als WLAN gesoldeerd zijn.
Duurzaamheid
De verpakking bestaat voor 75 procent uit gerecycled materiaal en voor 25 procent uit hernieuwbaar materiaal om volledig recyclebaar te zijn. Ondertussen is de laptop zelf gemaakt van minstens 20 procent gerecycled aluminium en glas.
Accessoires en garantie
Er zitten geen extra's in de doos behalve de AC-adapter en papierwerk, terwijl de Intel-gebaseerde XPS-modellen vaak gratis een USB-C naar USB-A adapter bevatten.
Bij aankoop in de VS geldt de gebruikelijke beperkte fabrieksgarantie van een jaar.
Invoerapparaten - Schoner uiterlijk ten koste van bruikbaarheid
Toetsenbord
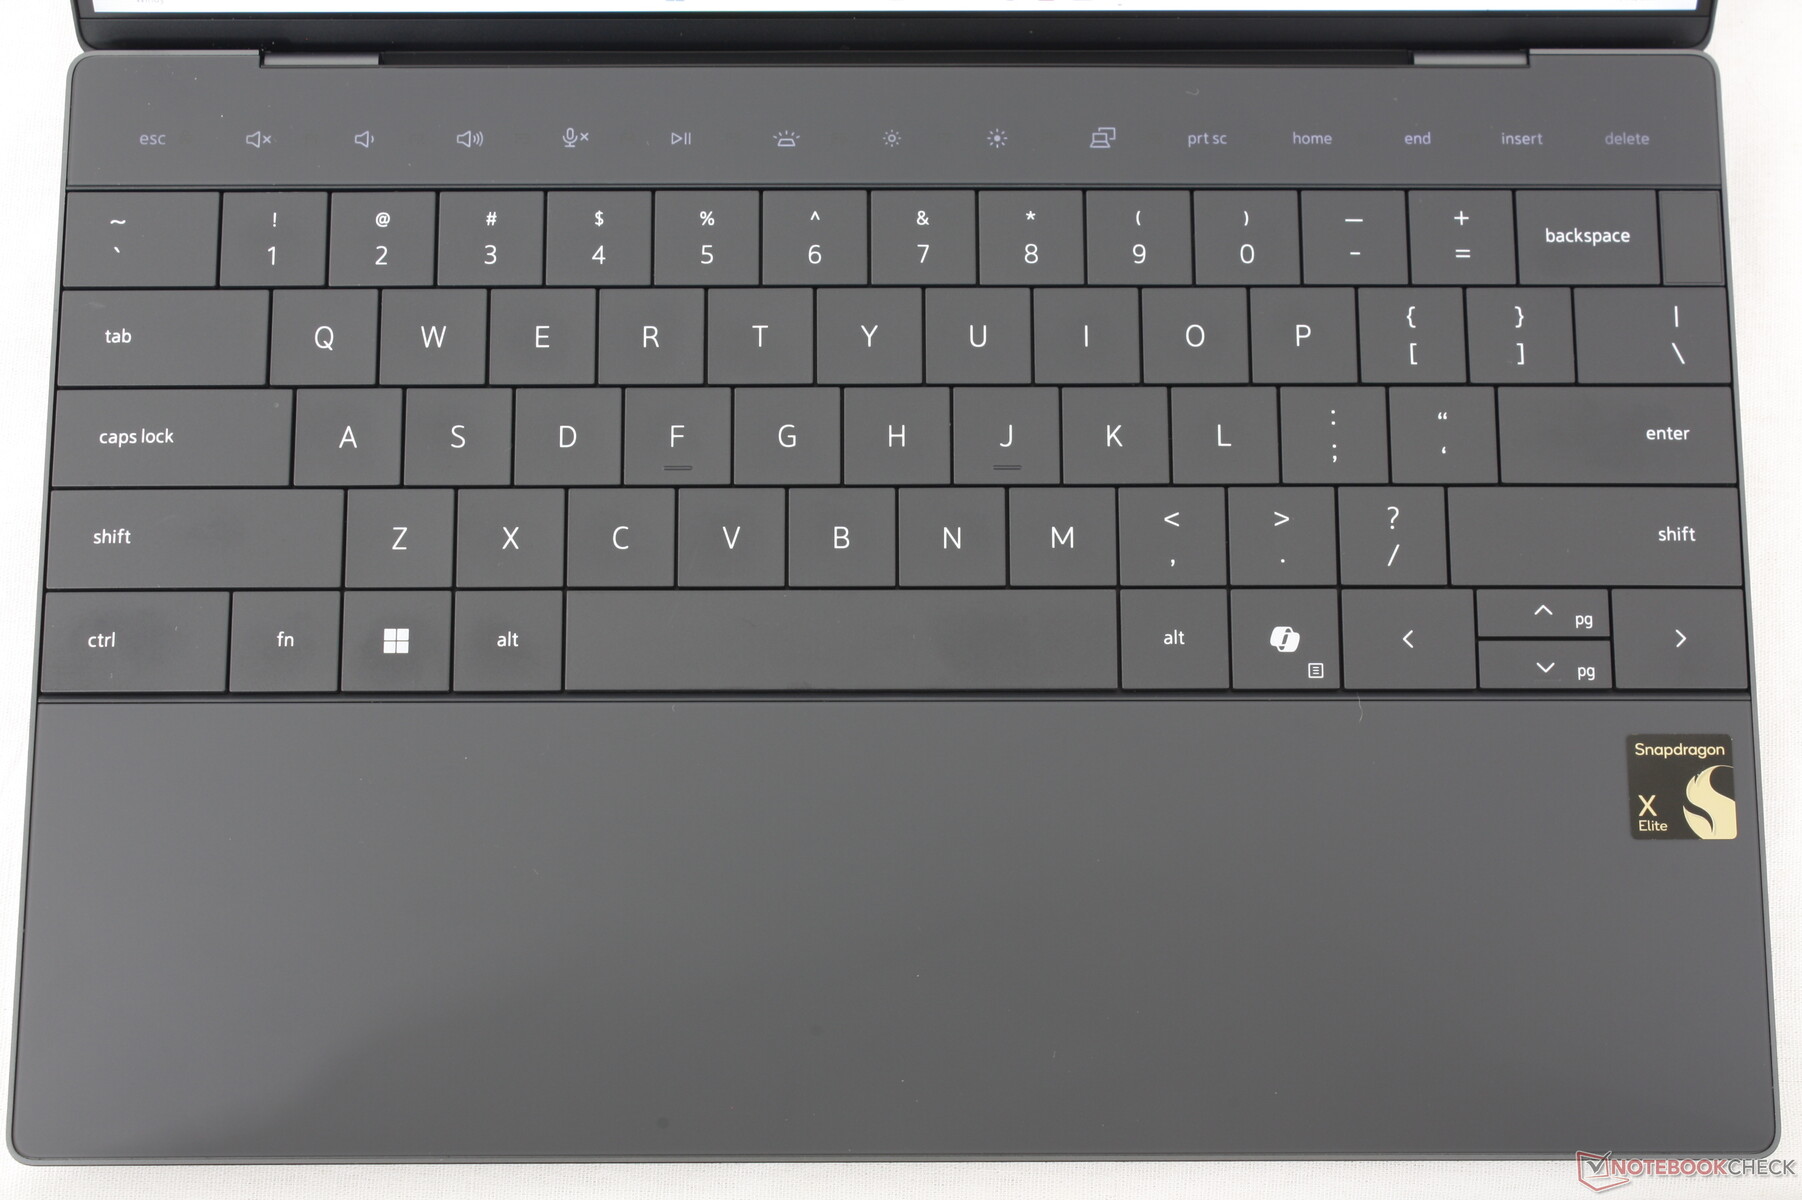
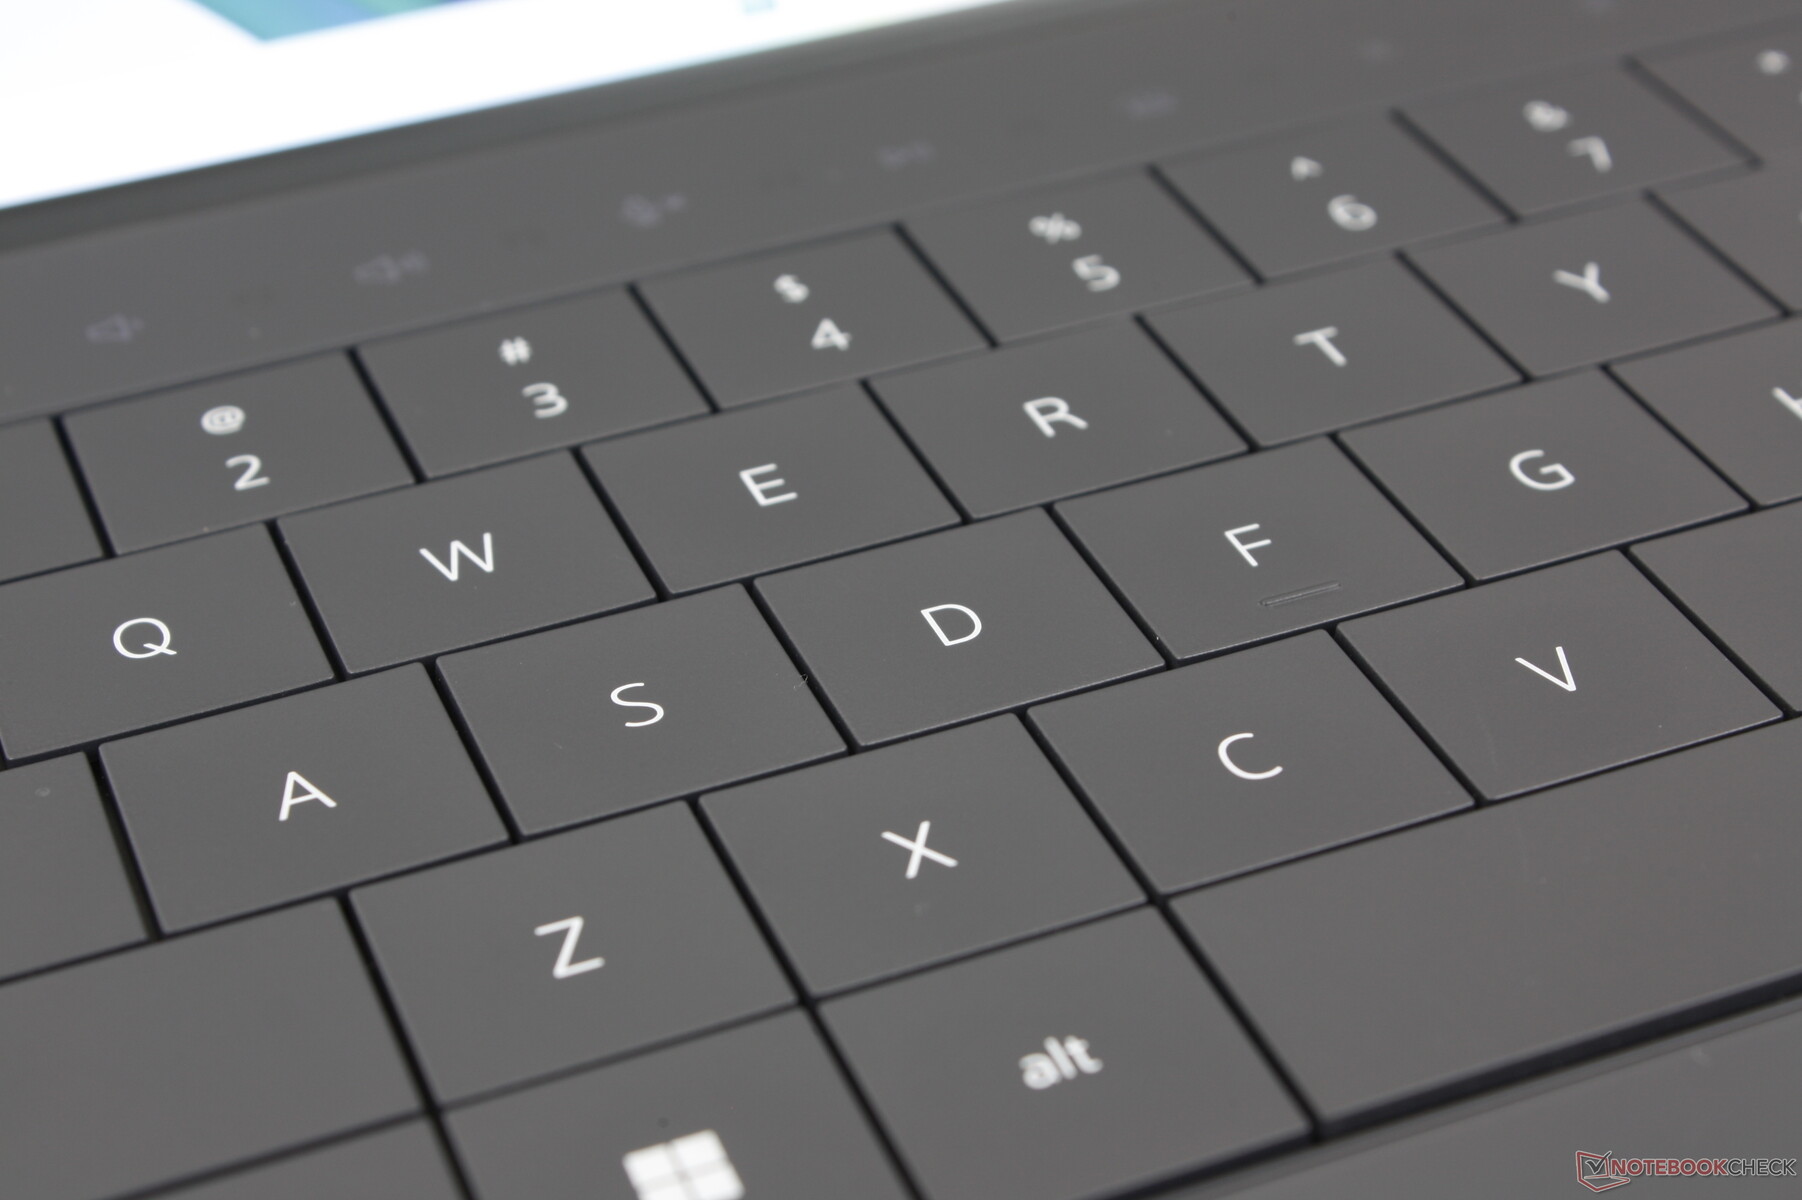
Het roostervrije toetsenbord is even wennen vergeleken met de traditionele toetsenborden op de meeste andere subnotebooks. De toetsaanslag is met slechts 1,0 mm nog korter dan normaal en de feedback is relatief zacht voor een zachtere type-ervaring. Het verschil is dag en nacht tussen de XPS 13 9345 en de stevigere toetsen op de HP Spectre x360 14.
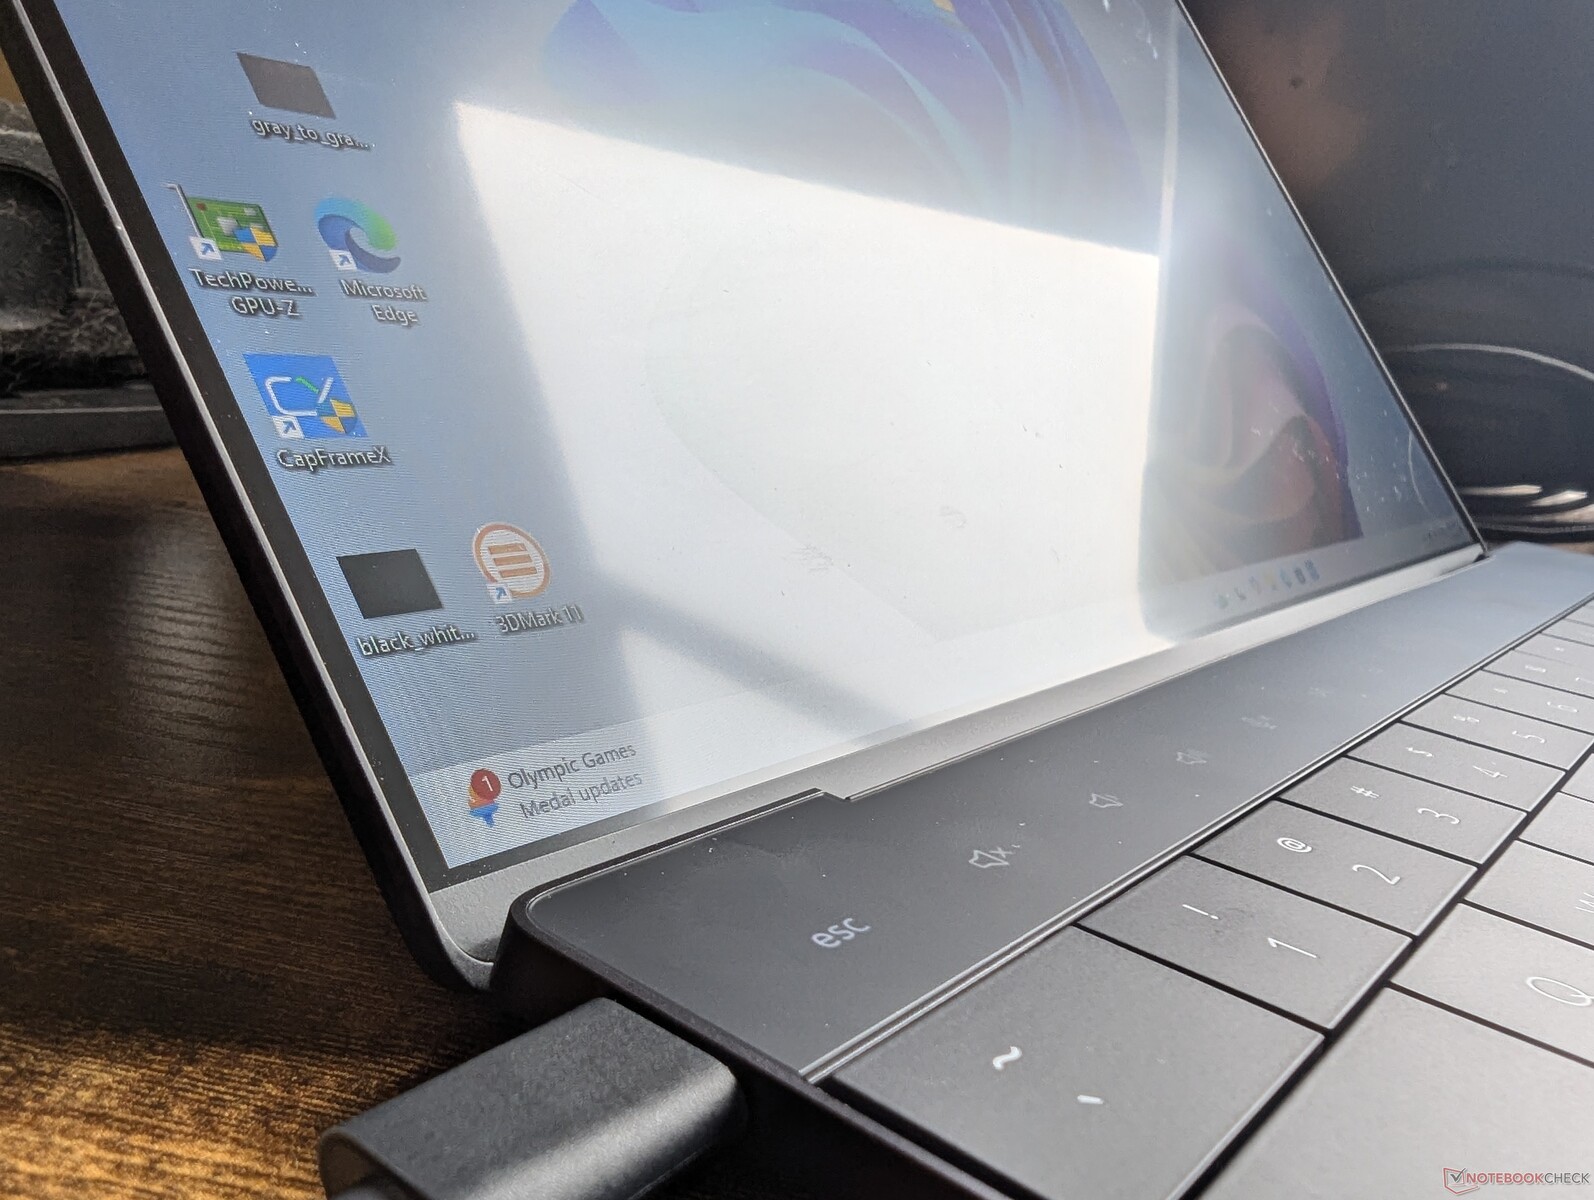
De functietoetsen met aanraakfunctionaliteit zijn ook een allegaartje. Lenovo implementeerde enkele jaren geleden iets soortgelijks op de ThinkPad-serie, maar liet het prompt vallen. Het is dus een beetje verrassend om ze opnieuw te zien verschijnen op een concurrerende fabrikant. Het grootste probleem is dat de toetsen gevoelig zijn voor zelfs de kleinste aanrakingen, wat kan leiden tot onbedoelde invoer.
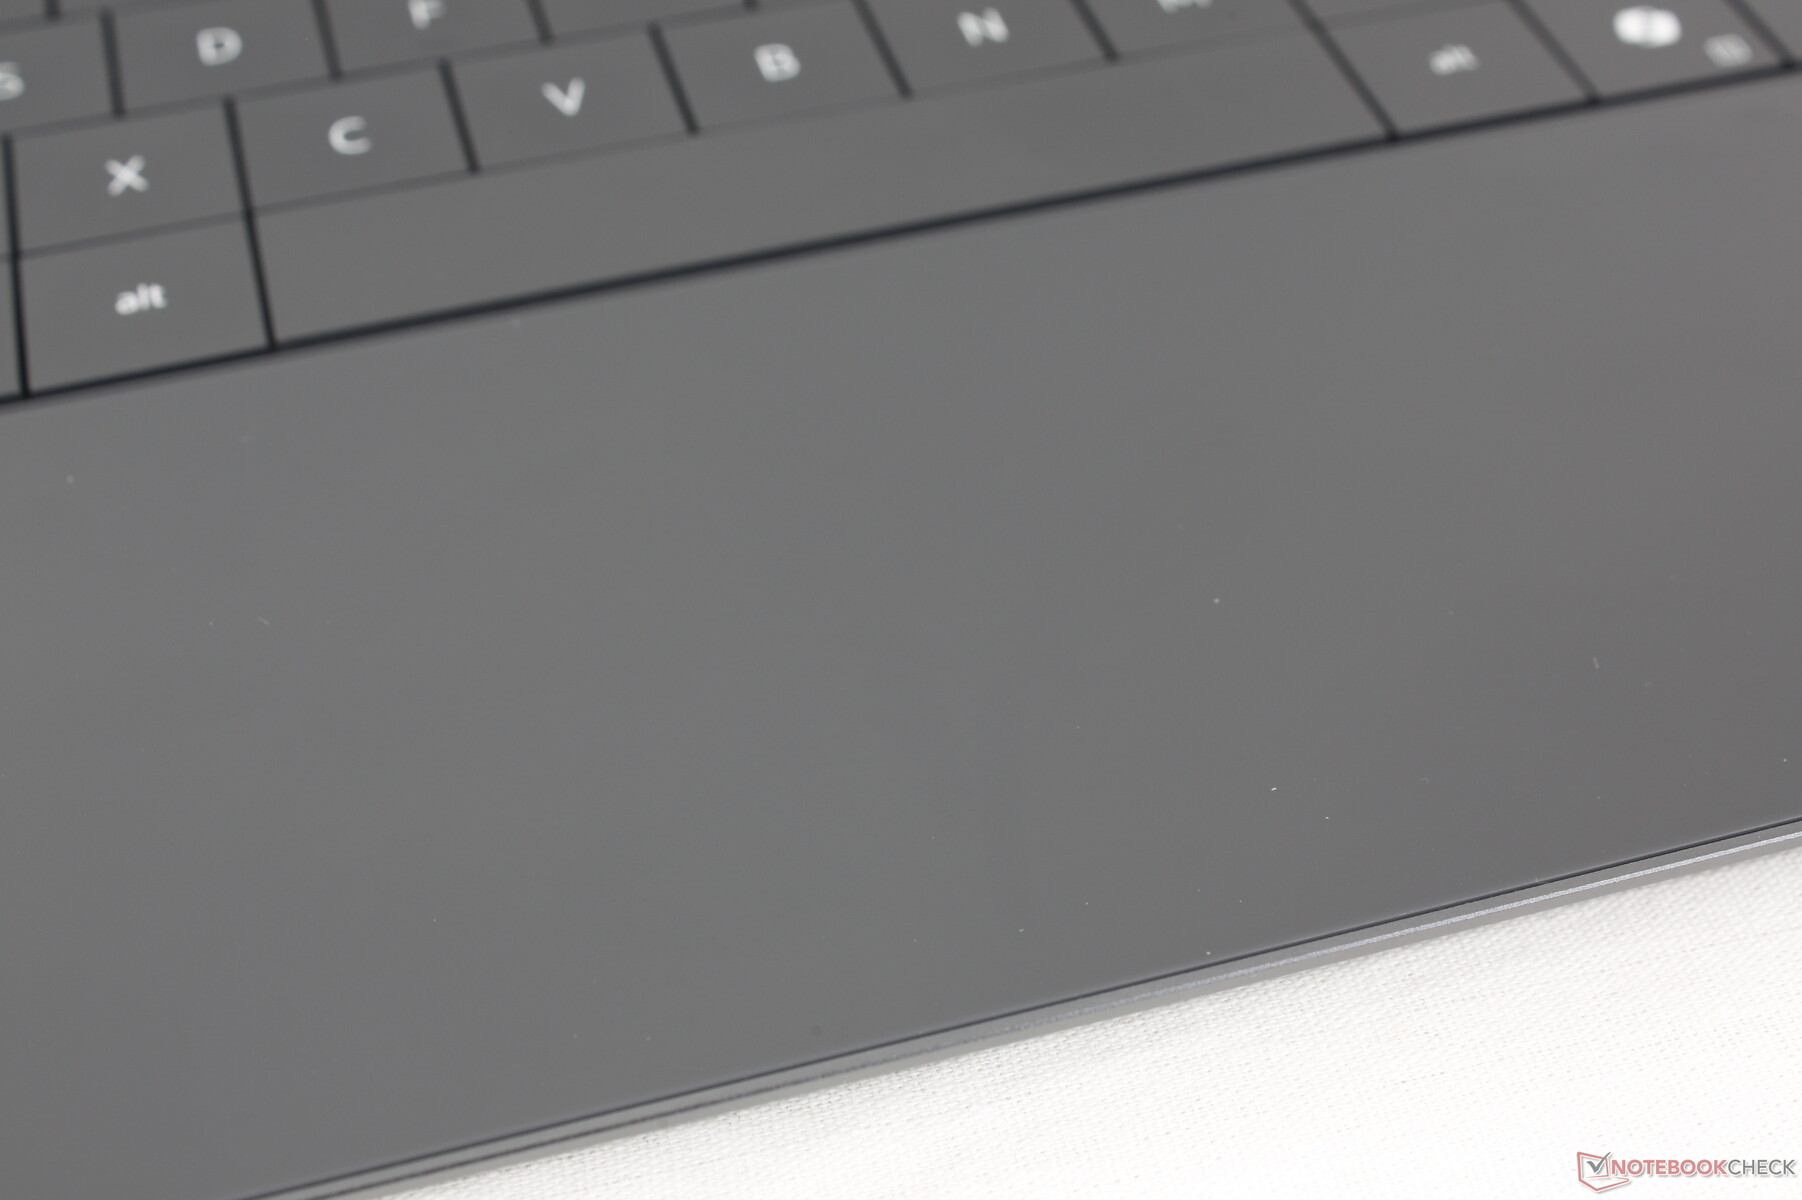
Touchpad
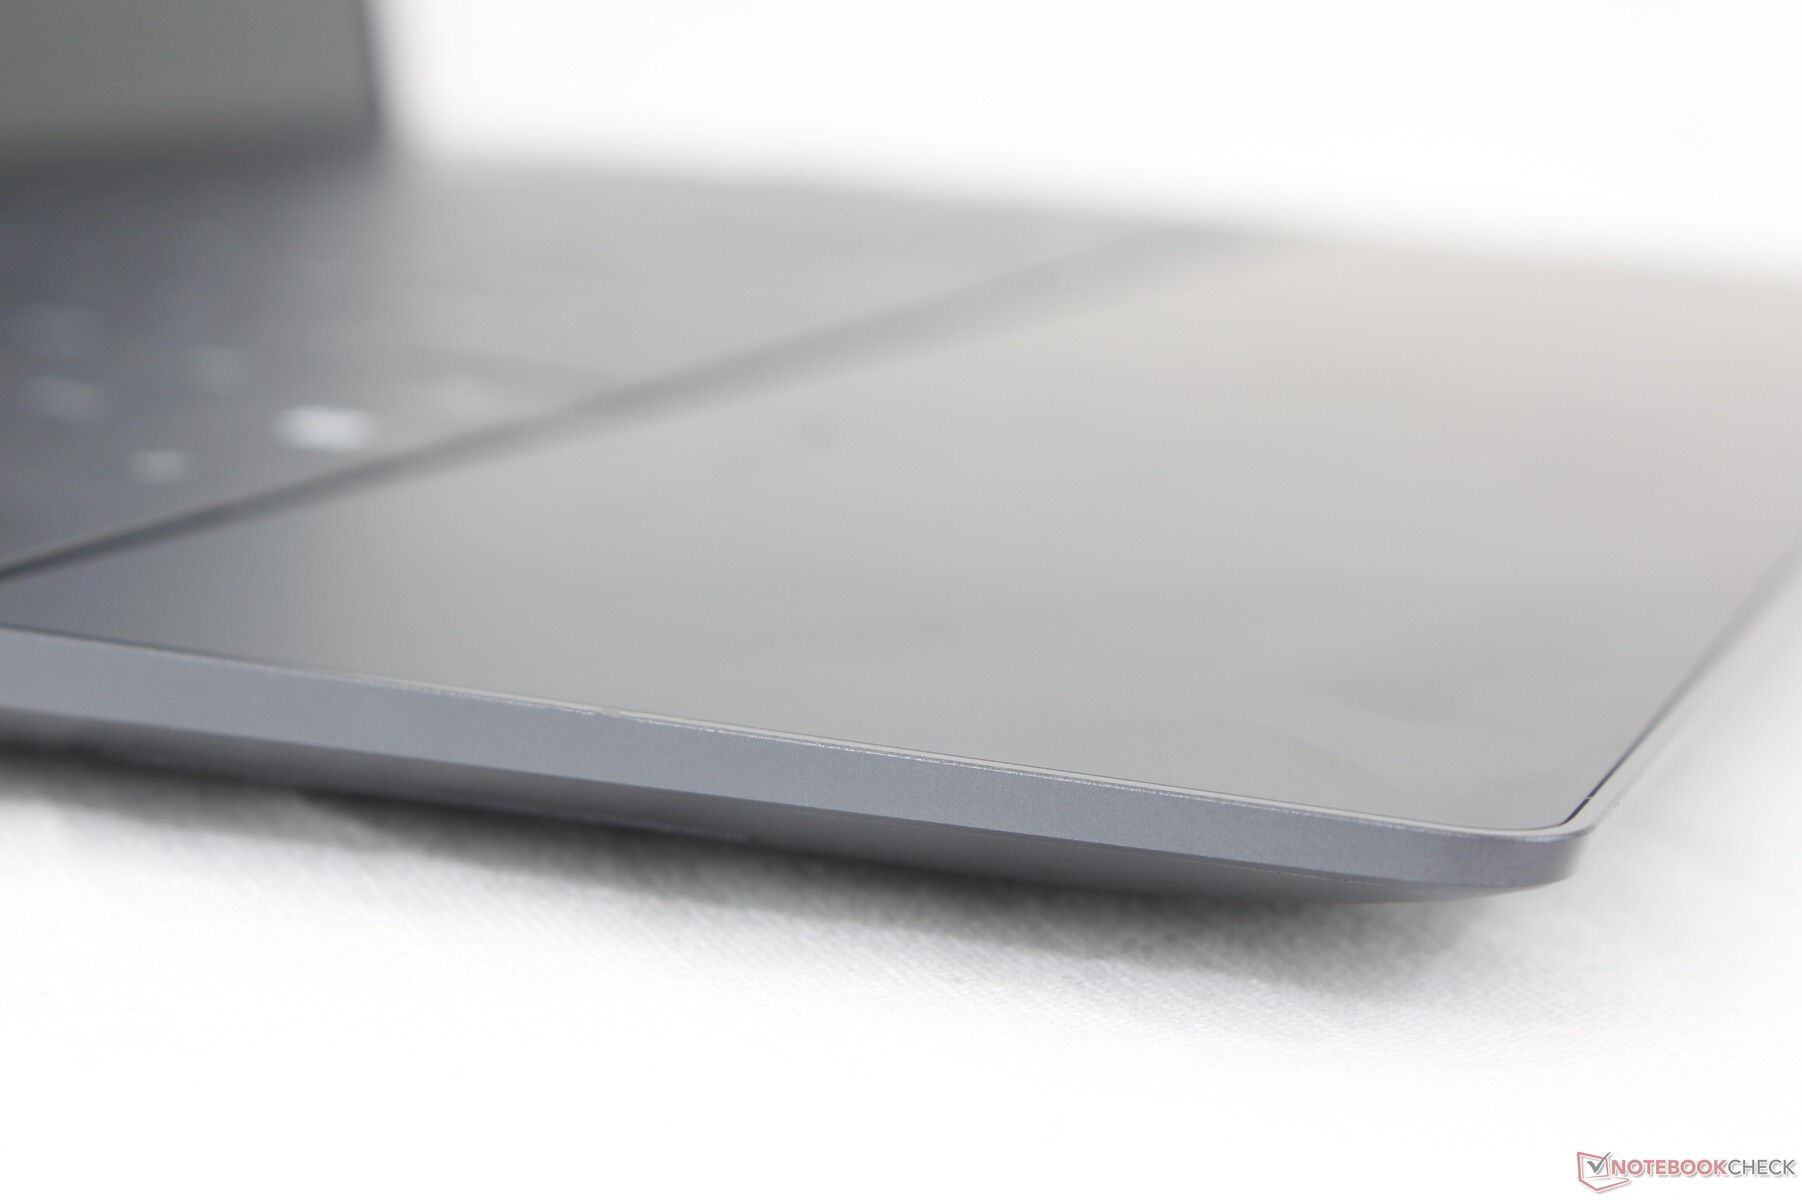
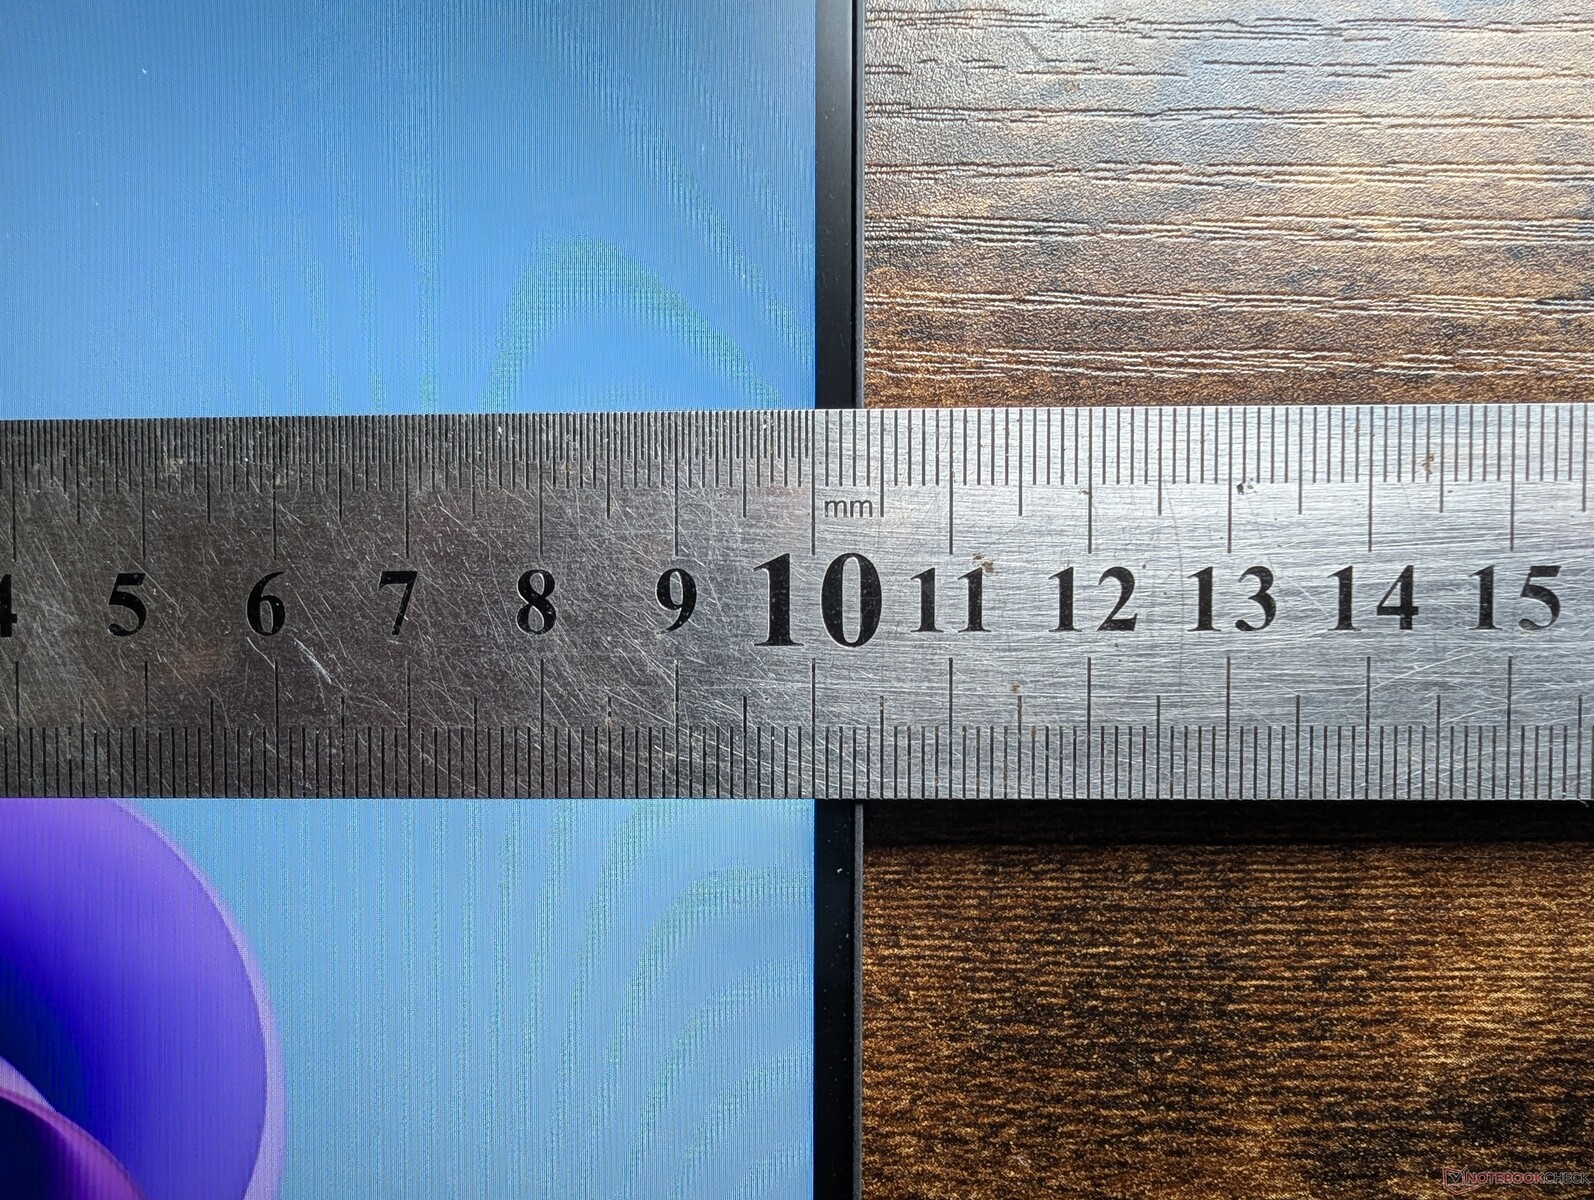
Het onzichtbare XPS clickpad is berucht geworden om zijn gebruikersonvriendelijkheid en deze trend zet zich voort op het Snapdragon-model. Hoewel het bruikbare oppervlak met ongeveer 11,5 x 7,5 cm vrij ruim is voor een 13-inch vormfactor, is klikken onbevredigend vanwege de zwakke feedback. Erger nog, de kracht die nodig is om een klik in te voeren is veel lager dan op de meeste andere laptops, wat leidt tot veel per ongeluk klikken en slepen wanneer u alleen maar de cursor probeert te verplaatsen. We hoopten op wat verbeteringen in dit opzicht na twee jaar met dit ontwerp, maar dat is helaas niet het geval.

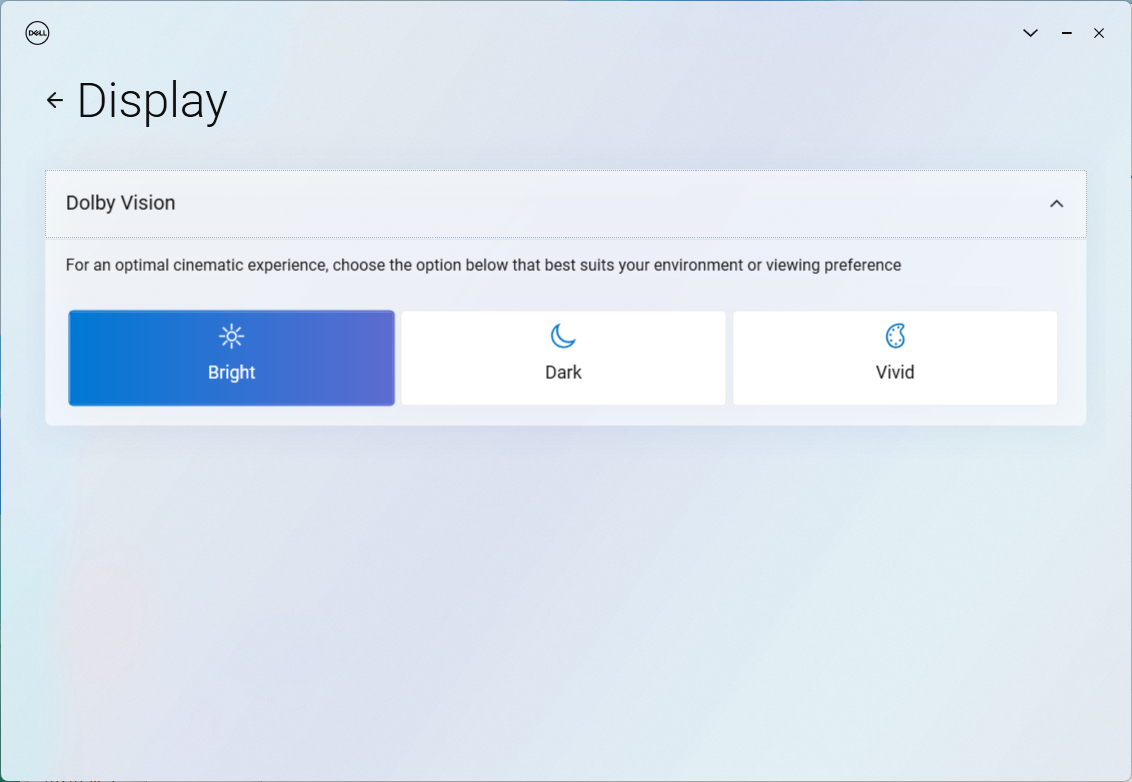
Weergave
Er zijn drie schermopties beschikbaar. Onze testconfiguratie wordt geleverd met de vetgedrukte optie.
- 1920 x 1200, IPS, 120 Hz, niet-touch, mat
- 2560 x 1600, IPS, 120 Hz, aanraakgevoelig, glanzend
- 2880 x 1800, OLED, 60 Hz, aanraakgevoelig, glanzend
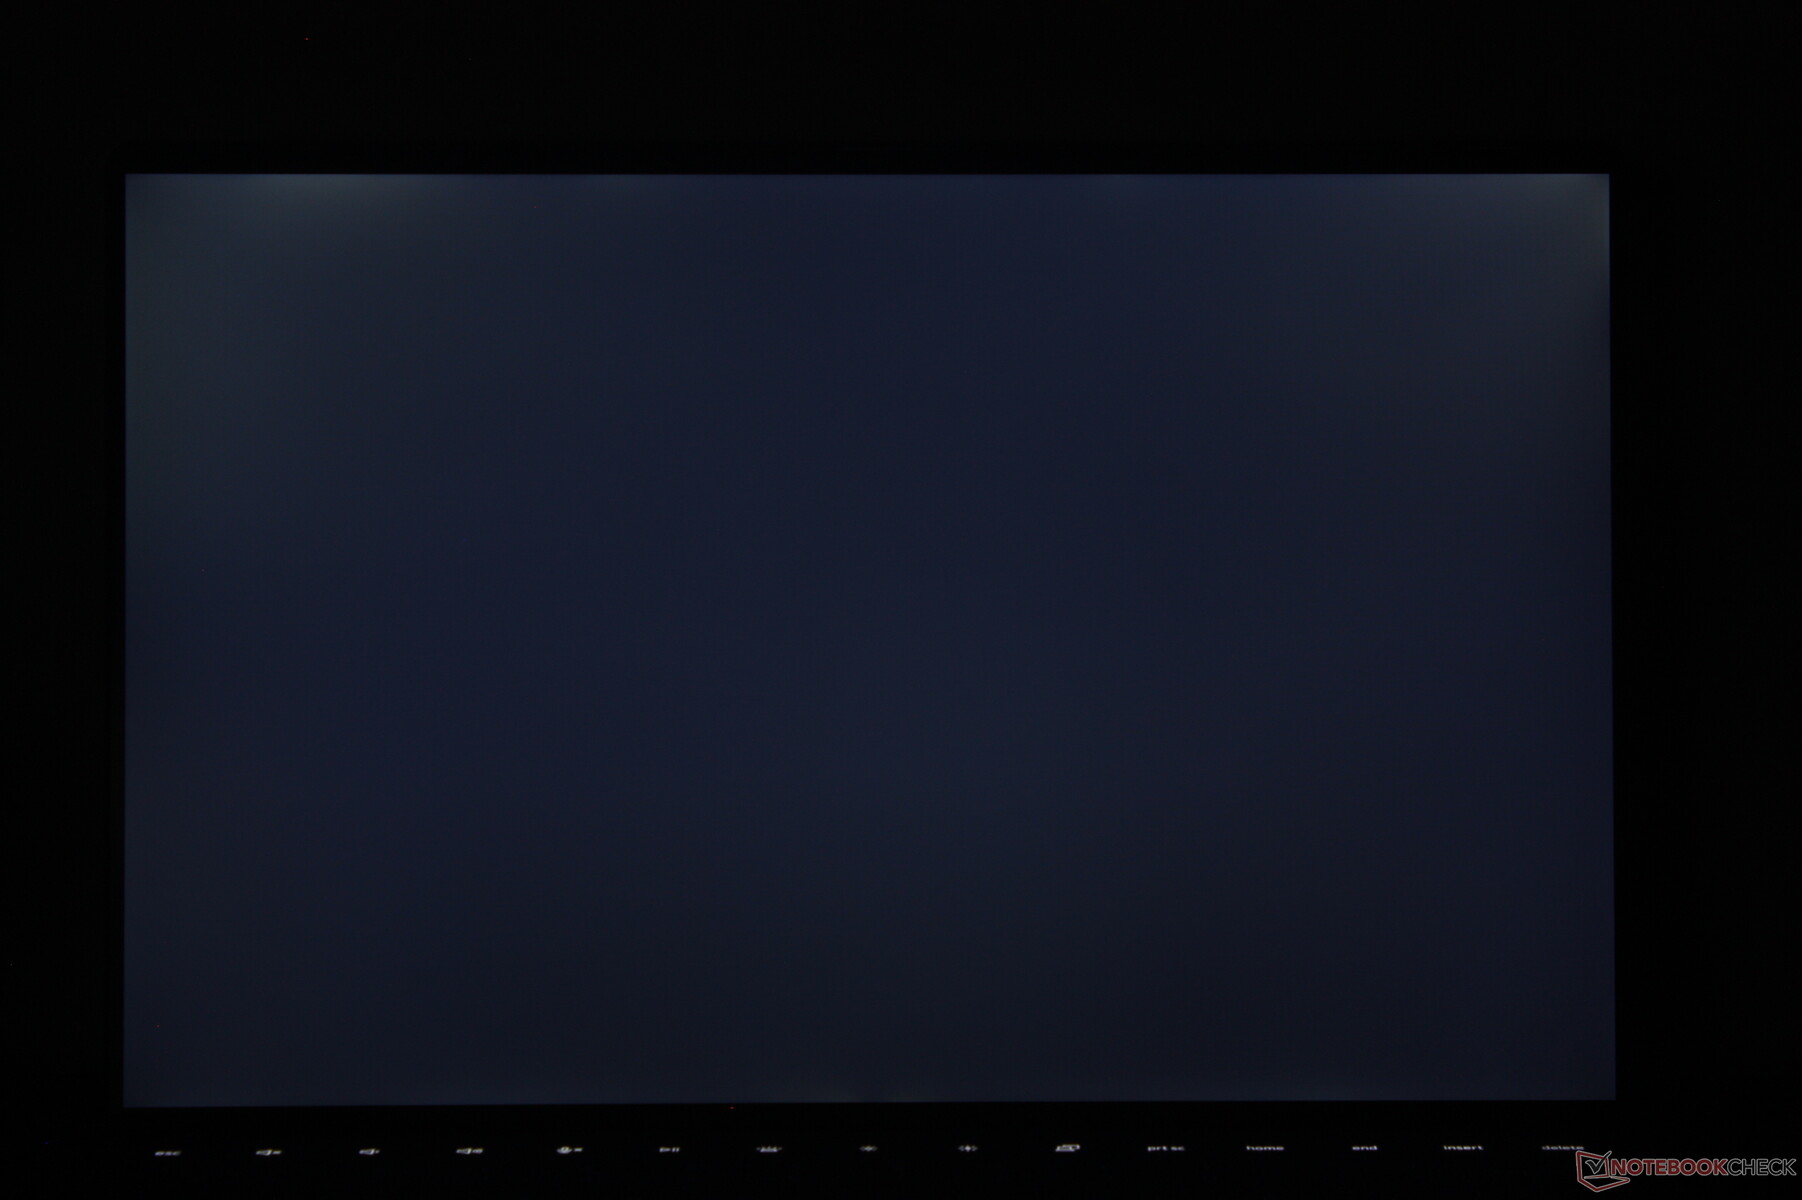
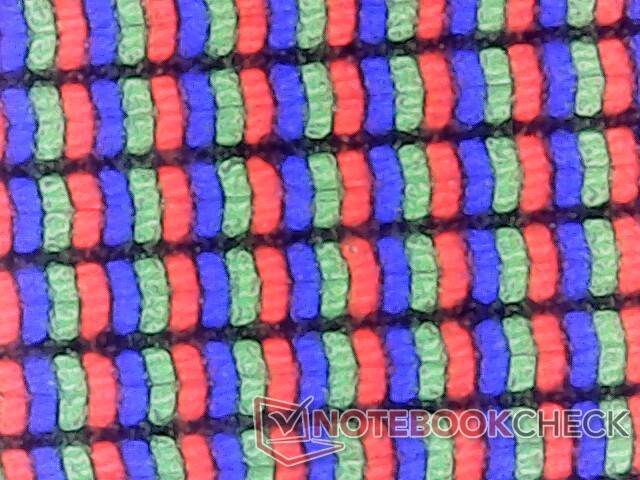
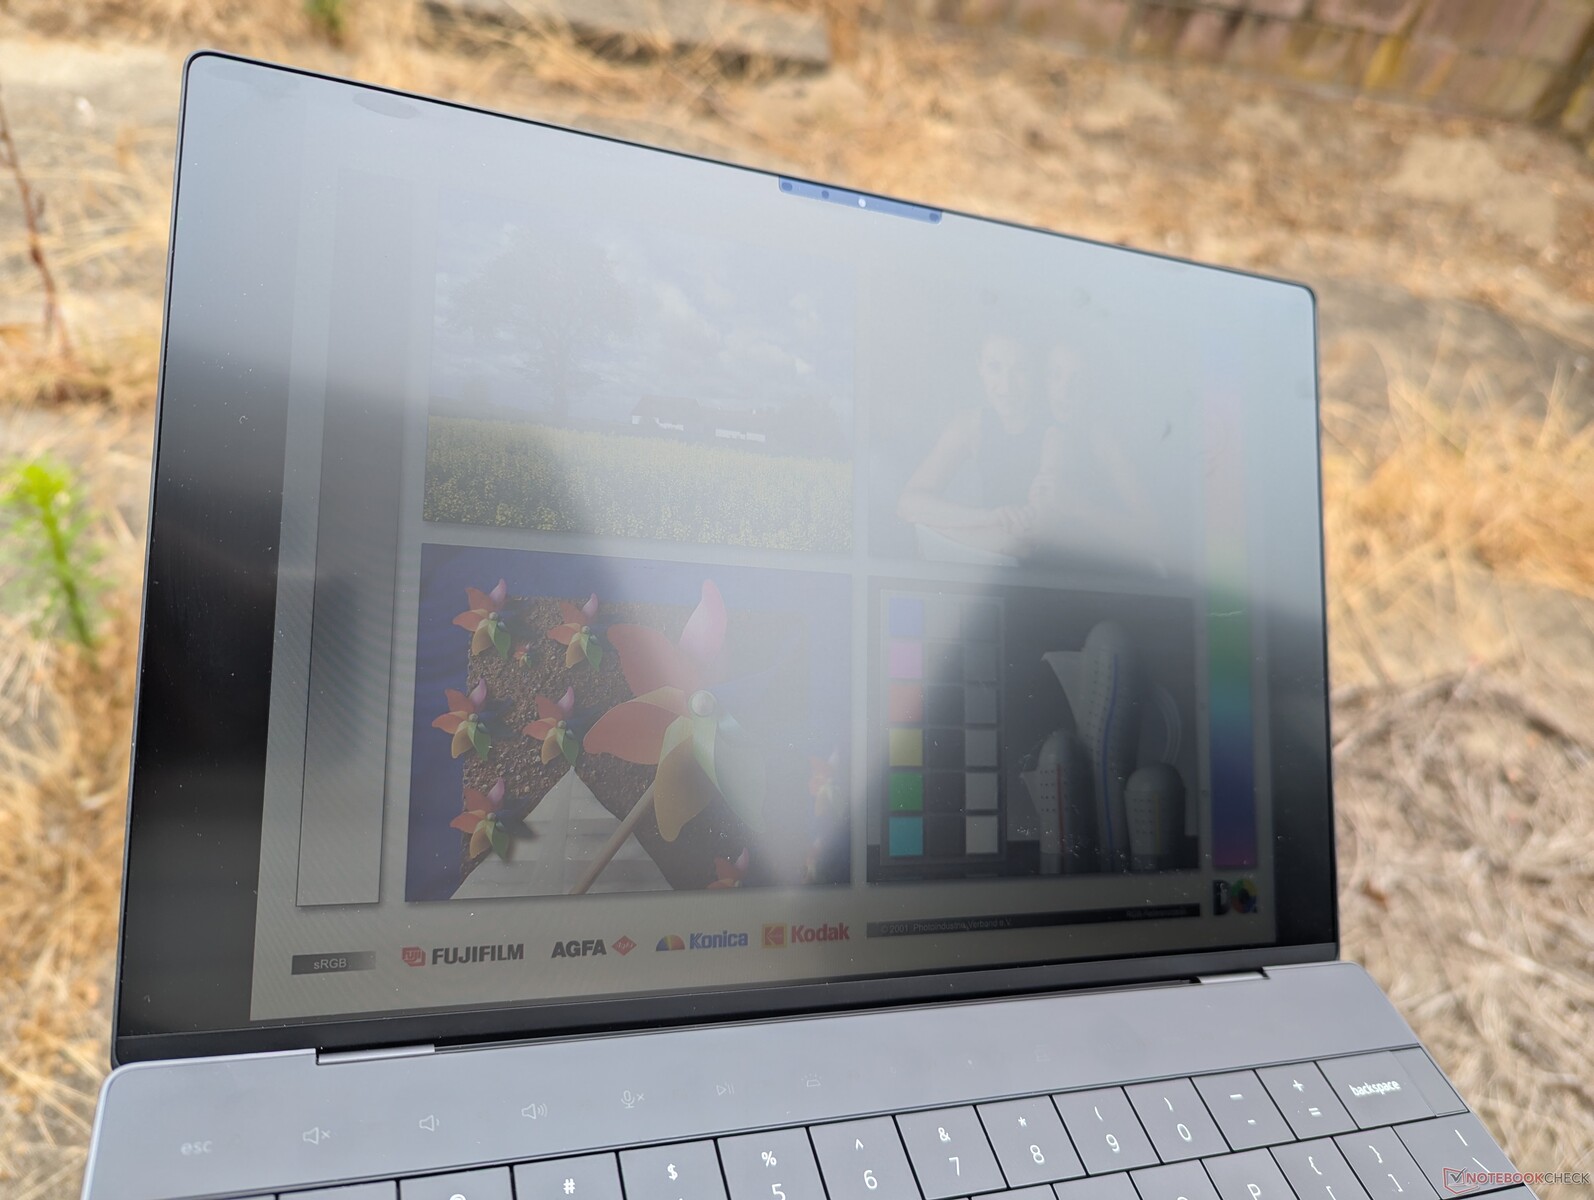
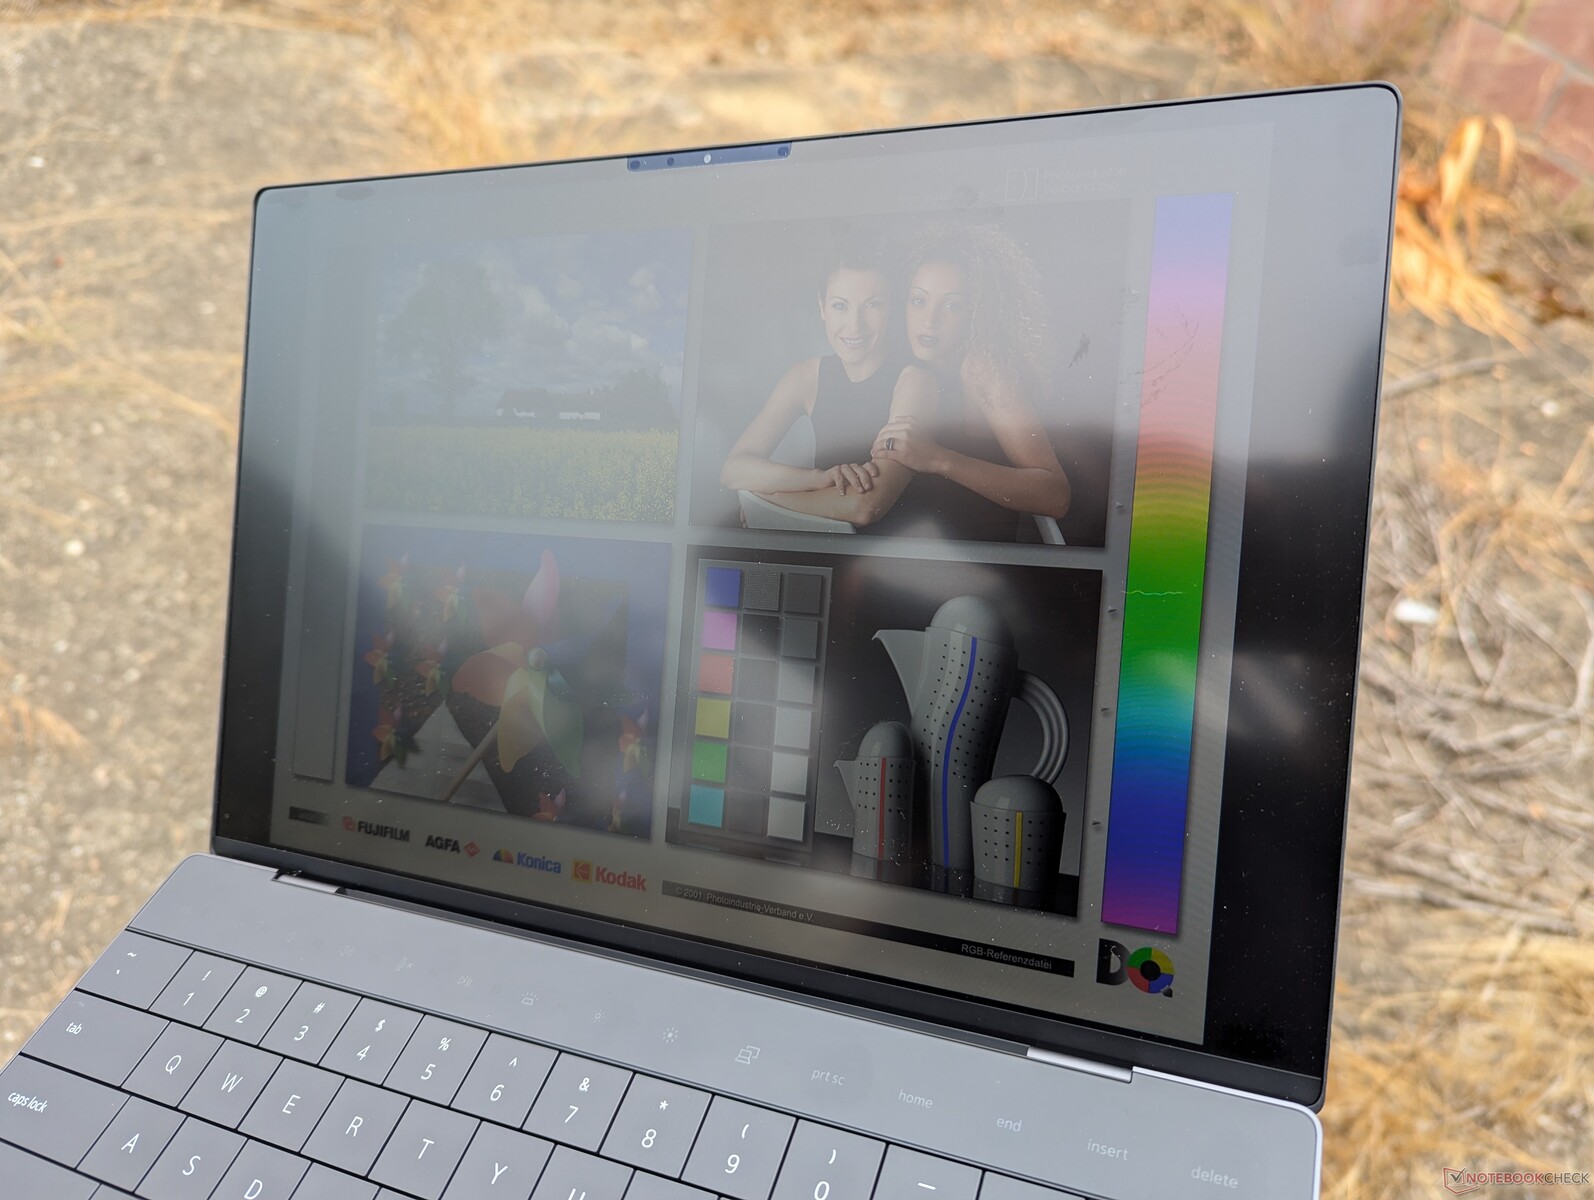
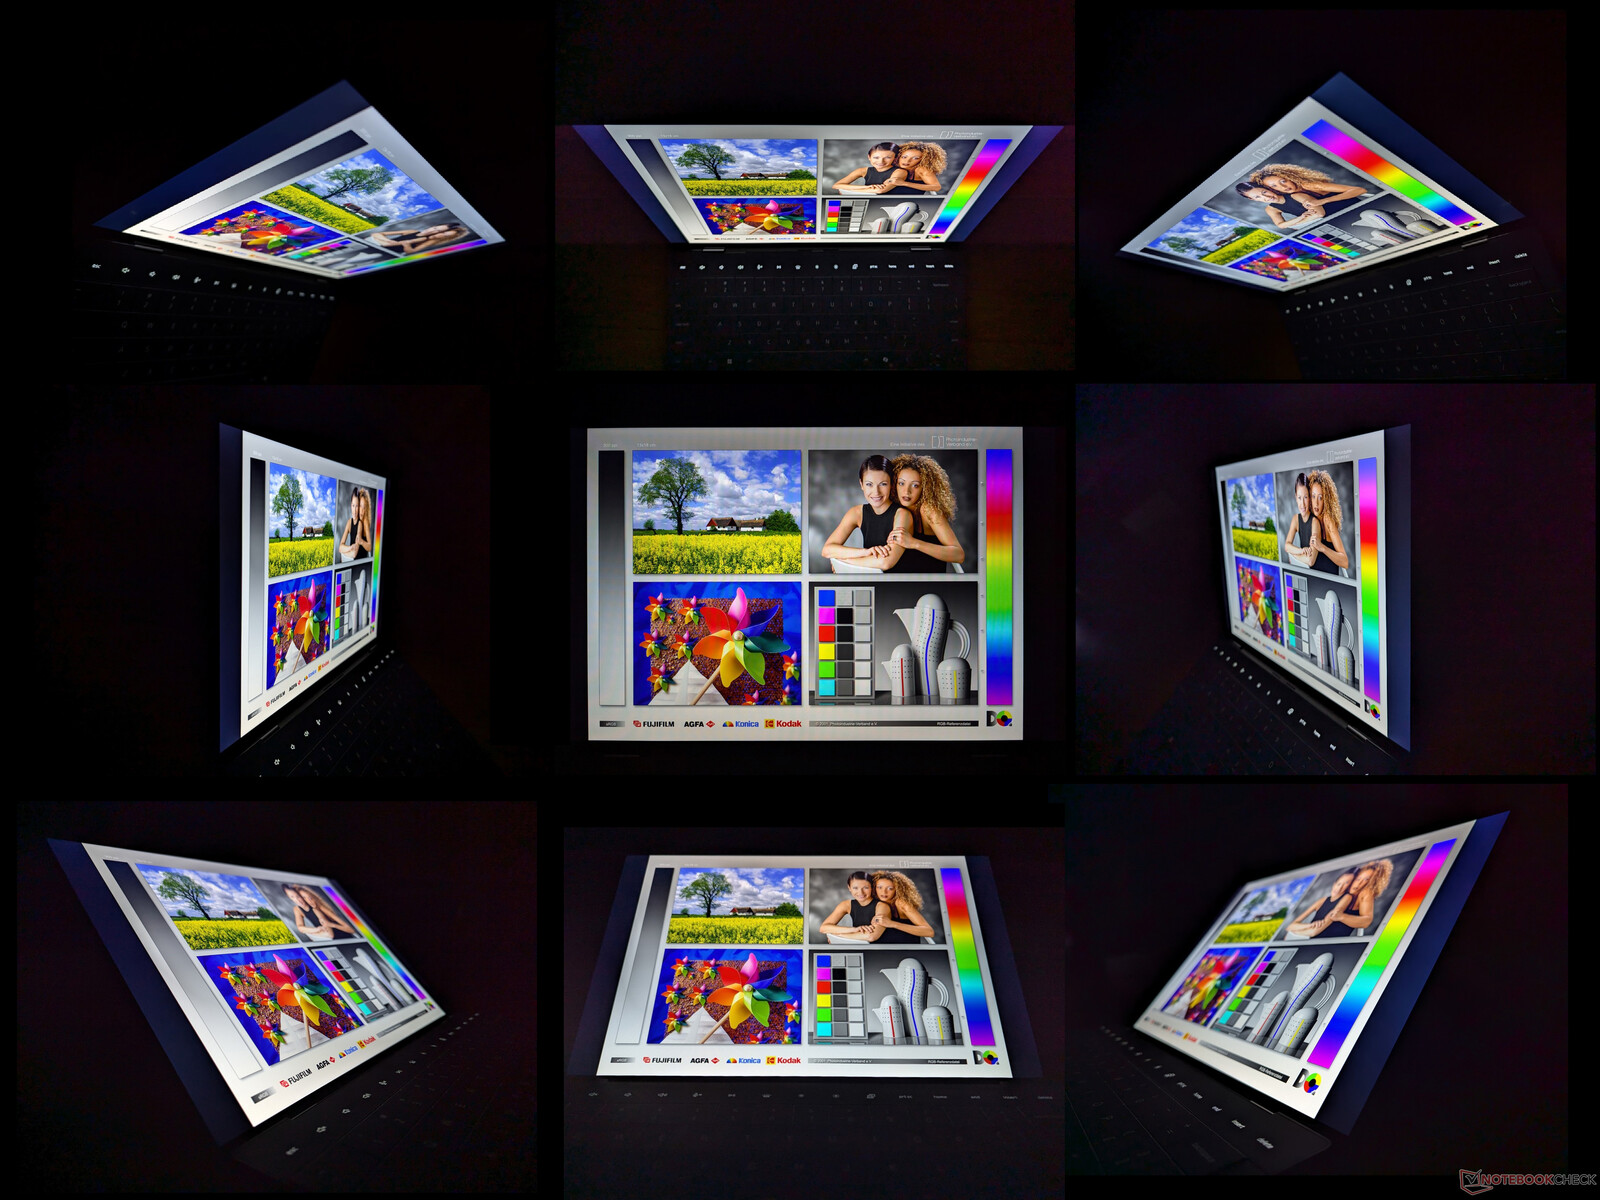
Alles wijst erop dat ons 120 Hz paneel precies hetzelfde paneel is dat gebruikt wordt voor de Intel-gebaseerde XPS 13. Alles, van VRR-ondersteuning tot 30 Hz, de adequate responstijden en de maximale helderheid van 500 nit, is vergelijkbaar met onze recente Core Ultra 7 XPS 13-testeenheid. Het meest opvallend is de hoge contrastverhouding van bijna 2000:1 vergeleken met 1000:1 op de meeste IPS-panelen van andere laptops. De beeldschermen op XPS-modellen behoren altijd al tot de beste in hun klasse, dus zelfs de goedkoopste IPS-optie ziet er nog steeds fantastisch uit.
Kleurdekking is beperkt tot >95% sRGB indien geconfigureerd met de basisoptie, terwijl DCI-P3 kleuren zijn gereserveerd voor de duurdere 1600p IPS en 1800p OLED panelen. Gebruikers kunnen Adaptive Color uitschakelen om minieme kleurveranderingen bij fotobewerking te voorkomen.
Iets dat het vermelden waard is aan dit paneel is het relatief hoge minimale helderheidsniveau van 49 nits, iets wat ons ook opviel bij ons Core i7-model. Ter vergelijking: de beeldschermen op de meeste andere laptops bereiken meestal 15 nits of minder bij de minimale helderheidsinstelling. De hogere helderheidsdrempel van de Dell kan eerder vermoeide ogen veroorzaken als u in een donkere omgeving kijkt. Dit potentiële probleem doet zich niet voor bij de OLED-configuratie, die veel lagere helderheidsniveaus kan bereiken.
| |||||||||||||||||||||||||
Helderheidsverdeling: 86 %
Helderheid in Batterij-modus: 518.3 cd/m²
Contrast: 1993:1 (Zwart: 0.26 cd/m²)
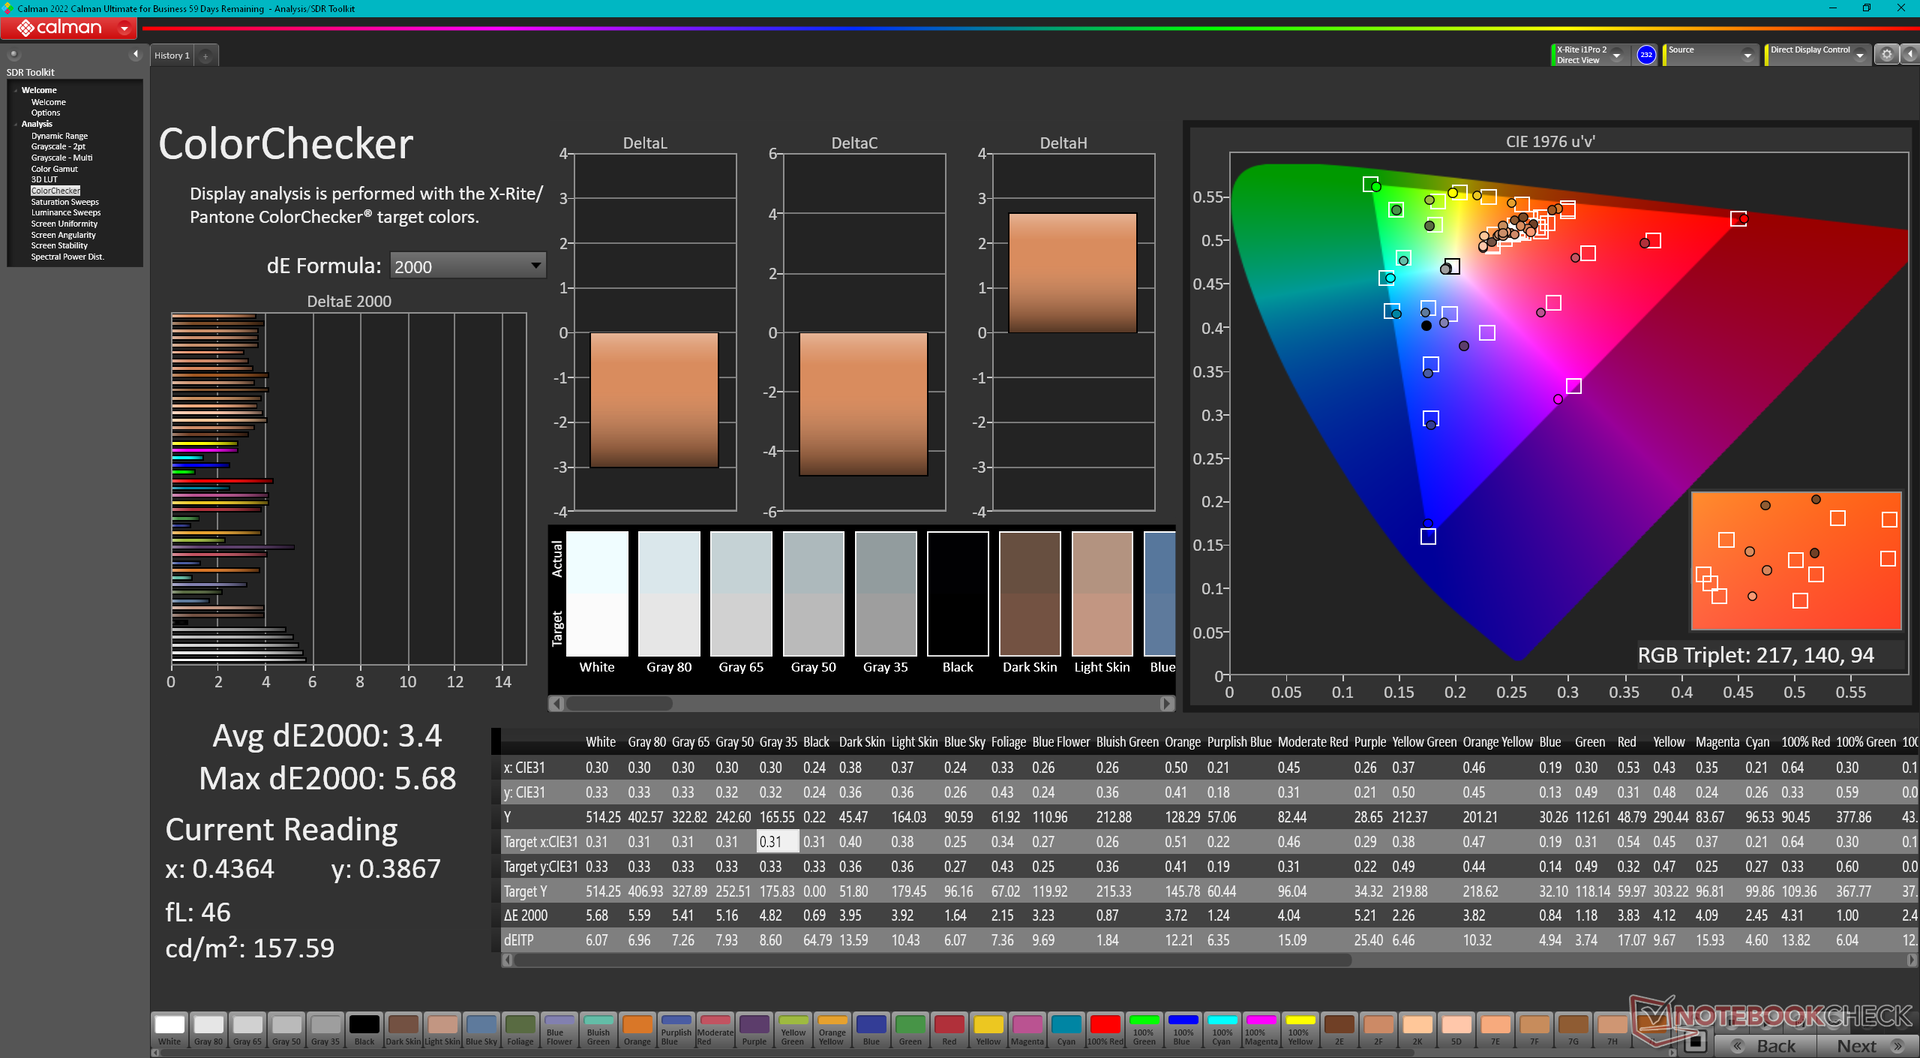
ΔE ColorChecker Calman: 3.4 | ∀{0.5-29.43 Ø4.73}
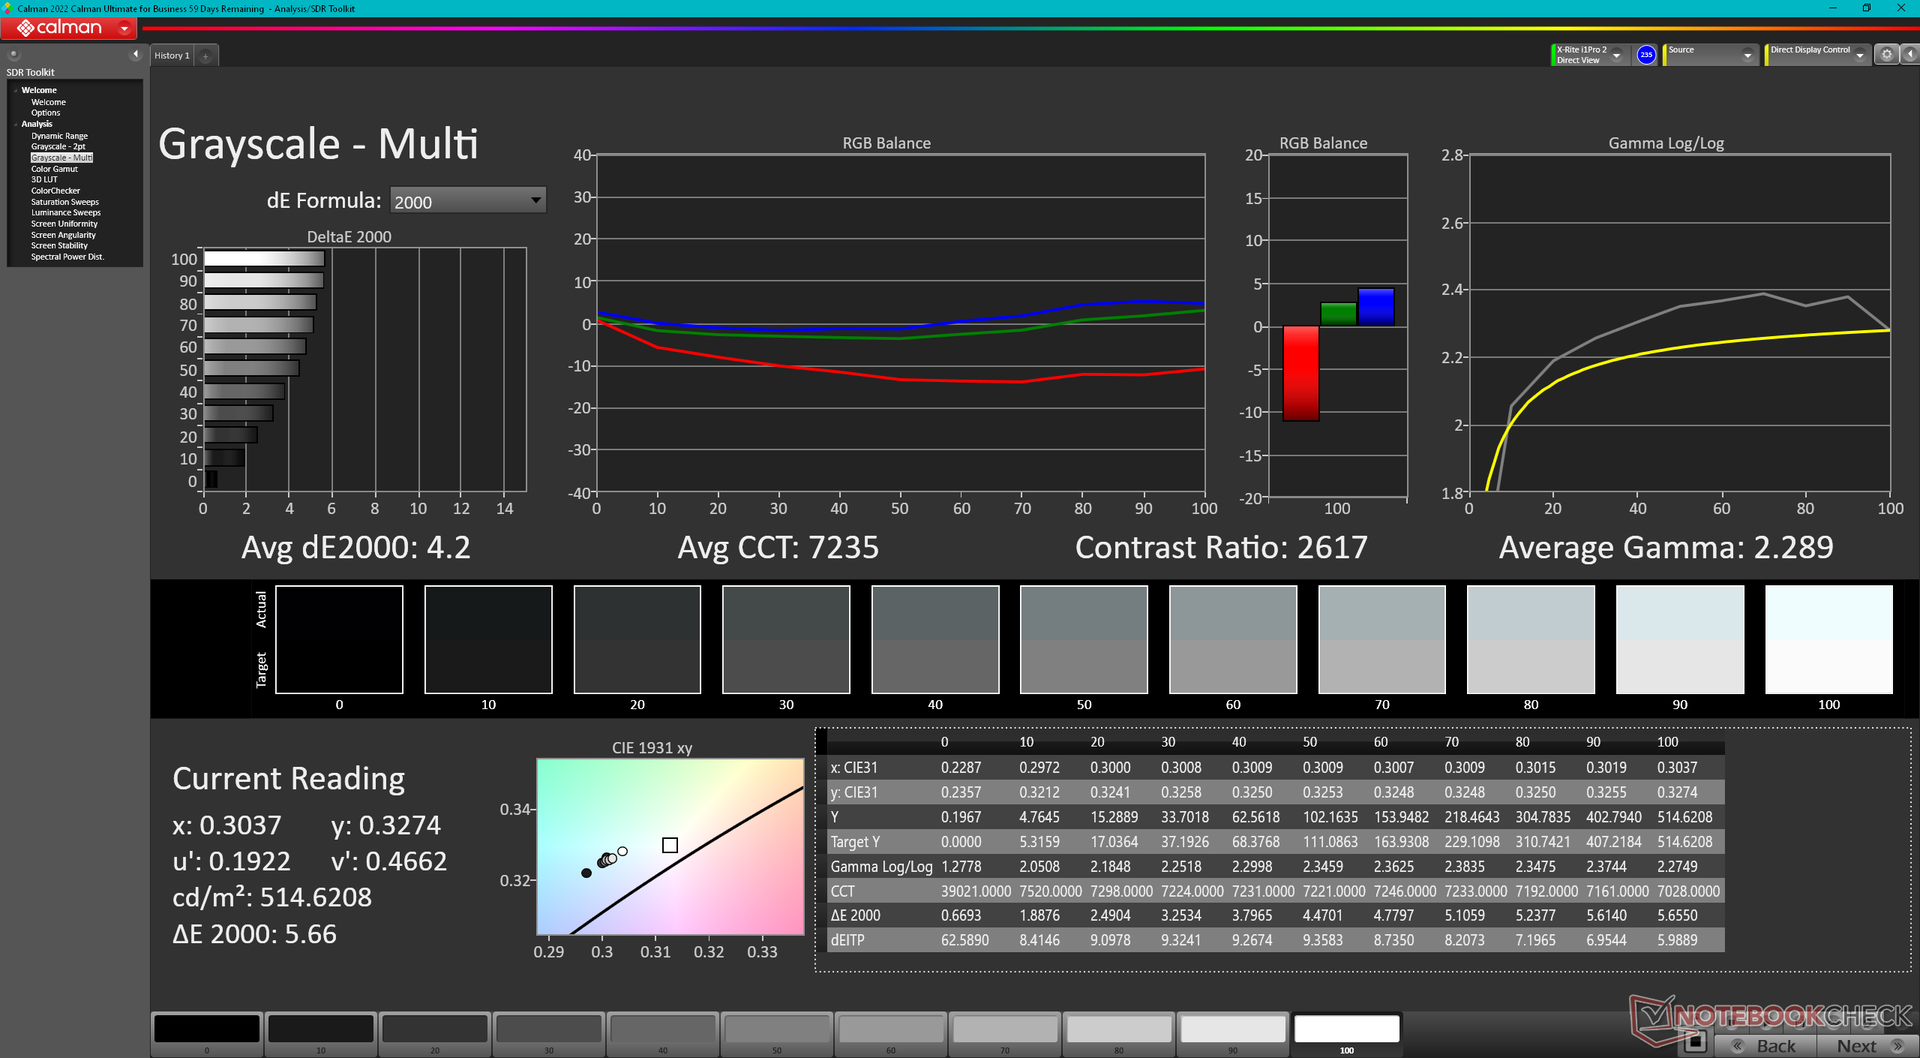
ΔE Greyscale Calman: 4.2 | ∀{0.09-98 Ø4.97}
71.7% AdobeRGB 1998 (Argyll 3D)
97.8% sRGB (Argyll 3D)
69.4% Display P3 (Argyll 3D)
Gamma: 2.29
CCT: 7235 K
| Dell XPS 13 9345 IPS, 1920x1200, 13.4", 120 Hz | Dell XPS 13 9340 Core Ultra 7 SHP1593, IPS, 1920x1200, 13.4", 120 Hz | Microsoft Surface Laptop 7 13.8 Copilot+ LQ138P1JX61, IPS, 2304x1536, 13.8", 120 Hz | Lenovo ThinkBook 13x G4 21KR0008GE LEN135WQ+, IPS, 2880x1920, 13.5", 120 Hz | HP EliteBook Ultra G1q 14 IPS, 2240x1400, 14", 60 Hz | Asus ZenBook S13 OLED UX5304 SDC417B, OLED, 2880x1800, 13.3", 60 Hz | |
|---|---|---|---|---|---|---|
| Display | 0% | 21% | -4% | 27% | ||
| Display P3 Coverage (%) | 69.4 | 69.4 0% | 97.8 41% | 65.5 -6% | 99.7 44% | |
| sRGB Coverage (%) | 97.8 | 97.8 0% | 98.2 0% | 97.3 -1% | 100 2% | |
| AdobeRGB 1998 Coverage (%) | 71.7 | 71.7 0% | 87.3 22% | 67.7 -6% | 96.9 35% | |
| Response Times | -25% | 5% | 32% | 27% | 94% | |
| Response Time Grey 50% / Grey 80% * (ms) | 35.2 ? | 43.2 ? -23% | 38.9 ? -11% | 27.3 ? 22% | 22.8 ? 35% | 2 ? 94% |
| Response Time Black / White * (ms) | 21.8 ? | 27.6 ? -27% | 17.4 ? 20% | 12.8 ? 41% | 17.9 ? 18% | 1.6 ? 93% |
| PWM Frequency (Hz) | 240 ? | |||||
| Screen | -6% | 16% | 10% | -58% | 27% | |
| Brightness middle (cd/m²) | 518.3 | 429 -17% | 606 17% | 539 4% | 341.4 -34% | 361 -30% |
| Brightness (cd/m²) | 487 | 407 -16% | 592 22% | 513 5% | 315 -35% | 365 -25% |
| Brightness Distribution (%) | 86 | 90 5% | 94 9% | 89 3% | 87 1% | 98 14% |
| Black Level * (cd/m²) | 0.26 | 0.28 -8% | 0.43 -65% | 0.38 -46% | 0.39 -50% | |
| Contrast (:1) | 1993 | 1532 -23% | 1409 -29% | 1418 -29% | 875 -56% | |
| Colorchecker dE 2000 * | 3.4 | 2.6 24% | 1.3 62% | 1.4 59% | 5.63 -66% | 1.2 65% |
| Colorchecker dE 2000 max. * | 5.68 | 6.6 -16% | 2.1 63% | 3.5 38% | 11.94 -110% | 1.9 67% |
| Greyscale dE 2000 * | 4.2 | 4 5% | 2.1 50% | 2.2 48% | 8.8 -110% | 1.2 71% |
| Gamma | 2.29 96% | 2.23 99% | 2.16 102% | 2.19 100% | 2.14 103% | 2.27 97% |
| CCT | 7235 90% | 7332 89% | 6842 95% | 6710 97% | 6034 108% | 6486 100% |
| Colorchecker dE 2000 calibrated * | 1.4 | 0.7 | ||||
| Totaal Gemiddelde (Programma / Instellingen) | -10% /
-7% | 14% /
15% | 13% /
10% | -16% /
-41% | 49% /
39% |
* ... kleiner is beter
Onze X-Rite colorimeter laat zien dat het beeldscherm zich richt op sRGB met fatsoenlijke gemiddelde grijswaarden en kleurdeltaE-waarden van respectievelijk 4,2 en 3,4. De kleurtemperatuur is echter iets te koel bij 7235, waardoor de kleurnauwkeurigheid bij lagere verzadigingsniveaus wordt verstoord. De kleurtemperatuur is echter iets te koel bij 7235, wat de kleurnauwkeurigheid bij lagere verzadigingsniveaus verstoort. Het is jammer dat Dell het paneel niet in de fabriek kalibreert, aangezien de meeste kalibratiesoftware nog niet compatibel is met ARM, waaronder i1Profiler.

Responstijd Scherm
| ↔ Responstijd Zwart naar Wit | ||
|---|---|---|
| 21.8 ms ... stijging ↗ en daling ↘ gecombineerd | ↗ 10.5 ms stijging | 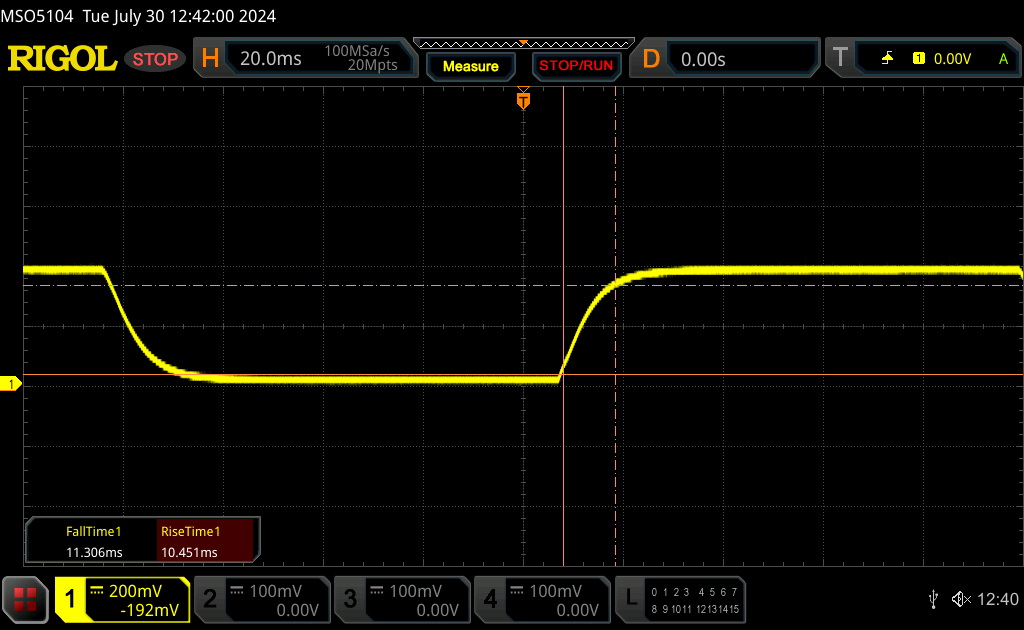 |
| ↘ 11.3 ms daling | ||
| Het scherm vertoonde prima responstijden in onze tests maar is misschien wat te traag voor competitieve games. Ter vergelijking: alle testtoestellen variëren van 0.1 (minimum) tot 240 (maximum) ms. » 48 % van alle toestellen zijn beter. Dit betekent dat de gemeten responstijd vergelijkbaar is met het gemiddelde (19.9 ms) van alle geteste toestellen. | ||
| ↔ Responstijd 50% Grijs naar 80% Grijs | ||
| 35.2 ms ... stijging ↗ en daling ↘ gecombineerd | ↗ 15.2 ms stijging | 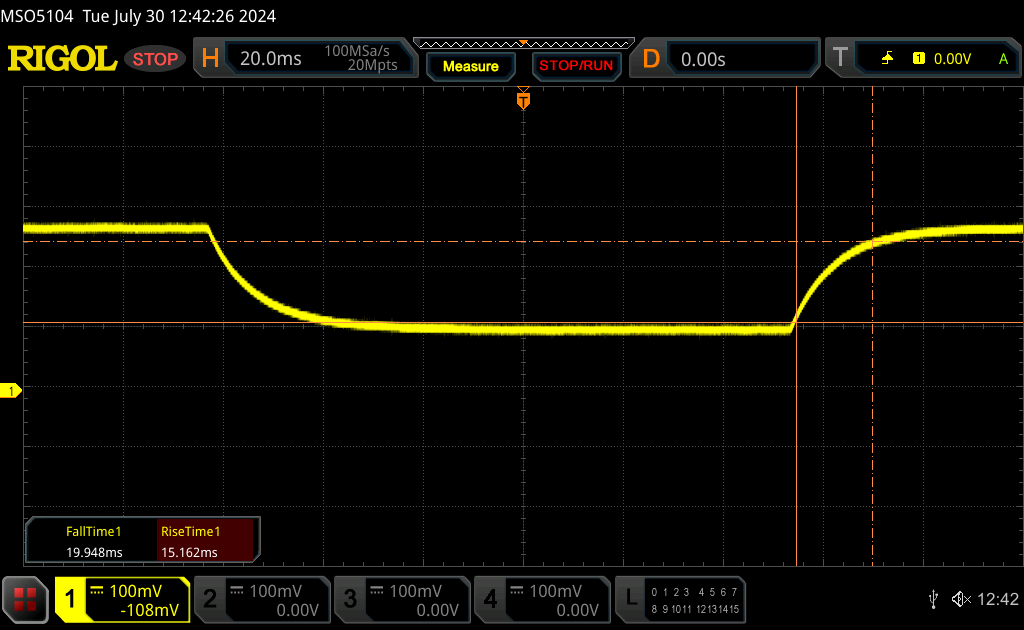 |
| ↘ 20 ms daling | ||
| Het scherm vertoonde trage responstijden in onze tests en is misschien te traag voor games. Ter vergelijking: alle testtoestellen variëren van 0.165 (minimum) tot 636 (maximum) ms. » 49 % van alle toestellen zijn beter. Dit betekent dat de gemeten responstijd slechter is dan het gemiddelde (31.1 ms) van alle geteste toestellen. | ||
Screen Flickering / PWM (Pulse-Width Modulation)
| Screen flickering / PWM niet waargenomen | 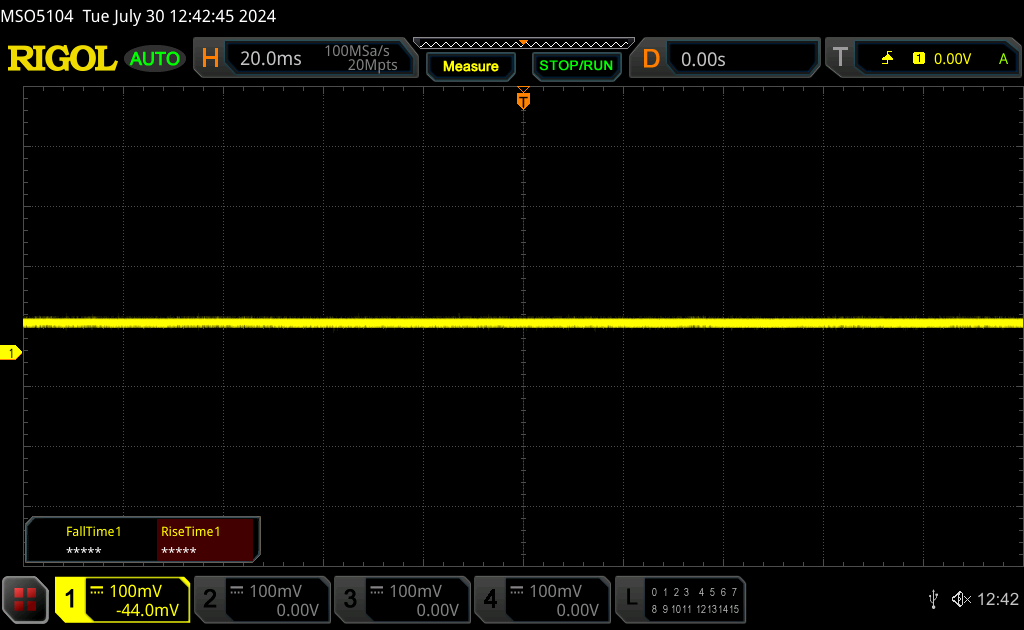 | ||
Ter vergelijking: 52 % van alle geteste toestellen maakten geen gebruik van PWM om de schermhelderheid te verlagen. Als het wel werd gebruikt, werd een gemiddelde van 7798 (minimum: 5 - maximum: 343500) Hz waargenomen. | |||

Prestaties
Testomstandigheden
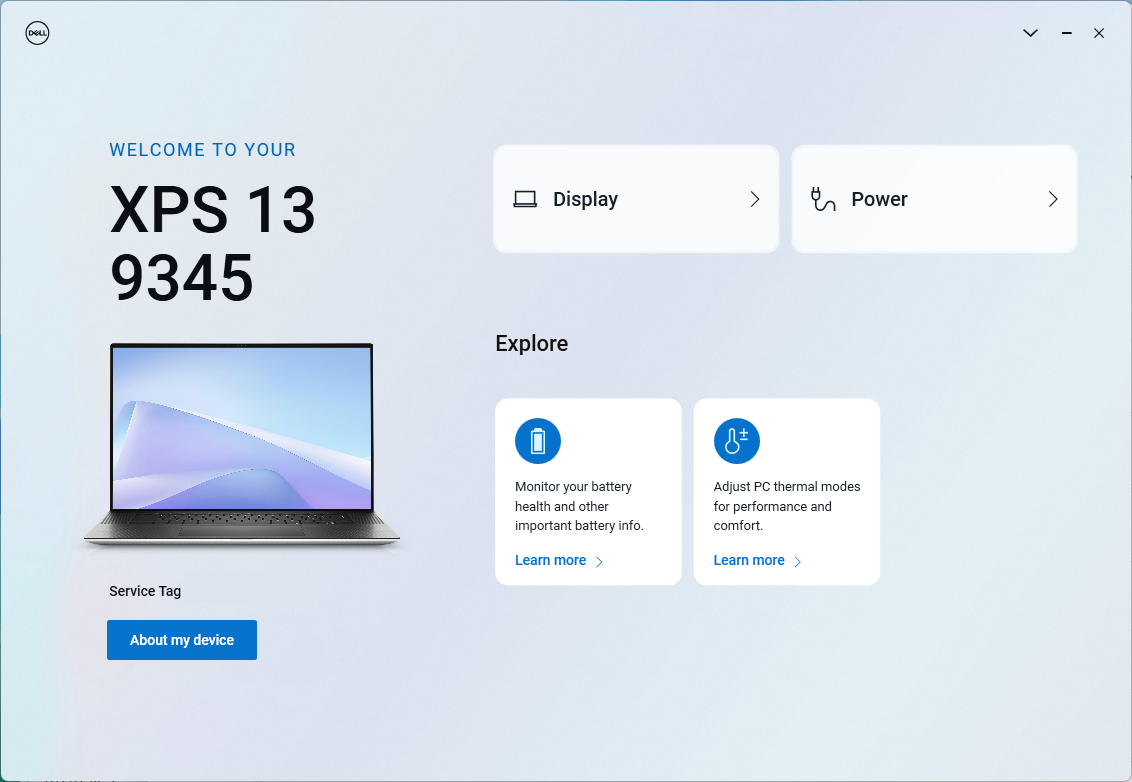
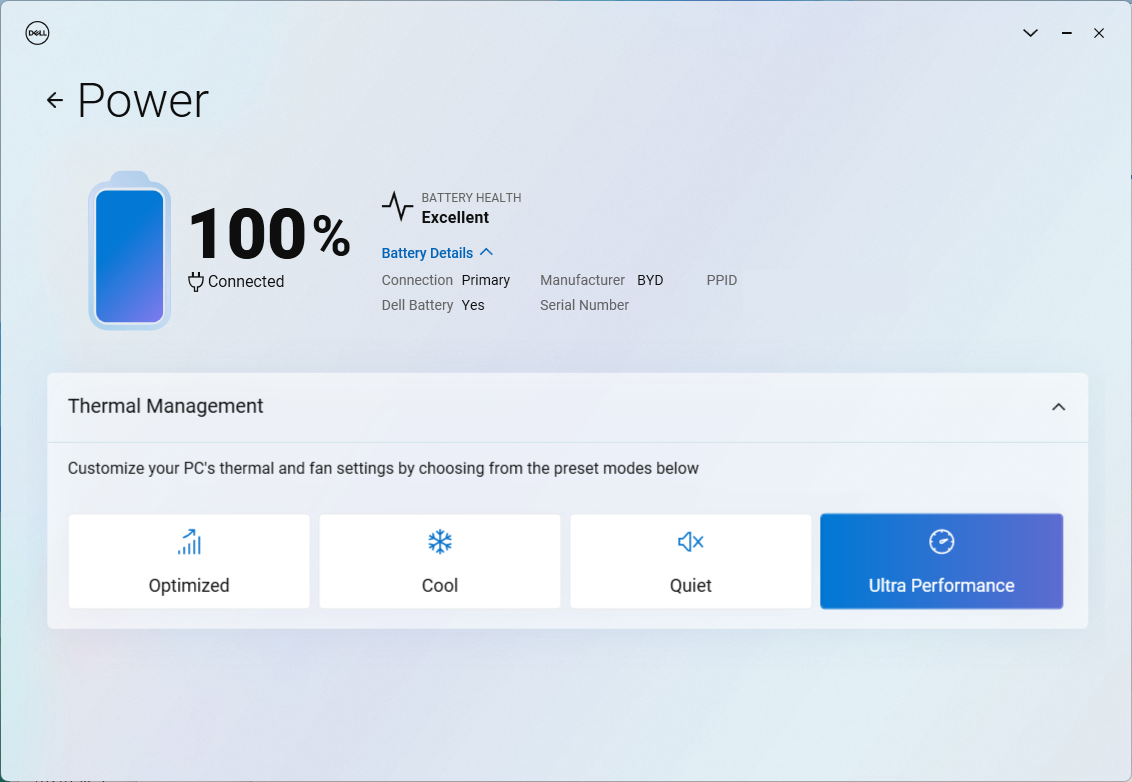
We hebben Windows en MyDell in de modus Prestaties gezet voordat we de onderstaande benchmarks uitvoerden. MyDell is opnieuw ontworpen op het Snapdragon-model om eenvoudiger in gebruik te zijn in vergelijking met dezelfde software op de Intel-gebaseerde XPS 13. Bepaalde functies die voorheen in de software te vinden waren, zoals aanwezigheidsdetectie, zijn verplaatst naar het menu Energie en Batterij van Windows. Bepaalde functies die voorheen in de software te vinden waren, zoals aanwezigheidsdetectie, zijn verplaatst naar het menu Energie en batterij van Windows.
Processor
De prestaties hangen sterk af van het feit of de toepassing native of geëmuleerd is. De processor blinkt bijvoorbeeld uit in CineBench 2024 en GeekBench 6 omdat beide geoptimaliseerd zijn voor een ARM-omgeving. Onze Snapdragon X Elite X1E-80-100 zou beter presteren dan de Core Ultra 7 155H in zowel multi-thread als single-thread bewerkingen onder dergelijke omstandigheden. Anders trekken geëmuleerde benchmarks onze Snapdragon CPU terug naar prestatieniveaus die meer op één lijn liggen met die van de oudere Core i5-1240P of Core i7-1260P. Met andere woorden, de Qualcomm CPU kan concurrerend zijn ten opzichte van de Core Ultra 7 155H, zoals de fabrikant graag beweert, maar de omstandigheden en toepassingen moeten precies goed zijn om deze voordelen tot uiting te laten komen.
Prestatieconsistentie kan ook moeilijk te meten zijn tussen Snapdragon CPU's. In ons voorbeeld zou onze Snapdragon X Elite X1E-80-100 ruimschoots beter presteren dan de Snapdragon X Elite X1E-78-100 in de EliteBook Ultra G1q 14 in CineBench 2024, maar het tegenovergestelde is waar in CineBench R23 en R15.
Cinebench R15 Multi Loop
Cinebench 2024: CPU Multi Core | CPU Single Core
Cinebench R23: Multi Core | Single Core
Cinebench R20: CPU (Multi Core) | CPU (Single Core)
Cinebench R15: CPU Multi 64Bit | CPU Single 64Bit
Blender: v2.79 BMW27 CPU
7-Zip 18.03: 7z b 4 | 7z b 4 -mmt1
Geekbench 6.7: Multi-Core | Single-Core
HWBOT x265 Benchmark v2.2: 4k Preset
LibreOffice : 20 Documents To PDF
R Benchmark 2.5: Overall mean
| Cinebench 2024 / CPU Multi Core | |
| Dell XPS 13 9345 | |
| Microsoft Surface Laptop 7 13.8 Copilot+ | |
| Gemiddeld Qualcomm Snapdragon X Elite X1E-80-100 (621 - 927, n=7) | |
| Medion SPRCHRGD 14 S1 Elite | |
| HP EliteBook Ultra G1q 14 | |
| Lenovo ThinkPad T14s Gen 6 21N10007GE | |
| Dell XPS 13 9340 Core Ultra 7 | |
| Dell XPS 14 2024 OLED | |
| Cinebench 2024 / CPU Single Core | |
| Microsoft Surface Laptop 7 13.8 Copilot+ | |
| Gemiddeld Qualcomm Snapdragon X Elite X1E-80-100 (122 - 123, n=7) | |
| Dell XPS 13 9345 | |
| Lenovo ThinkPad T14s Gen 6 21N10007GE | |
| Medion SPRCHRGD 14 S1 Elite | |
| HP EliteBook Ultra G1q 14 | |
| Dell XPS 14 2024 OLED | |
| Dell XPS 13 9340 Core Ultra 7 | |
| Geekbench 6.7 / Multi-Core | |
| Lenovo ThinkPad T14s Gen 6 21N10007GE | |
| Dell XPS 13 9345 | |
| Medion SPRCHRGD 14 S1 Elite | |
| Microsoft Surface Laptop 7 13.8 Copilot+ | |
| Dell XPS 14 2024 OLED | |
| HP EliteBook Ultra G1q 14 | |
| Gemiddeld Qualcomm Snapdragon X Elite X1E-80-100 (7596 - 14998, n=9) | |
| Dell XPS 13 9340 Core Ultra 7 | |
| Geekbench 6.7 / Single-Core | |
| Dell XPS 13 9345 | |
| Microsoft Surface Laptop 7 13.8 Copilot+ | |
| Gemiddeld Qualcomm Snapdragon X Elite X1E-80-100 (1896 - 2845, n=9) | |
| Lenovo ThinkPad T14s Gen 6 21N10007GE | |
| Medion SPRCHRGD 14 S1 Elite | |
| Dell XPS 14 2024 OLED | |
| Dell XPS 13 9340 Core Ultra 7 | |
| HP EliteBook Ultra G1q 14 | |
Cinebench 2024: CPU Multi Core | CPU Single Core
Cinebench R23: Multi Core | Single Core
Cinebench R20: CPU (Multi Core) | CPU (Single Core)
Cinebench R15: CPU Multi 64Bit | CPU Single 64Bit
Blender: v2.79 BMW27 CPU
7-Zip 18.03: 7z b 4 | 7z b 4 -mmt1
Geekbench 6.7: Multi-Core | Single-Core
HWBOT x265 Benchmark v2.2: 4k Preset
LibreOffice : 20 Documents To PDF
R Benchmark 2.5: Overall mean
* ... kleiner is beter
AIDA64: FP32 Ray-Trace | FPU Julia | CPU SHA3 | CPU Queen | FPU SinJulia | FPU Mandel | CPU AES | CPU ZLib | FP64 Ray-Trace | CPU PhotoWorxx
| Performance rating | |
| Dell XPS 13 9340 Core Ultra 7 | |
| Lenovo ThinkBook 13x G4 21KR0008GE | |
| Microsoft Surface Laptop 7 13.8 Copilot+ | |
| Dell XPS 13 9345 | |
| HP EliteBook Ultra G1q 14 | |
| Gemiddeld Qualcomm Snapdragon X Elite X1E-80-100 | |
| Asus ZenBook S13 OLED UX5304 | |
| AIDA64 / FP32 Ray-Trace | |
| Dell XPS 13 9340 Core Ultra 7 | |
| Lenovo ThinkBook 13x G4 21KR0008GE | |
| HP EliteBook Ultra G1q 14 | |
| Microsoft Surface Laptop 7 13.8 Copilot+ | |
| Dell XPS 13 9345 | |
| Gemiddeld Qualcomm Snapdragon X Elite X1E-80-100 (2184 - 7469, n=7) | |
| Asus ZenBook S13 OLED UX5304 | |
| AIDA64 / FPU Julia | |
| Dell XPS 13 9340 Core Ultra 7 | |
| Lenovo ThinkBook 13x G4 21KR0008GE | |
| Asus ZenBook S13 OLED UX5304 | |
| Microsoft Surface Laptop 7 13.8 Copilot+ | |
| Dell XPS 13 9345 | |
| HP EliteBook Ultra G1q 14 | |
| Gemiddeld Qualcomm Snapdragon X Elite X1E-80-100 (5687 - 26391, n=7) | |
| AIDA64 / CPU SHA3 | |
| HP EliteBook Ultra G1q 14 | |
| Microsoft Surface Laptop 7 13.8 Copilot+ | |
| Dell XPS 13 9340 Core Ultra 7 | |
| Dell XPS 13 9345 | |
| Gemiddeld Qualcomm Snapdragon X Elite X1E-80-100 (2607 - 3122, n=7) | |
| Lenovo ThinkBook 13x G4 21KR0008GE | |
| Asus ZenBook S13 OLED UX5304 | |
| AIDA64 / CPU Queen | |
| Lenovo ThinkBook 13x G4 21KR0008GE | |
| Dell XPS 13 9340 Core Ultra 7 | |
| Microsoft Surface Laptop 7 13.8 Copilot+ | |
| Gemiddeld Qualcomm Snapdragon X Elite X1E-80-100 (67219 - 69762, n=7) | |
| Dell XPS 13 9345 | |
| HP EliteBook Ultra G1q 14 | |
| Asus ZenBook S13 OLED UX5304 | |
| AIDA64 / FPU SinJulia | |
| Dell XPS 13 9340 Core Ultra 7 | |
| Lenovo ThinkBook 13x G4 21KR0008GE | |
| Asus ZenBook S13 OLED UX5304 | |
| Microsoft Surface Laptop 7 13.8 Copilot+ | |
| Dell XPS 13 9345 | |
| Gemiddeld Qualcomm Snapdragon X Elite X1E-80-100 (1521 - 2357, n=7) | |
| HP EliteBook Ultra G1q 14 | |
| AIDA64 / FPU Mandel | |
| Dell XPS 13 9340 Core Ultra 7 | |
| Lenovo ThinkBook 13x G4 21KR0008GE | |
| Asus ZenBook S13 OLED UX5304 | |
| HP EliteBook Ultra G1q 14 | |
| Microsoft Surface Laptop 7 13.8 Copilot+ | |
| Gemiddeld Qualcomm Snapdragon X Elite X1E-80-100 (10117 - 15669, n=7) | |
| Dell XPS 13 9345 | |
| AIDA64 / CPU AES | |
| HP EliteBook Ultra G1q 14 | |
| Dell XPS 13 9340 Core Ultra 7 | |
| Microsoft Surface Laptop 7 13.8 Copilot+ | |
| Gemiddeld Qualcomm Snapdragon X Elite X1E-80-100 (39956 - 71089, n=7) | |
| Dell XPS 13 9345 | |
| Lenovo ThinkBook 13x G4 21KR0008GE | |
| Asus ZenBook S13 OLED UX5304 | |
| AIDA64 / CPU ZLib | |
| Dell XPS 13 9340 Core Ultra 7 | |
| HP EliteBook Ultra G1q 14 | |
| Microsoft Surface Laptop 7 13.8 Copilot+ | |
| Dell XPS 13 9345 | |
| Gemiddeld Qualcomm Snapdragon X Elite X1E-80-100 (398 - 802, n=7) | |
| Lenovo ThinkBook 13x G4 21KR0008GE | |
| Asus ZenBook S13 OLED UX5304 | |
| AIDA64 / FP64 Ray-Trace | |
| Dell XPS 13 9340 Core Ultra 7 | |
| Lenovo ThinkBook 13x G4 21KR0008GE | |
| Microsoft Surface Laptop 7 13.8 Copilot+ | |
| Dell XPS 13 9345 | |
| Gemiddeld Qualcomm Snapdragon X Elite X1E-80-100 (2581 - 4044, n=7) | |
| Asus ZenBook S13 OLED UX5304 | |
| HP EliteBook Ultra G1q 14 | |
| AIDA64 / CPU PhotoWorxx | |
| Dell XPS 13 9340 Core Ultra 7 | |
| Lenovo ThinkBook 13x G4 21KR0008GE | |
| Asus ZenBook S13 OLED UX5304 | |
| Microsoft Surface Laptop 7 13.8 Copilot+ | |
| Dell XPS 13 9345 | |
| Gemiddeld Qualcomm Snapdragon X Elite X1E-80-100 (28474 - 38707, n=7) | |
| HP EliteBook Ultra G1q 14 | |
Systeemprestaties
WebXPRT en Kraken, die in de Edge-browser draaien die geoptimaliseerd is voor ARM, geven onze Qualcomm XPS allebei een behoorlijke voorsprong op de Intel XPS.
WebXPRT 3: Overall
WebXPRT 4: Overall
Mozilla Kraken 1.1: Total
| CrossMark / Overall | |
| Dell XPS 13 9340 Core Ultra 7 | |
| Asus ZenBook S13 OLED UX5304 | |
| Lenovo ThinkBook 13x G4 21KR0008GE | |
| Microsoft Surface Laptop 7 13.8 Copilot+ | |
| Gemiddeld Qualcomm Snapdragon X Elite X1E-80-100, Qualcomm SD X Adreno X1-85 3.8 TFLOPS (1356 - 1443, n=7) | |
| Dell XPS 13 9345 | |
| HP EliteBook Ultra G1q 14 | |
| CrossMark / Productivity | |
| Dell XPS 13 9340 Core Ultra 7 | |
| Asus ZenBook S13 OLED UX5304 | |
| Lenovo ThinkBook 13x G4 21KR0008GE | |
| Microsoft Surface Laptop 7 13.8 Copilot+ | |
| Gemiddeld Qualcomm Snapdragon X Elite X1E-80-100, Qualcomm SD X Adreno X1-85 3.8 TFLOPS (1271 - 1375, n=7) | |
| Dell XPS 13 9345 | |
| HP EliteBook Ultra G1q 14 | |
| CrossMark / Creativity | |
| Dell XPS 13 9340 Core Ultra 7 | |
| Lenovo ThinkBook 13x G4 21KR0008GE | |
| Asus ZenBook S13 OLED UX5304 | |
| Microsoft Surface Laptop 7 13.8 Copilot+ | |
| Gemiddeld Qualcomm Snapdragon X Elite X1E-80-100, Qualcomm SD X Adreno X1-85 3.8 TFLOPS (1402 - 1537, n=7) | |
| Dell XPS 13 9345 | |
| HP EliteBook Ultra G1q 14 | |
| CrossMark / Responsiveness | |
| Dell XPS 13 9340 Core Ultra 7 | |
| Asus ZenBook S13 OLED UX5304 | |
| Microsoft Surface Laptop 7 13.8 Copilot+ | |
| Gemiddeld Qualcomm Snapdragon X Elite X1E-80-100, Qualcomm SD X Adreno X1-85 3.8 TFLOPS (1237 - 1401, n=7) | |
| Lenovo ThinkBook 13x G4 21KR0008GE | |
| Dell XPS 13 9345 | |
| HP EliteBook Ultra G1q 14 | |
| WebXPRT 3 / Overall | |
| Gemiddeld Qualcomm Snapdragon X Elite X1E-80-100, Qualcomm SD X Adreno X1-85 3.8 TFLOPS (430 - 455, n=7) | |
| Microsoft Surface Laptop 7 13.8 Copilot+ | |
| Dell XPS 13 9345 | |
| HP EliteBook Ultra G1q 14 | |
| Asus ZenBook S13 OLED UX5304 | |
| Dell XPS 13 9340 Core Ultra 7 | |
| Lenovo ThinkBook 13x G4 21KR0008GE | |
| WebXPRT 4 / Overall | |
| Dell XPS 13 9345 | |
| Gemiddeld Qualcomm Snapdragon X Elite X1E-80-100, Qualcomm SD X Adreno X1-85 3.8 TFLOPS (295 - 324, n=7) | |
| Microsoft Surface Laptop 7 13.8 Copilot+ | |
| HP EliteBook Ultra G1q 14 | |
| Dell XPS 13 9340 Core Ultra 7 | |
| Asus ZenBook S13 OLED UX5304 | |
| Lenovo ThinkBook 13x G4 21KR0008GE | |
| Mozilla Kraken 1.1 / Total | |
| Lenovo ThinkBook 13x G4 21KR0008GE | |
| Dell XPS 13 9340 Core Ultra 7 | |
| Asus ZenBook S13 OLED UX5304 | |
| HP EliteBook Ultra G1q 14 | |
| Dell XPS 13 9345 | |
| Gemiddeld Qualcomm Snapdragon X Elite X1E-80-100, Qualcomm SD X Adreno X1-85 3.8 TFLOPS (391 - 422, n=7) | |
| Microsoft Surface Laptop 7 13.8 Copilot+ | |
* ... kleiner is beter
| AIDA64 / Memory Copy | |
| Dell XPS 13 9340 Core Ultra 7 | |
| Lenovo ThinkBook 13x G4 21KR0008GE | |
| Dell XPS 13 9345 | |
| Microsoft Surface Laptop 7 13.8 Copilot+ | |
| Asus ZenBook S13 OLED UX5304 | |
| Gemiddeld Qualcomm Snapdragon X Elite X1E-80-100 (44795 - 63495, n=7) | |
| HP EliteBook Ultra G1q 14 | |
| AIDA64 / Memory Read | |
| Dell XPS 13 9345 | |
| Microsoft Surface Laptop 7 13.8 Copilot+ | |
| Gemiddeld Qualcomm Snapdragon X Elite X1E-80-100 (58855 - 125604, n=7) | |
| Dell XPS 13 9340 Core Ultra 7 | |
| Lenovo ThinkBook 13x G4 21KR0008GE | |
| HP EliteBook Ultra G1q 14 | |
| Asus ZenBook S13 OLED UX5304 | |
| AIDA64 / Memory Write | |
| Dell XPS 13 9340 Core Ultra 7 | |
| Asus ZenBook S13 OLED UX5304 | |
| Lenovo ThinkBook 13x G4 21KR0008GE | |
| Dell XPS 13 9345 | |
| Microsoft Surface Laptop 7 13.8 Copilot+ | |
| Gemiddeld Qualcomm Snapdragon X Elite X1E-80-100 (37270 - 45265, n=7) | |
| HP EliteBook Ultra G1q 14 | |
| AIDA64 / Memory Latency | |
| Lenovo ThinkBook 13x G4 21KR0008GE | |
| Dell XPS 13 9340 Core Ultra 7 | |
| Asus ZenBook S13 OLED UX5304 | |
| Gemiddeld Qualcomm Snapdragon X Elite X1E-80-100 (7.4 - 8.8, n=5) | |
| HP EliteBook Ultra G1q 14 | |
| Dell XPS 13 9345 | |
| Microsoft Surface Laptop 7 13.8 Copilot+ | |
* ... kleiner is beter
Opslagapparaten
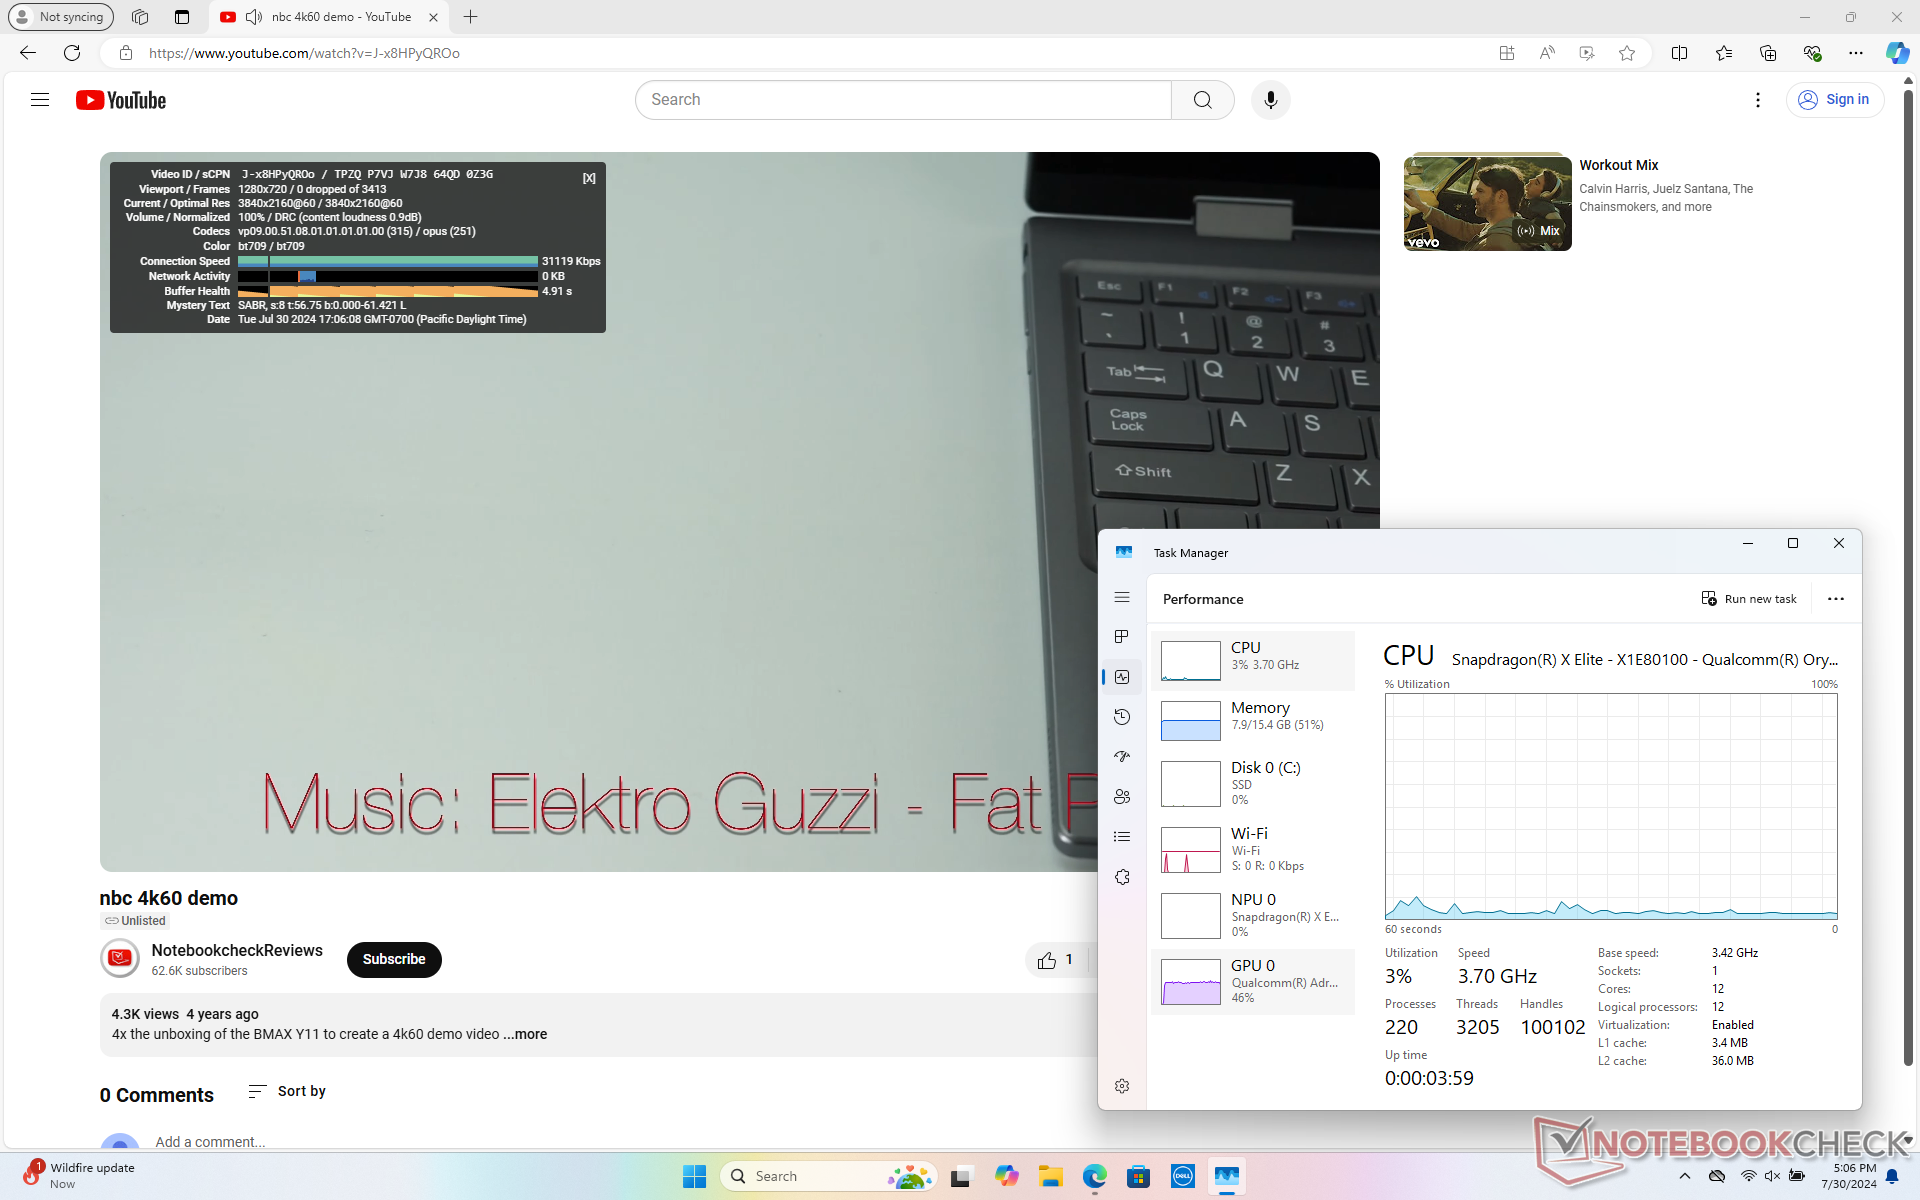
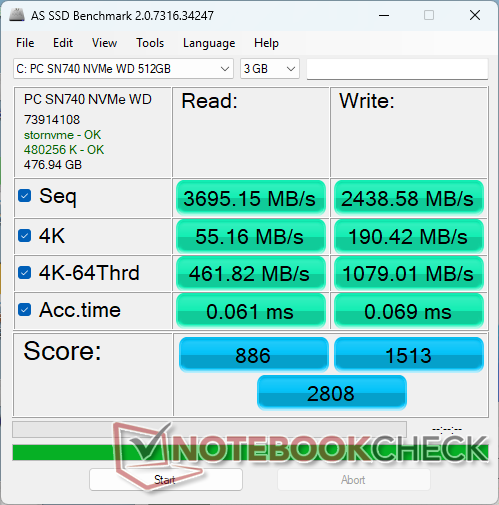
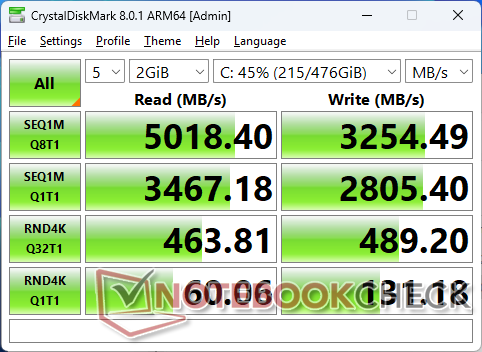
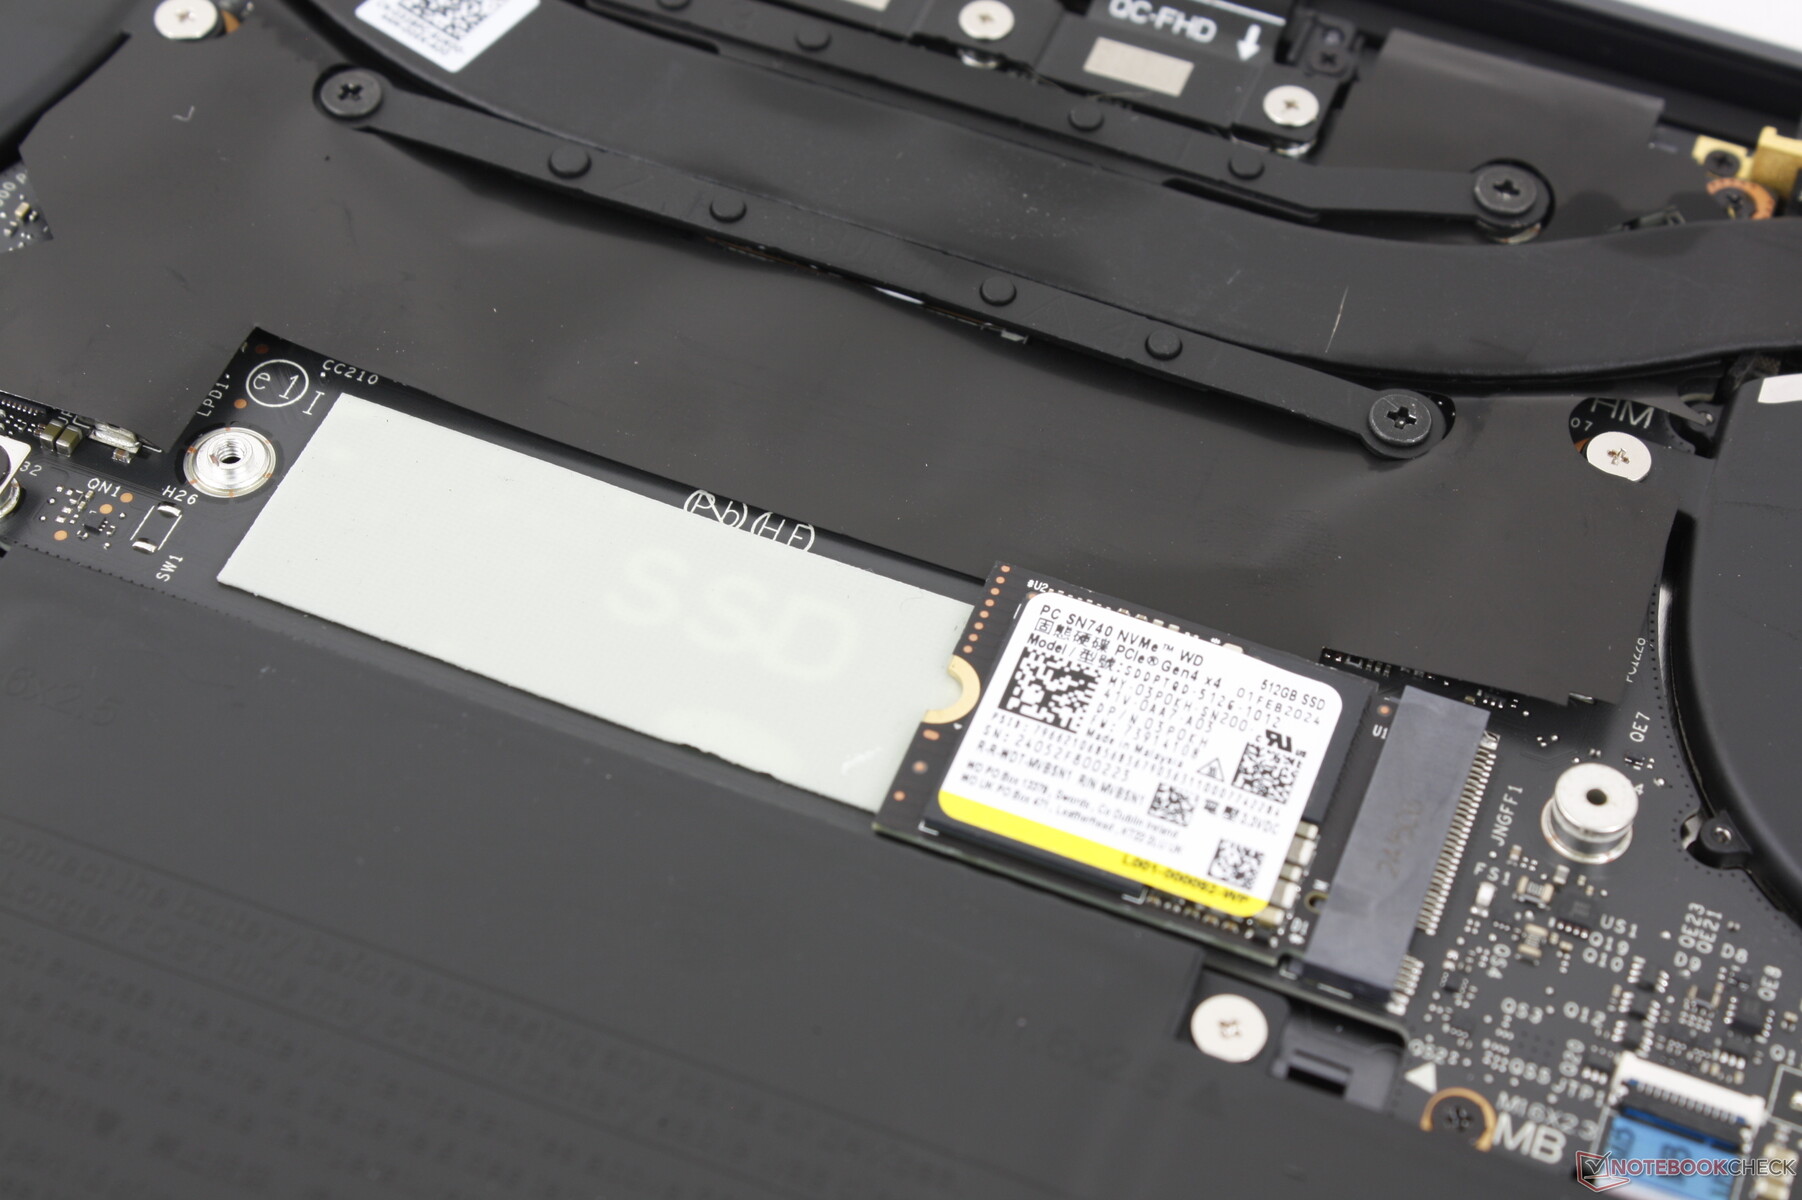
Dell betrekt zijn SSD's van een groot aantal verschillende fabrikanten, dus het is moeilijk om te weten welke schijf u krijgt voordat u tot aanschaf overgaat. We hebben bijvoorbeeld schijven van Micron, Samsung, WD, Toshiba en SK Hynix in meer dan 10 verschillende interne XPS 13-eenheden gehad. Onze specifieke Qualcomm-eenheid wordt geleverd met de WD SN740 uit het middensegment, die stabiele overdrachtsnelheden tot 5000 MB/s biedt. Ondanks de geringe lengte van 42 mm kunnen we geen throttling gedrag waarnemen, wat waarschijnlijk deels te wijten is aan de bijgeleverde SSD-warmtespreider.

* ... kleiner is beter
Disk Throttling: DiskSpd Read Loop, Queue Depth 8
GPU-prestaties
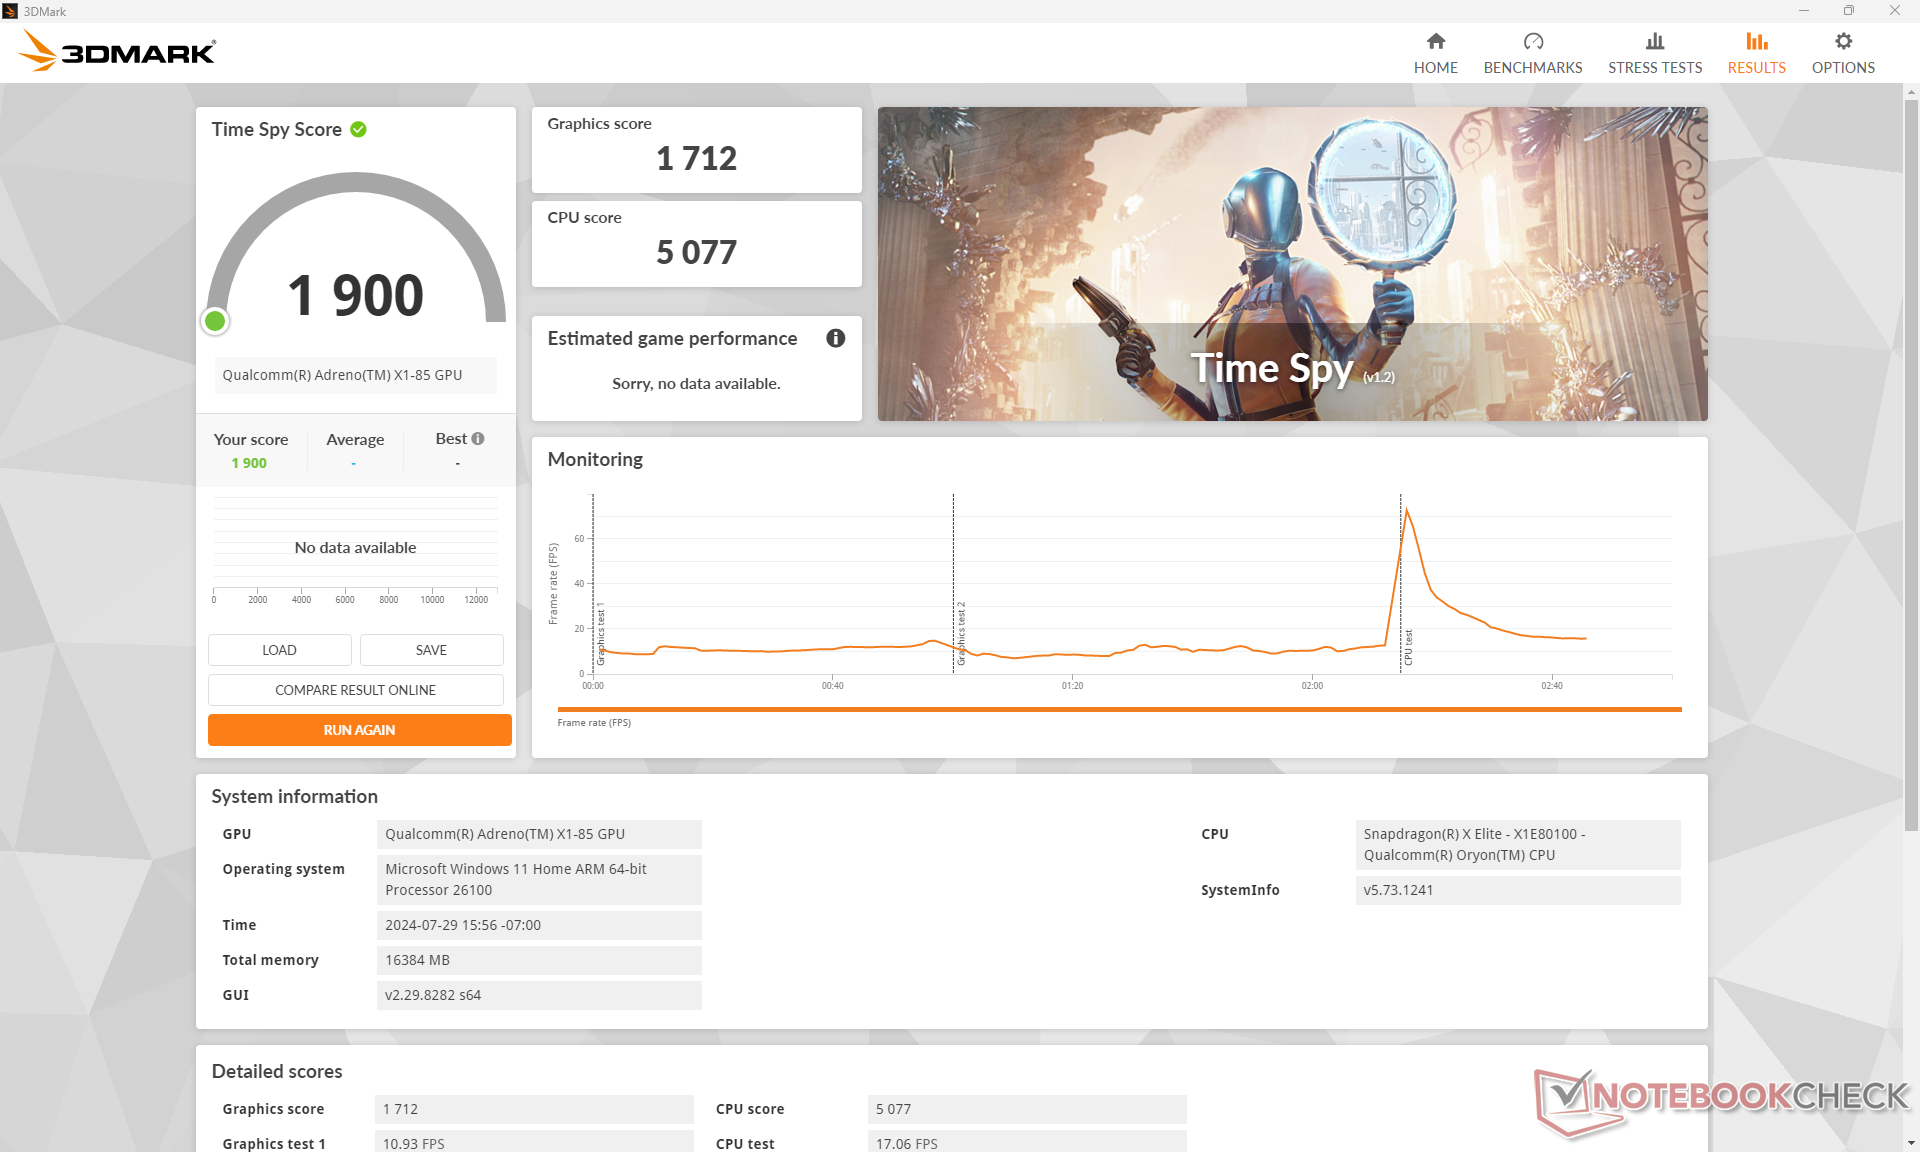
De grafische prestaties volgens geëmuleerd 3DMark zijn op hetzelfde niveau als de Iris Xe 96 EUs maar ver achter de Arc 8 of Radeon 680M/780M series met wel 20 tot 40 procent. De resultaten zijn echter consistent beter dan die van de HP EliteBook Ultra G1q 14 zelfs als de verschillen gemiddeld klein zijn.
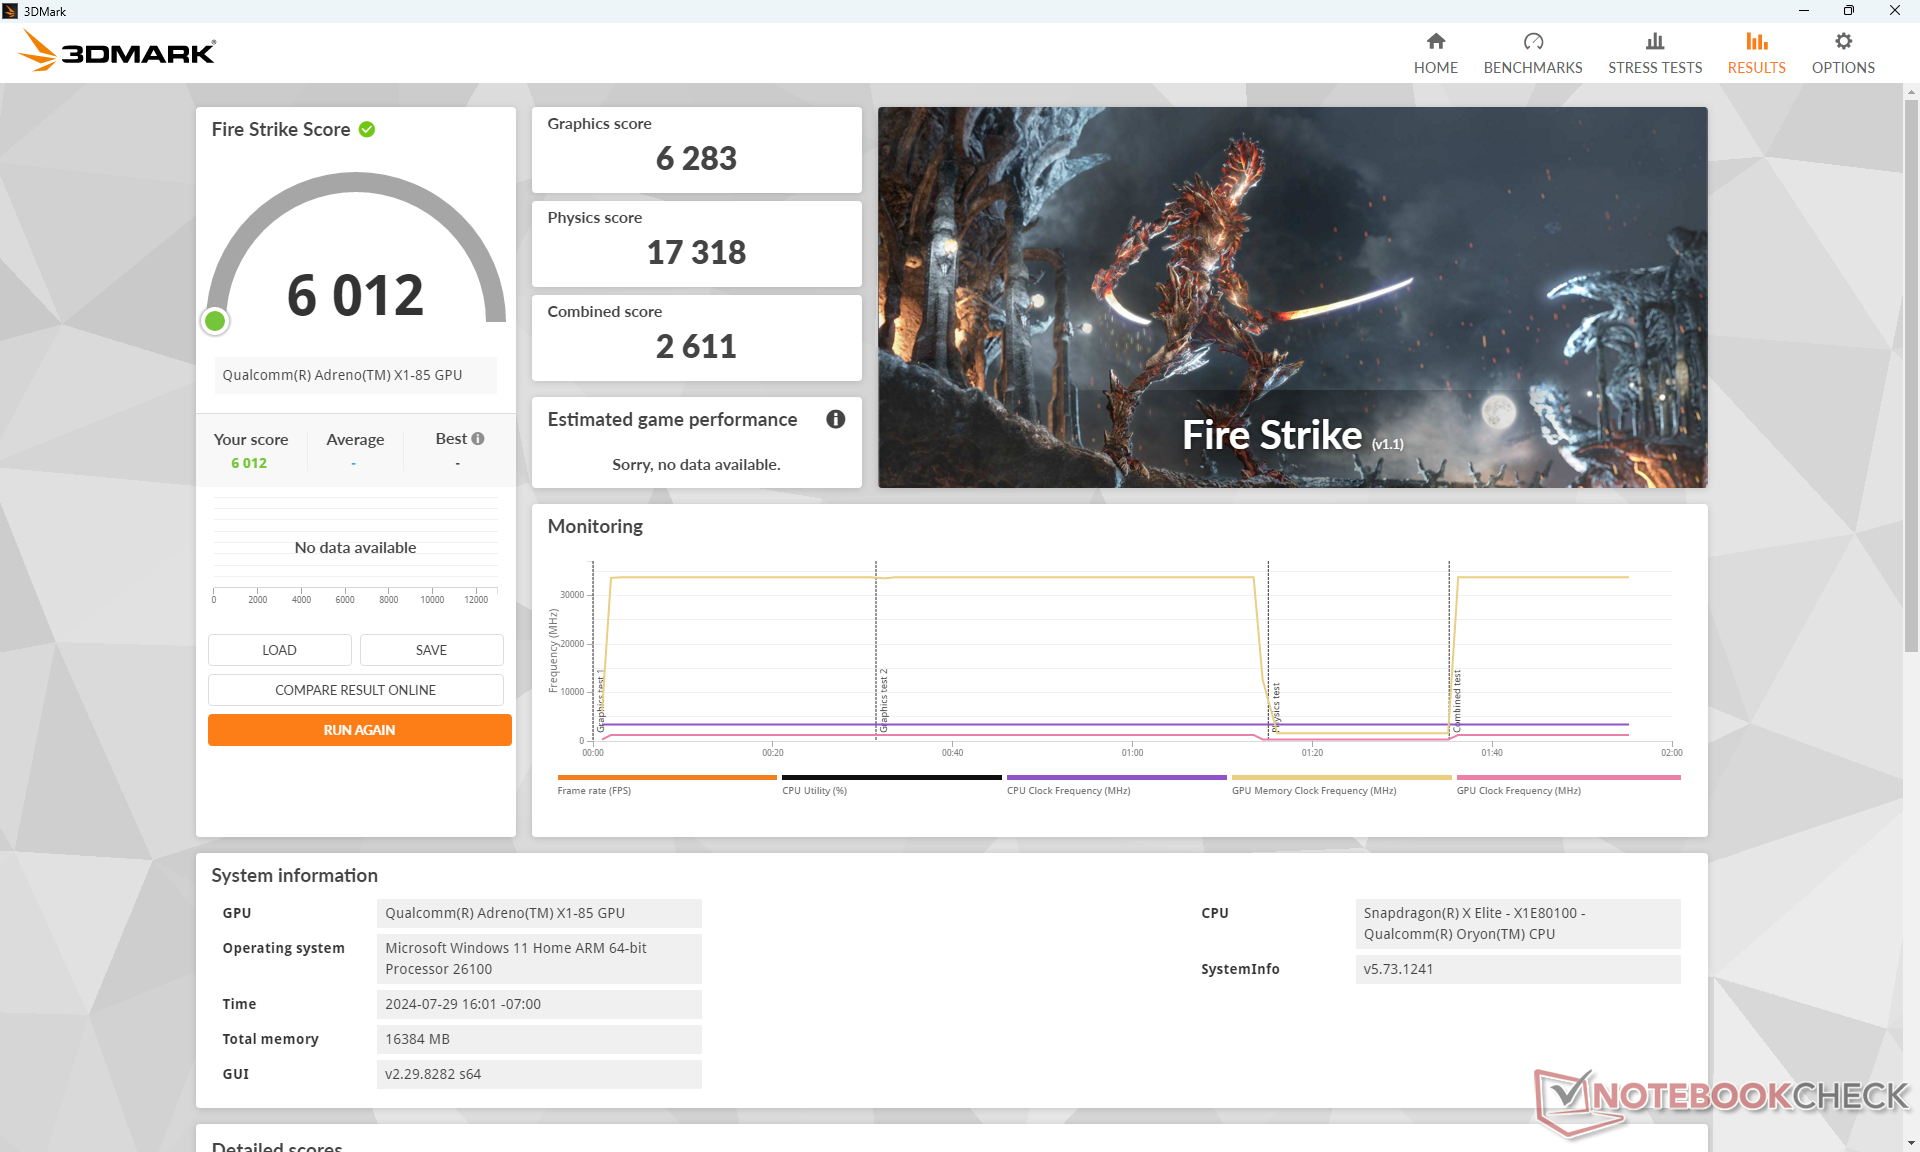
| Vermogen Profiel | Grafische Score | Fysica Score | Gecombineerde Score |
| Prestatiemodus | 6283 | 17318 | 2611 |
| Evenwichtige modus | 6209 | 18348 | 2643 |
| Batterijvermogen | 6287 | 18156 | 2687 |
Er is geen significante prestatiedip bij het schakelen tussen de modi Prestaties, Gebalanceerd of Batterijvermogen, zoals blijkt uit onze bovenstaande tabel met resultaten Fire Strike.
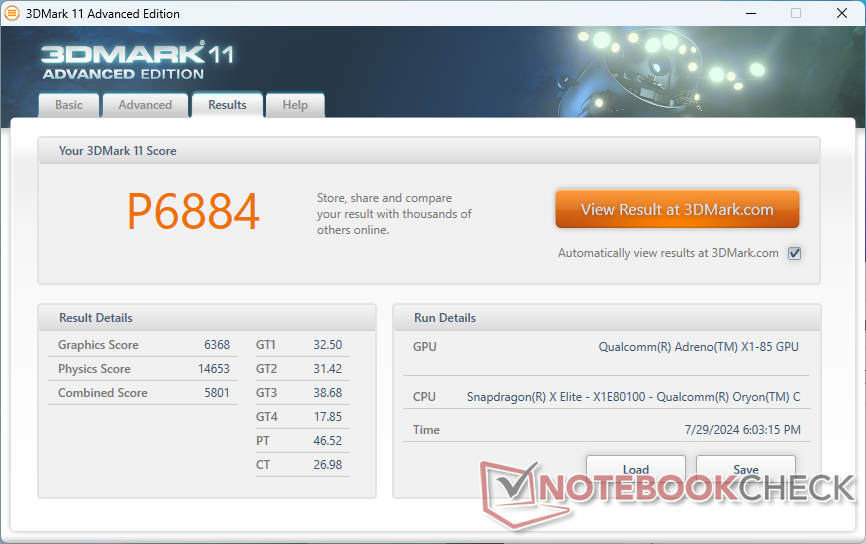
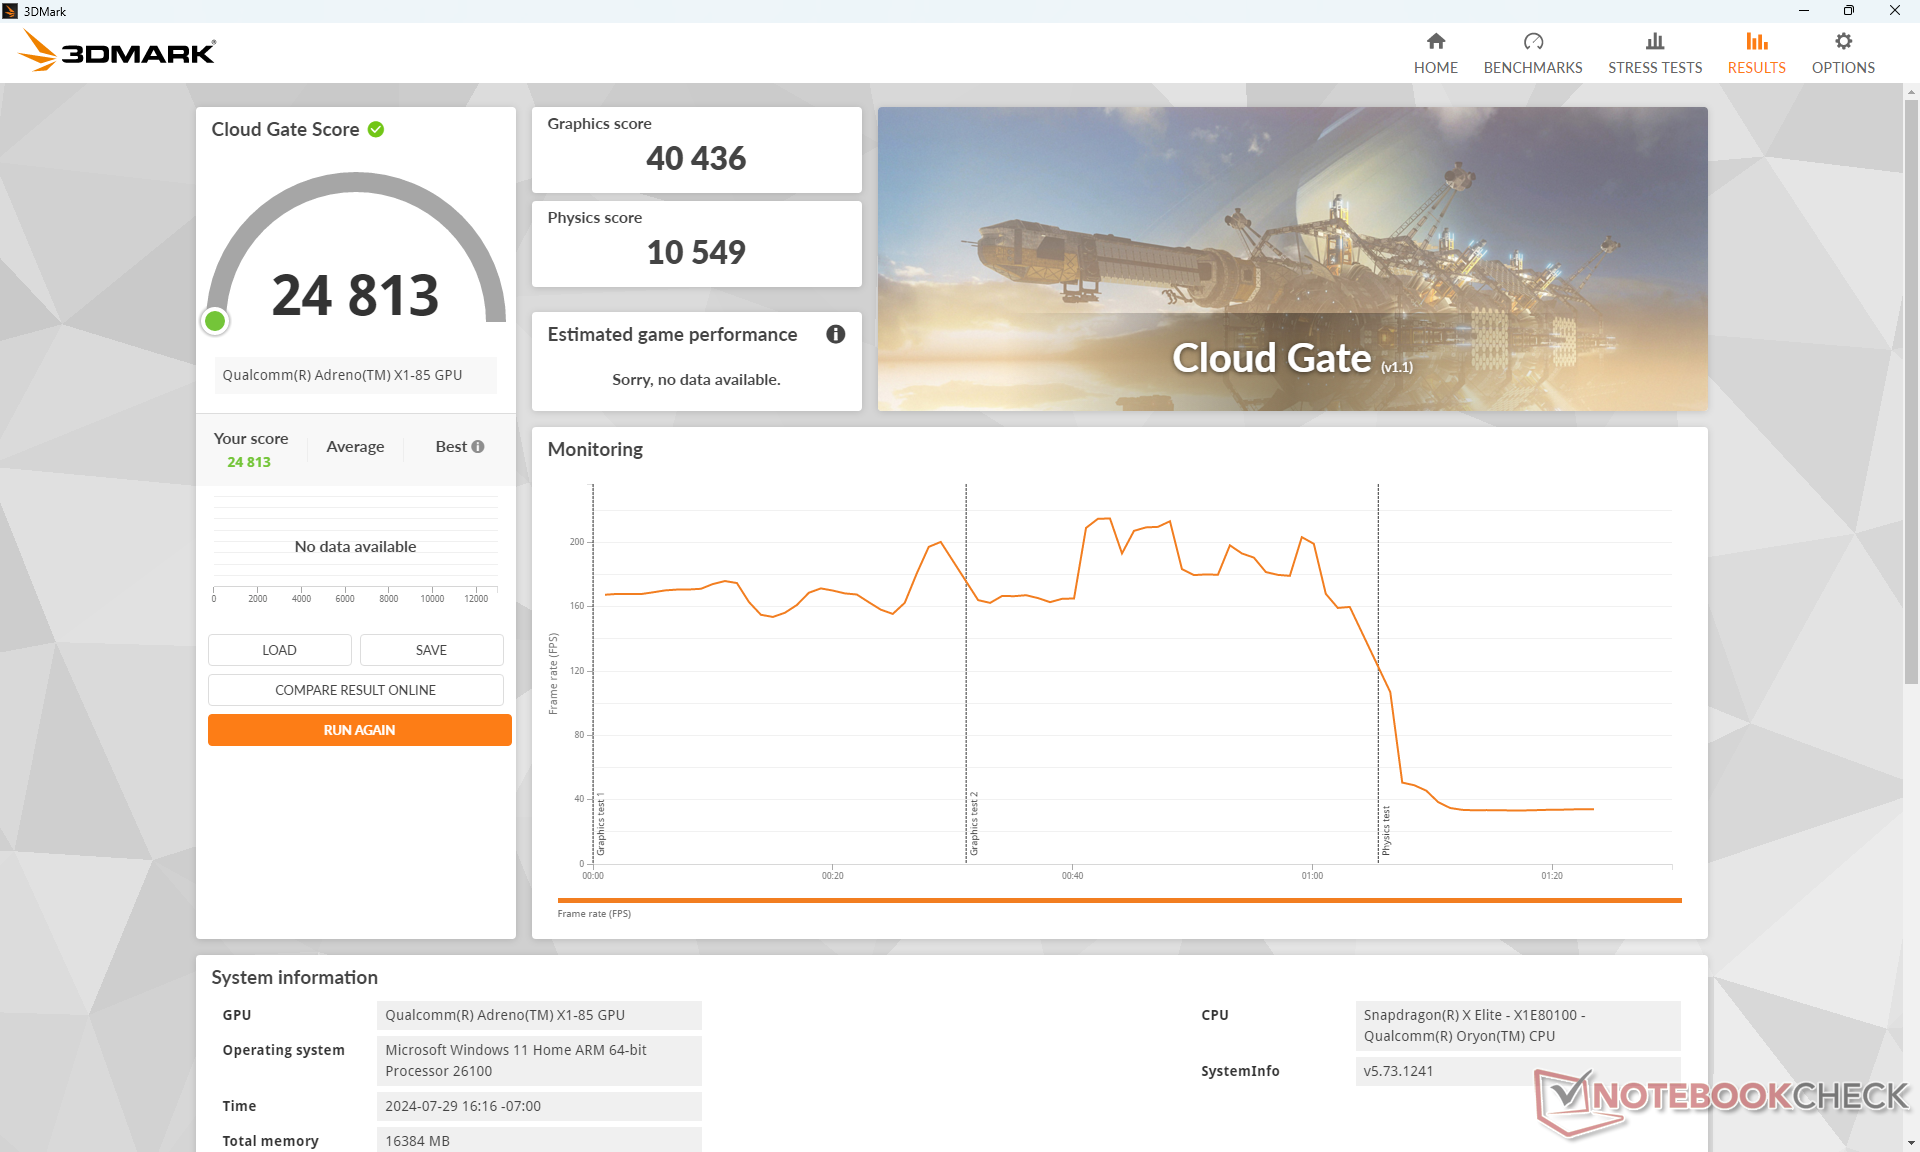
| 3DMark 11 Performance | 6884 punten | |
| 3DMark Cloud Gate Standard Score | 24813 punten | |
| 3DMark Fire Strike Score | 6012 punten | |
| 3DMark Time Spy Score | 1900 punten | |
Help | ||
* ... kleiner is beter
Gaming prestaties
Onze iets hogere 3DMark-resultaten ten opzichte van de EliteBook Ultra G1q 14 vertalen zich naar iets snellere prestaties in de geteste titels hieronder. Het is interessant om te zien dat sommige titels wel draaiden op onze Dell, maar niet op onze HP en vice versa. Far Cry 5 draaide bijvoorbeeld wel op onze Dell maar niet op de HP en Baldur's Gate 3 draaide wel op onze HP maar niet op de Dell, ongeacht de DirectX-modus. De discrepantie kan te wijten zijn aan driververschillen tussen de twee modellen, maar dit toont ook aan dat er meer werk moet worden verricht wat betreft de grafische driver.
| Performance rating - Percent | |
| Lenovo ThinkBook 13x G4 21KR0008GE -2! | |
| Dell XPS 13 9340 Core Ultra 7 -2! | |
| Dell XPS 13 9345 | |
| Microsoft Surface Laptop 7 13.8 Copilot+ -2! | |
| HP EliteBook Ultra G1q 14 -1! | |
| Asus ZenBook S13 OLED UX5304 -1! | |
| The Witcher 3 - 1920x1080 Ultra Graphics & Postprocessing (HBAO+) | |
| Lenovo ThinkBook 13x G4 21KR0008GE | |
| Dell XPS 13 9340 Core Ultra 7 | |
| Dell XPS 13 9345 | |
| HP EliteBook Ultra G1q 14 | |
| Asus ZenBook S13 OLED UX5304 | |
| GTA V - 1920x1080 Highest AA:4xMSAA + FX AF:16x | |
| Microsoft Surface Laptop 7 13.8 Copilot+ | |
| Dell XPS 13 9345 | |
| Lenovo ThinkBook 13x G4 21KR0008GE | |
| Dell XPS 13 9340 Core Ultra 7 | |
| Asus ZenBook S13 OLED UX5304 | |
| Final Fantasy XV Benchmark - 1920x1080 High Quality | |
| Dell XPS 13 9340 Core Ultra 7 | |
| Lenovo ThinkBook 13x G4 21KR0008GE | |
| Microsoft Surface Laptop 7 13.8 Copilot+ | |
| Dell XPS 13 9345 | |
| Asus ZenBook S13 OLED UX5304 | |
| HP EliteBook Ultra G1q 14 | |
| Strange Brigade - 1920x1080 ultra AA:ultra AF:16 | |
| Lenovo ThinkBook 13x G4 21KR0008GE | |
| Dell XPS 13 9340 Core Ultra 7 | |
| Microsoft Surface Laptop 7 13.8 Copilot+ | |
| Dell XPS 13 9345 | |
| HP EliteBook Ultra G1q 14 | |
| Asus ZenBook S13 OLED UX5304 | |
| Dota 2 Reborn - 1920x1080 ultra (3/3) best looking | |
| Dell XPS 13 9340 Core Ultra 7 | |
| Lenovo ThinkBook 13x G4 21KR0008GE | |
| Microsoft Surface Laptop 7 13.8 Copilot+ | |
| Asus ZenBook S13 OLED UX5304 | |
| Dell XPS 13 9345 | |
| HP EliteBook Ultra G1q 14 | |
| Tiny Tina's Wonderlands - 1920x1080 Badass Preset (DX12) | |
| Dell XPS 13 9345 | |
| HP EliteBook Ultra G1q 14 | |
| F1 22 - 1920x1080 High Preset AA:T AF:16x | |
| Dell XPS 13 9345 | |
| Microsoft Surface Laptop 7 13.8 Copilot+ | |
| HP EliteBook Ultra G1q 14 | |
| Asus ZenBook S13 OLED UX5304 | |
| Tiny Tina's Wonderlands | |
| 1280x720 Lowest Preset (DX12) | |
| Dell XPS 13 9345 | |
| Gemiddeld Qualcomm SD X Adreno X1-85 3.8 TFLOPS (67.6 - 73.9, n=3) | |
| HP EliteBook Ultra G1q 14 | |
| Dell XPS 13 Plus 9320 Core i7-1360P | |
| 1920x1080 Low Preset (DX12) | |
| Dell XPS 13 9345 | |
| Gemiddeld Qualcomm SD X Adreno X1-85 3.8 TFLOPS (41.5 - 44.7, n=3) | |
| HP EliteBook Ultra G1q 14 | |
| Dell XPS 13 Plus 9320 Core i7-1360P | |
| 1920x1080 Medium Preset (DX12) | |
| Dell XPS 13 9345 | |
| Gemiddeld Qualcomm SD X Adreno X1-85 3.8 TFLOPS (30.8 - 33.7, n=3) | |
| HP EliteBook Ultra G1q 14 | |
| Dell XPS 13 Plus 9320 Core i7-1360P | |
| 1920x1080 High Preset (DX12) | |
| Dell XPS 13 9345 | |
| Gemiddeld Qualcomm SD X Adreno X1-85 3.8 TFLOPS (20.6 - 22.4, n=3) | |
| HP EliteBook Ultra G1q 14 | |
| Dell XPS 13 Plus 9320 Core i7-1360P | |
| 1920x1080 Badass Preset (DX12) | |
| Dell XPS 13 9345 | |
| Gemiddeld Qualcomm SD X Adreno X1-85 3.8 TFLOPS (16.8 - 18, n=3) | |
| HP EliteBook Ultra G1q 14 | |
| Dell XPS 13 Plus 9320 Core i7-1360P | |
Cyberpunk 2077 ultra FPS Chart
| lage | gem. | hoge | ultra | |
|---|---|---|---|---|
| GTA V (2015) | 96.3 | 94.2 | 49.5 | 21.2 |
| The Witcher 3 (2015) | 104 | 74.5 | 43.7 | 19.2 |
| Dota 2 Reborn (2015) | 80 | 60.7 | 57.4 | 50.7 |
| Final Fantasy XV Benchmark (2018) | 56.1 | 25 | 15.8 | |
| X-Plane 11.11 (2018) | 38 | |||
| Far Cry 5 (2018) | 42 | 33 | 31 | 28 |
| Strange Brigade (2018) | 123.9 | 50.8 | 41.8 | 33.9 |
| Tiny Tina's Wonderlands (2022) | 44.5 | 33.6 | 22.4 | 18 |
| F1 22 (2022) | 62.9 | 55.4 | 38.5 | |
| Cyberpunk 2077 (2023) | 24.1 | 19.5 | 16.9 | 14.7 |
Uitstoot
Systeemgeluid - Meer ontspannen ventilatoractiviteit
Het geluid van de ventilator is iets stiller dan dat van het Intel Core Ultra 7 model in de zin dat de interne ventilatoren langzamer draaien als reactie op verhoogde belastingen. Anders zouden de ventilatoren van beide modellen op vergelijkbare maximale RPM's draaien als ze gedurende langere perioden zware belastingen uitvoeren. Het ventilatorgeluid bereikte bijvoorbeeld een top van 32,8 dB(A) tegen het einde van de eerste benchmarkscène van 90 seconden in 3DMark 06, vergeleken met 37,4 dB(A) op het Intel-model onder vergelijkbare omstandigheden. Bij het uitvoeren van games zoals Cyberpunk 2077 bleven beide modellen echter rond de 40 dB(A) hangen. Het door Qualcomm aangedreven systeem is niet per se stiller tijdens het uitvoeren van hoge belastingen, maar u zult ook minder snel merken dat de ventilator actief is tijdens het surfen op het web of het streamen van video.
Geluidsniveau
| Onbelast |
| 22.9 / 22.9 / 22.9 dB (A) |
| Belasting |
| 32.8 / 40.6 dB (A) |
 | ||
30 dB stil 40 dB(A) hoorbaar 50 dB(A) luid |
||
min: | ||
| Dell XPS 13 9345 Adreno X1-85 3.8 TFLOPS, SD X Elite X1E-80-100 | Dell XPS 13 9340 Core Ultra 7 Arc 8-Core, Ultra 7 155H, Micron 2550 512GB | Microsoft Surface Laptop 7 13.8 Copilot+ Adreno X1-85 3.8 TFLOPS, SD X Elite X1E-80-100, Samsung MZ9L4512HBLU-00BMV | Lenovo ThinkBook 13x G4 21KR0008GE Arc 7-Core, Ultra 5 125H, Samsung PM9C1a MZAL8512HDLU | HP EliteBook Ultra G1q 14 Adreno X1-85 3.8 TFLOPS, SD X Elite X1E-78-100, SK hynix PC801 HFS512GEJ9X101N BF | Asus ZenBook S13 OLED UX5304 Iris Xe G7 96EUs, i7-1355U, Samsung PM9A1 MZVL21T0HCLR | |
|---|---|---|---|---|---|---|
| Noise | -10% | 4% | -7% | 4% | -4% | |
| uit / omgeving * (dB) | 22.9 | 25.1 -10% | 23.8 -4% | 24.5 -7% | 23.4 -2% | 23.3 -2% |
| Idle Minimum * (dB) | 22.9 | 25.1 -10% | 23.8 -4% | 24.5 -7% | 23.4 -2% | 23.3 -2% |
| Idle Average * (dB) | 22.9 | 25.1 -10% | 23.8 -4% | 24.5 -7% | 23.4 -2% | 23.3 -2% |
| Idle Maximum * (dB) | 22.9 | 25.1 -10% | 23.8 -4% | 27.1 -18% | 24.3 -6% | 23.3 -2% |
| Load Average * (dB) | 32.8 | 37.4 -14% | 26 21% | 33.3 -2% | 25 24% | 37.7 -15% |
| Cyberpunk 2077 ultra * (dB) | 40.6 | 31.5 22% | ||||
| Load Maximum * (dB) | 40.6 | 42.5 -5% | 40.3 1% | 40.7 -0% | 34.8 14% | 40.1 1% |
| Witcher 3 ultra * (dB) | 42.5 | 36.8 | 30.6 | 40.1 |
* ... kleiner is beter
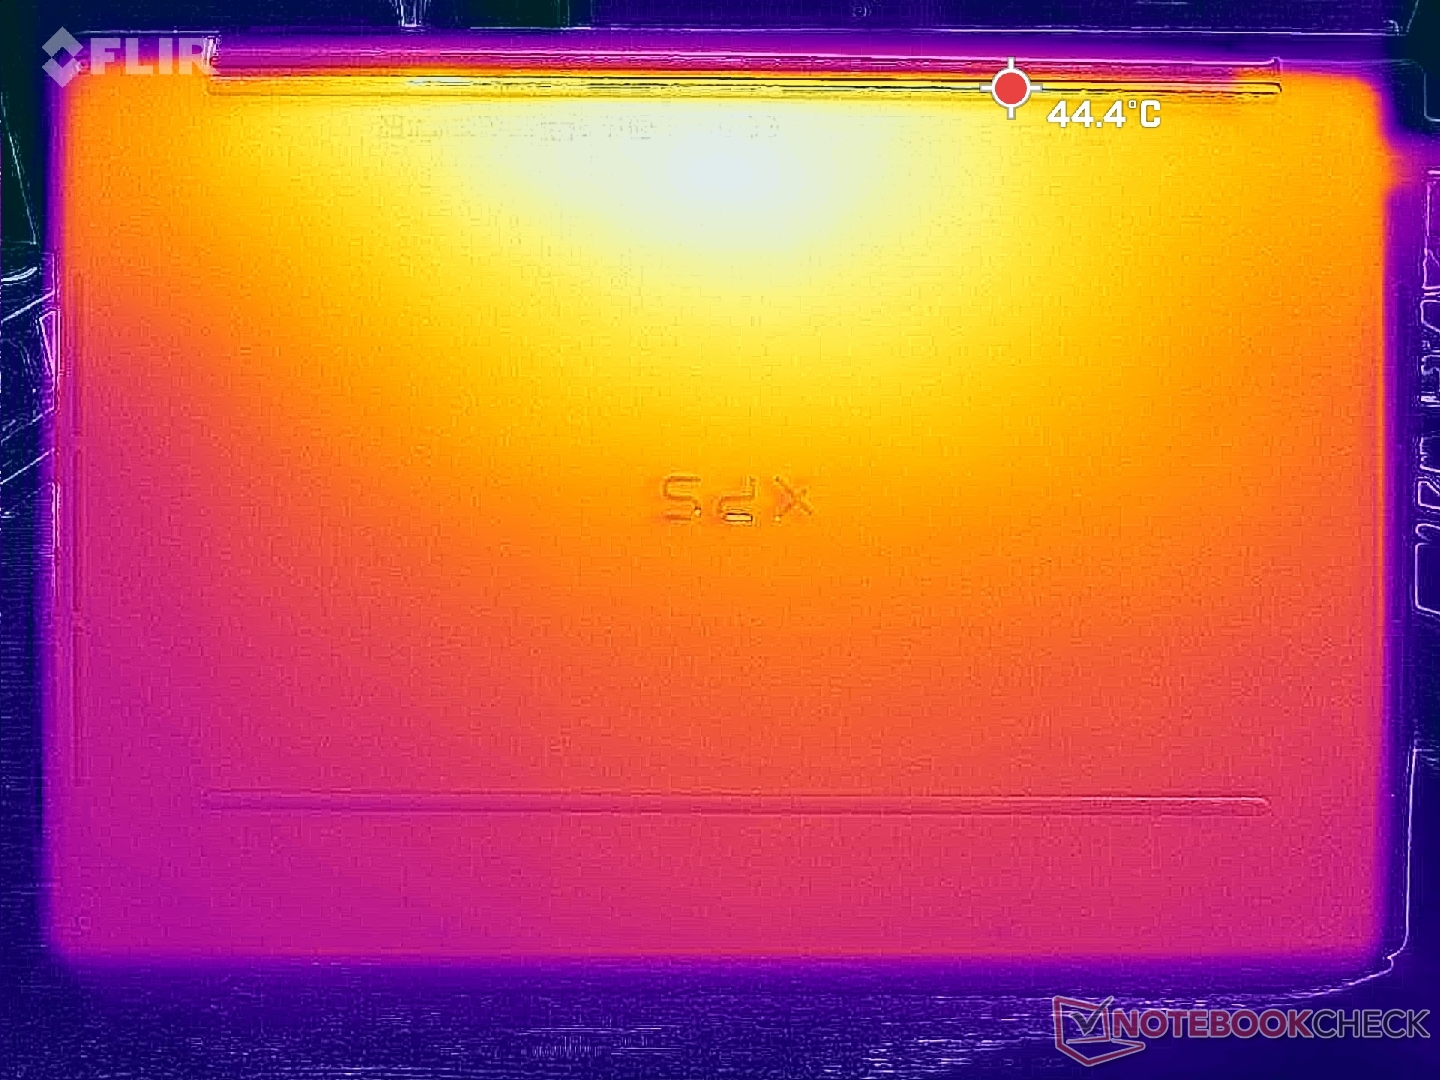
Temperatuur
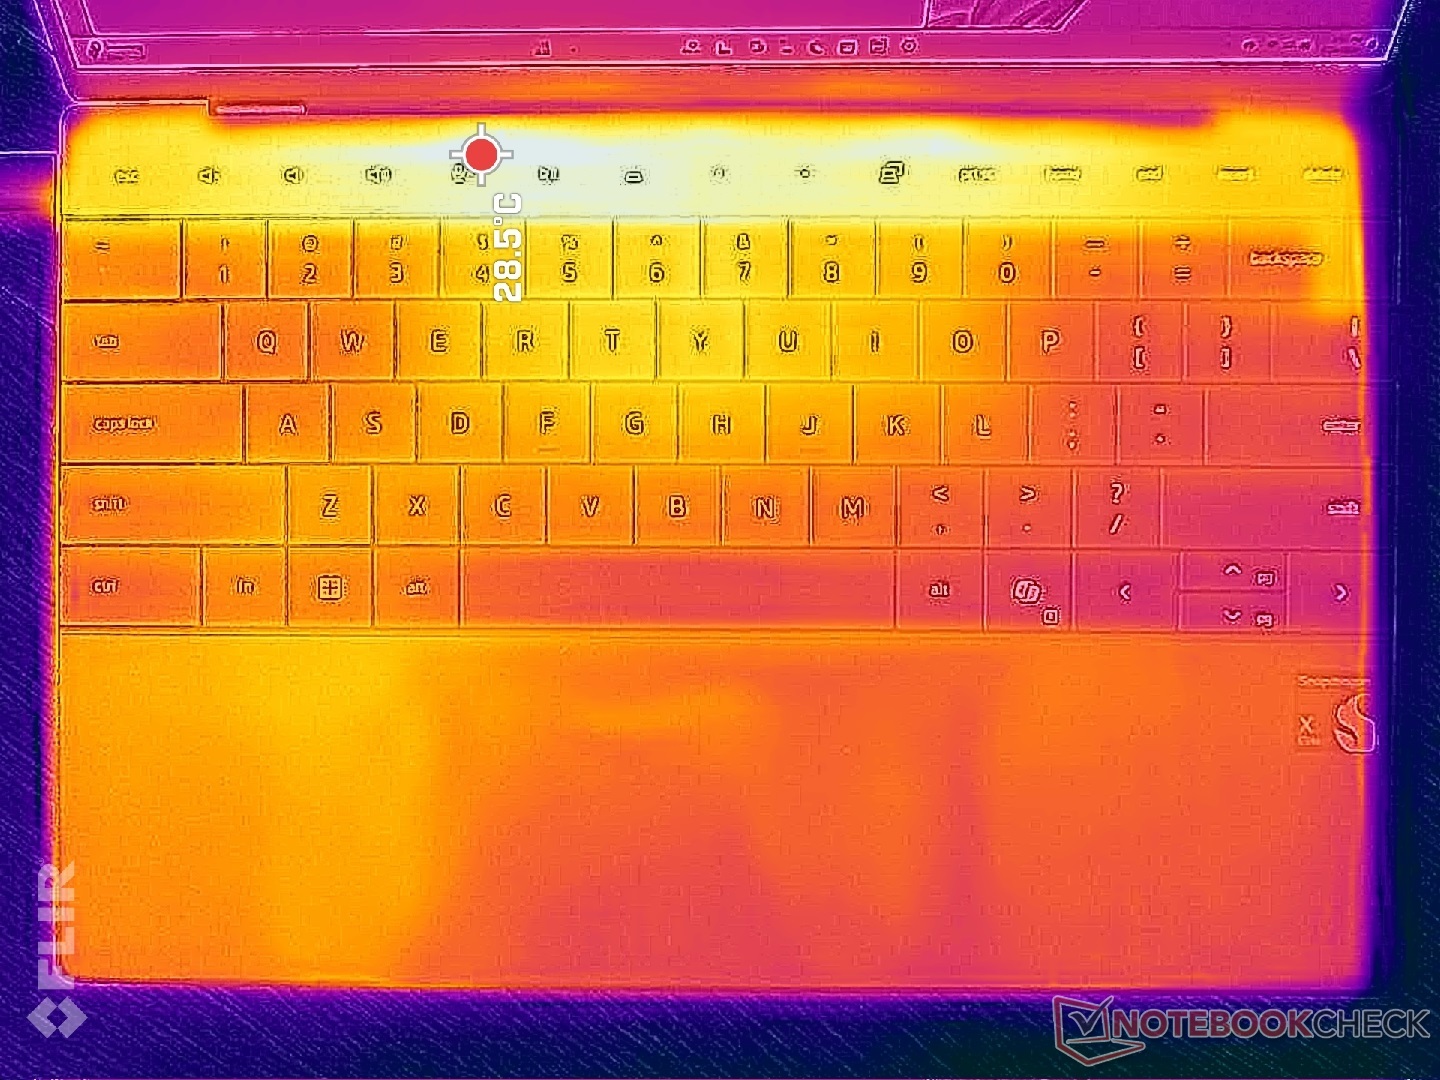
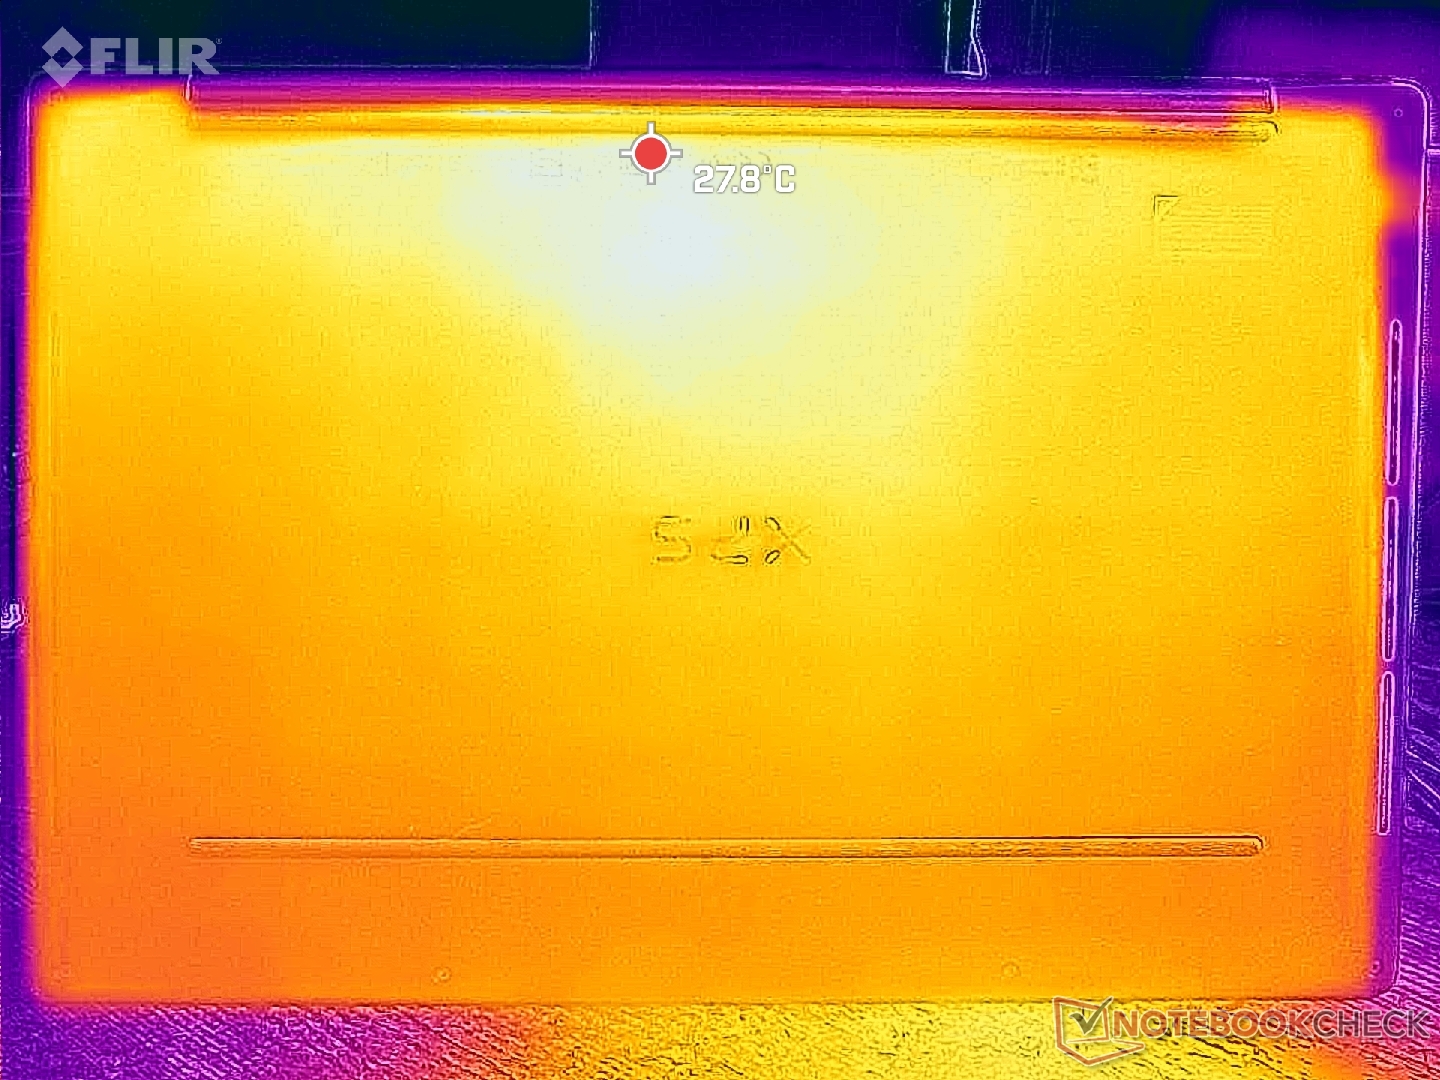
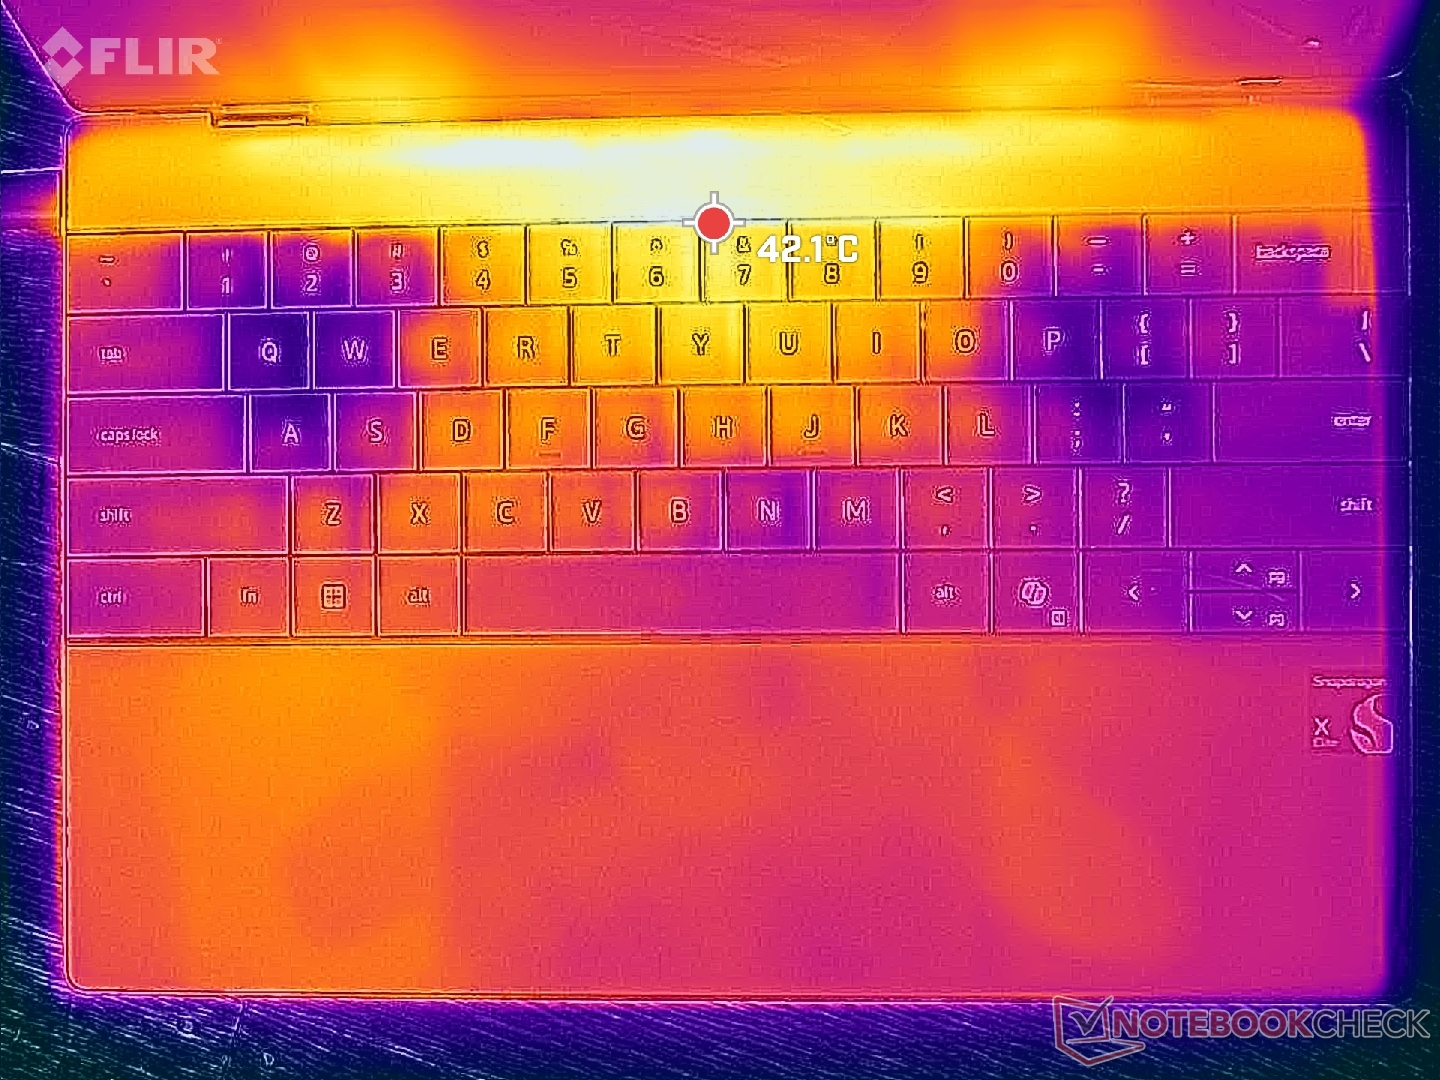
De oppervlaktetemperaturen liggen erg dicht bij wat we hebben gemeten op de Intel-aangedreven XPS 13 9340, om aan te tonen dat het Qualcomm-model niet merkbaar warmer of koeler draait ondanks de processorruil. Hete plekken in het midden van het systeem kunnen oplopen tot 45 C, wat vergelijkbaar is met het Intel-model wanneer beide gedurende langere perioden zware belastingen uitvoeren. De gemiddelde temperaturen zijn koeler dan wat we registreerden op de Microsoft Surface Laptop 7 13.8 maar warmer dan op de HP EliteBook Ultra G1q 14 beide met vergelijkbare Snapdragon Elite CPU's.
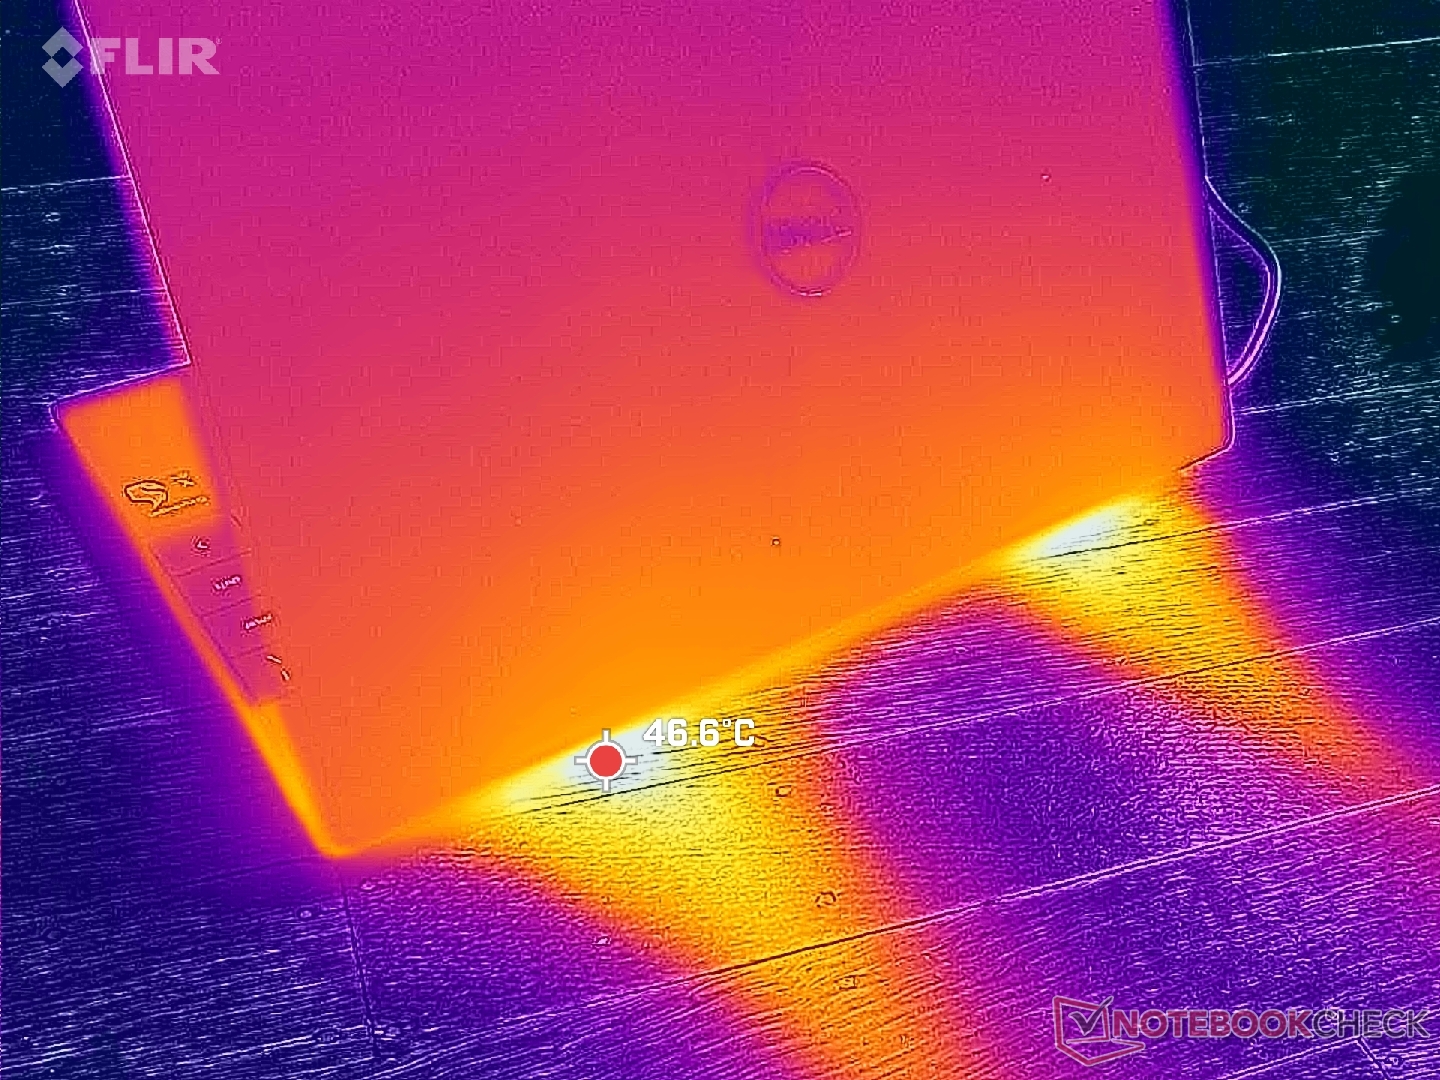
(-) De maximumtemperatuur aan de bovenzijde bedraagt 45.2 °C / 113 F, vergeleken met het gemiddelde van 35.9 °C / 97 F, variërend van 21.4 tot 59 °C voor de klasse Subnotebook.
(±) De bodem warmt op tot een maximum van 44.2 °C / 112 F, vergeleken met een gemiddelde van 39.2 °C / 103 F
(+) Bij onbelast gebruik bedraagt de gemiddelde temperatuur voor de bovenzijde 29.1 °C / 84 F, vergeleken met het apparaatgemiddelde van 30.8 °C / 87 F.
(+) De handpalmsteunen en het touchpad bereiken maximaal de huidtemperatuur (34.4 °C / 93.9 F) en zijn dus niet heet.
(-) De gemiddelde temperatuur van de handpalmsteun van soortgelijke toestellen bedroeg 28.2 °C / 82.8 F (-6.2 °C / -11.1 F).
| Dell XPS 13 9345 Qualcomm Snapdragon X Elite X1E-80-100, Qualcomm SD X Adreno X1-85 3.8 TFLOPS | Dell XPS 13 9340 Core Ultra 7 Intel Core Ultra 7 155H, Intel Arc 8-Core iGPU | Microsoft Surface Laptop 7 13.8 Copilot+ Qualcomm Snapdragon X Elite X1E-80-100, Qualcomm SD X Adreno X1-85 3.8 TFLOPS | Lenovo ThinkBook 13x G4 21KR0008GE Intel Core Ultra 5 125H, Intel Arc 7-Core iGPU | HP EliteBook Ultra G1q 14 Qualcomm Snapdragon X Elite X1E-78-100, Qualcomm SD X Adreno X1-85 3.8 TFLOPS | Asus ZenBook S13 OLED UX5304 Intel Core i7-1355U, Intel Iris Xe Graphics G7 96EUs | |
|---|---|---|---|---|---|---|
| Heat | 12% | 9% | 9% | 4% | 6% | |
| Maximum Upper Side * (°C) | 45.2 | 41 9% | 47.1 -4% | 43.1 5% | 40.8 10% | 43.1 5% |
| Maximum Bottom * (°C) | 44.2 | 43.5 2% | 44.6 -1% | 39.2 11% | 40.4 9% | 45 -2% |
| Idle Upper Side * (°C) | 30.4 | 25.3 17% | 24.7 19% | 28.3 7% | 32.2 -6% | 27.3 10% |
| Idle Bottom * (°C) | 31.6 | 25.5 19% | 24.5 22% | 28 11% | 31.2 1% | 27.8 12% |
* ... kleiner is beter
Luidsprekers
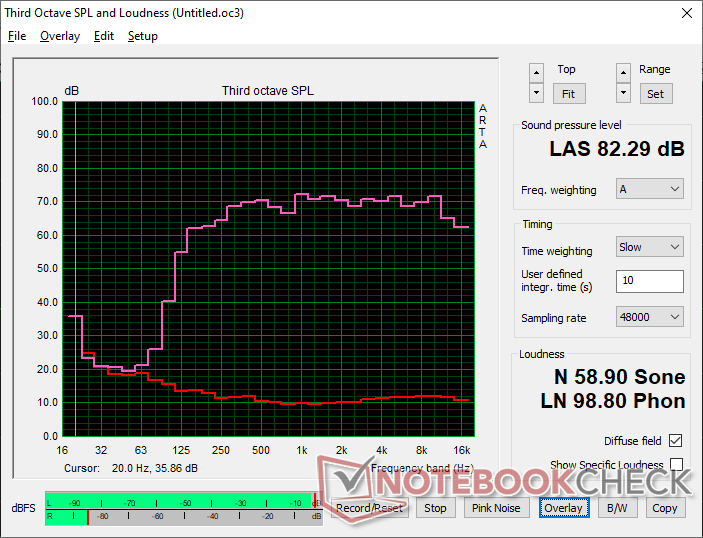
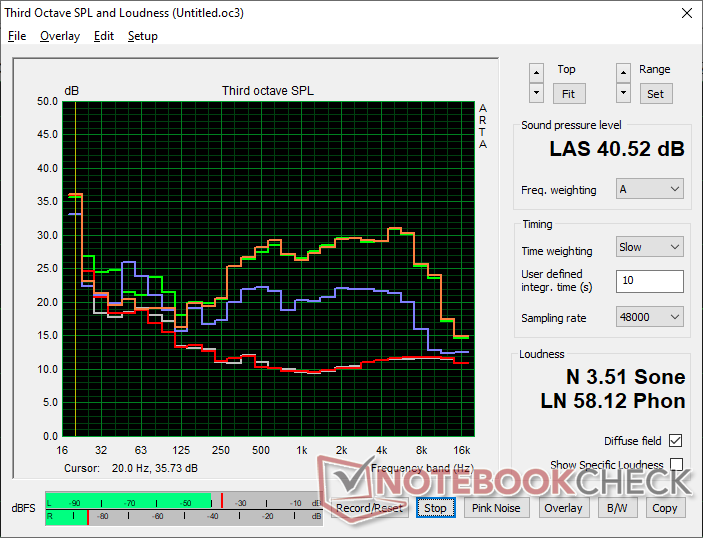
Dell XPS 13 9345 audioanalyse
(+) | luidsprekers kunnen relatief luid spelen (82.3 dB)
Bas 100 - 315 Hz
(±) | verminderde zeebaars - gemiddeld 9.9% lager dan de mediaan
(±) | lineariteit van de lage tonen is gemiddeld (12.4% delta ten opzichte van de vorige frequentie)
Midden 400 - 2000 Hz
(+) | evenwichtige middens - slechts 1.9% verwijderd van de mediaan
(+) | de middentonen zijn lineair (3.2% delta ten opzichte van de vorige frequentie)
Hoog 2 - 16 kHz
(+) | evenwichtige hoogtepunten - slechts 1.5% verwijderd van de mediaan
(+) | de hoge tonen zijn lineair (3% delta naar de vorige frequentie)
Algemeen 100 - 16.000 Hz
(+) | het totale geluid is lineair (8.2% verschil met de mediaan)
Vergeleken met dezelfde klasse
» 2% van alle geteste apparaten in deze klasse waren beter, 1% vergelijkbaar, 97% slechter
» De beste had een delta van 5%, het gemiddelde was 18%, de slechtste was 53%
Vergeleken met alle geteste toestellen
» 2% van alle geteste apparaten waren beter, 1% gelijk, 97% slechter
» De beste had een delta van 4%, het gemiddelde was 24%, de slechtste was 134%
Apple MacBook Pro 16 2021 M1 Pro audioanalyse
(+) | luidsprekers kunnen relatief luid spelen (84.7 dB)
Bas 100 - 315 Hz
(+) | goede baars - slechts 3.8% verwijderd van de mediaan
(+) | de lage tonen zijn lineair (5.2% delta naar de vorige frequentie)
Midden 400 - 2000 Hz
(+) | evenwichtige middens - slechts 1.3% verwijderd van de mediaan
(+) | de middentonen zijn lineair (2.1% delta ten opzichte van de vorige frequentie)
Hoog 2 - 16 kHz
(+) | evenwichtige hoogtepunten - slechts 1.9% verwijderd van de mediaan
(+) | de hoge tonen zijn lineair (2.7% delta naar de vorige frequentie)
Algemeen 100 - 16.000 Hz
(+) | het totale geluid is lineair (4.6% verschil met de mediaan)
Vergeleken met dezelfde klasse
» 0% van alle geteste apparaten in deze klasse waren beter, 0% vergelijkbaar, 100% slechter
» De beste had een delta van 5%, het gemiddelde was 17%, de slechtste was 45%
Vergeleken met alle geteste toestellen
» 0% van alle geteste apparaten waren beter, 0% gelijk, 100% slechter
» De beste had een delta van 4%, het gemiddelde was 24%, de slechtste was 134%
Energiebeheer
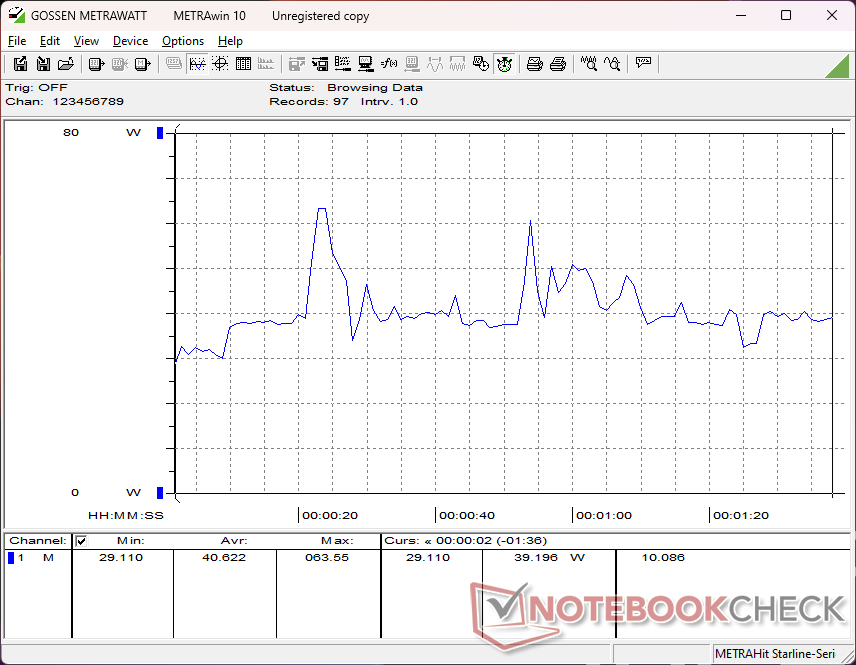
Stroomverbruik
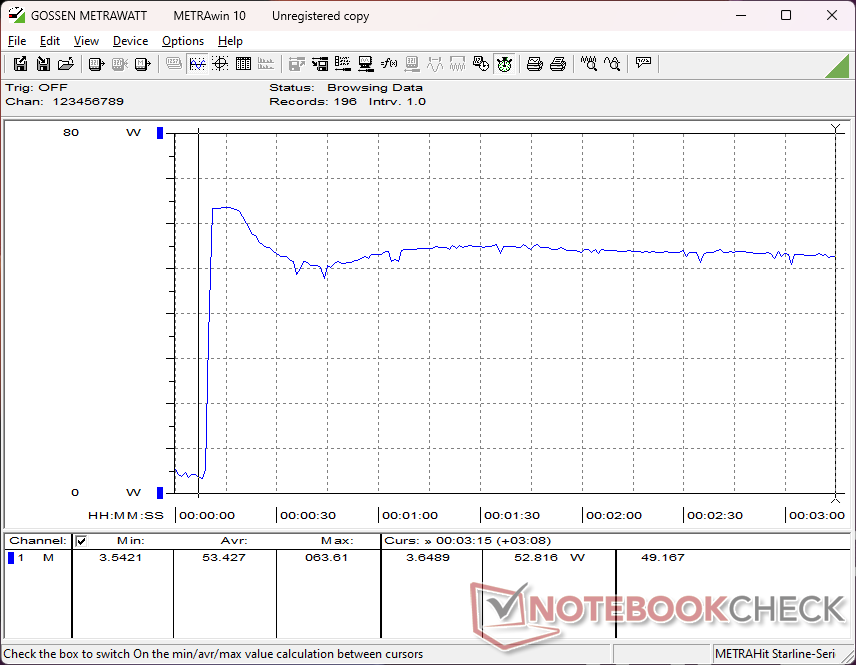
De metingen van het stroomverbruik laten enkele interessante resultaten zien in vergelijking met de Core Ultra 7 XPS 13. Bij gemiddelde of lagere belastingen vraagt onze Snapdragon XPS 13 consequent minder stroom dan de Intel-versie, wat de weg vrijmaakt voor een langere batterijlevensduur, zoals in de volgende sectie hieronder wordt geïllustreerd. Bij zwaardere belastingen, zoals games, zou het gemiddelde verbruik echter ongeveer hetzelfde zijn, rond de 40 W, ook al biedt de Core Ultra 7 over het algemeen snellere grafische prestaties.
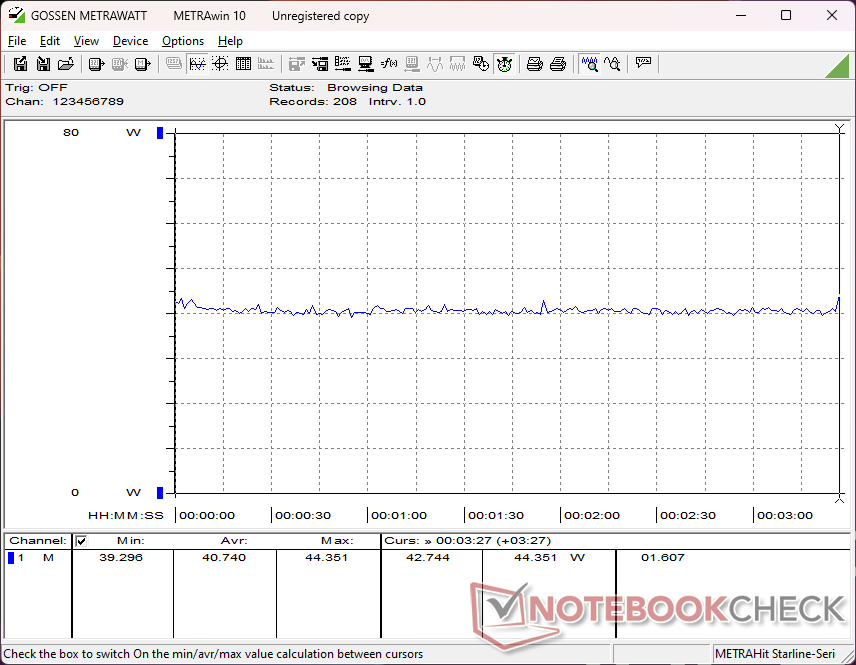
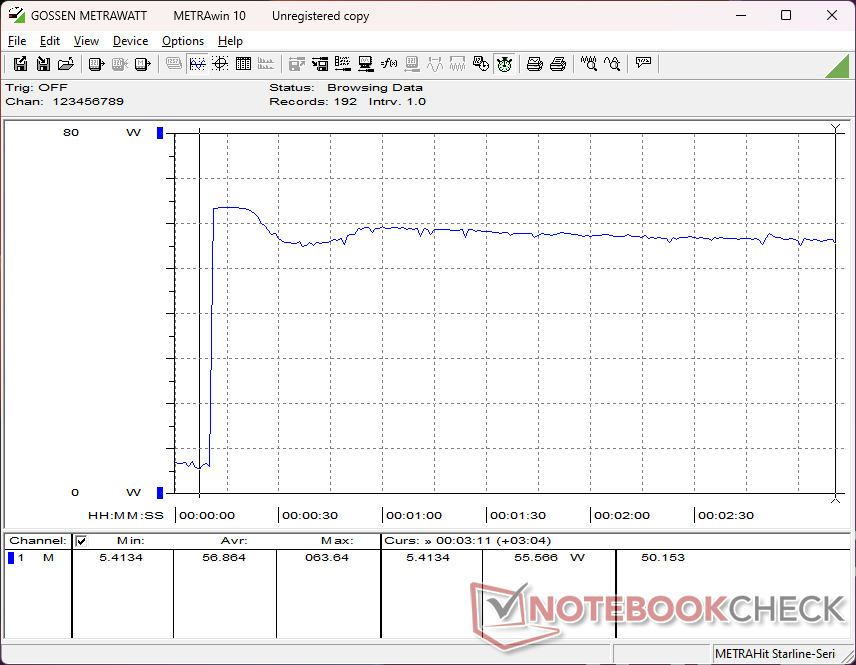
Het verbruik bij het draaien van Prime95 om de CPU te belasten, laat zien dat het Snapdragon-model gemiddeld meer stroom vraagt dan het Intel-model, omdat de laatste na verloop van tijd een hogere gaspedaalstand heeft. Aan de andere kant is het verbruik bij het uitvoeren van FurMark om de GPU te belasten gemiddeld slechts 18 W, vergeleken met 34 W of meer bij het Intel-model. Dit suggereert dat Qualcomm mogelijk minder oppervlakte of siliciumbudget besteedt aan zijn geïntegreerde GPU-ontwerp dan de concurrerende Arc 8-serie, die gemiddeld zowel krachtiger als veeleisender is.
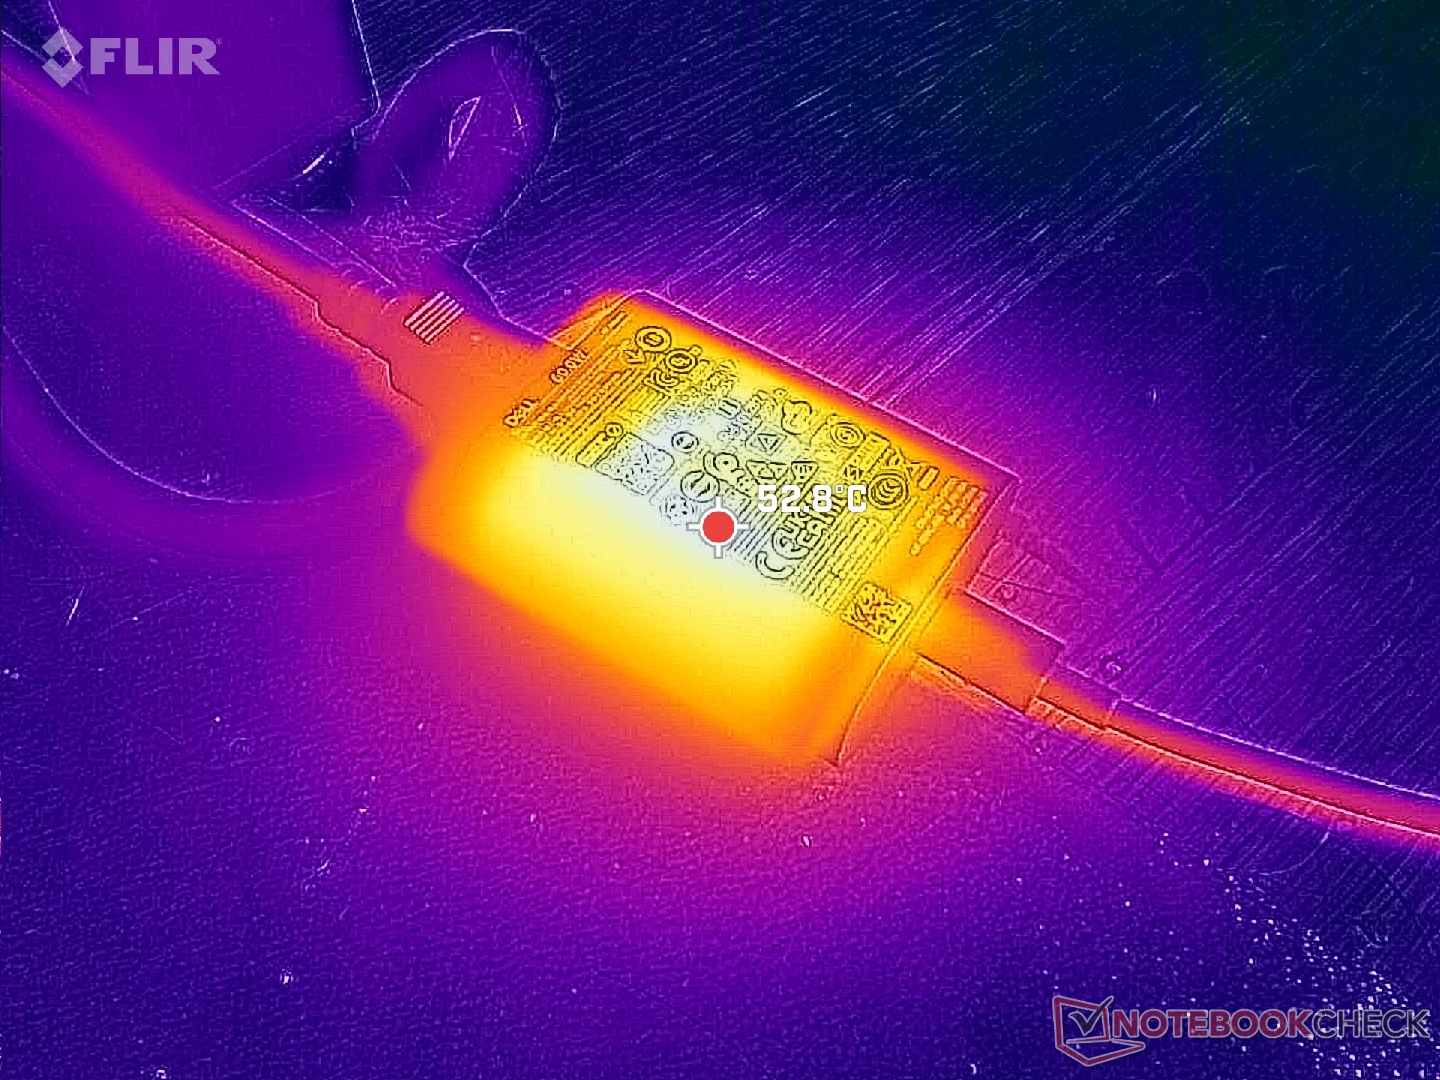
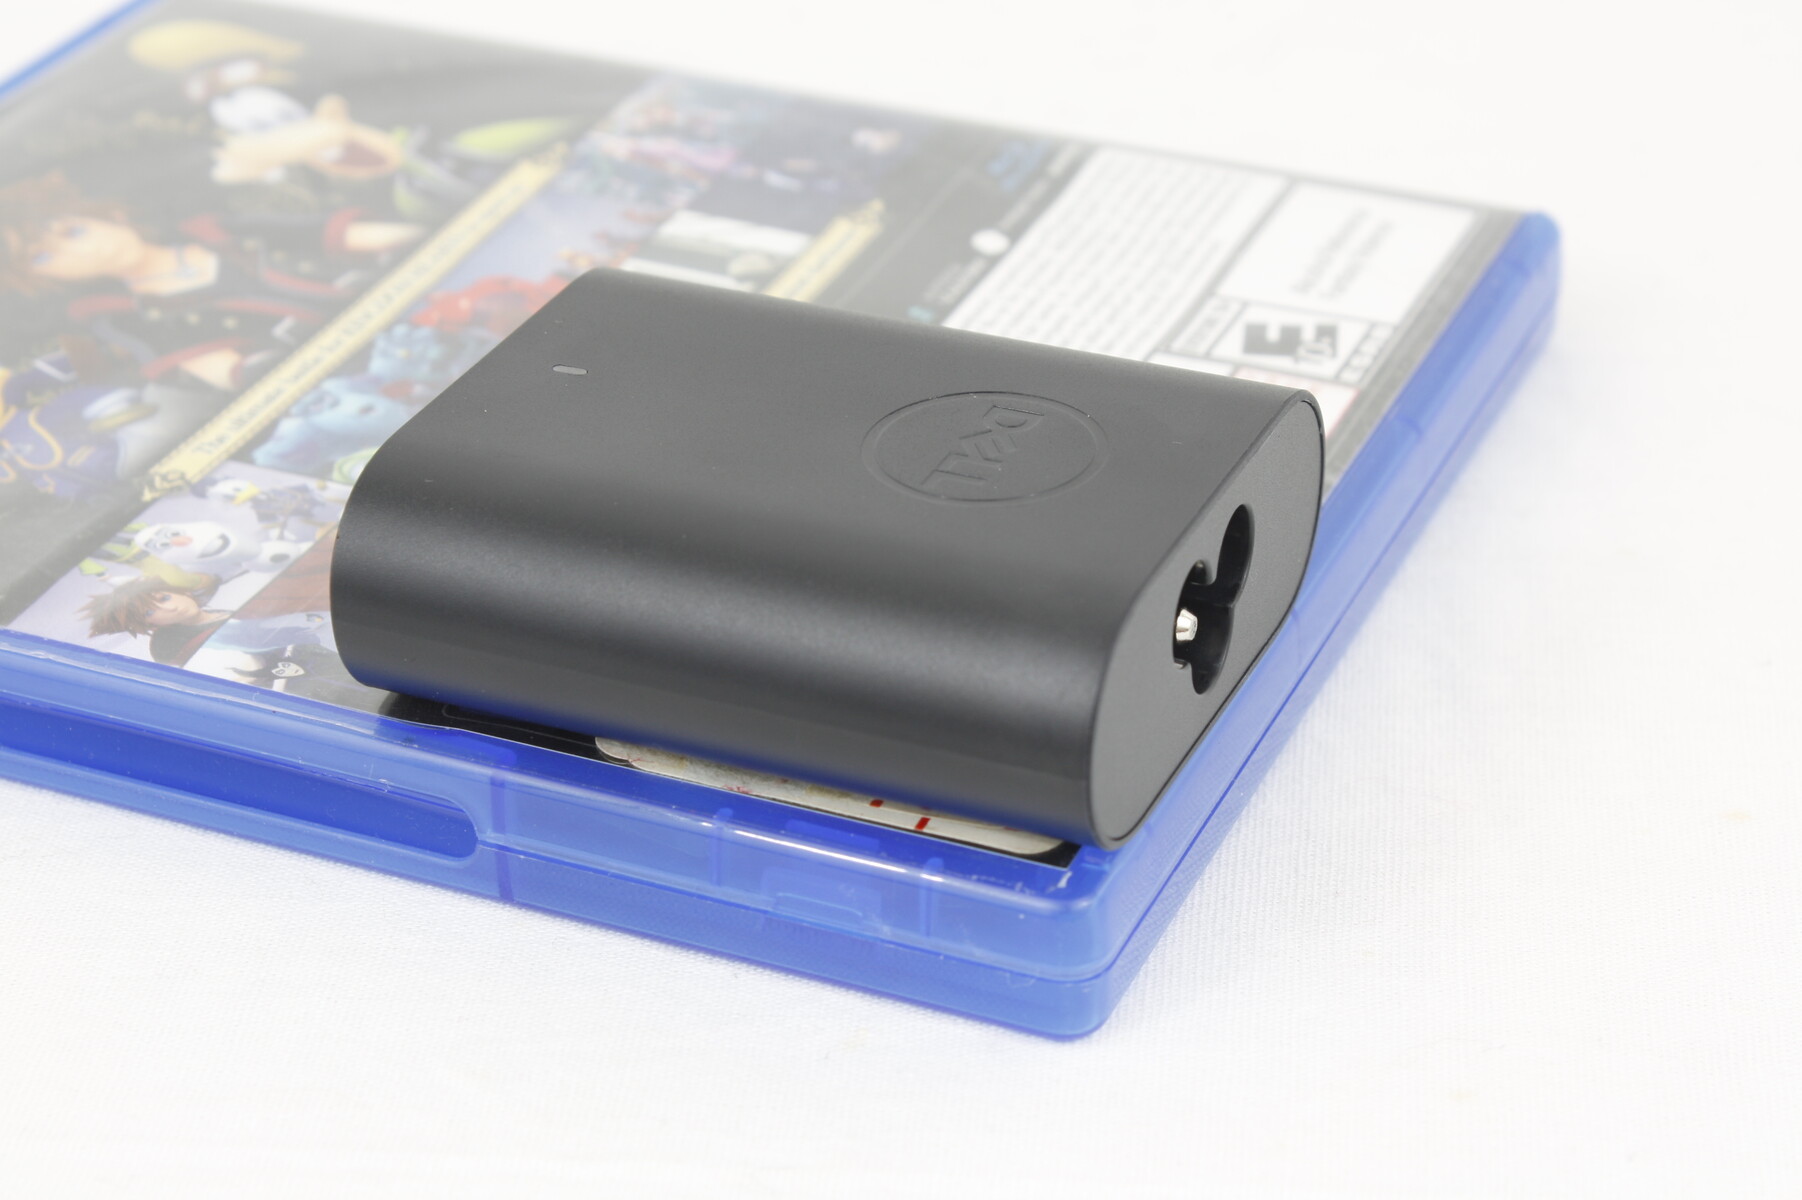
Het maximale verbruik kan 64 W bereiken met de extra kleine (~6,5 x 5,5 x 2,3 cm) 65 W USB-C AC-adapter, net als bij het Intel-model.
| Uit / Standby | |
| Inactief | |
| Belasting |
|
Key:
min: | |
| Dell XPS 13 9345 SD X Elite X1E-80-100, Adreno X1-85 3.8 TFLOPS, , IPS, 1920x1200, 13.4" | Dell XPS 13 9340 Core Ultra 7 Ultra 7 155H, Arc 8-Core, Micron 2550 512GB, IPS, 1920x1200, 13.4" | Microsoft Surface Laptop 7 13.8 Copilot+ SD X Elite X1E-80-100, Adreno X1-85 3.8 TFLOPS, Samsung MZ9L4512HBLU-00BMV, IPS, 2304x1536, 13.8" | Lenovo ThinkBook 13x G4 21KR0008GE Ultra 5 125H, Arc 7-Core, Samsung PM9C1a MZAL8512HDLU, IPS, 2880x1920, 13.5" | HP EliteBook Ultra G1q 14 SD X Elite X1E-78-100, Adreno X1-85 3.8 TFLOPS, SK hynix PC801 HFS512GEJ9X101N BF, IPS, 2240x1400, 14" | Asus ZenBook S13 OLED UX5304 i7-1355U, Iris Xe G7 96EUs, Samsung PM9A1 MZVL21T0HCLR, OLED, 2880x1800, 13.3" | |
|---|---|---|---|---|---|---|
| Power Consumption | -27% | 11% | -48% | 11% | -43% | |
| Idle Minimum * (Watt) | 2.8 | 3.8 -36% | 1.4 50% | 5.4 -93% | 2.5 11% | 5.8 -107% |
| Idle Average * (Watt) | 4.9 | 7 -43% | 6.3 -29% | 7.8 -59% | 5.7 -16% | 8.5 -73% |
| Idle Maximum * (Watt) | 5.7 | 7.3 -28% | 7.6 -33% | 8.9 -56% | 5.8 -2% | 8.8 -54% |
| Load Average * (Watt) | 40.6 | 52.6 -30% | 26.9 34% | 49.4 -22% | 24.2 40% | 35.1 14% |
| Cyberpunk 2077 ultra external monitor * (Watt) | 39.4 | 26.8 32% | ||||
| Cyberpunk 2077 ultra * (Watt) | 40.7 | 38.5 5% | 33.5 18% | |||
| Load Maximum * (Watt) | 64 | 62.7 2% | 40.7 36% | 68.8 -8% | 66.4 -4% | 59.5 7% |
| Witcher 3 ultra * (Watt) | 38.3 | 44.4 | 23.1 | 27.6 |
* ... kleiner is beter
Power Consumption Cyberpunk / Stress Test
Power Consumption external Monitor
Levensduur batterij
Als er iets is waar het systeem duidelijk in uitblinkt, dan is het wel de batterijlevensduur. We hebben een echte WLAN-browserduur van bijna 26,5 uur geregistreerd, oftewel 2x langer dan de XPS 13 9340 die is uitgerust met de Core Ultra 7 155H en een identiek 1200p IPS-scherm. De runtimes zullen gegarandeerd korter zijn als deze geconfigureerd zijn met het OLED-scherm, maar ze zullen desondanks ongelooflijk lang zijn en een van de langste van alle 13-inch subnotebooks, inclusief zelfs de MacBook Air serie.
Onze test werd uitgevoerd na het toepassen van de nieuwste BIOS-update van Dell, die speciaal ontworpen is om de batterijduur op het Snapdragon-model te verbeteren. Wij raden u aan de update hier te installeren.
Het opladen van een lege naar een volle batterij duurt iets meer dan 90 minuten, wat bij de meeste laptops gebruikelijk is.
| Dell XPS 13 9345 SD X Elite X1E-80-100, Adreno X1-85 3.8 TFLOPS, 55 Wh | Dell XPS 13 9340 Core Ultra 7 Ultra 7 155H, Arc 8-Core, 55 Wh | Microsoft Surface Laptop 7 13.8 Copilot+ SD X Elite X1E-80-100, Adreno X1-85 3.8 TFLOPS, 54 Wh | Lenovo ThinkBook 13x G4 21KR0008GE Ultra 5 125H, Arc 7-Core, 74 Wh | HP EliteBook Ultra G1q 14 SD X Elite X1E-78-100, Adreno X1-85 3.8 TFLOPS, 59 Wh | Asus ZenBook S13 OLED UX5304 i7-1355U, Iris Xe G7 96EUs, 63 Wh | |
|---|---|---|---|---|---|---|
| Batterijduur | 34% | -8% | 17% | 1% | 42% | |
| Reader / Idle (h) | 46.4 | 20.4 -56% | ||||
| WiFi v1.3 (h) | 26.4 | 12.8 -52% | 14.2 -46% | 11.4 -57% | 13.2 -50% | 11.3 -57% |
| Load (h) | 1 | 2.2 120% | 1.3 30% | 1.9 90% | 2.1 110% | 2.4 140% |
| H.264 (h) | 17.6 | 19.7 | 20.5 | 13.8 |
Pro
Contra
Verdict - Respectabel alternatief voor de Intel XPS 13
De Snapdragon XPS 13 van $1300 is iets goedkoper dan de $1400 Core Ultra 7 XPS 13 met een aanzienlijk langere batterijlevensduur, Co-Pilot+ integratie en identieke hardwarefuncties. De daadwerkelijke gebruikerservaring zal echter sterk afhangen van de werkbelasting en de toepassing. Als de Snapdragon XPS 13 voornamelijk wordt gebruikt voor browsen, tekstverwerken, video en streaming, dan is deze meestal efficiënter, vooral als de programma's direct op ARM kunnen draaien. Aan de andere kant zouden veeleisendere taken zoals grafisch bewerken, video coderen, Thunderbolt docking, of specifieke toepassingen die op ARM geëmuleerd moeten worden, het beste op de traditionele Intel XPS 13 passen. In dat opzicht biedt het Intel-model een voorspelbaarder prestatieniveau in alle gebruiksscenario's, wat waarschijnlijk opweegt tegen de paar randgevallen waarin het Snapdragon-model een streepje voor heeft.
De Snapdragon XPS 13 is een geweldig alternatief voor de Intel XPS 13, dollar voor dollar. De gebruikerservaring zal echter sterk variëren, afhankelijk van het soort toepassingen en taken waarvoor u het systeem wilt gebruiken.
De voordelen op het gebied van batterijlevensduur en Co-Pilot+ compatibiliteit zijn misschien niet genoeg om kopers te overtuigen, wanneer de batterijlevensduur met de Intel XPS 13 al behoorlijk goed is en Co-Pilot+ naar verwachting naar toekomstige Intel en AMD CPU's zal komen. Gebruikers die echter de runtimes willen maximaliseren en de nieuwste Microsoft AI-functies willen ervaren, vinden de Snapdragon XPS 13 misschien wel de meest productieve optie.
Prijs en beschikbaarheid
Dell levert de XPS 13 9345 nu geconfigureerd voor $1300 tot $1800+ indien geconfigureerd met het OLED-paneel.
Hinweis: We hebben ons beoordelingssysteem kürzlich geactualiseerd en de resultaten van versie 8 zijn niet vergelijkbaar met de resultaten van versie 7. Meer informatie vindt u hier beschikbaar.
Opmerking: We hebben ons beoordelingssysteem onlangs bijgewerkt en de resultaten van versie 8 zijn niet vergelijkbaar met de resultaten van versie 7. Meer informatie is beschikbaar hier .
Dell XPS 13 9345
- 04-08-2024 v8
Allen Ngo
 Total Sustainability Score:
 Transparantie
De selectie van te beoordelen apparaten wordt gemaakt door onze redactie. Het testexemplaar werd ten behoeve van deze beoordeling door de fabrikant of detailhandelaar in bruikleen aan de auteur verstrekt. De kredietverstrekker had geen invloed op deze recensie, noch ontving de fabrikant vóór publicatie een exemplaar van deze recensie. Er bestond geen verplichting om deze recensie te publiceren. Als onafhankelijk mediabedrijf is Notebookcheck niet onderworpen aan het gezag van fabrikanten, detailhandelaren of uitgevers.
[transparency_disclaimer]Dit is hoe Notebookcheck test
Elk jaar beoordeelt Notebookcheck onafhankelijk honderden laptops en smartphones met behulp van gestandaardiseerde procedures om ervoor te zorgen dat alle resultaten vergelijkbaar zijn. We hebben onze testmethoden al zo'n 20 jaar voortdurend ontwikkeld en daarbij de industriestandaard bepaald. In onze testlaboratoria wordt gebruik gemaakt van hoogwaardige meetapparatuur door ervaren technici en redacteuren. Deze tests omvatten een validatieproces in meerdere fasen. Ons complexe beoordelingssysteem is gebaseerd op honderden goed onderbouwde metingen en benchmarks, waardoor de objectiviteit behouden blijft. Meer informatie over onze testmethoden kunt u hier vinden.
Price comparison

