Notebookcheck Logo

Intel Arc 8-Core iGPU

Intel Arc 8-Core

De Intel Arc iGPU met 8 cores (ID 7D55) is een geïntegreerde grafische kaart in Meteor Lake SoC's op basis van de Xe LPG-architectuur (vergelijkbaar met de speciale Arc GPU's, maar met een focus op efficiëntie). Het biedt alle 8 Xe cores (128 Xe vector engines), 8 ray tracing units, 8 samplers en 4 pixel backends.

De Arc naam mag alleen worden gebruikt als er minstens 16 GB RAM wordt gebruikt in dual channel modus. Anders heet de enige iGPU "Intel Graphics" en is deze ook aanzienlijk langzamer.

Volgens Intel zijn de prestaties verdubbeld ten opzichte van de vorige generatie (waarschijnlijk nog in Alder Lake).

De iGPU ondersteunt DirectX 12 Ultimate (waarschijnlijk DX 12_2 zoals de desktop Arc GPU's). De grafische eenheid ondersteunt ook XeSS AI Super Sampling.

De media-engine van Meteor Lake zit in de SOC-tegel en ondersteunt tot 8k60 10-bit HDR coderen en decoderen van MPEG2, AVC, VP9, HEVC en AV1. De display-engine bevindt zich ook in de SoC-tegel en ondersteunt HDMI 2.1 en DisplayPort 2.1 20G met maximaal 8K60 HDR.

De GPU-tegel van de Meteor Lake-chip is vervaardigd bij TSMC in 5nm (5N-proces).

Arc LPG Serie

Arc 8-Core 8 @ 2.3 GHz
Arc 7-Core 7 @ 2.2 GHz
Graphics 4-Core 4 @ 1.95 GHz
CodenaamMeteor Lake iGPU
ArchitectuurXe LPG
Pipelines8 - verenigd
Raytracing Cores8
Core-snelheid2300 (Boost) MHz
CacheL1: 1.5 MB
Gedeeld geheugenja
APIDirectX 12_2, OpenGL 4.6, Vulkan 1.3
technologie5 nm
DisplaysHDMI 2.1b, DisplayPort 2.0 20G
Aangekondigde datum14.12.2023
CPU in Arc 8-CoreGPU Base SpeedGPU Boost / Turbo
Intel Core Ultra 9 185H16 x 3800 MHz, 45 W? MHz2350 MHz
Intel Core Ultra 7 165H16 x 3800 MHz, 28 W? MHz2300 MHz
Intel Core Ultra 7 155H16 x 3800 MHz, 28 W? MHz2250 MHz
Intel Core Ultra 5 135H14 x 3600 MHz, 28 W? MHz2200 MHz
min. - max.? MHz2200 - 2350 MHz

Benchmarks

Performance Rating - 3DMark 11 + Fire Strike + Time Spy
3.8 pt (11%)
AMD Radeon HD 8180
0.06404 -98%
...
NVIDIA Quadro M4000M
3.41 -10%
NVIDIA GeForce GTX 1050 Ti Mobile
3.42 -10%
3.44 -9%
3.5 -7%
3.53 -7%
3.59 -5%
3.65 -3%
3.74 -1%
3.74 -1%
Intel Arc 8-Core iGPU
3.78
3.85 2%
3.96 5%
4.08 8%
NVIDIA Quadro P3000
4.09 8%
4.11 9%
4.23 12%
4.28 13%
4.39 16%
4.46 18%
...
20.4 440%
max:
33.3 781%
0%
100%
3DMark - 3DMark Time Spy Score
min: 2178     gem: 3553     mediaan: 3627.5 (10%)     max: 4176 Points
3DMark - 3DMark Time Spy Graphics
min: 2018     gem: 3231     mediaan: 3277 (9%)     max: 3770 Points
Intel UHD Graphics 605
113 -97%
...
2993 -7%
2995 -7%
2998 -7%
3075 -5%
NVIDIA Quadro T2000 Max-Q
3094 -4%
3123 -3%
3139 -3%
3155 -2%
3197 -1%
Intel Arc 8-Core iGPU
3231
3242 0%
3269 1%
3324 3%
3364 4%
3430 6%
3492 8%
AMD Radeon RX 580 (Laptop)
3505 8%
3526 9%
AMD Radeon RX 5300M
3567 10%
...
19434 501%
max:
36259 1022%
0%
100%
3DMark - 3DMark Ice Storm Unlimited Graphics
min: 397122     gem: 410287     mediaan: 408060 (41%)     max: 427906 Points
3DMark - 3DMark Ice Storm Extreme Graphics
min: 78589     gem: 142909     mediaan: 159691 (19%)     max: 163878 Points
3DMark - 3DMark Cloud Gate Score
min: 18794     gem: 31259     mediaan: 31963 (30%)     max: 37020 Points
3DMark - 3DMark Cloud Gate Graphics
min: 31876     gem: 43407     mediaan: 44226 (11%)     max: 52200 Points
3DMark - 3DMark Fire Strike Standard Score
min: 5203     gem: 7620     mediaan: 7879 (13%)     max: 9084 Points
3DMark - 3DMark Fire Strike Standard Graphics
min: 5568     gem: 8302     mediaan: 8561 (10%)     max: 9692 Points
3DMark - 3DMark Ice Storm Graphics
min: 88046     gem: 177853     mediaan: 190075 (21%)     max: 215292 Points
3DMark - 3DMark Wild Life Extreme Unlimited
min: 4294     gem: 6018     mediaan: 6363 (7%)     max: 6686 Points
3DMark - 3DMark Night Raid
min: 13461     gem: 25851     mediaan: 27400 (26%)     max: 29487 Points
3DMark - 3DMark Night Raid Graphics Score
min: 25821     gem: 33139     mediaan: 34198.5 (13%)     max: 36983 Points
3DMark 11 - 3DM11 Performance Score
min: 7756     gem: 11999     mediaan: 12415 (16%)     max: 13943 Points
3DMark 11 - 3DM11 Performance GPU
min: 8064     gem: 11984     mediaan: 12375 (11%)     max: 13716 Points
AMD Radeon HD 6250
171.8 -99%
...
10952 -9%
11119 -7%
11171 -7%
11305 -6%
11314 -6%
NVIDIA Quadro T2000 Max-Q
11461 -4%
11796 -2%
11893 -1%
11915 -1%
Intel Arc 8-Core iGPU
11984
12066 1%
12289 3%
12467 4%
12479 4%
NVIDIA Quadro P3000
12583 5%
12797 7%
12801 7%
13160 10%
13515 13%
...
59943 400%
max:
104201 770%
0%
100%
3DMark Vantage
3DM Vant. Perf. total +
3DMark Vantage - 3DM Vant. Perf. total
min: 38739     gem: 41084     mediaan: 41223 (12%)     max: 43259 Points
3DM Vant. Perf. GPU no PhysX +
3DMark Vantage - 3DM Vant. Perf. GPU no PhysX
min: 33028     gem: 36137     mediaan: 36546 (20%)     max: 39184 Points
3DMark 05 - 3DMark 05 - Standard
min: 42967     gem: 47870     mediaan: 47115 (52%)     max: 53214 Points
133.4 -100%
...
37669 -21%
AMD Radeon RX Vega 7
38073 -20%
38999 -19%
39066 -18%
43138 -10%
AMD Radeon 660M
43616 -9%
AMD Radeon 680M
43633 -9%
44877 -6%
NVIDIA GeForce RTX 3070 Laptop GPU
46269 -3%
Intel Arc 8-Core iGPU
47870
NVIDIA GeForce RTX 3060 Laptop GPU
48758 2%
50971 6%
52117 9%
NVIDIA GeForce RTX 3080 Laptop GPU
54320 13%
54811 14%
55811 17%
58138 21%
61850 29%
61993 30%
...
68064 42%
max:
87172 82%
0%
100%
3DMark 06 3DMark 06 - Standard 1280x1024 +
3DMark 06
min: 34184     gem: 36714     mediaan: 36636.5 (48%)     max: 38214 Points
Unigine Valley 1.0 - Unigine Valley 1.0 DX
min: 17.1     gem: 19     mediaan: 19.5 (6%)     max: 20.1 fps
SPECviewperf 12
specvp12 sw-03 +
SPECviewperf 12 - specvp12 sw-03
min: 42.7     gem: 42.9     mediaan: 42.9 (11%)     max: 43 fps
specvp12 snx-02 +
SPECviewperf 12 - specvp12 snx-02
min: 3.29     gem: 3.4     mediaan: 3.4 (1%)     max: 3.56 fps
specvp12 showcase-01 +
SPECviewperf 12 - specvp12 showcase-01
min: 18.2     gem: 19.1     mediaan: 19.1 (4%)     max: 19.9 fps
specvp12 mediacal-01 +
SPECviewperf 12 - specvp12 mediacal-01
min: 15.9     gem: 16.4     mediaan: 16.4 (4%)     max: 16.9 fps
specvp12 maya-04 +
SPECviewperf 12 - specvp12 maya-04
min: 54.9     gem: 56.5     mediaan: 56.5 (15%)     max: 58 fps
specvp12 energy-01 +
SPECviewperf 12 - specvp12 energy-01
min: 0.67     gem: 0.8     mediaan: 0.8 (1%)     max: 0.91 fps
specvp12 creo-01 +
SPECviewperf 12 - specvp12 creo-01
min: 22.7     gem: 22.9     mediaan: 22.9 (9%)     max: 23.1 fps
specvp12 catia-04 +
SPECviewperf 12 - specvp12 catia-04
min: 48.2     gem: 49.8     mediaan: 49.8 (8%)     max: 51.3 fps
specvp12 3dsmax-05 +
SPECviewperf 12 - specvp12 3dsmax-05
min: 49.7     gem: 49.8     mediaan: 49.8 (9%)     max: 49.8 fps
SPECviewperf 13 specvp13 sw-04 +
SPECviewperf 13 - specvp13 sw-04
min: 44.8     gem: 45.2     mediaan: 45.2 (12%)     max: 45.6 fps
specvp13 snx-03 +
SPECviewperf 13 - specvp13 snx-03
min: 5.9     gem: 6.2     mediaan: 6.2 (1%)     max: 6.43 fps
specvp13 showcase-02 +
SPECviewperf 13 - specvp13 showcase-02
min: 18.2     gem: 19.1     mediaan: 19.1 (4%)     max: 19.9 fps
specvp13 medical-02 +
SPECviewperf 13 - specvp13 medical-02
min: 25     gem: 27.4     mediaan: 27.4 (6%)     max: 29.7 fps
specvp13 maya-05 +
SPECviewperf 13 - specvp13 maya-05
min: 59.5     gem: 61     mediaan: 61 (7%)     max: 62.5 fps
specvp13 energy-02 +
SPECviewperf 13 - specvp13 energy-02
min: 5.27     gem: 5.5     mediaan: 5.5 (2%)     max: 5.69 fps
specvp13 creo-02 +
SPECviewperf 13 - specvp13 creo-02
min: 29.3     gem: 29.5     mediaan: 29.5 (4%)     max: 29.6 fps
specvp13 catia-05 +
SPECviewperf 13 - specvp13 catia-05
min: 71.6     gem: 74.2     mediaan: 74.2 (8%)     max: 76.8 fps
specvp13 3dsmax-06 +
SPECviewperf 13 - specvp13 3dsmax-06
min: 46.4     gem: 47.5     mediaan: 47.5 (8%)     max: 48.5 fps
SPECviewperf 2020 specvp2020 snx-04 1080p +
SPECviewperf 2020 - specvp2020 snx-04 1080p
min: 5.56     gem: 5.8     mediaan: 5.8 (1%)     max: 5.94 fps
specvp2020 medical-03 1080p +
SPECviewperf 2020 - specvp2020 medical-03 1080p
min: 14.7     gem: 16.7     mediaan: 17.6 (12%)     max: 17.8 fps
specvp2020 maya-06 1080p +
SPECviewperf 2020 - specvp2020 maya-06 1080p
min: 86.9     gem: 88.1     mediaan: 87.6 (10%)     max: 89.9 fps
specvp2020 energy-03 1080p +
SPECviewperf 2020 - specvp2020 energy-03 1080p
min: 5.5     gem: 6.1     mediaan: 6.3 (4%)     max: 6.4 fps
specvp2020 creo-03 1080p +
SPECviewperf 2020 - specvp2020 creo-03 1080p
min: 24.5     gem: 26     mediaan: 26 (13%)     max: 27.6 fps
specvp2020 catia-06 1080p +
SPECviewperf 2020 - specvp2020 catia-06 1080p
min: 17.7     gem: 18.4     mediaan: 18.1 (11%)     max: 19.5 fps
specvp2020 3dsmax-07 1080p +
SPECviewperf 2020 - specvp2020 3dsmax-07 1080p
min: 21.6     gem: 23.4     mediaan: 22.6 (7%)     max: 26.1 fps
specvp2020 solidworks-05 4k +
SPECviewperf 2020 - specvp2020 solidworks-05 4k
min: 11     gem: 11.6     mediaan: 11.6 (3%)     max: 12.1 fps
specvp2020 snx-04 4k +
SPECviewperf 2020 - specvp2020 snx-04 4k
min: 5.37     gem: 5.7     mediaan: 5.7 (1%)     max: 6.24 fps
specvp2020 medical-03 4k +
SPECviewperf 2020 - specvp2020 medical-03 4k
min: 4.23     gem: 5.8     mediaan: 5.7 (5%)     max: 7.07 fps
specvp2020 maya-06 4k +
SPECviewperf 2020 - specvp2020 maya-06 4k
min: 35.4     gem: 38     mediaan: 37.7 (6%)     max: 41 fps
specvp2020 energy-03 4k +
SPECviewperf 2020 - specvp2020 energy-03 4k
min: 4.25     gem: 5     mediaan: 4.9 (1%)     max: 6.03 fps
specvp2020 creo-03 4k +
SPECviewperf 2020 - specvp2020 creo-03 4k
min: 17.9     gem: 18.6     mediaan: 18.5 (9%)     max: 19.8 fps
specvp2020 catia-06 4k +
SPECviewperf 2020 - specvp2020 catia-06 4k
min: 10     gem: 11.1     mediaan: 11.2 (7%)     max: 11.7 fps
specvp2020 3dsmax-07 4k +
SPECviewperf 2020 - specvp2020 3dsmax-07 4k
min: 12.9     gem: 14.4     mediaan: 14.8 (6%)     max: 15.5 fps
Cinebench R10 Cinebench R10 Shading (32bit) +
Cinebench R11.5 Cinebench R11.5 OpenGL 64 Bit +
Cinebench R11.5 - Cinebench R11.5 OpenGL 64 Bit
min: 97.07     gem: 107     mediaan: 108 (36%)     max: 115.68 fps
Cinebench R15
Cinebench R15 OpenGL 64 Bit +
Cinebench R15 - Cinebench R15 OpenGL 64 Bit
min: 132.8     gem: 152.3     mediaan: 152.6 (9%)     max: 176.3 fps
Cinebench R15 OpenGL Ref. Match 64 Bit +
Cinebench R15 - Cinebench R15 OpenGL Ref. Match 64 Bit
97.8 % (98%)
GFXBench - GFXBench 5.0 4K Aztec Ruins High Tier Offscreen
min: 36.6     gem: 39.6     mediaan: 40.5 (16%)     max: 41.6 fps
GFXBench - GFXBench 5.0 Aztec Ruins High Tier Offscreen
min: 83.4     gem: 87.5     mediaan: 87.5 (16%)     max: 91.5 fps
3.3 -96%
...
NVIDIA Quadro T2000 Max-Q
64.8 -26%
65.5 -25%
Apple M1 7-Core GPU
72.4 -17%
Apple M1 8-Core GPU
74.3 -15%
78.4 -10%
78.8 -10%
80.5 -8%
84.6 -3%
87.1 0%
Intel Arc 8-Core iGPU
87.5
89.3 2%
Apple M2 8-Core GPU
91 4%
93.2 7%
94.7 8%
Apple M2 10-Core GPU
96 10%
96.8 11%
Apple M3 8-Core GPU
101.7 16%
102.9 18%
104 19%
...
536 513%
0%
100%
GFXBench - GFXBench 5.0 Aztec Ruins Normal Tier Offscreen
min: 206.4     gem: 216.5     mediaan: 210 (16%)     max: 233.2 fps
GFXBench - GFXBench Car Chase Offscreen
167.1 fps (19%)
GFXBench (DX / GLBenchmark) 2.7
GFXBench T-Rex HD Offscreen C24Z16 +
GFXBench (DX / GLBenchmark) 2.7 - GFXBench T-Rex HD Offscreen C24Z16
817 fps (7%)
Basemark GPU 1.2 - Basemark GPU 1.2 Vulkan Official Medium Offscreen 1080
min: 104.6     gem: 282.3     mediaan: 295.5 (2%)     max: 1992 fps
Basemark GPU 1.2 - Basemark GPU 1.2 Vulkan Official High Offscreen 2160
min: 3.64     gem: 18.7     mediaan: 3.6 (1%)     max: 176.8 fps
Geekbench 6.3 - Geekbench 6.3 GPU OpenCL
min: 17911     gem: 32332     mediaan: 34782 (10%)     max: 39941 punten
Geekbench 6.3 - Geekbench 6.3 GPU Vulkan
min: 16515     gem: 31483     mediaan: 33364 (9%)     max: 37129 punten
LuxMark v2.0 64Bit - LuxMark v2.0 Room GPU
min: 549     gem: 670     mediaan: 683.5 (2%)     max: 747 Samples/s
LuxMark v2.0 64Bit - LuxMark v2.0 Sala GPU
min: 2319     gem: 2665     mediaan: 2671.5 (5%)     max: 2927 Samples/s
ComputeMark v2.1 - ComputeMark v2.1 Result
min: 6270     gem: 7207     mediaan: 7537 (8%)     max: 7963 punten
Power Consumption - Furmark Stress Test Power Consumption - external Monitor *
min: 35     gem: 50.7     mediaan: 50.3 (7%)     max: 69.6 Watt
051015202530354045505560657075Tooltip
Power Consumption - The Witcher 3 Power Consumption - external Monitor *
min: 27     gem: 44.2     mediaan: 44.1 (6%)     max: 61 Watt
05101520253035404550556065707580Tooltip
Power Consumption - Witcher 3 Power Consumption *
min: 29.7     gem: 47.7     mediaan: 46.7 (10%)     max: 64.6 Watt
05101520253035404550556065707580Tooltip
Power Consumption - Witcher 3 ultra Power Efficiency
min: 0.3826     gem: 0.5     mediaan: 0.5 (45%)     max: 1.108 fps per Watt
Power Consumption - Witcher 3 ultra Power Efficiency - external Monitor
min: 0.4246     gem: 0.6     mediaan: 0.5 (44%)     max: 1.207 fps per Watt
Power Consumption - Cyberpunk 2077 Power Consumption 150cd *
min: 38.8     gem: 58.8     mediaan: 55.5 (18%)     max: 76.7 Watt
051015202530354045505560657075Tooltip
Power Consumption - Cyberpunk 2077 Power Consumption - external Monitor *
min: 40.7     gem: 58.8     mediaan: 56.3 (7%)     max: 74.1 Watt
0510152025303540455055606570758085Tooltip
Power Consumption - Cyberpunk 2077 ultra Power Efficiency
min: 0.1867     gem: 0.3     mediaan: 0.2 (35%)     max: 0.4816 fps per Watt
Emissions Witcher 3 Fan Noise +
Emissions - Witcher 3 Fan Noise
min: 27     gem: 38.1     mediaan: 38 (61%)     max: 46.3 dB(A)
- Benchmarkresultaten voor deze videokaart
red legend - Gemiddelde benchmarkresultaten voor deze videokaart
* Kleinere getallen betekenen een hogere prestatie

Game Benchmarks

De volgende benchmarks zijn afgeleid van onze laptop-testrapporten. De prestaties variëren afhankelijk van het gebruikte grafische geheugen, kloksnelheid, processor, systeeminstellingen, drivers en besturingssysteem. De resultaten zijn daarom niet noodzakelijk representatief voor alle laptops met deze GPU. Voor meer gedetailleerde informatie over de benchmarkresultaten, klik op het fps-aantal.

lage 1920x1080
40.2  fps    + Vergelijk + 📈 Graph
gem. 1920x1080
27.2  fps    + Vergelijk + 📈 Graph
hoge 1920x1080
18.9  fps    + Vergelijk + 📈 Graph
ultra 1920x1080
14  fps    + Vergelijk + 📈 Graph
» Met alle geteste laptops speelbaar met lage instellingen.
Additional Benchmarks
Low Preset 1280x720
46.2
lage 1920x1080
75.8  fps    + Vergelijk + 📈 Graph
gem. 1920x1080
55.4  fps    + Vergelijk + 📈 Graph
hoge 1920x1080
45  fps    + Vergelijk + 📈 Graph
ultra 1920x1080
43.1  fps    + Vergelijk + 📈 Graph
» Met alle geteste laptops speelbaar met ultra instellingen.
Additional Benchmarks
Low Settings 1280x720
119.2
lage 1920x1080
10.6  fps    + Vergelijk + 📈 Graph
gem. 1920x1080
10.4  fps    + Vergelijk + 📈 Graph
hoge 1920x1080
10.1  fps    + Vergelijk + 📈 Graph
ultra 1920x1080
10  fps    + Vergelijk + 📈 Graph
» De benchmarkresultaten tonen aan dat de game niet speelbaar is met de geteste instellingen.
Additional Benchmarks
Low Preset TAA 1280x720
12
lage 1920x1080
20.3  fps    + Vergelijk + 📈 Graph
gem. 1920x1080
19.1  fps    + Vergelijk + 📈 Graph
hoge 1920x1080
16.1  fps    + Vergelijk + 📈 Graph
ultra 1920x1080
15.4  fps    + Vergelijk + 📈 Graph
» De benchmarkresultaten tonen aan dat de game niet speelbaar is met de geteste instellingen.
Additional Benchmarks
Low Preset (Super Resolution off) 1280x720
28.7
lage 1920x1080
19.3  fps    + Vergelijk + 📈 Graph
gem. 1920x1080
16.5  fps    + Vergelijk + 📈 Graph
hoge 1920x1080
16  fps    + Vergelijk + 📈 Graph
ultra 1920x1080
14.7  fps    + Vergelijk + 📈 Graph
» De benchmarkresultaten tonen aan dat de game niet speelbaar is met de geteste instellingen.
Additional Benchmarks
Low Preset TAA 1280x720
26.8
lage 1920x1080 cinem.
16.5  fps    + Vergelijk + 📈 Graph
gem. 1920x1080 cinem.
15.9  fps    + Vergelijk + 📈 Graph
hoge 1920x1080 cinem.
13  fps    + Vergelijk + 📈 Graph
ultra 1920x1080 cinem.
10.8  fps    + Vergelijk + 📈 Graph
» De benchmarkresultaten tonen aan dat de game niet speelbaar is met de geteste instellingen.
Additional Benchmarks
low 1280x720 cinem.
23.8
lage 1920x1080
20  fps    + Vergelijk
gem. 1920x1080
16  fps    + Vergelijk
hoge 1920x1080
12  fps    + Vergelijk
ultra 1920x1080
7  fps    + Vergelijk
» De benchmarkresultaten tonen aan dat de game niet speelbaar is met de geteste instellingen.
Additional Benchmarks
low TSR 100 1280x720
33
low XeSS 68 1280x720
48
lage 1920x1080
35.6 44.4 ~ 40 fps    + Vergelijk + 📈 Graph
gem. 1920x1080
24.2 29.9 ~ 27 fps    + Vergelijk + 📈 Graph
hoge 1920x1080
22.6 28.2 ~ 25 fps    + Vergelijk + 📈 Graph
ultra 1920x1080
20.5 24.2 ~ 22 fps    + Vergelijk + 📈 Graph
» Met alle geteste laptops speelbaar met lage instellingen.
Additional Benchmarks
Very Low Preset 1280x720
76.5
62.5
lage 1920x1080
40.7 49.4 ~ 45 fps    + Vergelijk + 📈 Graph
gem. 1920x1080
26.6 33.8 ~ 30 fps    + Vergelijk + 📈 Graph
hoge 1920x1080
20.3 27.2 ~ 24 fps    + Vergelijk + 📈 Graph
ultra 1920x1080
19 23.9 ~ 21 fps    + Vergelijk + 📈 Graph
» Met alle geteste laptops speelbaar met lage instellingen.
Additional Benchmarks
Low Preset 1280x720
72.3
60.2
F1 24

F1 24

2024
lage 1920x1080
65.6 66.5 71.8 75.2 82 84.3 ~ 74 fps    + Vergelijk
gem. 1920x1080
56 56.3 57.1 64.7 66.2 73.8 74 ~ 64 fps    + Vergelijk
hoge 1920x1080
42.7 43 48.4 48.7 53 54.8 ~ 48 fps    + Vergelijk
ultra 1920x1080
12 12.2 14 ~ 13 fps    + Vergelijk
» Met alle geteste laptops speelbaar met hoge instellingen.
lage 1920x1080
17.8  fps    + Vergelijk + 📈 Graph
gem. 1920x1080
14.9  fps    + Vergelijk + 📈 Graph
hoge 1920x1080
12.1  fps    + Vergelijk + 📈 Graph
» De benchmarkresultaten tonen aan dat de game niet speelbaar is met de geteste instellingen.
lage 1920x1080
33.6  fps    + Vergelijk + 📈 Graph
gem. 1920x1080
28  fps    + Vergelijk + 📈 Graph
hoge 1920x1080
25.2  fps    + Vergelijk + 📈 Graph
ultra 1920x1080
19  fps    + Vergelijk + 📈 Graph
» De benchmarkresultaten tonen aan dat de game niet speelbaar is met de geteste instellingen.
lage 1920x1080
18  fps    + Vergelijk + 📈 Graph
hoge 1920x1080
14.5  fps    + Vergelijk + 📈 Graph
» De benchmarkresultaten tonen aan dat de game niet speelbaar is met de geteste instellingen.
Additional Benchmarks
Low Preset 1280x720
22.5
lage 1920x1080
0 (!) 30.6 52 ~ 28 fps    + Vergelijk + 📈 Graph
gem. 1920x1080
27.1 34 ~ 31 fps    + Vergelijk + 📈 Graph
hoge 1920x1080
18.5 29 ~ 24 fps    + Vergelijk + 📈 Graph
ultra 1920x1080
16.2 25 ~ 21 fps    + Vergelijk + 📈 Graph
» De benchmarkresultaten tonen aan dat de game niet speelbaar is met de geteste instellingen.
Additional Benchmarks
Very Low Preset 1280x720
0 (!)
lage 1920x1080
69  fps    + Vergelijk
gem. 1920x1080
56  fps    + Vergelijk
hoge 1920x1080
49  fps    + Vergelijk
ultra 1920x1080
29  fps    + Vergelijk
» Met alle geteste laptops speelbaar met hoge instellingen.
lage 1920x1080
45.8 73.9 ~ 60 fps    + Vergelijk + 📈 Graph
gem. 1920x1080
39.1 52.4 ~ 46 fps    + Vergelijk + 📈 Graph
hoge 1920x1080
33.9 46.4 ~ 40 fps    + Vergelijk + 📈 Graph
ultra 1920x1080
27.6 40.3 ~ 34 fps    + Vergelijk + 📈 Graph
» Met de meeste geteste laptops speelbaar met hoge instellingen.
Additional Benchmarks
Very Low Preset 1280x720
59.3
lage 1920x1080
36  fps    + Vergelijk
gem. 1920x1080
32  fps    + Vergelijk
hoge 1920x1080
27  fps    + Vergelijk
ultra 1920x1080
21  fps    + Vergelijk
» Met alle geteste laptops speelbaar met lage instellingen.
lage 1920x1080
39.2  fps    + Vergelijk + 📈 Graph
gem. 1920x1080
30  fps    + Vergelijk + 📈 Graph
hoge 1920x1080
27.5  fps    + Vergelijk + 📈 Graph
ultra 1920x1080
27.2  fps    + Vergelijk + 📈 Graph
» Met alle geteste laptops speelbaar met lage instellingen.
lage 1920x1080
27  fps    + Vergelijk + 📈 Graph
gem. 1920x1080
22  fps    + Vergelijk + 📈 Graph
hoge 1920x1080
16.8  fps    + Vergelijk + 📈 Graph
ultra 1920x1080
0 (!)  fps    + Vergelijk
» De benchmarkresultaten tonen aan dat de game niet speelbaar is met de geteste instellingen.
Palworld

Palworld

2024
lage 1920x1080
40.6  fps    + Vergelijk + 📈 Graph
gem. 1920x1080
37.1  fps    + Vergelijk + 📈 Graph
hoge 1920x1080
29.5  fps    + Vergelijk + 📈 Graph
ultra 1920x1080
27.3  fps    + Vergelijk + 📈 Graph
» Met alle geteste laptops speelbaar met gem. instellingen.
gem. 1920x1080
152.6 183.9 208 ~ 182 fps    + Vergelijk + 📈 Graph
hoge 1920x1080
111.5 128.6 142.8 ~ 128 fps    + Vergelijk + 📈 Graph
ultra 1920x1080
108.6 120.9 134.2 ~ 121 fps    + Vergelijk + 📈 Graph
» Met alle geteste laptops speelbaar met ultra instellingen.
lage 1920x1080
60.4  fps    + Vergelijk + 📈 Graph
gem. 1920x1080
46.9  fps    + Vergelijk + 📈 Graph
hoge 1920x1080
45.8  fps    + Vergelijk + 📈 Graph
ultra 1920x1080
32.5  fps    + Vergelijk + 📈 Graph
» Met alle geteste laptops speelbaar met hoge instellingen.
lage 1920x1080
99.5  fps    + Vergelijk + 📈 Graph
gem. 1920x1080
68.9  fps    + Vergelijk + 📈 Graph
hoge 1920x1080
60.5  fps    + Vergelijk + 📈 Graph
ultra 1920x1080
46.4  fps    + Vergelijk + 📈 Graph
» Met alle geteste laptops speelbaar met ultra instellingen.
lage 1920x1080
18  fps    + Vergelijk
gem. 1920x1080
16  fps    + Vergelijk
hoge 1920x1080
14  fps    + Vergelijk
ultra 1920x1080
11  fps    + Vergelijk
» De benchmarkresultaten tonen aan dat de game niet speelbaar is met de geteste instellingen.
lage 1920x1080
35.8  fps    + Vergelijk
gem. 1920x1080
26.6  fps    + Vergelijk
hoge 1920x1080
24.7  fps    + Vergelijk
ultra 1920x1080
22.4  fps    + Vergelijk
» Met alle geteste laptops speelbaar met lage instellingen.
lage 1920x1080
20.2  fps    + Vergelijk + 📈 Graph
gem. 1920x1080
18  fps    + Vergelijk + 📈 Graph
hoge 1920x1080
16.3  fps    + Vergelijk + 📈 Graph
ultra 1920x1080
14.2  fps    + Vergelijk + 📈 Graph
» De benchmarkresultaten tonen aan dat de game niet speelbaar is met de geteste instellingen.
lage 1920x1080
82.7 93.1 101.4 116 ~ 98 fps    + Vergelijk
gem. 1920x1080
62.5 70.6 74.8 77.6 ~ 71 fps    + Vergelijk
hoge 1920x1080
45.6 53.6 53.6 58.9 ~ 53 fps    + Vergelijk
ultra 1920x1080
35.5 40.6 47 52 ~ 44 fps    + Vergelijk
» Met alle geteste laptops speelbaar met ultra instellingen.
Additional Benchmarks
Low Preset 1280x720
136.5
167.2
lage 1920x1080
34  fps    + Vergelijk
gem. 1920x1080
33  fps    + Vergelijk
hoge 1920x1080
30  fps    + Vergelijk
ultra 1920x1080
25  fps    + Vergelijk
» De benchmarkresultaten tonen aan dat de game niet speelbaar is met de geteste instellingen.
lage 1920x1080
111.1  fps    + Vergelijk + 📈 Graph
gem. 1920x1080
84.5  fps    + Vergelijk + 📈 Graph
hoge 1920x1080
52.1  fps    + Vergelijk + 📈 Graph
ultra 1920x1080
31.8  fps    + Vergelijk + 📈 Graph
» Met alle geteste laptops speelbaar met hoge instellingen.
lage 1920x1080
11.3 16.7 18.5 21.7 23.3 23.3 23.6 27.6 27.8 29.4 29.4 29.5 29.8 30.9 31 31.5 31.5 31.7 32 32.4 32.9 33.9 34.1 34.3 34.3 34.7 34.7 35.7 36.4 36.4 36.5 37.9 38 ~ 30 fps    + Vergelijk
gem. 1920x1080
9.4 15.2 16.3 19 23.8 24.2 24.8 25.1 25.1 25.3 25.4 25.7 26.3 26.3 26.3 26.5 26.7 26.8 27.8 27.9 28 28.4 28.9 29.5 29.5 29.6 30.2 31 31.4 31.4 ~ 26 fps    + Vergelijk
hoge 1920x1080
7.3 14.3 14.8 15.1 16.3 16.9 17.8 20.4 21.5 21.9 21.9 22.1 22.5 22.8 22.8 22.8 22.9 22.9 23.4 23.4 23.9 24 24 24 24.1 24.6 25 25.2 26 26.2 26.7 27.6 ~ 22 fps    + Vergelijk
ultra 1920x1080
13 13.5 14.2 18.4 18.9 19.5 19.7 19.8 20.5 20.6 20.7 20.7 21.1 21.2 21.4 21.6 21.9 22 22 22.1 23.3 23.7 23.8 24.7 ~ 20 fps    + Vergelijk
QHD 2560x1440
9.2 13.1 ~ 11 fps    + Vergelijk
» De benchmarkresultaten tonen aan dat de game niet speelbaar is met de geteste instellingen.
Additional Benchmarks
Low Preset (FSR off) 1280x720
53.8
49
46.1
37.3
44.3
45.6
47.6
34.5
38
48.9
47.4
50.5
48.3
58
48.5
Ray Tracing Ultra Preset (DLSS off) 1920x1080
7.3
Steam Deck 1280x720
34.1
52
48.8
41.1
30min Start Ultra Preset (FSR off) 1920x1080
16.8
22.3
13.8
13.1
18.9
21.9
18.6
20.5
19.6
9.6
19.5
22.1
20.3
lage 1920x1080
21 22.1 23 24.5 29.1 29.3 30.8 30.9 31.7 31.9 32.4 32.9 33.7 33.8 34.6 36.9 36.9 37.9 39.3 39.6 40.3 ~ 32 fps    + Vergelijk + 📈 Graph
gem. 1920x1080
16.3 17.6 20.6 22.8 22.9 23.5 24.2 24.3 24.8 25 25.6 25.9 27.4 28.2 28.8 29.6 29.7 29.7 30.2 30.3 30.7 31.1 ~ 26 fps    + Vergelijk + 📈 Graph
hoge 1920x1080
15.4 15.8 16.5 20.6 20.7 21.1 21.2 21.2 21.4 21.6 21.7 22.9 23.7 24.1 25 25.2 25.3 25.4 26.7 26.8 27.5 27.7 ~ 23 fps    + Vergelijk + 📈 Graph
ultra 1920x1080
14.2 14.7 19 19.1 19.9 20.3 20.4 20.7 21 21.1 22 22.1 23.4 23.6 24.1 24.4 24.4 24.4 25.2 25.7 26.2 ~ 22 fps    + Vergelijk + 📈 Graph
QHD 2560x1440
10.4 14 17.7 ~ 14 fps    + Vergelijk + 📈 Graph
4K 3840x2160
5.4  fps    + Vergelijk + 📈 Graph
» De benchmarkresultaten tonen aan dat de game niet speelbaar is met de geteste instellingen.
Additional Benchmarks
Low Preset 1280x720
52.6
52.2
33.8
46.7
42.2
53.9
48.5
48.1
57.6
56.4
Lies of P

Lies of P

2023
lage 1920x1080
56.9  fps    + Vergelijk + 📈 Graph
gem. 1920x1080
48.1  fps    + Vergelijk + 📈 Graph
hoge 1920x1080
41.7  fps    + Vergelijk + 📈 Graph
ultra 1920x1080
33.2  fps    + Vergelijk + 📈 Graph
» Met alle geteste laptops speelbaar met hoge instellingen.
lage 1920x1080
32  fps    + Vergelijk
gem. 1920x1080
30  fps    + Vergelijk
hoge 1920x1080
25  fps    + Vergelijk
ultra 1920x1080
21  fps    + Vergelijk
» De benchmarkresultaten tonen aan dat de game niet speelbaar is met de geteste instellingen.
Starfield

Starfield

2023
gem. 1920x1080
11.5  fps    + Vergelijk
» De benchmarkresultaten tonen aan dat de game niet speelbaar is met de geteste instellingen.
lage 1920x1080
50  fps    + Vergelijk + 📈 Graph
gem. 1920x1080
40.1  fps    + Vergelijk + 📈 Graph
hoge 1920x1080
36.2  fps    + Vergelijk + 📈 Graph
ultra 1920x1080
32.2  fps    + Vergelijk + 📈 Graph
» Met alle geteste laptops speelbaar met hoge instellingen.
lage 1920x1080
45.9  fps    + Vergelijk + 📈 Graph
gem. 1920x1080
45.7  fps    + Vergelijk + 📈 Graph
hoge 1920x1080
39.5  fps    + Vergelijk + 📈 Graph
ultra 1920x1080
29.2  fps    + Vergelijk + 📈 Graph
» Met alle geteste laptops speelbaar met hoge instellingen.
gem. 1920x1080
28.4  fps    + Vergelijk
hoge 1920x1080
29  fps    + Vergelijk
ultra 1920x1080
25.9  fps    + Vergelijk
QHD 2560x1440
21.1  fps    + Vergelijk
» De benchmarkresultaten tonen aan dat de game niet speelbaar is met de geteste instellingen.
F1 23

F1 23

2023
lage 1920x1080
15.2 17.3 37.4 44.1 48.6 48.6 57.3 57.3 64.4 64.6 67.9 68.2 68.2 69.8 70.9 71.5 71.5 71.9 72.3 73.1 73.4 77 80.1 82.1 83.2 89.3 ~ 63 fps    + Vergelijk
gem. 1920x1080
15 25.1 35.4 36.3 52.5 52.5 59 59.4 59.5 60.5 61.2 62.1 62.9 63.1 65.1 65.6 65.8 66.8 66.9 70.2 74.2 75.3 76.3 79.8 ~ 59 fps    + Vergelijk
hoge 1920x1080
10.6 25.6 26.6 27.1 35.5 35.5 35.9 37.6 38.7 39.5 40.7 41.1 41.2 43.1 44.8 44.9 46.1 47.1 47.5 50.4 50.7 50.9 54.5 ~ 40 fps    + Vergelijk
ultra 1920x1080
7.5 10 10.7 11.4 11.5 11.8 12.1 12.2 12.6 12.7 13.5 14 14.3 14.7 15 ~ 12 fps    + Vergelijk
» Met de meeste geteste laptops speelbaar met hoge instellingen.
Additional Benchmarks
Ultra Low Preset TAA 1280x720
93.7
110.9
73.4
72.4
113.9
88.3
88.3
123.1
115.7
113.4
lage 1920x1080
39.6  fps    + Vergelijk + 📈 Graph
gem. 1920x1080
30.5  fps    + Vergelijk + 📈 Graph
hoge 1920x1080
26.7  fps    + Vergelijk + 📈 Graph
ultra 1920x1080
18.4  fps    + Vergelijk + 📈 Graph
» Met alle geteste laptops speelbaar met lage instellingen.
lage 1920x1080
62.2  fps    + Vergelijk
gem. 1920x1080
50.1  fps    + Vergelijk
hoge 1920x1080
39  fps    + Vergelijk
ultra 1920x1080
38.6  fps    + Vergelijk
» Met alle geteste laptops speelbaar met ultra instellingen.
lage 1920x1080
29.8  fps    + Vergelijk + 📈 Graph
gem. 1920x1080
21  fps    + Vergelijk + 📈 Graph
hoge 1920x1080
19.4  fps    + Vergelijk + 📈 Graph
ultra 1920x1080
18.7  fps    + Vergelijk + 📈 Graph
» De benchmarkresultaten tonen aan dat de game niet speelbaar is met de geteste instellingen.
lage 1920x1080
45.7 61 ~ 53 fps    + Vergelijk + 📈 Graph
gem. 1920x1080
35.4 44.1 ~ 40 fps    + Vergelijk + 📈 Graph
hoge 1920x1080
24.6 30.9 ~ 28 fps    + Vergelijk + 📈 Graph
ultra 1920x1080
18.7 22.2 ~ 20 fps    + Vergelijk + 📈 Graph
» Met alle geteste laptops speelbaar met gem. instellingen.
Additional Benchmarks
Low Preset 1280x720
69
Returnal

Returnal

2023
lage 1920x1080
37  fps    + Vergelijk
gem. 1920x1080
36  fps    + Vergelijk
hoge 1920x1080
32  fps    + Vergelijk
ultra 1920x1080
28  fps    + Vergelijk
» Met alle geteste laptops speelbaar met gem. instellingen.
gem. 1920x1080
25.7  fps    + Vergelijk
hoge 1920x1080
19.3  fps    + Vergelijk
ultra 1920x1080
15.6  fps    + Vergelijk
» De benchmarkresultaten tonen aan dat de game niet speelbaar is met de geteste instellingen.
F1 22

F1 22

2022
lage 1920x1080
56.2 59.1 68.8 71 72.1 72.4 72.7 73.1 73.9 76.3 77.2 77.7 78.2 78.3 80.6 84.9 96.1 ~ 75 fps    + Vergelijk
gem. 1920x1080
49.6 53.9 57.5 62.2 65.1 65.6 66.6 67 68.6 70.8 70.9 71.4 71.6 71.7 73.8 77 87 ~ 68 fps    + Vergelijk
hoge 1920x1080
36.8 40.9 43.5 46.7 51.1 52.9 53.3 53.7 55 55.1 55.7 55.9 56.2 65.2 ~ 52 fps    + Vergelijk
ultra 1920x1080
5.1 9.3 11.9 14 14.1 14.4 14.7 14.9 15 15.3 16.1 16.9 ~ 13 fps    + Vergelijk
» Met alle geteste laptops speelbaar met hoge instellingen.
Additional Benchmarks
Ultra Low Preset 16xAF TAA 1280x720
127.2
86.6
120.3
107.7
120.5
113.4
120.8
107.4
136
120.1
104.5
120.9
115.8
lage 1920x1080
44.9 47.3 47.4 49 49.2 50.4 50.8 51.2 53.3 53.8 54.6 ~ 50 fps    + Vergelijk
gem. 1920x1080
35.3 36.3 37.3 39.5 40.6 41.2 42.6 42.7 43.4 44.5 45 ~ 41 fps    + Vergelijk
hoge 1920x1080
24.7 25.7 26.4 27 29.1 29.9 30 30.1 30.7 31.5 31.6 ~ 29 fps    + Vergelijk
ultra 1920x1080
20.2 20.2 21.2 21.9 24.1 24.2 24.3 24.4 25 25.1 25.9 ~ 23 fps    + Vergelijk
QHD 2560x1440
» Met alle geteste laptops speelbaar met gem. instellingen.
Additional Benchmarks
Lowest Preset (DX12) 1280x720
87
81.2
82.5
80.8
83.8
82.1
96.1
86.6
80
77.4
84.4
lage 1920x1080
67.7 73 ~ 70 fps    + Vergelijk
gem. 1920x1080
51.8 56.8 ~ 54 fps    + Vergelijk
hoge 1920x1080
41.7 44.8 ~ 43 fps    + Vergelijk
ultra 1920x1080
36.6 39.2 ~ 38 fps    + Vergelijk
» Met alle geteste laptops speelbaar met ultra instellingen.
Additional Benchmarks
Low Preset 1280x720
80
86.6
gem. 1920x1080
31.1  fps    + Vergelijk
hoge 1920x1080
29.9  fps    + Vergelijk
» De benchmarkresultaten tonen aan dat de game niet speelbaar is met de geteste instellingen.
lage 1920x1080
27 33.7 ~ 30 fps    + Vergelijk + 📈 Graph
gem. 1920x1080
24 31.2 ~ 28 fps    + Vergelijk + 📈 Graph
hoge 1920x1080
18.3 24 ~ 21 fps    + Vergelijk + 📈 Graph
ultra 1920x1080
12.9 17.3 ~ 15 fps    + Vergelijk + 📈 Graph
» De benchmarkresultaten tonen aan dat de game niet speelbaar is met de geteste instellingen.
Additional Benchmarks
Low Preset 1280x720
35.2
38.7
Far Cry 6

Far Cry 6

2021
lage 1280x720
61.9  fps    + Vergelijk + 📈 Graph
gem. 1920x1080
37.7  fps    + Vergelijk + 📈 Graph
hoge 1920x1080
32.1  fps    + Vergelijk + 📈 Graph
ultra 1920x1080
27.2  fps    + Vergelijk + 📈 Graph
» Met alle geteste laptops speelbaar met gem. instellingen.
Additional Benchmarks
Low Graphics Quality 1920x1080
42.9
F1 2021

F1 2021

2021
lage 1280x720
94.8 143.5 143.6 145.9 147.5 161.1 ~ 139 fps    + Vergelijk
gem. 1920x1080
50.8 73.9 75.9 80.4 80.6 83.5 ~ 74 fps    + Vergelijk
hoge 1920x1080
41.3 56.4 60 63.2 63.8 65.3 ~ 58 fps    + Vergelijk
ultra 1920x1080
20.3 26.2 26.9 28.8 29.6 31 ~ 27 fps    + Vergelijk
» Met alle geteste laptops speelbaar met hoge instellingen.
lage 1280x720
0 (!) 58 ~ 29 fps    + Vergelijk
gem. 1920x1080
33 35 ~ 34 fps    + Vergelijk
hoge 1920x1080
28 (!) 30 ~ 29 fps    + Vergelijk
ultra 1920x1080
26 27 ~ 27 fps    + Vergelijk
» De benchmarkresultaten tonen aan dat de game niet speelbaar is met de geteste instellingen.
F1 2020

F1 2020

2020
lage 1280x720
139.1  fps    + Vergelijk
gem. 1920x1080
76.9  fps    + Vergelijk
hoge 1920x1080
60.5  fps    + Vergelijk
ultra 1920x1080
41.2  fps    + Vergelijk
» Met alle geteste laptops speelbaar met ultra instellingen.
lage 1280x720
68.5 93 ~ 81 fps    + Vergelijk
gem. 1920x1080
38.5 41.9 ~ 40 fps    + Vergelijk
hoge 1920x1080
27.7 28.7 ~ 28 fps    + Vergelijk
ultra 1920x1080
21.9 22.6 ~ 22 fps    + Vergelijk
» Met alle geteste laptops speelbaar met gem. instellingen.
Additional Benchmarks
Very Low Overall Quality (DX11) 1920x1080
55.8
65.7
lage 1280x720
130  fps    + Vergelijk
gem. 1920x1080
59  fps    + Vergelijk
hoge 1920x1080
46  fps    + Vergelijk
ultra 1920x1080
33  fps    + Vergelijk
» Met alle geteste laptops speelbaar met hoge instellingen.
lage 1280x720
65 69 ~ 67 fps    + Vergelijk + 📈 Graph
gem. 1920x1080
39 41 ~ 40 fps    + Vergelijk + 📈 Graph
hoge 1920x1080
37 39 ~ 38 fps    + Vergelijk + 📈 Graph
ultra 1920x1080
35 36 ~ 36 fps    + Vergelijk + 📈 Graph
» Met de meeste geteste laptops speelbaar met ultra instellingen.
lage 1280x720
52.2 63.1 ~ 58 fps    + Vergelijk
gem. 1920x1080
33.9 37.6 ~ 36 fps    + Vergelijk
hoge 1920x1080
25 27.1 ~ 26 fps    + Vergelijk
ultra 1920x1080
19.7 21.7 ~ 21 fps    + Vergelijk
» Met de meeste geteste laptops speelbaar met gem. instellingen.
lage 1280x720
69 79.3 131.4 ~ 93 fps    + Vergelijk
gem. 1920x1080
33 38.3 62.5 ~ 45 fps    + Vergelijk
hoge 1920x1080
31 35.8 49.5 ~ 39 fps    + Vergelijk
ultra 1920x1080
27 30.5 48.2 ~ 35 fps    + Vergelijk
» Met de meeste geteste laptops speelbaar met hoge instellingen.
Additional Benchmarks
Lowest Preset 1920x1080
88.4
63.2
Strange Brigade

Strange Brigade

2018
lage 1280x720
121 121 124.9 129.8 131.8 141 141.6 141.9 144 145.6 146.1 147.3 151.6 154.8 156 159.4 162.1 163 165.4 165.9 166 168 171 173.8 176 177.4 178 179.5 188 188.9 189 190.2 204 205 207 208 ~ 163 fps    + Vergelijk
gem. 1920x1080
51.1 52.7 53 54 56 57 59 60.6 61.9 66 67.6 67.7 67.8 68 70 70.5 70.6 71 71 71.1 71.8 72 72.5 73 73.4 75.4 76 77.4 78 80.3 82 84 85.2 86 87.7 88 ~ 70 fps    + Vergelijk
hoge 1920x1080
39 40 41 41.4 43.8 48 50.4 52 52.4 53.3 54 54.9 55.4 56.4 57.2 57.8 57.8 58.9 59 59 59 59 59.1 59.6 59.7 61.4 61.7 62 64 64 66.7 69 69.3 71 72.3 74 ~ 57 fps    + Vergelijk
ultra 1920x1080
27.1 31 32 33.4 35 35.6 37.4 38.8 38.9 40.7 41 41 43.2 43.8 44 44.3 45.4 46 46.1 46.7 46.8 47 47 47.3 48.5 48.9 49 50 50.3 52 52.5 53 53.2 55 56 58 58.9 ~ 45 fps    + Vergelijk
QHD 2560x1440
25 25.7 34.9 42 ~ 32 fps    + Vergelijk
4K 3840x2160
14.2 15 ~ 15 fps    + Vergelijk
» Met de meeste geteste laptops speelbaar met ultra instellingen.
Far Cry 5

Far Cry 5

2018
lage 1280x720
47 51 54 54 56 57 59 61 62 63 63 63 63 65 67 67 68 68 69 69 69 72 76 77 79 84 91 91 ~ 67 fps    + Vergelijk + 📈 Graph
gem. 1920x1080
30 31 33 33 35 36 36 36 37 37 37 38 39 39 39 39 40 40 40 42 43 44 45 45 46 47 48 52 54 54 ~ 41 fps    + Vergelijk + 📈 Graph
hoge 1920x1080
22 28 29 30 31 32 33 33 34 34 34 35 35 35 35 36 36 37 37 37 37 38 40 41 41 42 43 43 45 48 49 50 ~ 37 fps    + Vergelijk + 📈 Graph
ultra 1920x1080
25 26 27 28 28 31 31 32 32 32 32 32 33 33 34 34 34 34 35 35 35 36 38 38 38 39 40 40 41 45 46 46 ~ 35 fps    + Vergelijk + 📈 Graph
QHD 2560x1440
28 32 33 ~ 31 fps    + Vergelijk + 📈 Graph
» Met de meeste geteste laptops speelbaar met hoge instellingen.
Additional Benchmarks
Low Preset TAA 1920x1080
38
45
50
lage 1280x720
46.1 47.1 47.4 47.5 47.6 49 49.3 49.9 50.3 50.5 50.8 50.9 51.4 51.6 52 52.2 52.4 52.5 52.6 52.7 52.7 53 53.4 53.9 54 54.4 54.5 54.9 55 55.4 55.4 56 56.1 56.9 58 58.7 61.5 63.1 64.9 65.5 66.4 66.6 ~ 54 fps    + Vergelijk
gem. 1920x1080
31.1 31.2 35.8 36 36 37.7 38.3 38.7 38.8 38.9 39.2 39.4 39.8 39.9 39.9 40.1 40.4 40.4 40.6 40.7 40.8 40.8 41 41.1 41.1 41.3 41.6 42 42.5 44 45.1 45.1 46 46.4 46.6 46.7 46.9 47.4 47.6 49.7 49.8 51.9 52.1 ~ 42 fps    + Vergelijk
hoge 1920x1080
27.9 29.9 30.2 30.2 30.8 30.8 31.2 31.3 31.6 31.7 32 32.1 32.1 32.4 32.7 33.4 33.5 33.5 33.7 33.8 34.1 34.5 34.6 35 35.7 35.8 36.1 36.8 36.9 37.6 37.8 37.8 38.2 38.2 38.9 39.5 40.1 40.5 40.5 42.2 42.3 43.9 ~ 35 fps    + Vergelijk
4K 3840x2160
19.3 34.4 ~ 27 fps    + Vergelijk
» Met de meeste geteste laptops speelbaar met gem. instellingen.
lage 1280x720
35.6 42.8 43.8 45.2 45.5 47.6 51.5 51.9 52.8 56.6 56.9 57.2 58.1 58.5 59.1 61 61.3 63 63.3 64 64.8 65 65.3 66.1 66.8 68.4 69.1 69.3 70 73.6 75.3 77 79.2 80.1 82.9 83.3 84.1 85.9 ~ 63 fps    + Vergelijk
gem. 1920x1080
28 28.2 28.7 29.7 29.7 30.3 31.6 32.1 32.1 33 33.5 34.8 35.8 35.9 36 36.1 36.2 36.3 36.5 36.5 36.8 37 37.3 37.4 37.6 37.9 38 38 38 38.8 40.2 40.3 40.3 41 41.3 43.4 45 45.2 45.3 45.9 ~ 37 fps    + Vergelijk
hoge 1920x1080
14.7 17 18.2 18.4 19.2 19.2 19.4 20.9 21 21.2 21.8 23.2 23.9 24.1 24.1 24.4 24.4 24.4 24.6 24.9 25.4 26.1 26.1 26.4 26.4 26.5 26.5 26.6 26.8 27 27.2 27.5 28.6 28.9 29.2 30.5 30.6 30.6 30.8 31.6 31.7 ~ 25 fps    + Vergelijk
QHD 2560x1440
12.6 13.4 14 15.9 19.8 20.5 23 ~ 17 fps    + Vergelijk
4K 3840x2160
7.7 9 ~ 8 fps    + Vergelijk
» Met de meeste geteste laptops speelbaar met gem. instellingen.
lage 1280x720
78.3 89.9 91.5 92.1 95.1 98.4 98.4 98.6 98.9 98.9 98.9 99.3 99.4 100.3 100.9 100.9 101.1 101.2 101.2 101.5 101.5 101.7 101.8 102.4 102.5 102.7 103.2 103.2 103.5 103.8 104.1 104.6 104.7 105 105.7 106.2 106.5 106.5 106.8 107.4 110.5 ~ 101 fps    + Vergelijk
gem. 1366x768
36.2 54.2 55.8 58.2 62.8 69.4 71.4 75.6 75.9 76.9 78 79.2 80.6 81.9 82.3 83 83.2 83.4 84.1 84.3 89.4 89.8 90.4 90.8 90.9 92.6 92.8 92.9 93.1 93.3 93.5 94 94.1 94.1 94.9 95.3 95.5 96.5 96.9 97.4 99.9 ~ 84 fps    + Vergelijk
hoge 1920x1080
35.9 39.8 47 54.8 57.7 61.5 61.9 62.6 63.2 64.1 64.1 66.8 67.2 67.2 67.4 69.3 70.3 72 72.3 74 74.5 74.9 74.9 75.7 76 76.5 76.7 76.8 77.3 77.8 77.9 78.4 79 79.1 80.6 83 83.3 84.6 85.2 85.2 87.8 ~ 71 fps    + Vergelijk
ultra 1920x1080
35.2 41.8 43.7 45.5 53.3 56.8 59.6 60.3 60.4 60.6 60.8 62.1 63.6 63.6 63.9 65.2 66.5 66.6 67.1 68.3 71.1 71.1 72.3 73.2 73.4 73.6 73.6 74 74 74.4 74.4 74.6 75.4 75.6 76 78 79.8 80.2 80.5 80.6 80.9 ~ 67 fps    + Vergelijk
4K 3840x2160
30.9 31.8 ~ 31 fps    + Vergelijk
» Met alle geteste laptops speelbaar met ultra instellingen.
lage 1024x768
92 120 126 126 128 131 131.2 131.3 132 132.9 133 135 135.1 135.6 140.2 141 141.5 142.7 152 152 156 157 157 158 160 ~ 138 fps    + Vergelijk + 📈 Graph
gem. 1366x768
59 68 73 76.8 78 78 79.1 80 80 81.2 85.1 88.1 88.2 88.4 89 89 91.5 92 93 97 97 99 100 ~ 85 fps    + Vergelijk + 📈 Graph
hoge 1920x1080
36 40 40 40.4 42 42.4 44 44.5 44.8 46.8 47 48 48 49 50 51 51 51.7 54.1 54.3 54.3 56 57 57 58 ~ 48 fps    + Vergelijk + 📈 Graph
ultra 1920x1080
14.5 18.4 19.2 20.1 20.4 20.5 20.8 20.8 20.9 21.8 22.6 23 23.1 23.3 23.8 23.9 24 24 24.5 24.5 24.6 25.1 25.2 25.5 25.5 25.6 25.9 26 26.1 28 43.1 ~ 24 fps    + Vergelijk + 📈 Graph
» Met alle geteste laptops speelbaar met hoge instellingen.
Additional Benchmarks
Medium Graphics & Postprocessing 1920x1080
53.8
51.7
53.9
GTA V

GTA V

2015
lage 1024x768
99.1 101.3 102.4 110.5 124.1 126.5 133.8 134.9 136.9 139.1 141 144 144.9 145.4 147.3 152.9 153.3 157.8 158.1 158.8 160.3 160.3 161 162.9 162.9 163.3 163.6 165.2 166.5 166.9 169.3 171.5 174.1 175 ~ 148 fps    + Vergelijk
gem. 1366x768
59.9 85.7 90.4 93.8 107.7 111 114 120.8 121.7 124.1 129.8 131.5 131.8 133.9 134.8 135.8 139.5 139.5 140.1 147.9 148 148.1 148.2 151.8 151.9 152.8 154.1 154.9 156.7 158.8 160.2 160.9 164.4 168.4 169.3 ~ 135 fps    + Vergelijk
hoge 1920x1080
19.1 22.6 24.2 24.3 26.2 31.3 32.2 32.3 32.8 33.1 33.4 33.5 33.9 34.5 34.8 35.2 35.9 36.2 36.3 36.9 37.5 37.6 39.6 39.9 40.3 40.6 41.2 41.2 41.3 43.2 43.5 43.5 44.7 48.6 48.9 51.2 ~ 36 fps    + Vergelijk
ultra 1920x1080
9.6 10 10.3 11 11.4 12.1 12.3 12.7 13.1 13.3 13.7 13.8 13.9 14.1 14.2 14.3 14.3 14.6 14.7 14.7 15.8 15.9 15.9 16 16.2 16.5 16.6 17.1 17.5 17.8 18.3 19.2 20.2 20.6 ~ 15 fps    + Vergelijk
QHD 2560x1440
9.2 12.2 ~ 11 fps    + Vergelijk
4K 3840x2160
9.1  fps    + Vergelijk
» Met de meeste geteste laptops speelbaar met hoge instellingen.
Additional Benchmarks
Highest Settings possible 16xAF 4xMSAA + FXAA 3840x2160
5
Normal/Off 4xAF 1920x1080
121.8
108.9
118.4
156
139.7
90.4
69.3
123.9
111
101
120.9
111.9
124.3
119.9
109.8
127.9
123.7
112.9
Lowest Settings possible 1920x1080
130.9
130.5
128.3
167.5
152.7
62.9
138.3
119.5
122.2
134.6
107.4
131.8
142.8
131.1
121.4
138.3
134.6
124.8
lagegem.hogeultraQHD4K
Until Dawn40.227.218.914
EA Sports FC 2575.855.44543.1
God of War Ragnarök10.610.410.110
Final Fantasy XVI20.319.116.115.4
Space Marine 219.316.51614.7
Star Wars Outlaws16.515.91310.8
Black Myth: Wukong2016127
Once Human40272522
The First Descendant45302421
F1 2474644813
Senua's Saga Hellblade 217.814.912.1
Ghost of Tsushima33.62825.219
Dragon's Dogma 21814.5
Horizon Forbidden West28312421
Alone in the Dark69564929
Last Epoch60464034
Skull & Bones36322721
Helldivers 239.23027.527.2
Enshrouded272216.8
Palworld40.637.129.527.3
Prince of Persia The Lost Crown182128121
Ready or Not60.446.945.832.5
The Finals99.568.960.546.4
Avatar Frontiers of Pandora18161411
EA Sports WRC35.826.624.722.4
Lords of the Fallen20.21816.314.2
Total War Pharaoh98715344
Assassin's Creed Mirage34333025
Counter-Strike 2111.184.552.131.8
Cyberpunk 2077 2.1 Phantom Liberty3026222011
Baldur's Gate 332262322145.42
Lies of P56.948.141.733.2
The Crew Motorfest32302521
Starfield11.5
Armored Core 65040.136.232.2
Atlas Fallen45.945.739.529.2
Ratchet & Clank Rift Apart28.42925.921.1
F1 2363594012
Resident Evil 4 Remake39.630.526.718.4
Company of Heroes 362.250.13938.6
Sons of the Forest29.82119.418.7
Atomic Heart53402820
Returnal37363228
Hogwarts Legacy25.719.315.6
F1 2275685213
Tiny Tina's Wonderlands5041292316.6
GRID Legends70544338
Dying Light 231.129.9
God of War30282115
Far Cry 661.937.732.127.2
F1 2021139745827
Horizon Zero Dawn29342927
F1 2020139.176.960.541.2
Borderlands 381402822
Total War: Three Kingdoms130594633
Far Cry New Dawn67403836
Metro Exodus58362621
Shadow of the Tomb Raider93453935
Strange Brigade1637057453215
Far Cry 56741373531
X-Plane 11.1154423527
Final Fantasy XV Benchmark633725178
Dota 2 Reborn10184716731
The Witcher 3138854824
GTA V1481353615119.14
< 30 fps
< 60 fps
< 120 fps
≥ 120 fps
13
22
19
6
20
32
10
2
34
26
3
1
40
16
1
1
6
2

5
1

Voor meer games die mogelijk speelbaar zijn of voor een lijst van alle games en videokaarten, bezoek onze Gaming List

v1.28
log 20. 18:59:43

#0 ran 0s before starting gpusingle class +0s ... 0s

#1 no ids found in url (should be separated by "_") +0s ... 0s

#2 not redirecting to Ajax server +0s ... 0s

#3 did not recreate cache, as it is less than 5 days old! Created at Tue, 19 Nov 2024 05:32:27 +0100 +0.001s ... 0.001s

#4 no comparison url found in template nbc.compare_page_1 needed +0.025s ... 0.026s

#5 no comparison url found in template nbc.compare_page_1 needed +0s ... 0.026s

#6 composed specs +0s ... 0.026s

#7 did output specs +0s ... 0.026s

#8 start showIntegratedCPUs +0s ... 0.026s

#9 getting avg benchmarks for device 12086 +0.028s ... 0.054s

#10 got single benchmarks 12086 +0.14s ... 0.194s

#11 got avg benchmarks for devices +0s ... 0.194s

#12 min, max, avg, median took s +1.145s ... 1.34s

#13 before gaming benchmark output +0.001s ... 1.34s

#14 Got 1710 rows for game benchmarks. +0.263s ... 1.604s

#15 composed SQL query for gamebenchmarks +0s ... 1.604s

#16 got data and put it in $dataArray +0.046s ... 1.65s

#17 benchmarks composed for output. +2.411s ... 4.061s

#18 no comparison url found in template nbc.compare_page_1 needed +0.008s ... 4.069s

#19 return log +0s ... 4.069s

Notebook-testrapporten met Intel Arc 8-Core iGPU grafische kaart

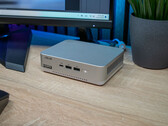
Asus NUC 14 Pro+ mini-PC beoordeling - Een potentiële desktop killer op slechts 622 gram

Asus NUC 14 Pro+ mini-PC beoordeling - Een potentiële desktop killer op slechts 622 gram

De Asus NUC 14 Pro+ belooft indrukwekkende prestaties te leveren in een compacte vormfactor, met de nieuwste processors en enorm veel vermogen. Maar hoe prestee...
Intel Core Ultra 9 185H | Intel Arc 8-Core iGPU | 622 g
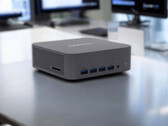
Geekom GT1 Mega in review

Geekom GT1 Mega beoordeling: Geekom's eerste AI mini PC overtuigt niet in alle opzichten

De Geekom GT1 Mega belooft krachtige prestaties in een mini PC vormfactor en is gericht op gebruikers die veel prestaties nodig hebben in de kleinste ruimte. Ui...
Intel Core Ultra 9 185H | Intel Arc 8-Core iGPU | 693 g
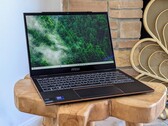
Lenovo ThinkBook Plus Gen 5 Hybrid 2-in-1 beoordeling: Dual-boot Windows 11 en Android 13

Lenovo ThinkBook Plus Gen 5 Hybrid 2-in-1 beoordeling: Dual-boot Windows 11 en Android 13

De hybride Windows-Android aanpak kan uw bestaande laptop en tablet in één keer vervangen. De 2-in-1 Lenovo-machine is echter niet per se beter dan een standalo...
Intel Core Ultra 7 155H | Intel Arc 8-Core iGPU | 14.00" | 1.7 kg
Khadas Mind 2 beoordeling: Draagbare mini PC nu met Intel Core Ultra 7 155H, Thunderbolt 4 en USB4

Khadas Mind 2 beoordeling: Draagbare mini PC nu met Intel Core Ultra 7 155H, Thunderbolt 4 en USB4

Khadas is zijn huidige modelreeks van de Mind-serie aan het updaten en rust deze nu uit met nieuwe Intel-processors. Wij bekijken de Khadas Mind 2 met Intel Cor...
Intel Core Ultra 7 155H | Intel Arc 8-Core iGPU | 437 g
Honor MagicBook Art 14 Laptop - Geweldige OLED subnotebook met dampkamer en innovatieve camera

Honor MagicBook Art 14 Laptop - Geweldige OLED subnotebook met dampkamer en innovatieve camera

Met de nieuwe MagicBook Art 14 biedt Honor een geweldige subnotebook met een OLED-touchscreen met hoge resolutie en een Meteor Lake-processor. De opzetbare webc...
Intel Core Ultra 7 155H | Intel Arc 8-Core iGPU | 14.60" | 1 kg

Medion S17431-MD62640: Intel Core Ultra 7 155H, 17.30", 2.1 kg
  Testrapport » Medion S20 laptop test: 17-inch multimedia notebook met Intel Core Ultra 7

HP EliteBook x360 1040 G11: Intel Core Ultra 7 165H, 14.00", 1.5 kg
  Testrapport » HP Elite x360 1040 G11 2-in-1 test: Voor de zakelijke road warrior

Framework Laptop 13.5 Core Ultra 7 155H: Intel Core Ultra 7 155H, 13.50", 1.4 kg
  Testrapport » Framework Laptop 13.5 Core Ultra 7 test: Nieuw 2.8K 120 Hz beeldscherm met Arc 8 grafische weergave

SCHENKER XMG Evo 15 (M24): Intel Core Ultra 7 155H, 15.30", 1.7 kg
  Testrapport » Schenker XMG Evo 15 (M24) Laptop review - Duits Ultrabook met helder scherm en uitstekende onderhoudsmogelijkheden

Medion S10 OLED: Intel Core Ultra 7 155H, 16.00", 1.6 kg
  Testrapport » Medion S10 OLED beoordeling: De multimedia-laptop met een OLED-paneel en Core Ultra 7

Dell Inspiron 16 7640 2-in-1: Intel Core Ultra 7 155H, 16.00", 2.1 kg
  Testrapport » Mini-LED op een 16-inch convertible: Dell Inspiron 16 7640 2-in-1 beoordeling

Xiaomi RedmiBook Pro 14 2024: Intel Core Ultra 7 155H, 14.00", 1.4 kg
  Testrapport » Xiaomi RedmiBook Pro 14 2024 laptop review - De betaalbare subnotebook met veel uithoudingsvermogen

LG gram Pro 2-in-1 16T90SP: Intel Core Ultra 7 155H, 16.00", 1.4 kg
  Testrapport » LG gram Pro 2-in-1 16T90SP beoordeling - Licht en krachtig

MSI Claw: Intel Core Ultra 7 155H, 7.00", 0.7 kg
  Testrapport » MSI Claw review - De gaming-handheld met een Intel Core Ultra-processor stelt teleur

Huawei MateBook 14 FLMH-W7611T: Intel Core Ultra 7 155H, 14.20", 1.3 kg
  Testrapport » Huawei MateBook 14 (2024) laptop met een 3:2 scherm beoordeling - In de steek gelaten door enkele kleine problemen

Huawei MateBook X Pro 2024: Intel Core Ultra 9 185H, 14.20", 1 kg
  Testrapport » Huawei MateBook X Pro 2024 laptop review - De 980 gram wegende magnesium ultrabook met een indrukwekkend OLED paneel

Minisforum AtomMan X7 Ti: Intel Core Ultra 9 185H, 0.9 kg
  Testrapport » Minisforum AtomMan X7 Ti met Intel Core Ultra 9 185H in review: AI mini-pc met aanraakscherm, camera en OCuLink

Dell XPS 13 9340 Core Ultra 7: Intel Core Ultra 7 155H, 13.40", 1.2 kg
  Testrapport » Dell XPS 13 9340 laptop review - De compacte subnotebook met lange looptijden en nogal wat gebreken

Lenovo IdeaPad Pro 5 16IMH G9: Intel Core Ultra 7 155H, 16.00", 1.9 kg
  Testrapport » Lenovo IdeaPad Pro 5 16 G9 beoordeling - De multimedia-laptop met een 120 Hz beeldscherm en Core Ultra 7

Xiaomi RedmiBook Pro 16 2024: Intel Core Ultra 7 155H, 16.00", 1.9 kg
  Testrapport » Xiaomi RedmiBook Pro 16 2024 review - Misschien wel de beste Meteor Lake laptop met een lange batterijlevensduur

Samsung Galaxy Book4 Pro 14: Intel Core Ultra 7 155H, 14.00", 1.2 kg
  Testrapport » Samsung Galaxy Book4 Pro 14 review - Dure alledaagse laptop met OLED-touchscreen

LG Gram 17 17Z90S-G.AA79G: Intel Core Ultra 7 155H, 17.00", 1.3 kg
  Testrapport » LG Gram 17 (2024) laptop review - Kleine verbeteringen en een nieuwe Core Ultra 7

Lenovo Yoga 9 2-in-1 14IMH9: Intel Core Ultra 7 155H, 14.00", 1.3 kg
  Testrapport » Lenovo Yoga 9 2-in-1 14IMH9 beoordeling: Kleiner en lichter met snellere Arc grafische weergave

Acemagic F2A: Intel Core Ultra 7 155H, 0.8 kg
  Testrapport » Acemagic F2A beoordeling: AI mini-pc krijgt Intel's Meteor Lake Core Ultra 7 155H-processor samen met 32 GB DDR5 RAM en Wi-Fi 7

Samsung Galaxy Book4 Pro 16: Intel Core Ultra 7 155H, 16.00", 1.5 kg
  Testrapport » Galaxy Book4 Pro 16 Laptop Review: Samsungs alternatief voor de Apple MacBook Air 15

AcePC Wizbox AI: Intel Core Ultra 7 155H, 0.8 kg
  Testrapport » AcePC Wizbox AI mini-pc beoordeling: Intel Meteor Lake wordt mini

Dell Inspiron 14 Plus 7440: Intel Core Ultra 7 155H, 14.00", 1.6 kg
  Testrapport » Dell Inspiron 14 Plus 7440 laptop test: GeForce RTX laten vallen voor geïntegreerde Intel Arc

Lenovo Yoga Slim 7 14IMH9: Intel Core Ultra 7 155H, 14.00", 1.4 kg
  Testrapport » Lenovo Yoga Slim 7 14 G9 laptop test: Nieuw kleiner formaat met geïntegreerde Co-Pilot toets

Lenovo Yoga Pro 7 14IMH9: Intel Core Ultra 7 155H, 14.50", 1.6 kg
  Testrapport » Lenovo Yoga Pro 7 14 laptop beoordeling: Intel Arc gaat de strijd aan met Radeon 780M

MSI Prestige 13 AI Evo: Intel Core Ultra 7 155H, 13.30", 1 kg
  Testrapport » MSI Prestige 13 AI Evo laptop beoordeling - Core Ultra 7 en OLED met een gewicht van minder dan 1 kg

Asus Zenbook Duo OLED UX8406MA: Intel Core Ultra 9 185H, 14.00", 1.7 kg
  Testrapport » Asus Zenbook Duo OLED (2024) convertible test: Multitasking kampioen met Core Ultra 9

HP Spectre x360 16-aa0074ng: Intel Core Ultra 7 155H, 16.00", 1.9 kg
  Testrapport » 2-in-1 Convertible HP Spectre x360 16 (2024) laptop review: Een krachtige Core-Ultra allrounder met OLED

Lenovo ThinkPad X1 Carbon G12: Intel Core Ultra 7 155H, 14.00", 1.1 kg
  Testrapport » Lenovo ThinkPad X1 Carbon G12 laptop test: Eerste grote opfrissing in drie jaar

Asus ZenBook 14 UX3405MA: Intel Core Ultra 7 155H, 14.00", 1.2 kg
  Testrapport » Asus Zenbook 14 OLED review - De 1,2 kg wegende subnotebook met 120-Hz OLED en Core Ultra 7

HP Spectre x360 14-eu0078ng: Intel Core Ultra 7 155H, 14.00", 1.5 kg
  Testrapport » HP Spectre x360 14 review - High-end convertible nu met een groter 120-Hz OLED

MSI Prestige 16 B1MG-001US: Intel Core Ultra 7 155H, 16.00", 1.6 kg
  Testrapport » MSI Prestige 16 B1MG laptop test: Van Core i7 Xe naar Core Ultra 7 Arc

Acer Swift Go 14 SFG14-72: Intel Core Ultra 7 155H, 14.00", 1.3 kg
  Testrapport » Acer Swift Go 14 review - De Meteor Lake Core Ultra 7 maakt indruk met zijn AI-kern

  Testrapport » Intel Meteor Lake analyse - Core Ultra 7 155H overtuigt alleen met GPU-prestaties

Asus ZenBook 14 UX3405MA: Intel Core Ultra 7 155H
  Testrapport » Intel Meteor Lake analyse - Core Ultra 7 155H overtuigt alleen met GPU-prestaties

HP Elite x360 1040 G11: Intel Core Ultra 7 155H, 14.00", 1.4 kg
  Extern testrapport » HP Elite x360 1040 G11

LG Gram SuperSlim 15 2024: Intel Core Ultra 7 155H, 15.60", 1 kg
  Extern testrapport » LG Gram SuperSlim 15 2024

Lenovo IdeaPad Pro 5 16IMH9: Intel Core Ultra 7 155H, 16.00", 1.9 kg
  Extern testrapport » Lenovo IdeaPad Pro 5 16IMH9

Lenovo ThinkPad E16 Gen 2: Intel Core Ultra 7 155H, 16.00", 1.8 kg
  Extern testrapport » Lenovo ThinkPad E16 Gen 2

Lenovo ThinkBook 14 G7 IML: Intel Core Ultra 7 155H, 14.00", 1.4 kg
  Extern testrapport » Lenovo ThinkBook 14 G7 IML

Lenovo ThinkBook Plus Gen5 Hybrid: Intel Core Ultra 7 155H, 14.00", 1.7 kg
  Extern testrapport » Lenovo ThinkBook Plus Gen5 Hybrid

Framework Laptop 13.5 Core Ultra 7 155H: Intel Core Ultra 7 155H, 13.50", 1.4 kg
  Extern testrapport » Framework Laptop 13.5 Core Ultra 7 155H

HP EliteBook x360 1040 G11: Intel Core Ultra 7 165H, 14.00", 1.5 kg
  Extern testrapport » HP EliteBook x360 1040 G11

Honor MagicBook Art 14: Intel Core Ultra 7 155H, 14.60", 1 kg
  Extern testrapport » Honor MagicBook Art 14

Lenovo IdeaPad Slim 5 16IMH9: Intel Core Ultra 7 155H, 16.00", 1.9 kg
  Extern testrapport » Lenovo IdeaPad Slim 5 16IMH9

Asus Vivobook S16 S5606M: Intel Core Ultra 7 155H, 16.00", 1.6 kg
  Extern testrapport » Asus Vivobook S16 S5606M

Lenovo ThinkBook 16 G7 IML: Intel Core Ultra 7 155H, 16.00", 1.7 kg
  Extern testrapport » Lenovo ThinkBook 16 G7 IML

Asus Vivobook S15 S5506: Intel Core Ultra 7 165H, 15.60", 1.5 kg
  Extern testrapport » Asus Vivobook S15 S5506

Lenovo Yoga 9 2-in-1 14IMH9: Intel Core Ultra 7 155H, 14.00", 1.3 kg
  Extern testrapport » Lenovo Yoga 9 2-in-1 14IMH9

Acer TravelMate P6 TMP614-73: Intel Core Ultra 7 155H, 14.00", 1.2 kg
  Extern testrapport » Acer TravelMate P6 TMP614-73

Panasonic Toughbook 40 Mk2: Intel Core Ultra 7 165H, 14.00", 3.4 kg
  Extern testrapport » Panasonic Toughbook 40 Mk2

Acer Swift Go 16 OLED SFG16-72, Core Ultra 7 155H: Intel Core Ultra 7 155H, 16.00", 1.6 kg
  Extern testrapport » Acer Swift Go 16 OLED SFG16-72, Core Ultra 7 155H

Medion S10 OLED: Intel Core Ultra 7 155H, 16.00", 1.6 kg
  Extern testrapport » Medion S10 OLED

Dell Inspiron 16 7640 2-in-1: Intel Core Ultra 7 155H, 16.00", 2.1 kg
  Extern testrapport » Dell Inspiron 16 7640 2-in-1

Acer Swift Go 16 OLED SFG16-72: Intel Core Ultra 9 185H, 16.00", 1.6 kg
  Extern testrapport » Acer Swift Go 16 OLED SFG16-72

Lenovo ThinkBook 13x IMH G4, Ultra 9 185H: Intel Core Ultra 9 185H, 13.50", 1.2 kg
  Extern testrapport » Lenovo ThinkBook 13x IMH G4, Ultra 9 185H

Asus VivoBook S 14 OLED S5406MA, Ultra 7 155H: Intel Core Ultra 7 155H, 14.00", 1.3 kg
  Extern testrapport » Asus VivoBook S 14 OLED S5406MA, Ultra 7 155H

MSI Modern 15 H AI C1MG: Intel Core Ultra 7 155H, 15.60", 1.9 kg
  Extern testrapport » MSI Modern 15 H AI C1MG

HP EliteBook 1040 G11: Intel Core Ultra 7 165H, 14.00", 1.2 kg
  Extern testrapport » HP EliteBook 1040 G11

Asus ZenBook 14 UX3405MA, Ultra 9: Intel Core Ultra 9 185H, 14.00", 1.2 kg
  Extern testrapport » Asus ZenBook 14 UX3405MA, Ultra 9

Lenovo ThinkBook 16 G6+ IMH: Intel Core Ultra 7 155H, 16.00", 1.9 kg
  Extern testrapport » Lenovo ThinkBook 16 G6+ IMH

MSI Prestige 16 AI EVO B1MG: Intel Core Ultra 7 155H, 16.00", 1.5 kg
  Extern testrapport » MSI Prestige 16 AI EVO B1MG

Acer Swift Go 14 OLED SFG14-73: Intel Core Ultra 7 155H, 14.00", 1.3 kg
  Extern testrapport » Acer Swift Go 14 OLED SFG14-73

Asus VivoBook S 16 OLED S5606MA: Intel Core Ultra 7 155H, 16.00", 1.5 kg
  Extern testrapport » Asus VivoBook S 16 OLED S5606MA

Asus VivoBook S 14 OLED S5406MA, Ultra 9 185H: Intel Core Ultra 9 185H, 14.00", 1.3 kg
  Extern testrapport » Asus VivoBook S 14 OLED S5406MA, Ultra 9 185H

MSI Summit E13 AI Evo A1M: Intel Core Ultra 7 155H, 13.30", 1.4 kg
  Extern testrapport » MSI Summit E13 AI Evo A1M

Lenovo Yoga 7 14IML9: Intel Core Ultra 7 155H, 14.00", 1.5 kg
  Extern testrapport » Lenovo Yoga 7 14IML9

Huawei MateBook 14 2024: Intel Core Ultra 7 155H, 14.20", 1.3 kg
  Extern testrapport » Huawei MateBook 14 2024

Asus Zenbook Duo OLED UX8406MA, Ultra 7: Intel Core Ultra 7 155H, 14.00", 1.7 kg
  Extern testrapport » Asus Zenbook Duo OLED UX8406MA, Ultra 7

Huawei MateBook X Pro 2024: Intel Core Ultra 9 185H, 14.20", 1 kg
  Extern testrapport » Huawei MateBook X Pro 2024

Acer Swift Go 14 SFG14-72, Ultra 9: Intel Core Ultra 9 185H, 14.00", 1.3 kg
  Extern testrapport » Acer Swift Go 14 SFG14-72, Ultra 9

Dell XPS 13 9340 Core Ultra 7: Intel Core Ultra 7 155H, 13.40", 1.2 kg
  Extern testrapport » Dell XPS 13 9340 Core Ultra 7

Dell XPS 14 9440: Intel Core Ultra 7 155H, 14.50", 1.7 kg
  Extern testrapport » Dell XPS 14 9440

LG Gram 17 17Z90S-G.AA79G: Intel Core Ultra 7 155H, 17.00", 1.3 kg
  Extern testrapport » LG Gram 17 17Z90S-G.AA79G

Asus Zenbook 14 OLED Q425: Intel Core Ultra 7 155H, 14.00", 1.3 kg
  Extern testrapport » Asus Zenbook 14 OLED Q425

LG gram Pro 17Z90SP: Intel Core Ultra 7 155H, 17.00", 1.3 kg
  Extern testrapport » LG gram Pro 17Z90SP

Dell Inspiron 14 Plus 7440: Intel Core Ultra 7 155H, 14.00", 1.6 kg
  Extern testrapport » Dell Inspiron 14 Plus 7440

Lenovo Yoga Pro 7 14IMH9: Intel Core Ultra 7 155H, 14.50", 1.6 kg
  Extern testrapport » Lenovo Yoga Pro 7 14IMH9

LG gram Pro 2-in-1 16T90SP: Intel Core Ultra 7 155H, 16.00", 1.4 kg
  Extern testrapport » LG gram Pro 2-in-1 16T90SP

Xiaomi RedmiBook Pro 16 2024: Intel Core Ultra 7 155H, 16.00", 1.9 kg
  Extern testrapport » Xiaomi RedmiBook Pro 16 2024

Lenovo Yoga Slim 7 14IMH9: Intel Core Ultra 7 155H, 14.00", 1.4 kg
  Extern testrapport » Lenovo Yoga Slim 7 14IMH9

Samsung Galaxy Book4 Pro 360, Ultra 7 155H: Intel Core Ultra 7 155H, 16.00", 1.7 kg
  Extern testrapport » Samsung Galaxy Book4 Pro 360, Ultra 7 155H

Lenovo ThinkPad X1 Carbon G12: Intel Core Ultra 7 155H, 14.00", 1.1 kg
  Extern testrapport » Lenovo ThinkPad X1 Carbon G12

Samsung Galaxy Book4 Pro 14: Intel Core Ultra 7 155H, 14.00", 1.2 kg
  Extern testrapport » Samsung Galaxy Book4 Pro 14

Samsung Galaxy Book4 Pro 16: Intel Core Ultra 7 155H, 16.00", 1.5 kg
  Extern testrapport » Samsung Galaxy Book4 Pro 16

MSI Claw: Intel Core Ultra 7 155H, 7.00", 0.7 kg
  Extern testrapport » MSI Claw

HP Spectre x360 16-aa0074ng: Intel Core Ultra 7 155H, 16.00", 1.9 kg
  Extern testrapport » HP Spectre x360 16-aa0074ng

Lenovo Yoga 9 14IMH9: Intel Core Ultra 7 155H, 14.00", 1.3 kg
  Extern testrapport » Lenovo Yoga 9 14IMH9

HP Spectre x360 14-eu0078ng: Intel Core Ultra 7 155H, 14.00", 1.5 kg
  Extern testrapport » HP Spectre x360 14-eu0078ng

MSI Prestige 16 B1MG-001US: Intel Core Ultra 7 155H, 16.00", 1.6 kg
  Extern testrapport » MSI Prestige 16 B1MG-001US

Acer Swift Go 14 SFG14-72: Intel Core Ultra 7 155H, 14.00", 1.3 kg
  Extern testrapport » Acer Swift Go 14 SFG14-72

Medion E15443: Intel Core Ultra 7 155H, 15.60", 1.8 kg
  Extern testrapport » Medion E15443

MSI Prestige 13 AI Evo: Intel Core Ultra 7 155H, 13.30", 1 kg
  Extern testrapport » MSI Prestige 13 AI Evo

Asus Zenbook Duo OLED UX8406MA: Intel Core Ultra 9 185H, 14.00", 1.7 kg
  Extern testrapport » Asus Zenbook Duo OLED UX8406MA

Asus ZenBook 14 UX3405MA: Intel Core Ultra 7 155H, 14.00", 1.2 kg
  Extern testrapport » Asus ZenBook 14 UX3405MA

Framework Laptop 13.5 Core Ultra 7 155H: Intel Core Ultra 7 155H, 13.50", 1.4 kg
   » Framework Laptop Brick System breidt notebook uit met Lego-voetjes, wieltjes, kabelhouders en meer

Minisforum AtomMan X7 Ti: Intel Core Ultra 9 185H, 0.9 kg
   » Minisforum onthult de AMD-aangedreven AtomMan X7 Pt met OCuLink-ondersteuning, vloeistofkoeling en tot 64 GB geheugen

   » Minisforum onthult de all-AMD AtomMan G7 Pt mini PC met een 16-core Ryzen 9, RX 7600M XT discrete GPU en tot 96 GB geheugen

Asus Zenbook Duo OLED UX8406MA: Intel Core Ultra 9 185H, 14.00", 1.7 kg
   » Asus Zenbook Duo OLED (2024) momenteel het beste apparaat met meerdere schermen op de markt

Asus ZenBook 14 UX3405MA: Intel Core Ultra 7 155H, 14.00", 1.2 kg
   » De nieuwe Asus Zenbook 14 OLED 2024 heeft één grote tekortkoming

Please share our article, every link counts!
Mail Logo

Klasse 1

Klasse 2

M4 32-core GPU *
GeForce RTX 3060 Laptop GPU
M1 Max 32-Core GPU *
GeForce RTX 2070 Super Mobile
M1 Max 24-Core GPU *
Quadro RTX 5000 Max-Q
Radeon RX 5700M *
Quadro RTX 4000 (Laptop)
M1 Pro 16-Core GPU *
Radeon PRO W6600M *
GeForce RTX 2070 Super Max-Q
Quadro RTX 4000 Max-Q *
M1 Pro 14-Core GPU *
Quadro P5200
GeForce GTX 1080 Max-Q
GeForce GTX 1070 Mobile
Quadro P4200
Quadro P5000
GeForce GTX 1070 Max-Q
Quadro P5000 Max-Q *
GeForce RTX 3050 4GB Laptop GPU
Quadro P4000
Quadro P4000 Max-Q
Quadro P3200
Radeon RX 580X (Laptop) *
Radeon RX 580 (Laptop)
Radeon Pro 5300M
Radeon RX 5300M
Quadro P3000
Quadro P3000 Max-Q *
Quadro T2000 Max-Q *
Radeon Pro WX 7100 *
Radeon RX 570X (Laptop) *

Klasse 3

Radeon RX 570 (Laptop) *
Radeon RX 470 (Laptop) *
Quadro T1000 Max-Q *
Vega M GH
GeForce GTX 1050 Ti Mobile
Radeon 680M
Quadro P2000
Quadro P2000 Max-Q
Quadro M4000M
T500 Laptop GPU *
Radeon R9 M395X
GeForce GTX 1050 Ti Max-Q *
Radeon Pro Vega 16
WX Vega M GL
Radeon R9 M485X
Quadro M3000M
FirePro W7170M
GeForce GTX 1050 Max-Q *
Radeon 660M
Radeon Pro WX 4150 *
Radeon RX 560X (Laptop)
Radeon RX 560 (Laptop)
Quadro M2200
Quadro P1000
Radeon Pro 560X
Radeon Pro 560
Radeon Pro 460
Radeon Pro WX 4130 *
Quadro P620 *
Radeon RX 550X (Laptop)
Radeon RX 550 (Laptop)
Radeon Pro WX 3200 *
Radeon Pro 555X
Radeon Pro 555
Radeon Pro 455
Quadro P600
Radeon RX 540X *
Radeon Pro WX 2100 *
Radeon Pro WX 3100 *
Radeon Pro 450
Radeon 630
Radeon 540X *
Radeon R9 M385X
Quadro P520
Quadro M620 *
Quadro P500 *
Iris Plus Graphics G7 (Ice Lake 64 EU) *
Vega 10 *
Iris Pro Graphics 580
FirePro W5170M *
Vega 9
FirePro W5130M
UHD Graphics Xe G4 48EUs *
UHD Graphics 32EUs
UHD Graphics Xe 32EUs (Tiger Lake-H) *
UHD Graphics 750
UHD Graphics 730
Vega 7
Radeon R7 M465
Quadro M520
Vega 8
Iris Plus Graphics G4 (Ice Lake 48 EU)
Quadro M600M
FirePro W4190M
Radeon R9 M375
Radeon R7 M445
Iris Plus Graphics 650
Radeon 625
Vega 6 *
UHD Graphics 24EUs (Alder Lake-N) *
Radeon R7 M460 *
Radeon R7 M360
Radeon 620
Radeon R7 M340
Radeon 610
Radeon 610M *
Vega 6 *
UHD Graphics G1 (Ice Lake 32 EU)
UHD Graphics Xe 16EUs (Tiger Lake-H) *
Radeon R5 (Bristol Ridge)
Adreno 690 *
Adreno 685 *
Adreno 680 *
Radeon R5 M330
GeForce 910M

Klasse 4

Radeon R5 M320 *
Radeon R5 M315 *
Radeon R5 M420 *
UHD Graphics 617
UHD Graphics 615
UHD Graphics (Jasper Lake 24 EU) *
UHD Graphics 610
HD Graphics 610
UHD Graphics 605
Radeon R4 (Stoney Ridge)
Radeon R2 (Stoney Ridge)
VideoCore VII *
UHD Graphics 600

* Benaderende positie van de videokaart

Klaus Hinum, 2023-12-14 (Update: 2023-12-14)