Notebookcheck Logo

Mini-LED op een 16-inch convertible: Dell Inspiron 16 7640 2-in-1 beoordeling
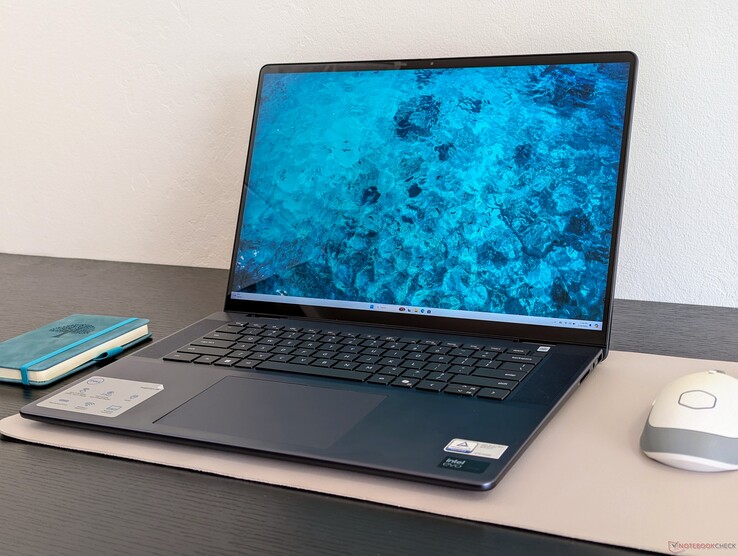
2.5K HDR600 voor $1000 USD.

Mini-LED-panelen waren voorheen alleen beschikbaar op gaminglaptops in het hogere segment, maar beginnen nu ook door te druppelen naar meer mainstream multimedia-opties, waaronder de Dell Inspiron-serie. Dit specifieke model is intrigerend omdat het een van de eerste 16-inch convertibles is met een 2,5K mini-LED touchscreen.
2024 Dell Inspiron 16 7640 2-in-1

De 2024 Inspiron 16 7640 2-in-1 volgt de 2023 Inspiron 16 7630 2-in-1 op met bijgewerkte Intel 14e generatie internals en verschillende externe veranderingen. Het meest opvallende is misschien wel dat het model van dit jaar een 90 Hz 1600p mini-LED-touchscreen heeft, dat het 2400p OLED-touchscreen van de Inspiron 16 7630 2-in-1 vervangt. Ondertussen is het 60 Hz 1200p IPS-touchscreen van de Inspiron 16 7635 2-in-1 teruggekeerd op bepaalde SKU's in het lagere segment.

Onze testunit is een high-end configuratie met de Meteor Lake-H Core Ultra 7 155H CPU en geïntegreerde Arc 8 grafische processor voor ongeveer $1000 USD. Een goedkopere optie met de Core Ultra 5 125U is beschikbaar met het oudere 60 Hz 1200p IPS-paneel voor $200 minder, maar in beide gevallen zijn er geen discrete GPU-opties. Interessant is dat de Inspiron 16 7640 2-in-1 een van de weinige convertibles is met zowel Core-U als Core-H processoropties, aangezien de meeste slechts de ene en niet de andere bieden.

Op dit moment zijn er nog geen AMD Zen 4 SKU's beschikbaar. Mochten die er in de toekomst komen, dan zullen deze waarschijnlijk onder de modelnaam Inspiron 16 7645 2-in-1 verschijnen, die de op AMD gebaseerde Inspiron 16 7635 2-in-1 zou opvolgen.

Concurrenten voor de Inspiron 16 7640 2-in-1 zijn andere 16-inch convertibles uit het midden- tot hogere middensegment, zoals de HP Envy x360 2-in-1 16 of Lenovo Yoga 7 2-in-1 16. De Dell is echter uniek met zijn mini-LED-optie.

Meer Dell beoordelingen:

Dell Inspiron 16 7640 2-in-1 (Inspiron 16 Serie)
Processor
Intel Core Ultra 7 155H 16 x 3.8 - 4.8 GHz, 88 W PL2 / Short Burst, 45 W PL1 / Sustained, Meteor Lake-H
Grafische kaart
Intel Arc 8-Core iGPU, Core: 2250 MHz, LPDDR5X, 31.0.101.5234
Geheugen
16 GB 
, LPDDR5X, 6400 MT/s, Dual-Channel
Beeldscherm
16.00 inch 16:10, 2560 x 1600 pixel 189 PPI, 10-point capacitive, AU Optronics B160QAT, Mini-LED, Dell P/N: NVF5M, AUOD8AC, glimmend: ja, HDR, 90 Hz
Moederbord
Intel Meteor Lake-U/P/H PCH
Opslag
Micron 2550 1TB, 1024 GB 
Geluidskaart
Intel Meteor Lake-U/P/H PCH - cAVS (Audio, Voice, Speech)
Verbindingen
2 USB 3.0, 2 USB 3.1 Gen2, 2 Thunderbolt, USB-C Power Delivery (PD), 1 HDMI, 2 DisplayPort, Audio Verbindingen: 3.5 mm combo, Card Reader: SD, 1 Vingerafdruklezer, Sensoren: Accelerometer
Netwerkmogelijkheden
Intel Wi-Fi 6E AX211 (a/b/g/h/n = Wi-Fi 4/ac = Wi-Fi 5/ax = Wi-Fi 6/ Wi-Fi 6E 6 GHz), Bluetooth 5.3
Afmetingen
hoogte x breedte x diepte (in mm): 18.99 x 356.78 x 250.6
Batterij
90 Wh Lithium-Polymer
Besturingssysteem
Microsoft Windows 11 Home
Camera
Webcam: 1080p30
Primaire camera: 2 MPix
Bijkomende functionaliteiten
Luidsprekers: Quad, Toetsenbord: Chiclet, Toetsenbordverlichting: ja, MyDell, Digital Delivery, 12 Maanden Garantie
Gewicht
2.113 kg, Voeding: 376 g
Prijs
1000 USD
Amazon
Opmerking: De fabrikant kan onderdelen van verschillende leveranciers gebruiken, waaronder beeldschermen, schijven of geheugensticks met vergelijkbare specificaties.


Potentiële concurrenten in vergelijkings

Evaluatie
Versie
Datum
Model
Gewicht
Hoogte
Formaat
Resolutie
Beste prijs
82.1 %v8
07-2024
Dell Inspiron 16 7640 2-in-1
Ultra 7 155H, Arc 8-Core
2.1 kg18.99 mm16.00"2560x1600
83.4 %v8
06-2024
Dell Inspiron 16 Plus 7640
Ultra 7 155H, NVIDIA GeForce RTX 4060 Laptop GPU
2.2 kg19.9 mm16.00"2560x1600
87.2 %
v7 (old)
v7 (old)
05-2024
HP Envy x360 2-in-1 16-ad0097nr
R7 8840HS, Radeon 780M
1.8 kg18.3 mm16.00"2880x1800
87.9 %
v7 (old)
v7 (old)
05-2024
Lenovo IdeaPad Pro 5 16IMH G9
Ultra 7 155H, Arc 8-Core
1.9 kg17.5 mm16.00"2560x1600
88.7 %
v7 (old)
v7 (old)
02-2024
HP Pavilion Plus 16-ab0456tx
i7-13700H, GeForce RTX 3050 6GB Laptop GPU
1.9 kg19.9 mm16.00"2560x1600
87.6 %
v7 (old)
v7 (old)
11-2023
Asus VivoBook Pro 16 K6602VU
i9-13900H, NVIDIA GeForce RTX 4050 Laptop GPU
1.9 kg19 mm16.00"3200x2000

Koffer - stevig maar zwaar

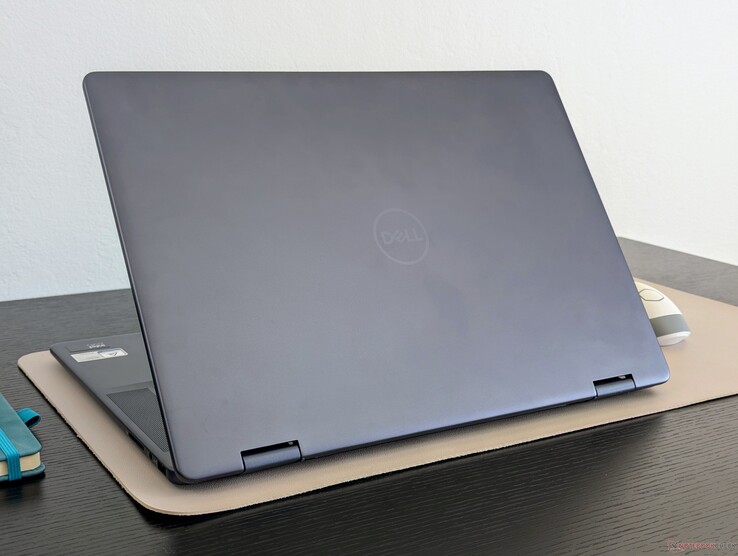
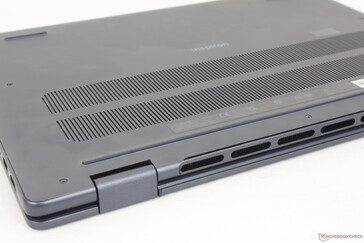
Er zijn verschillende uiterlijke wijzigingen ten opzichte van het vorige model. Ten eerste is de palmsteun niet langer verhoogd voor een schonere rand tussen de palmsteun en het toetsenbord. Ten tweede zijn de ventilatieroosters langs de onderkant en achterkant iets groter geworden. Ten derde is de achterrand zelf brutaler voor een doosachtiger uiterlijk.

Afgezien van de bovenstaande esthetische veranderingen, blijven de materialen van het chassis hetzelfde als voorheen en zijn er geen grote verbeteringen op het gebied van stevigheid of kwaliteit. Het deksel en de onderkant bestaan nog steeds uit respectievelijk aluminium en kunststof, met een goede weerstand tegen draaien en indrukken voor een solide eerste indruk, vooral voor een middenklasse model. We maken ons niet zozeer zorgen over de bouwkwaliteit van het model als wel over hoe zwaar het is om in tabletmodus te gebruiken.

Zowel de afmetingen als het gewicht zijn vrijwel gelijk aan die van de 2023 Inspiron 16 7630 2-in-1 en de 2024 Inspiron 16 Plus 7640 clamshell 2024 Inspiron 16 Plus 7640 clamshell ook al heeft de laatste een optie voor een discrete GPU. We hadden liever een lichter ontwerp gezien, aangezien de 16-inch HP Envy x360 16 en Samsung Galaxy Book4 Pro 360 elk merkbaar lichter zijn dan onze Dell. Hoewel een 16-inch convertible hoe dan ook relatief zwaar zal zijn, is de Inspiron 16 7640 2-in-1 waarschijnlijk een van de slechtste van het stel voor op reis.

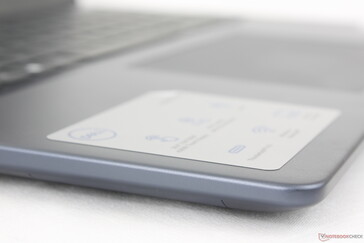
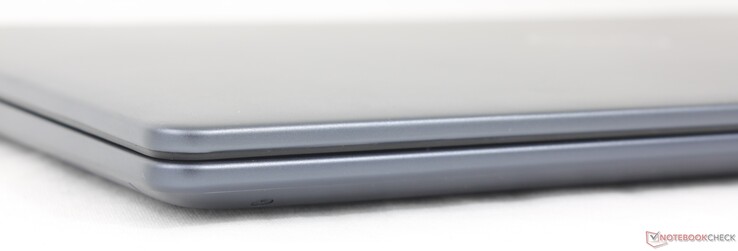
Het model wordt geleverd in de kleuropties Ice Blue of Midnight Blue. De gladde oppervlakken trekken gemakkelijk vingerafdrukken aan
Het model bestaat voor ten minste 30 procent uit post-consumer plastic, voor 50 procent uit gerecycled aluminium voor het buitenste deksel en voor 15 procent uit gerecycled staal voor de scharnieren
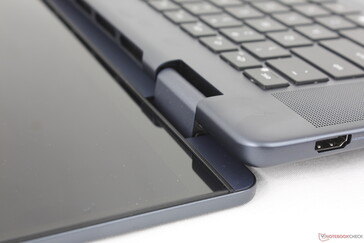
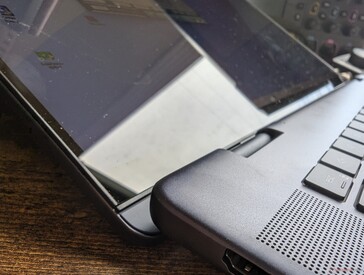
Scharnieren voelen onder alle hoeken gelijkmatig en stijf aan
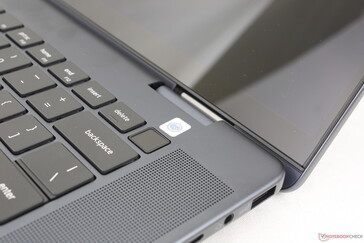
Aan/uit-knop met vingerafdruk is optioneel
De overgang tussen de handpalmsteunen en het toetsenbord is nu vloeiender voor een schoner uiterlijk
Achterrand is nu platter en met grotere ventilatieroosters

Vergelijking grootte

356.78 mm 250.6 mm 19.9 mm 2.2 kg356.78 mm 250.6 mm 18.99 mm 2.1 kg356.78 mm 251.7 mm 18.99 mm 2 kg357 mm 246 mm 18.3 mm 1.8 kg356 mm 251 mm 17.5 mm 1.9 kg355 mm 252 mm 13 mm 1.7 kg297 mm 210 mm 1 mm 5.7 g

Connectiviteit

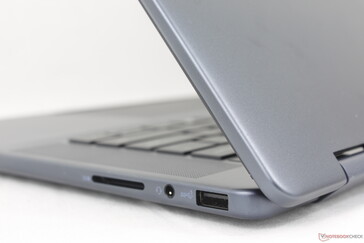
Poortopties en positionering blijven identiek aan die van de Inspiron 16 7635 2-in-1 of 7630 2-in-1, ondanks de vele veranderingen aan de buitenkant. Merk op dat Thunderbolt 4 opnieuw alleen beschikbaar is op de Intel SKU's en dat de HDMI-poort nog steeds alleen versie 1.4 is.

Voorkant: Geen poorten
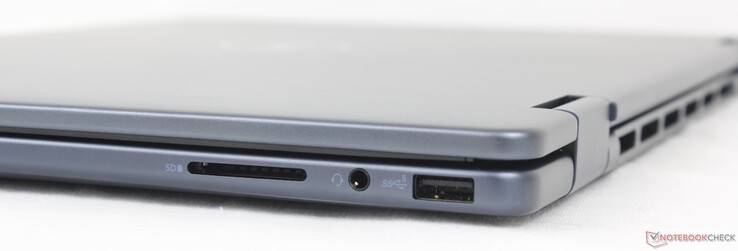
Rechts: SD-kaartlezer, 3,5 mm headset, USB-A 3.2 Gen. 1
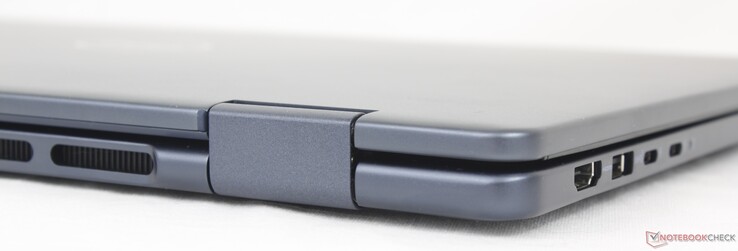
Achterzijde: Geen poorten
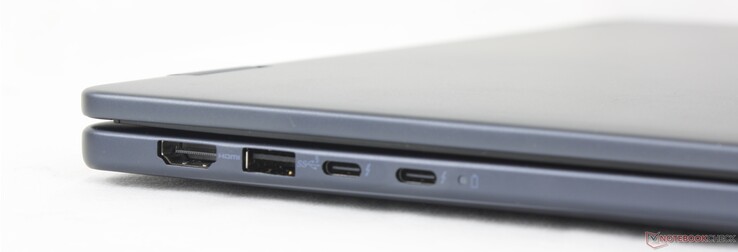
Links: HDMI 1.4, USB-A 3.2 Gen. 1, 2x USB-C + Thunderbolt 4 w/ Power Delivery + DisplayPort 1.4

SD-kaartlezer

De overdrachtsnelheden met de geïntegreerde SD-kaartlezer zijn met net geen 30 MB/s niet verbeterd ten opzichte van het model van vorig jaar. 16-inch clamshells zoals de Lenovo IdeaPad Pro 5 16 kunnen meer dan 2x sneller zijn en de XPS 16 is zelfs nog sneller. Gebruikers die afhankelijk zijn van SD-kaarten kunnen de handige geïntegreerde kaartlezer op de Inspiron waarderen, maar ze zullen waarschijnlijk ook teleurgesteld zijn door de lage snelheden.

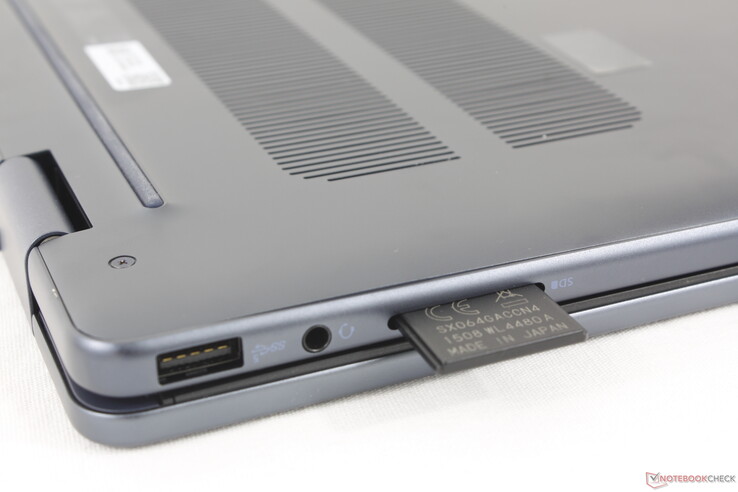
Volledig ingestoken SD-kaart steekt nog de helft uit
SD Card Reader
average JPG Copy Test (av. of 3 runs)
Samsung Galaxy Book4 Pro 360
Intel Core Ultra 5 125H (Angelbird AV Pro V60)
77.3 MB/s +175%
Lenovo IdeaPad Pro 5 16IMH G9
Intel Core Ultra 7 155H (Angelbird AV Pro V60)
74.1 MB/s +164%
Dell Inspiron 16 7635 2-in-1
AMD Ryzen 5 7530U (PNY EliteX-Pro60 V60 256 GB)
32.2 MB/s +15%
Dell Inspiron 16 7640 2-in-1
Intel Core Ultra 7 155H (Toshiba Exceria Pro SDXC 64 GB UHS-II)
28.1 MB/s
Dell Inspiron 16 Plus 7640
Intel Core Ultra 7 155H (Angelbird AV Pro V60)
22.2 MB/s -21%
maximum AS SSD Seq Read Test (1GB)
Lenovo IdeaPad Pro 5 16IMH G9
Intel Core Ultra 7 155H (Angelbird AV Pro V60)
87.5 MB/s +203%
Samsung Galaxy Book4 Pro 360
Intel Core Ultra 5 125H (Angelbird AV Pro V60)
87.4 MB/s +202%
Dell Inspiron 16 7635 2-in-1
AMD Ryzen 5 7530U (PNY EliteX-Pro60 V60 256 GB)
36.9 MB/s +28%
Dell Inspiron 16 7640 2-in-1
Intel Core Ultra 7 155H (Toshiba Exceria Pro SDXC 64 GB UHS-II)
28.9 MB/s
Dell Inspiron 16 Plus 7640
Intel Core Ultra 7 155H (Angelbird AV Pro V60)
28.7 MB/s -1%

Communicatie

Het model wordt geleverd met dezelfde Intel AX211 WLAN-module als op de Inspiron 16 7640 clamshell voor Wi-Fi 6E en Bluetooth 5.3 connectiviteit. De prestaties zijn stabiel wanneer gekoppeld aan onze Asus AXE11000 testrouter, maar de overdrachtsnelheden op het 6 GHz netwerk hadden sneller gekund.

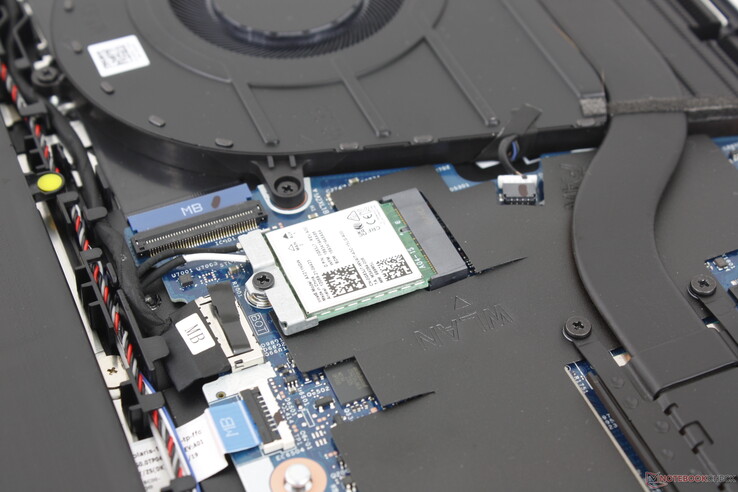
Verwijderbare WLAN-module
Networking
iperf3 transmit AXE11000
Lenovo IdeaPad Pro 5 16IMH G9
Intel Wi-Fi 6E AX211
1656 (1459min, 1468.28P1 - 1743max) MBit/s +41%
Samsung Galaxy Book4 Pro 360
Intel Wi-Fi 6E AX211
1623 (1402min, 1436.8P1 - 1747max) MBit/s +39%
HP Envy x360 2-in-1 16-ad0097nr
MediaTek Wi-Fi 6E MT7922 160MHz Wireless LAN Card
1608 (1424min - 1752max) MBit/s +37%
Dell Inspiron 16 7635 2-in-1
MediaTek Wi-Fi 6E MT7922 160MHz Wireless LAN Card
1199 (655min - 1384max) MBit/s +2%
Dell Inspiron 16 7640 2-in-1
Intel Wi-Fi 6E AX211
1171 (541min - 1268max) MBit/s
Dell Inspiron 16 Plus 7640
Intel Wi-Fi 6E AX211
811 (428min - 1008max) MBit/s -31%
iperf3 receive AXE11000
Lenovo IdeaPad Pro 5 16IMH G9
Intel Wi-Fi 6E AX211
1666 (1617min, 1623.96P1 - 1687max) MBit/s +20%
Samsung Galaxy Book4 Pro 360
Intel Wi-Fi 6E AX211
1664 (1553min, 1558.51P1 - 1710max) MBit/s +19%
HP Envy x360 2-in-1 16-ad0097nr
MediaTek Wi-Fi 6E MT7922 160MHz Wireless LAN Card
1551 (1450min - 1626max) MBit/s +11%
Dell Inspiron 16 7640 2-in-1
Intel Wi-Fi 6E AX211
1393 (1209min - 1489max) MBit/s
Dell Inspiron 16 7635 2-in-1
MediaTek Wi-Fi 6E MT7922 160MHz Wireless LAN Card
1361 (1256min - 1412max) MBit/s -2%
Dell Inspiron 16 Plus 7640
Intel Wi-Fi 6E AX211
1000 (899min - 1078max) MBit/s -28%
iperf3 transmit AXE11000 6GHz
HP Envy x360 2-in-1 16-ad0097nr
MediaTek Wi-Fi 6E MT7922 160MHz Wireless LAN Card
1626 (1381min - 1818max) MBit/s +137%
Dell Inspiron 16 7635 2-in-1
MediaTek Wi-Fi 6E MT7922 160MHz Wireless LAN Card
1329 (1277min - 1424max) MBit/s +94%
Dell Inspiron 16 Plus 7640
Intel Wi-Fi 6E AX211
705 (634min - 769max) MBit/s +3%
Dell Inspiron 16 7640 2-in-1
Intel Wi-Fi 6E AX211
685 (588min - 745max) MBit/s
iperf3 receive AXE11000 6GHz
HP Envy x360 2-in-1 16-ad0097nr
MediaTek Wi-Fi 6E MT7922 160MHz Wireless LAN Card
1639 (1591min - 1742max) MBit/s +64%
Dell Inspiron 16 7635 2-in-1
MediaTek Wi-Fi 6E MT7922 160MHz Wireless LAN Card
1320 (1251min - 1377max) MBit/s +32%
Dell Inspiron 16 7640 2-in-1
Intel Wi-Fi 6E AX211
999 (793min - 1051max) MBit/s
Dell Inspiron 16 Plus 7640
Intel Wi-Fi 6E AX211
700 (607min - 805max) MBit/s -30%
05010015020025030035040045050055060065070075080085090095010001050Tooltip
Dell Inspiron 16 7640 2-in-1; iperf3 transmit AXE11000 6GHz; iperf 3.1.3: Ø686 (588-745)
Dell Inspiron 16 7640 2-in-1; iperf3 receive AXE11000 6GHz; iperf 3.1.3: Ø998 (793-1051)

Webcam

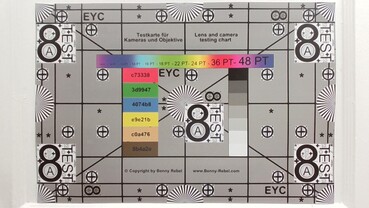
De 2 MP webcam is weer standaard voorzien van een IR-sensor en een fysieke sluiter.
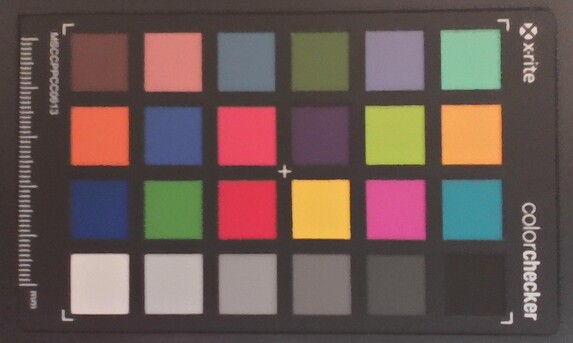
ColorChecker
4.8 ∆E
10.5 ∆E
9.2 ∆E
6.8 ∆E
10.4 ∆E
7.5 ∆E
15.5 ∆E
5.9 ∆E
7.8 ∆E
8.6 ∆E
5.4 ∆E
9 ∆E
8.2 ∆E
4.6 ∆E
10.7 ∆E
9.1 ∆E
7.3 ∆E
7.5 ∆E
13.5 ∆E
7.5 ∆E
6.3 ∆E
5.5 ∆E
3.4 ∆E
3.6 ∆E
ColorChecker Dell Inspiron 16 7640 2-in-1: 7.86 ∆E min: 3.44 - max: 15.54 ∆E

Onderhoud

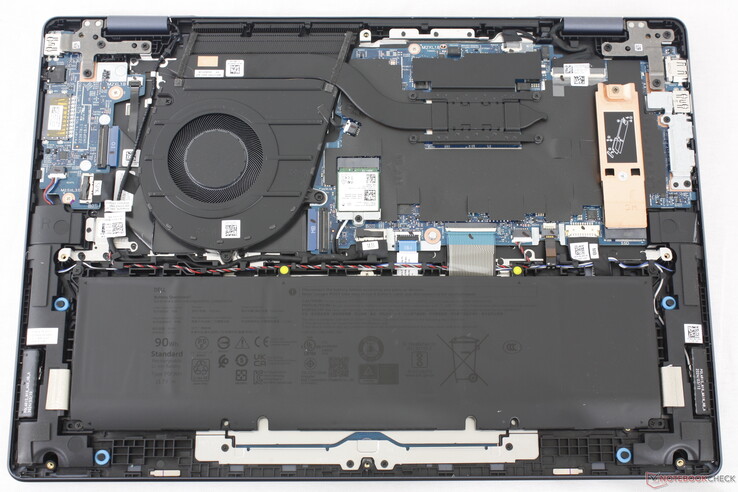
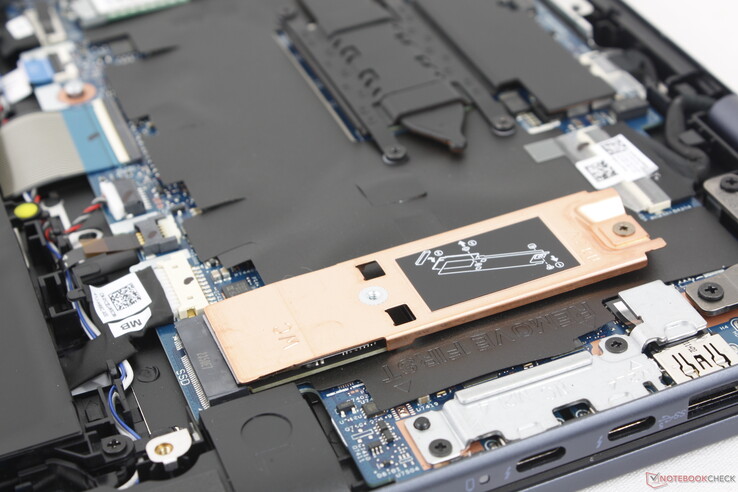
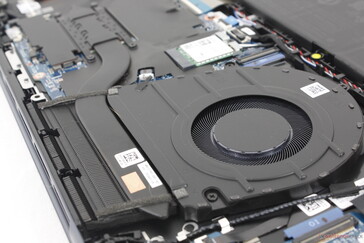
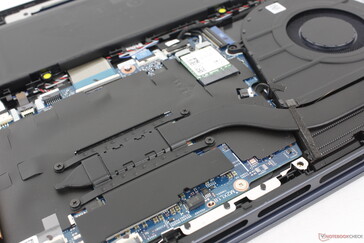
Er zijn verschillende interne verschillen tussen ons model en de Inspiron 16 7635 2-in-1 van vorig jaar. Met name de SSD is verplaatst om ruimte te maken voor de grotere ventilator en batterij, terwijl de heat pipe nu iets dikker is om de kortere lengte te compenseren. Secundaire SSD's worden nog steeds niet ondersteund en het RAM-geheugen kan niet door de gebruiker worden geüpgraded.

Inspiron 16 7640 2-in-1
Inspiron 16 7635 2-in-1 ter vergelijking

Accessoires en garantie

De verkoopverpakking bevat een actieve styluspen (PN5122W) naast het papierwerk en de AC-adapter. De standaard beperkte garantie van één jaar is van toepassing bij aankoop in de VS.

Invoerapparaten - Goed, maar nog steeds een beetje sponzig

Toetsenbord en touchpad

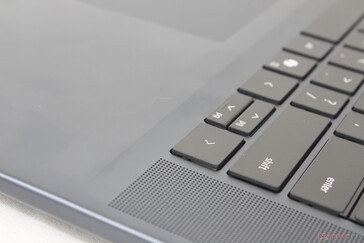
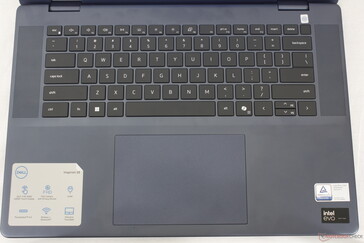
Het toetsenbord en touchpad zijn niet veranderd ten opzichte van de Inspiron 7630 2-in-1 serie, ondanks alle fysieke veranderingen elders op het chassis. Er zijn een paar kleine verschillen, zoals de iets kleinere aan/uit-knop op ons nieuwere model en de introductie van de speciale Co-Pilot toets, maar alles van clickpad grootte (13,3 x 9 cm) en toets feedback zijn identiek aan het model van vorig jaar. Het zou leuk zijn geweest om in dit opzicht verbeteringen te zien, want we vinden de toetsen en het clickpad op de Inspiron nog steeds sponziger en met minder bevredigende feedback dan de toetsen en het clickpad op de HP Envy-serie.

QWERTY-indeling met luidsprekerroosters langs de zijkanten
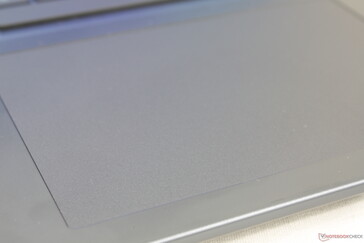
Groot clickpad en handpalmsteunen trekken gemakkelijk vingerafdrukken aan
Toetsen voelen oppervlakkig en met zwakke feedback tijdens het typen
De pijltjestoetsen omhoog en omlaag voelen krap aan

Beeldscherm - 2,5K Mini-LED HDR600

Scherpe RGB-pixels van de glanzende overlay

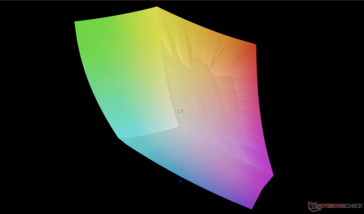
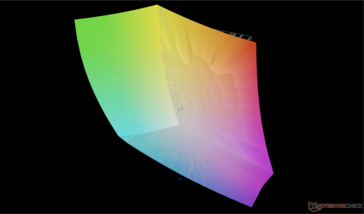
Het optionele Mini-LED paneel is een belangrijk verkoopargument voor de Inspiron 16 2-in-1 van dit jaar. Hoewel het misschien geen 4K en HDR1000 biedt zoals op sommige extreme gaming laptopsmaar de 2,5K resolutie en HDR600 ondersteuning zijn nog steeds indrukwekkend voor een 16-inch convertible van rond de $1000. Gebruikers krijgen nog steeds dezelfde uitstekende contrastverhouding van 3000:1 en volledige DCI-P3-kleuren als op de meeste andere mini-LED-panelen op duurdere laptops.

Zowel kleuren als helderheid worden automatisch ingesteld op respectievelijk sRGB en 400 nits maximaal wanneer HDR is uitgeschakeld. Als u HDR inschakelt, wordt het kleurprofiel gewijzigd naar DCI-P3 en wordt de maximale helderheid verhoogd naar 663 nits bij het afspelen van HDR-inhoud.

De oorspronkelijke vernieuwingsfrequentie van 90 Hz is respectabel, maar het paneel mist ondersteuning voor adaptieve synchronisatie en Windows variabele vernieuwingsfrequentie om energie te besparen.

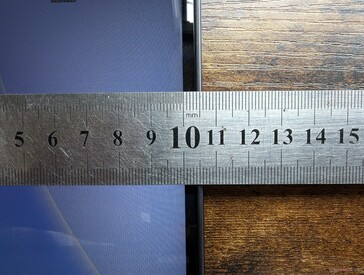
Glasbescherming van rand tot rand
Smalle zijpanelen
Smalle zijpanelen
415.4
cd/m²
407.3
cd/m²
409.2
cd/m²
410.7
cd/m²
413
cd/m²
410.5
cd/m²
404.4
cd/m²
406
cd/m²
407.5
cd/m²
Helderheidsverdeling
AU Optronics B160QAT getest met X-Rite i1Pro 2
Maximum: 415.4 cd/m² (Nits) Gemiddelde: 409.3 cd/m² Minimum: 22.8 cd/m²
Helderheidsverdeling: 97 %
Helderheid in Batterij-modus: 413 cd/m²
Contrast: 2950:1 (Zwart: 0.14 cd/m²)
ΔE Color 3.48 | 0.5-29.43 Ø4.9
ΔE Greyscale 4.5 | 0.5-98 Ø5.2
92.5% AdobeRGB 1998 (Argyll 2.2.0 3D)
100% sRGB (Argyll 2.2.0 3D)
99.4% Display P3 (Argyll 2.2.0 3D)
Gamma: 2.15
Dell Inspiron 16 7640 2-in-1
AU Optronics B160QAT, Mini-LED, 2560x1600, 16", 90 Hz
Dell Inspiron 16 Plus 7640
AU Optronics B160QAN, IPS, 2560x1600, 16", 120 Hz
Dell Inspiron 16 7635 2-in-1
Chi Mei 160JCA, IPS, 1920x1200, 16", 60 Hz
HP Envy x360 2-in-1 16-ad0097nr
Samsung SDC41A6, OLED, 2880x1800, 16", 120 Hz
Lenovo IdeaPad Pro 5 16IMH G9
NE160QDM-NY2, IPS, 2560x1600, 16", 120 Hz
Samsung Galaxy Book4 Pro 360
ATNA60CL09-0, OLED, 2880x1800, 16", 120 Hz
Display
-14%
-20%
1%
-23%
2%
Display P3 Coverage
99.4
76
-24%
67.4
-32%
99.6
0%
63.3
-36%
99.9
1%
sRGB Coverage
100
99.8
0%
98.2
-2%
100
0%
95.2
-5%
100
0%
AdobeRGB 1998 Coverage
92.5
76.7
-17%
69.5
-25%
96.5
4%
65.3
-29%
96.6
4%
Response Times
3%
-5%
37%
43%
35%
Response Time Grey 50% / Grey 80% *
15.4 ?(8.6, 6.8)
25.6 ?(12.3, 13.3)
-66%
27.6 ?(13.2, 14.3)
-79%
0.8 ?(0.45, 0.35)
95%
15 ?(7.4, 7.6)
3%
0.49 ?(0.25, 0.24)
97%
Response Time Black / White *
60.6 ?(56.2, 4.4)
17.6 ?(8.5, 9.1)
71%
18.2 ?(9.6, 7.6)
70%
0.89 ?(0.42, 0.47)
99%
10.3 ?(5.6, 4.7)
83%
0.67 ?(0.37, 0.3)
99%
PWM Frequency
2753.7 ?(100)
491.8 ?(100)
-82%
240 ?(100)
-91%
Screen
-5%
-25%
10%
-21%
33%
Brightness middle
413
314.7
-24%
301.3
-27%
399.4
-3%
368
-11%
387
-6%
Brightness
409
291
-29%
269
-34%
405
-1%
368
-10%
392
-4%
Brightness Distribution
97
89
-8%
79
-19%
98
1%
91
-6%
98
1%
Black Level *
0.14
0.28
-100%
0.28
-100%
0.31
-121%
Contrast
2950
1124
-62%
1076
-64%
1187
-60%
Colorchecker dE 2000 *
3.48
1.62
53%
3.1
11%
4.05
-16%
2.4
31%
1
71%
Colorchecker dE 2000 max. *
6.97
2.94
58%
5.5
21%
6.69
4%
6.5
7%
1.9
73%
Greyscale dE 2000 *
4.5
1.3
71%
3.9
13%
1.1
76%
4.5
-0%
1.7
62%
Gamma
2.15 102%
2.26 97%
2.19 100%
2.27 97%
2.21 100%
2.25 98%
CCT
6446 101%
6385 102%
6186 105%
6419 101%
6324 103%
6325 103%
Colorchecker dE 2000 calibrated *
1.08
0.49
1.02
0.8
Totaal Gemiddelde (Programma / Instellingen)
-5% / -6%
-17% / -21%
16% / 15%
-0% / -12%
23% / 26%

* ... kleiner is beter

vs. sRGB
vs. sRGB
vs. P3
vs. P3

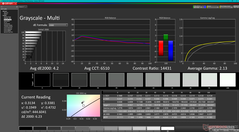
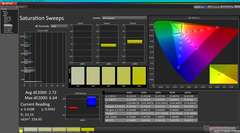
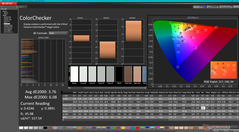
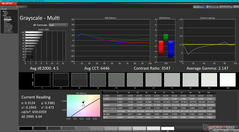
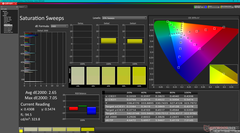
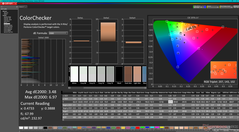
Het beeldscherm is redelijk nauwkeurig voor een midrange PC met gemiddelde grijswaarden en kleuren DeltaE waarden van respectievelijk 4,2 en 3,76. Deze waarden blijven relatief stabiel als HDR ook is ingeschakeld, waardoor het systeem automatisch overschakelt naar DCI-P3 kleuren. In beide gevallen is de kleurtemperatuur iets te koel rond 6500K.

Grijswaarden (HDR uit, sRGB)
Verzadigingsvegen (HDR uit, sRGB)
Kleurencontrole (HDR uit, sRGB)
Grijswaarden (HDR aan, DCi-P3)
Verzadigingsvegen (HDR aan, DCI-P3)
ColorChecker (HDR aan, DCi-P3)

Responstijd Scherm

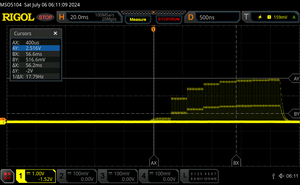
De responstijden van het scherm tonen hoe snel het scherm in staat is om van één kleur naar de andere te veranderen. Trage responstijden kunnen aanleiding geven tot 'nabeelden' rond bewegende objecten of het scherm wazig maken (blur). Vooral spelers van snelle 3D-games hebben baat bij een scherm met snelle responstijden.
       Responstijd Zwart naar Wit
60.6 ms ... stijging ↗ en daling ↘ gecombineerd↗ 56.2 ms stijging
↘ 4.4 ms daling
Het scherm vertoonde trage responstijden in onze tests en is misschien te traag voor games.
Ter vergelijking: alle testtoestellen variëren van 0.1 (minimum) tot 240 (maximum) ms. » 100 % van alle toestellen zijn beter.
Dit betekent dat de gemeten responstijd slechter is dan het gemiddelde (20.9 ms) van alle geteste toestellen.
       Responstijd 50% Grijs naar 80% Grijs
15.4 ms ... stijging ↗ en daling ↘ gecombineerd↗ 8.6 ms stijging
↘ 6.8 ms daling
Het scherm vertoonde prima responstijden in onze tests maar is misschien wat te traag voor competitieve games.
Ter vergelijking: alle testtoestellen variëren van 0.165 (minimum) tot 636 (maximum) ms. » 26 % van alle toestellen zijn beter.
Dit betekent dat de gemeten responstijd beter is dan het gemiddelde (32.8 ms) van alle geteste toestellen.

Screen Flickering / PWM (Pulse-Width Modulation)

Om de schermhelderheid te verlagen schakelen sommige laptops het backlight erg snel aan en uit. Dit gebeurt aan een dergelijk hoge frequentie dat het niet zichtbaar is voor het menselijk oog. Als de frequentie te laag is kunnen personen met gevoelige ogen geïrriteerd geraken, hoofdpijn krijgen en zelfs flickering waarnemen.
Screen flickering / PWM waargenomen 2753.7 Hz ≤ 100 % helderheid instelling

De achtergrondverlichting van het scherm flikkert op 2753.7 Hz (in het slechtste geval, bijvoorbeeld bij gebruik van PWM) aan een helderheid van 100 % en lager. Boven deze helderheid zou er geen flickering / PWM mogen optreden.

De frequentie van 2753.7 Hz is redelijk hoog en de meeste mensen die gevoelig zijn aan flickering zouden dit dus niet mogen waarnemen of geïrriteerde ogen krijgen.

Ter vergelijking: 53 % van alle geteste toestellen maakten geen gebruik van PWM om de schermhelderheid te verlagen. Als het wel werd gebruikt, werd een gemiddelde van 8684 (minimum: 5 - maximum: 343500) Hz waargenomen.

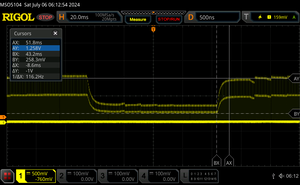
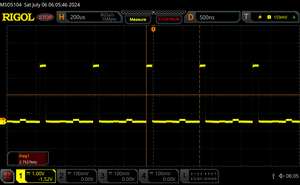
Pulsbreedtemodulatie of flikkeren is aanwezig op alle helderheidsniveaus met een constante frequentie van 2753 Hz. Dit gedrag is te verwachten van een mini-LED-paneel en de frequentie is gelukkig snel genoeg om onmerkbaar te zijn voor de meeste kijkers.

0 procent helderheid
25 procent helderheid
50 procent helderheid
75 procent helderheid
100 procent helderheid

Met 400 nits in SDR-modus of 600 nits in HDR-modus is het scherm helderder dan zowel de basis IPS-optie als de OLED-optie van het vorige model. De Inspiron 16 2-in-1 is echter nog steeds niet helder genoeg voor buiten, waar schittering al snel een probleem wordt. U zou kunnen denken dat het inschakelen van HDR het probleem kan verlichten, omdat dit het helderheidsmaximum verhoogt, maar houd er rekening mee dat de Windows HDR-modus niet beschikbaar is op batterijstroom.

Buiten onder zonlicht
Buiten in de schaduw
Buiten onder zonlicht
Brede mini-LED-kijkhoeken zonder contrastvermindering of regenboogeffect. Het paneel is perfect voor converteerbare oriëntaties

Prestaties - Snel voor een cabriolet

Testomstandigheden

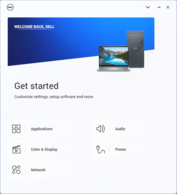
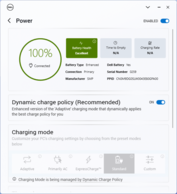
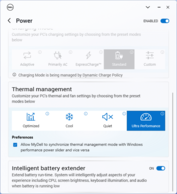
We hebben MyDell ingesteld op de modus Prestaties voordat we de onderstaande benchmarks uitvoerden. De software heeft een handige knop om de Dell energieprofielen met de Windows energieprofielen te synchroniseren, zodat het schakelen tussen energie-instellingen eenvoudiger wordt.

MyDell-homescherm
MyDell-homescherm
Instellingen voor het opladen van de batterij
Instellingen energieprofiel thermisch beheer
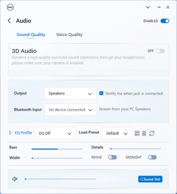
Audio-instellingen
Audio-instellingen

Processor

Het hebben van een Core H-serie CPU in een convertible vormfactor kan soms zorgwekkend zijn, omdat de fabrikant de prestaties kan onderklokken. Gelukkig lijkt dit niet het geval te zijn voor de Inspiron 16 7640 2-in-1, aangezien de Core Ultra 7 155H binnen 5 procent van de gemiddelde pc in onze database zou presteren die met dezelfde processor is uitgerust. Dit maakt het Dell-model een van de snelste convertibles in de 16-inch formaatcategorie en verslaat krachtige opties zoals de Ryzen 7 8840HS in de HP Envy x360 16 2-in-1. Het is ook de moeite waard om op te merken dat deze zelfde CPU ook te vinden is in veel gaming laptops, om aan te tonen dat deze Dell convertible het niet zo nauw neemt met de processorprestaties.

De Turbo Boost duurzaamheid is goed, maar niet perfect. Wanneer we CineBench R15 xT in een lus draaiden, daalde onze oorspronkelijke score van 2680 punten al na drie keer draaien met ongeveer 15 procent. 16-inch clamshells zoals de Lenovo IdeaPad Pro 5 16 of Inspiron 16 Plus 7640 met dezelfde CPU zijn in staat om hogere Turbo Boost kloksnelheden langer vol te houden, zoals de grafiek hieronder laat zien.

Als u kiest voor de goedkopere Core Ultra 5 125U configuratie zal naar verwachting de multi-thread prestaties met 40 procent aanzienlijk beïnvloeden, gebaseerd op onze tijd met de Lenovo Yoga 7 2-in-1 16. De optie uit de Core U-serie kan echter nog steeds ideaal zijn voor diegenen die de voorkeur geven aan de levensduur van de batterij boven rauwe prestaties.

Cinebench R15 Multi Loop

0140280420560700840980112012601400154016801820196021002240238025202660Tooltip
Dell Inspiron 16 7640 2-in-1 Intel Core Ultra 7 155H: Ø2278 (2205.8-2679.71)
Dell Inspiron 16 Plus 7640 Intel Core Ultra 7 155H: Ø2341 (1793.16-2787.26)
Dell Inspiron 16 7635 2-in-1 AMD Ryzen 5 7530U: Ø1360 (1321.57-1414.73)
HP Envy x360 2-in-1 16-ad0097nr AMD Ryzen 7 8840HS: Ø1951 (1885.73-2044.68)
Lenovo IdeaPad Pro 5 16IMH G9 Intel Core Ultra 7 155H: Ø2651 (2550.53-2701.61)
Samsung Galaxy Book4 Pro 360 Intel Core Ultra 5 125H: Ø1227 (1080.79-1700.25)
CPU Performance Rating: Percent
Cinebench R23: Multi Core | Single Core
Cinebench R20: CPU (Multi Core) | CPU (Single Core)
Cinebench R15: CPU Multi 64Bit | CPU Single 64Bit
Blender: v2.79 BMW27 CPU
7-Zip 18.03: 7z b 4 | 7z b 4 -mmt1
Geekbench 6.3: Multi-Core | Single-Core
Geekbench 5.5: Multi-Core | Single-Core
HWBOT x265 Benchmark v2.2: 4k Preset
LibreOffice : 20 Documents To PDF
R Benchmark 2.5: Overall mean
CPU Performance Rating
Lenovo Yoga Pro 9 16IMH9 RTX 4050
Intel Core Ultra 9 185H
90.3 pt
Dell Inspiron 16 Plus 7640
Intel Core Ultra 7 155H
83.7 pt
Dell Inspiron 16 7640 2-in-1
Intel Core Ultra 7 155H
80.9 pt
Gemiddeld Intel Core Ultra 7 155H
 
78.2 pt
Lenovo ThinkPad T16 G2 21K70035GE
AMD Ryzen 7 7840U
76.4 pt
HP Envy x360 2-in-1 16-ad0097nr
AMD Ryzen 7 8840HS
75.3 pt
HP Spectre x360 2-in-1 16-f1075ng -2!
Intel Core i7-12700H
71.5 pt
Samsung Galaxy Book3 Pro 16 -2!
Intel Core i5-1340P
68 pt
Samsung Galaxy Book4 Pro 360 -1!
Intel Core Ultra 5 125H
67.6 pt
LG Gram 2in1 16 16T90R - G.AA78G
Intel Core i7-1360P
67.5 pt
Asus ExpertBook B5 Flip B5602FBN -2!
Intel Core i7-1260P
67.2 pt
Acer Swift X SFX16-52G-52VE -2!
Intel Core i5-1240P
65.3 pt
Lenovo IdeaPad Flex 5 16ABR G8 -2!
AMD Ryzen 7 7730U
62.2 pt
Lenovo Yoga 7 2-in-1 16IML9
Intel Core Ultra 5 125U
61.4 pt
Acer Swift Edge SFE16-42-R1GM -2!
AMD Ryzen 7 7735U
61 pt
Lenovo ThinkPad E16 G1 Core i5-1335U -2!
Intel Core i5-1335U
60.5 pt
Samsung Galaxy Book3 Ultra 16, i9-13900H RTX 4070 -2!
Intel Core i9-13900H
57 pt
Dell Inspiron 16 7635 2-in-1 -2!
AMD Ryzen 5 7530U
56.5 pt
Lenovo Thinkpad X1 Fold 16
Intel Core i7-1250U
54.1 pt
Cinebench R23 / Multi Core
Lenovo Yoga Pro 9 16IMH9 RTX 4050
Intel Core Ultra 9 185H
19236 (18458.9min - 19236max) Points +22%
Dell Inspiron 16 Plus 7640
Intel Core Ultra 7 155H
17675 (14726min - 17675max) Points +12%
Dell Inspiron 16 7640 2-in-1
Intel Core Ultra 7 155H
15802 (14802min - 15802.2max) Points
Gemiddeld Intel Core Ultra 7 155H
  (9769 - 19007, n=50)
15004 Points -5%
Samsung Galaxy Book3 Ultra 16, i9-13900H RTX 4070
Intel Core i9-13900H
13177 Points -17%
HP Envy x360 2-in-1 16-ad0097nr
AMD Ryzen 7 8840HS
13082 (12624.7min - 13082.1max) Points -17%
Lenovo ThinkPad T16 G2 21K70035GE
AMD Ryzen 7 7840U
13053 Points -17%
HP Spectre x360 2-in-1 16-f1075ng
Intel Core i7-12700H
12071 Points -24%
LG Gram 2in1 16 16T90R - G.AA78G
Intel Core i7-1360P
11676 Points -26%
Lenovo IdeaPad Flex 5 16ABR G8
AMD Ryzen 7 7730U
11490 Points -27%
Acer Swift X SFX16-52G-52VE
Intel Core i5-1240P
11427 Points -28%
Asus ExpertBook B5 Flip B5602FBN
Intel Core i7-1260P
11245 Points -29%
Samsung Galaxy Book3 Pro 16
Intel Core i5-1340P
11181 Points -29%
Acer Swift Edge SFE16-42-R1GM
AMD Ryzen 7 7735U
10085 Points -36%
Samsung Galaxy Book4 Pro 360
Intel Core Ultra 5 125H
9965 Points -37%
Lenovo Yoga 7 2-in-1 16IML9
Intel Core Ultra 5 125U
9533 (8675.99min - 9532.96max) Points -40%
Lenovo ThinkPad E16 G1 Core i5-1335U
Intel Core i5-1335U
9157 (5866.85min - 9157.36max) Points -42%
Dell Inspiron 16 7635 2-in-1
AMD Ryzen 5 7530U
8361 (8000.1min - 8361.05max) Points -47%
Lenovo Thinkpad X1 Fold 16
Intel Core i7-1250U
7021 (5691.06min - 7020.54max) Points -56%
Cinebench R23 / Single Core
HP Spectre x360 2-in-1 16-f1075ng
Intel Core i7-12700H
1808 Points +3%
Lenovo Yoga Pro 9 16IMH9 RTX 4050
Intel Core Ultra 9 185H
1798 Points +2%
Asus ExpertBook B5 Flip B5602FBN
Intel Core i7-1260P
1774 Points +1%
Dell Inspiron 16 7640 2-in-1
Intel Core Ultra 7 155H
1756 Points
HP Envy x360 2-in-1 16-ad0097nr
AMD Ryzen 7 8840HS
1745 Points -1%
Dell Inspiron 16 Plus 7640
Intel Core Ultra 7 155H
1733 Points -1%
Gemiddeld Intel Core Ultra 7 155H
  (1496 - 1815, n=50)
1727 Points -2%
Samsung Galaxy Book3 Pro 16
Intel Core i5-1340P
1719 Points -2%
Lenovo ThinkPad E16 G1 Core i5-1335U
Intel Core i5-1335U
1714 Points -2%
Samsung Galaxy Book4 Pro 360
Intel Core Ultra 5 125H
1710 Points -3%
Lenovo ThinkPad T16 G2 21K70035GE
AMD Ryzen 7 7840U
1708 Points -3%
LG Gram 2in1 16 16T90R - G.AA78G
Intel Core i7-1360P
1705 Points -3%
Lenovo Thinkpad X1 Fold 16
Intel Core i7-1250U
1606 Points -9%
Acer Swift X SFX16-52G-52VE
Intel Core i5-1240P
1600 Points -9%
Lenovo Yoga 7 2-in-1 16IML9
Intel Core Ultra 5 125U
1548 Points -12%
Acer Swift Edge SFE16-42-R1GM
AMD Ryzen 7 7735U
1490 Points -15%
Lenovo IdeaPad Flex 5 16ABR G8
AMD Ryzen 7 7730U
1442 Points -18%
Dell Inspiron 16 7635 2-in-1
AMD Ryzen 5 7530U
1439 Points -18%
Samsung Galaxy Book3 Ultra 16, i9-13900H RTX 4070
Intel Core i9-13900H
1297 Points -26%
Cinebench R20 / CPU (Multi Core)
Lenovo Yoga Pro 9 16IMH9 RTX 4050
Intel Core Ultra 9 185H
7422 Points +20%
Dell Inspiron 16 Plus 7640
Intel Core Ultra 7 155H
6807 Points +10%
Dell Inspiron 16 7640 2-in-1
Intel Core Ultra 7 155H
6185 Points
Gemiddeld Intel Core Ultra 7 155H
  (3798 - 7409, n=48)
5823 Points -6%
Lenovo ThinkPad T16 G2 21K70035GE
AMD Ryzen 7 7840U
5082 Points -18%
HP Envy x360 2-in-1 16-ad0097nr
AMD Ryzen 7 8840HS
4994 Points -19%
Samsung Galaxy Book3 Ultra 16, i9-13900H RTX 4070
Intel Core i9-13900H
4960 Points -20%
HP Spectre x360 2-in-1 16-f1075ng
Intel Core i7-12700H
4693 Points -24%
Samsung Galaxy Book3 Pro 16
Intel Core i5-1340P
4517 Points -27%
LG Gram 2in1 16 16T90R - G.AA78G
Intel Core i7-1360P
4506 Points -27%
Acer Swift X SFX16-52G-52VE
Intel Core i5-1240P
4365 Points -29%
Asus ExpertBook B5 Flip B5602FBN
Intel Core i7-1260P
4027 Points -35%
Acer Swift Edge SFE16-42-R1GM
AMD Ryzen 7 7735U
3895 Points -37%
Samsung Galaxy Book4 Pro 360
Intel Core Ultra 5 125H
3870 Points -37%
Lenovo ThinkPad E16 G1 Core i5-1335U
Intel Core i5-1335U
3849 Points -38%
Lenovo IdeaPad Flex 5 16ABR G8
AMD Ryzen 7 7730U
3798 Points -39%
Lenovo Yoga 7 2-in-1 16IML9
Intel Core Ultra 5 125U
3720 Points -40%
Dell Inspiron 16 7635 2-in-1
AMD Ryzen 5 7530U
3281 Points -47%
Lenovo Thinkpad X1 Fold 16
Intel Core i7-1250U
2745 Points -56%
Cinebench R20 / CPU (Single Core)
Lenovo Yoga Pro 9 16IMH9 RTX 4050
Intel Core Ultra 9 185H
710 Points +6%
HP Spectre x360 2-in-1 16-f1075ng
Intel Core i7-12700H
697 Points +4%
Lenovo ThinkPad T16 G2 21K70035GE
AMD Ryzen 7 7840U
678 Points +2%
Asus ExpertBook B5 Flip B5602FBN
Intel Core i7-1260P
674 Points +1%
Dell Inspiron 16 7640 2-in-1
Intel Core Ultra 7 155H
667 Points
Dell Inspiron 16 Plus 7640
Intel Core Ultra 7 155H
666 Points 0%
Gemiddeld Intel Core Ultra 7 155H
  (601 - 696, n=48)
665 Points 0%
Lenovo ThinkPad E16 G1 Core i5-1335U
Intel Core i5-1335U
663 Points -1%
LG Gram 2in1 16 16T90R - G.AA78G
Intel Core i7-1360P
658 Points -1%
Samsung Galaxy Book4 Pro 360
Intel Core Ultra 5 125H
655 Points -2%
Samsung Galaxy Book3 Pro 16
Intel Core i5-1340P
653 Points -2%
HP Envy x360 2-in-1 16-ad0097nr
AMD Ryzen 7 8840HS
649 Points -3%
Acer Swift X SFX16-52G-52VE
Intel Core i5-1240P
631 Points -5%
Lenovo Thinkpad X1 Fold 16
Intel Core i7-1250U
621 Points -7%
Lenovo Yoga 7 2-in-1 16IML9
Intel Core Ultra 5 125U
605 Points -9%
Dell Inspiron 16 7635 2-in-1
AMD Ryzen 5 7530U
564 Points -15%
Lenovo IdeaPad Flex 5 16ABR G8
AMD Ryzen 7 7730U
552 Points -17%
Acer Swift Edge SFE16-42-R1GM
AMD Ryzen 7 7735U
524 Points -21%
Samsung Galaxy Book3 Ultra 16, i9-13900H RTX 4070
Intel Core i9-13900H
428 Points -36%
Cinebench R15 / CPU Multi 64Bit
Lenovo Yoga Pro 9 16IMH9 RTX 4050
Intel Core Ultra 9 185H
2986 (2750.84min - 2985.74max) Points +11%
Dell Inspiron 16 Plus 7640
Intel Core Ultra 7 155H
2787 (1793.16min - 2787.26max) Points +4%
Dell Inspiron 16 7640 2-in-1
Intel Core Ultra 7 155H
2680 (2205.8min - 2679.71max) Points
Gemiddeld Intel Core Ultra 7 155H
  (1932 - 2880, n=54)
2451 Points -9%
LG Gram 2in1 16 16T90R - G.AA78G
Intel Core i7-1360P
2214 (1472min - 2214.1max) Points -17%
Samsung Galaxy Book3 Ultra 16, i9-13900H RTX 4070
Intel Core i9-13900H
2134 (1993.52min - 2134.02max) Points -20%
Lenovo ThinkPad T16 G2 21K70035GE
AMD Ryzen 7 7840U
2120 (2010.86min - 2119.65max) Points -21%
HP Spectre x360 2-in-1 16-f1075ng
Intel Core i7-12700H
2080 Points -22%
HP Envy x360 2-in-1 16-ad0097nr
AMD Ryzen 7 8840HS
2045 (1885.73min - 2044.68max) Points -24%
Asus ExpertBook B5 Flip B5602FBN
Intel Core i7-1260P
2034 Points -24%
Lenovo IdeaPad Flex 5 16ABR G8
AMD Ryzen 7 7730U
1942 (1610.5min - 1942.41max) Points -28%
Acer Swift X SFX16-52G-52VE
Intel Core i5-1240P
1859 (1391.21min - 1858.82max) Points -31%
Samsung Galaxy Book3 Pro 16
Intel Core i5-1340P
1828 Points -32%
Samsung Galaxy Book4 Pro 360
Intel Core Ultra 5 125H
1700 (1080.79min - 1700.25max) Points -37%
Acer Swift Edge SFE16-42-R1GM
AMD Ryzen 7 7735U
1698 Points -37%
Lenovo Yoga 7 2-in-1 16IML9
Intel Core Ultra 5 125U
1657 (1250.47min - 1657.34max) Points -38%
Lenovo ThinkPad E16 G1 Core i5-1335U
Intel Core i5-1335U
1527 (602.98min - 1527max) Points -43%
Dell Inspiron 16 7635 2-in-1
AMD Ryzen 5 7530U
1415 (1321.57min - 1414.73max) Points -47%
Lenovo Thinkpad X1 Fold 16
Intel Core i7-1250U
1085 (795.91min - 1085.04max) Points -60%
Cinebench R15 / CPU Single 64Bit
Lenovo Yoga Pro 9 16IMH9 RTX 4050
Intel Core Ultra 9 185H
268 Points +5%
Lenovo ThinkPad T16 G2 21K70035GE
AMD Ryzen 7 7840U
267 Points +4%
HP Spectre x360 2-in-1 16-f1075ng
Intel Core i7-12700H
262 Points +2%
HP Envy x360 2-in-1 16-ad0097nr
AMD Ryzen 7 8840HS
261 Points +2%
Dell Inspiron 16 7640 2-in-1
Intel Core Ultra 7 155H
256 Points
Dell Inspiron 16 Plus 7640
Intel Core Ultra 7 155H
255 Points 0%
Gemiddeld Intel Core Ultra 7 155H
  (99.6 - 268, n=50)
250 Points -2%
Samsung Galaxy Book4 Pro 360
Intel Core Ultra 5 125H
246 Points -4%
LG Gram 2in1 16 16T90R - G.AA78G
Intel Core i7-1360P
244 Points -5%
Asus ExpertBook B5 Flip B5602FBN
Intel Core i7-1260P
241 Points -6%
Samsung Galaxy Book3 Pro 16
Intel Core i5-1340P
238 Points -7%
Lenovo ThinkPad E16 G1 Core i5-1335U
Intel Core i5-1335U
236 Points -8%
Acer Swift X SFX16-52G-52VE
Intel Core i5-1240P
235 Points -8%
Acer Swift Edge SFE16-42-R1GM
AMD Ryzen 7 7735U
234 Points -9%
Dell Inspiron 16 7635 2-in-1
AMD Ryzen 5 7530U
231 Points -10%
Lenovo IdeaPad Flex 5 16ABR G8
AMD Ryzen 7 7730U
226 Points -12%
Lenovo Yoga 7 2-in-1 16IML9
Intel Core Ultra 5 125U
226 Points -12%
Lenovo Thinkpad X1 Fold 16
Intel Core i7-1250U
218 Points -15%
Samsung Galaxy Book3 Ultra 16, i9-13900H RTX 4070
Intel Core i9-13900H
211 Points -18%
Blender / v2.79 BMW27 CPU
Lenovo Thinkpad X1 Fold 16
Intel Core i7-1250U
556 Seconds * -166%
Lenovo ThinkPad E16 G1 Core i5-1335U
Intel Core i5-1335U
455 Seconds * -118%
Samsung Galaxy Book4 Pro 360
Intel Core Ultra 5 125H
364 Seconds * -74%
Dell Inspiron 16 7635 2-in-1
AMD Ryzen 5 7530U
362 Seconds * -73%
Lenovo Yoga 7 2-in-1 16IML9
Intel Core Ultra 5 125U
358 Seconds * -71%
LG Gram 2in1 16 16T90R - G.AA78G
Intel Core i7-1360P
324 Seconds * -55%
Acer Swift X SFX16-52G-52VE
Intel Core i5-1240P
311 Seconds * -49%
Acer Swift Edge SFE16-42-R1GM
AMD Ryzen 7 7735U
308 Seconds * -47%
Asus ExpertBook B5 Flip B5602FBN
Intel Core i7-1260P
291 Seconds * -39%
Samsung Galaxy Book3 Pro 16
Intel Core i5-1340P
290 Seconds * -39%
Lenovo IdeaPad Flex 5 16ABR G8
AMD Ryzen 7 7730U
277 Seconds * -33%
HP Spectre x360 2-in-1 16-f1075ng
Intel Core i7-12700H
273 Seconds * -31%
HP Envy x360 2-in-1 16-ad0097nr
AMD Ryzen 7 8840HS
246 Seconds * -18%
Lenovo ThinkPad T16 G2 21K70035GE
AMD Ryzen 7 7840U
245 Seconds * -17%
Samsung Galaxy Book3 Ultra 16, i9-13900H RTX 4070
Intel Core i9-13900H
239 Seconds * -14%
Gemiddeld Intel Core Ultra 7 155H
  (175 - 381, n=46)
231 Seconds * -11%
Dell Inspiron 16 7640 2-in-1
Intel Core Ultra 7 155H
209 Seconds *
Dell Inspiron 16 Plus 7640
Intel Core Ultra 7 155H
191 Seconds * +9%
Lenovo Yoga Pro 9 16IMH9 RTX 4050
Intel Core Ultra 9 185H
168 Seconds * +20%
7-Zip 18.03 / 7z b 4
Lenovo Yoga Pro 9 16IMH9 RTX 4050
Intel Core Ultra 9 185H
75329 MIPS +18%
Dell Inspiron 16 7640 2-in-1
Intel Core Ultra 7 155H
63597 MIPS
Dell Inspiron 16 Plus 7640
Intel Core Ultra 7 155H
61730 MIPS -3%
Gemiddeld Intel Core Ultra 7 155H
  (41739 - 70254, n=48)
59285 MIPS -7%
Lenovo ThinkPad T16 G2 21K70035GE
AMD Ryzen 7 7840U
56666 MIPS -11%
HP Envy x360 2-in-1 16-ad0097nr
AMD Ryzen 7 8840HS
54768 MIPS -14%
Lenovo IdeaPad Flex 5 16ABR G8
AMD Ryzen 7 7730U
49961 MIPS -21%
Samsung Galaxy Book3 Ultra 16, i9-13900H RTX 4070
Intel Core i9-13900H
49917 MIPS -22%
Acer Swift Edge SFE16-42-R1GM
AMD Ryzen 7 7735U
48972 MIPS -23%
HP Spectre x360 2-in-1 16-f1075ng
Intel Core i7-12700H
46548 MIPS -27%
Asus ExpertBook B5 Flip B5602FBN
Intel Core i7-1260P
46214 MIPS -27%
Samsung Galaxy Book3 Pro 16
Intel Core i5-1340P
46027 MIPS -28%
Acer Swift X SFX16-52G-52VE
Intel Core i5-1240P
44778 MIPS -30%
LG Gram 2in1 16 16T90R - G.AA78G
Intel Core i7-1360P
42886 MIPS -33%
Lenovo Yoga 7 2-in-1 16IML9
Intel Core Ultra 5 125U
39065 MIPS -39%
Dell Inspiron 16 7635 2-in-1
AMD Ryzen 5 7530U
38450 MIPS -40%
Lenovo ThinkPad E16 G1 Core i5-1335U
Intel Core i5-1335U
32972 MIPS -48%
Lenovo Thinkpad X1 Fold 16
Intel Core i7-1250U
27072 MIPS -57%
7-Zip 18.03 / 7z b 4 -mmt1
Lenovo ThinkPad T16 G2 21K70035GE
AMD Ryzen 7 7840U
5940 MIPS +11%
HP Envy x360 2-in-1 16-ad0097nr
AMD Ryzen 7 8840HS
5912 MIPS +10%
HP Spectre x360 2-in-1 16-f1075ng
Intel Core i7-12700H
5897 MIPS +10%
Asus ExpertBook B5 Flip B5602FBN
Intel Core i7-1260P
5611 MIPS +4%
Acer Swift Edge SFE16-42-R1GM
AMD Ryzen 7 7735U
5579 MIPS +4%
Lenovo Yoga Pro 9 16IMH9 RTX 4050
Intel Core Ultra 9 185H
5488 MIPS +2%
Dell Inspiron 16 Plus 7640
Intel Core Ultra 7 155H
5461 MIPS +2%
Dell Inspiron 16 7640 2-in-1
Intel Core Ultra 7 155H
5374 MIPS
Gemiddeld Intel Core Ultra 7 155H
  (4795 - 5621, n=48)
5350 MIPS 0%
Lenovo IdeaPad Flex 5 16ABR G8
AMD Ryzen 7 7730U
5333 MIPS -1%
Samsung Galaxy Book3 Pro 16
Intel Core i5-1340P
5294 MIPS -1%
Dell Inspiron 16 7635 2-in-1
AMD Ryzen 5 7530U
5278 MIPS -2%
Lenovo ThinkPad E16 G1 Core i5-1335U
Intel Core i5-1335U
5171 MIPS -4%
Samsung Galaxy Book4 Pro 360
Intel Core Ultra 5 125H
5106 MIPS -5%
Lenovo Thinkpad X1 Fold 16
Intel Core i7-1250U
5041 MIPS -6%
Acer Swift X SFX16-52G-52VE
Intel Core i5-1240P
5002 MIPS -7%
LG Gram 2in1 16 16T90R - G.AA78G
Intel Core i7-1360P
4651 MIPS -13%
Lenovo Yoga 7 2-in-1 16IML9
Intel Core Ultra 5 125U
4492 MIPS -16%
Samsung Galaxy Book3 Ultra 16, i9-13900H RTX 4070
Intel Core i9-13900H
3665 MIPS -32%
Geekbench 6.3 / Multi-Core
Lenovo Yoga Pro 9 16IMH9 RTX 4050
Intel Core Ultra 9 185H
14122 Points +15%
Dell Inspiron 16 Plus 7640
Intel Core Ultra 7 155H
13018 Points +6%
Gemiddeld Intel Core Ultra 7 155H
  (7732 - 13656, n=53)
12293 Points 0%
Dell Inspiron 16 7640 2-in-1
Intel Core Ultra 7 155H
12243 Points
Samsung Galaxy Book4 Pro 360
Intel Core Ultra 5 125H
11571 Points -5%
LG Gram 2in1 16 16T90R - G.AA78G
Intel Core i7-1360P
11511 Points -6%
Lenovo ThinkPad T16 G2 21K70035GE
AMD Ryzen 7 7840U
11363 Points -7%
HP Envy x360 2-in-1 16-ad0097nr
AMD Ryzen 7 8840HS
11081 Points -9%
Lenovo Yoga 7 2-in-1 16IML9
Intel Core Ultra 5 125U
9601 Points -22%
Lenovo Thinkpad X1 Fold 16
Intel Core i7-1250U
7943 Points -35%
Lenovo ThinkPad E16 G1 Core i5-1335U
Intel Core i5-1335U
7691 Points -37%
Geekbench 6.3 / Single-Core
HP Envy x360 2-in-1 16-ad0097nr
AMD Ryzen 7 8840HS
2525 Points +7%
Lenovo ThinkPad T16 G2 21K70035GE
AMD Ryzen 7 7840U
2519 Points +7%
Lenovo Yoga Pro 9 16IMH9 RTX 4050
Intel Core Ultra 9 185H
2506 Points +6%
Dell Inspiron 16 Plus 7640
Intel Core Ultra 7 155H
2401 Points +2%
Gemiddeld Intel Core Ultra 7 155H
  (1901 - 2473, n=50)
2378 Points +1%
Dell Inspiron 16 7640 2-in-1
Intel Core Ultra 7 155H
2356 Points
Samsung Galaxy Book4 Pro 360
Intel Core Ultra 5 125H
2310 Points -2%
LG Gram 2in1 16 16T90R - G.AA78G
Intel Core i7-1360P
2301 Points -2%
Lenovo Thinkpad X1 Fold 16
Intel Core i7-1250U
2298 Points -2%
Lenovo Yoga 7 2-in-1 16IML9
Intel Core Ultra 5 125U
2148 Points -9%
Geekbench 5.5 / Multi-Core
Lenovo Yoga Pro 9 16IMH9 RTX 4050
Intel Core Ultra 9 185H
13749 Points +11%
Dell Inspiron 16 Plus 7640
Intel Core Ultra 7 155H
12600 Points +2%
Dell Inspiron 16 7640 2-in-1
Intel Core Ultra 7 155H
12331 Points
Gemiddeld Intel Core Ultra 7 155H
  (10017 - 13556, n=50)
12039 Points -2%
LG Gram 2in1 16 16T90R - G.AA78G
Intel Core i7-1360P
10450 Points -15%
Samsung Galaxy Book3 Pro 16
Intel Core i5-1340P
10439 Points -15%
Acer Swift X SFX16-52G-52VE
Intel Core i5-1240P
10112 Points -18%
Lenovo ThinkPad T16 G2 21K70035GE
AMD Ryzen 7 7840U
10003 Points -19%
HP Envy x360 2-in-1 16-ad0097nr
AMD Ryzen 7 8840HS
9949 Points -19%
Samsung Galaxy Book4 Pro 360
Intel Core Ultra 5 125H
9696 Points -21%
Asus ExpertBook B5 Flip B5602FBN
Intel Core i7-1260P
9571 Points -22%
Samsung Galaxy Book3 Ultra 16, i9-13900H RTX 4070
Intel Core i9-13900H
9521 Points -23%
HP Spectre x360 2-in-1 16-f1075ng
Intel Core i7-12700H
8946 Points -27%
Lenovo Yoga 7 2-in-1 16IML9
Intel Core Ultra 5 125U
8355 Points -32%
Acer Swift Edge SFE16-42-R1GM
AMD Ryzen 7 7735U
8203 Points -33%
Lenovo IdeaPad Flex 5 16ABR G8
AMD Ryzen 7 7730U
7723 Points -37%
Lenovo ThinkPad E16 G1 Core i5-1335U
Intel Core i5-1335U
7194 Points -42%
Lenovo Thinkpad X1 Fold 16
Intel Core i7-1250U
6753 Points -45%
Dell Inspiron 16 7635 2-in-1
AMD Ryzen 5 7530U
6648 Points -46%
Geekbench 5.5 / Single-Core
HP Envy x360 2-in-1 16-ad0097nr
AMD Ryzen 7 8840HS
1894 Points +8%
Lenovo Yoga Pro 9 16IMH9 RTX 4050
Intel Core Ultra 9 185H
1867 Points +6%
Dell Inspiron 16 Plus 7640
Intel Core Ultra 7 155H
1793 Points +2%
Dell Inspiron 16 7640 2-in-1
Intel Core Ultra 7 155H
1760 Points
HP Spectre x360 2-in-1 16-f1075ng
Intel Core i7-12700H
1754 Points 0%
Lenovo ThinkPad T16 G2 21K70035GE
AMD Ryzen 7 7840U
1753 Points 0%
Gemiddeld Intel Core Ultra 7 155H
  (1462 - 1824, n=50)
1752 Points 0%
Samsung Galaxy Book3 Pro 16
Intel Core i5-1340P
1714 Points -3%
Samsung Galaxy Book4 Pro 360
Intel Core Ultra 5 125H
1699 Points -3%
Lenovo ThinkPad E16 G1 Core i5-1335U
Intel Core i5-1335U
1674 Points -5%
Acer Swift X SFX16-52G-52VE
Intel Core i5-1240P
1658 Points -6%
Lenovo Thinkpad X1 Fold 16
Intel Core i7-1250U
1650 Points -6%
LG Gram 2in1 16 16T90R - G.AA78G
Intel Core i7-1360P
1648 Points -6%
Lenovo Yoga 7 2-in-1 16IML9
Intel Core Ultra 5 125U
1560 Points -11%
Asus ExpertBook B5 Flip B5602FBN
Intel Core i7-1260P
1528 Points -13%
Acer Swift Edge SFE16-42-R1GM
AMD Ryzen 7 7735U
1522 Points -14%
Dell Inspiron 16 7635 2-in-1
AMD Ryzen 5 7530U
1479 Points -16%
Lenovo IdeaPad Flex 5 16ABR G8
AMD Ryzen 7 7730U
1464 Points -17%
Samsung Galaxy Book3 Ultra 16, i9-13900H RTX 4070
Intel Core i9-13900H
1140 Points -35%
HWBOT x265 Benchmark v2.2 / 4k Preset
Lenovo Yoga Pro 9 16IMH9 RTX 4050
Intel Core Ultra 9 185H
22.3 fps +25%
Dell Inspiron 16 Plus 7640
Intel Core Ultra 7 155H
19.5 fps +9%
Dell Inspiron 16 7640 2-in-1
Intel Core Ultra 7 155H
17.9 fps
Gemiddeld Intel Core Ultra 7 155H
  (9.93 - 21.2, n=48)
16.5 fps -8%
Lenovo ThinkPad T16 G2 21K70035GE
AMD Ryzen 7 7840U
16.4 fps -8%
HP Envy x360 2-in-1 16-ad0097nr
AMD Ryzen 7 8840HS
15.7 fps -12%
Samsung Galaxy Book3 Ultra 16, i9-13900H RTX 4070
Intel Core i9-13900H
14.8 fps -17%
HP Spectre x360 2-in-1 16-f1075ng
Intel Core i7-12700H
13.4 fps -25%
Samsung Galaxy Book3 Pro 16
Intel Core i5-1340P
12.8 fps -28%
Asus ExpertBook B5 Flip B5602FBN
Intel Core i7-1260P
12.7 fps -29%
Acer Swift X SFX16-52G-52VE
Intel Core i5-1240P
12.5 fps -30%
Acer Swift Edge SFE16-42-R1GM
AMD Ryzen 7 7735U
12.5 fps -30%
Lenovo IdeaPad Flex 5 16ABR G8
AMD Ryzen 7 7730U
12.4 fps -31%
LG Gram 2in1 16 16T90R - G.AA78G
Intel Core i7-1360P
11.2 fps -37%
Lenovo Yoga 7 2-in-1 16IML9
Intel Core Ultra 5 125U
11.1 fps -38%
Dell Inspiron 16 7635 2-in-1
AMD Ryzen 5 7530U
10.7 fps -40%
Samsung Galaxy Book4 Pro 360
Intel Core Ultra 5 125H
10.6 fps -41%
Lenovo ThinkPad E16 G1 Core i5-1335U
Intel Core i5-1335U
9.79 fps -45%
Lenovo Thinkpad X1 Fold 16
Intel Core i7-1250U
7.84 fps -56%
LibreOffice / 20 Documents To PDF
Samsung Galaxy Book3 Ultra 16, i9-13900H RTX 4070
Intel Core i9-13900H
74.9 s * -64%
Acer Swift Edge SFE16-42-R1GM
AMD Ryzen 7 7735U
59.7 s * -31%
LG Gram 2in1 16 16T90R - G.AA78G
Intel Core i7-1360P
57.2 s * -25%
Lenovo Thinkpad X1 Fold 16
Intel Core i7-1250U
53.8 s * -18%
HP Envy x360 2-in-1 16-ad0097nr
AMD Ryzen 7 8840HS
51.7 s * -13%
Lenovo IdeaPad Flex 5 16ABR G8
AMD Ryzen 7 7730U
51.3 s * -13%
Lenovo ThinkPad E16 G1 Core i5-1335U
Intel Core i5-1335U
50.5 s * -11%
Asus ExpertBook B5 Flip B5602FBN
Intel Core i7-1260P
49.8 s * -9%
Dell Inspiron 16 7635 2-in-1
AMD Ryzen 5 7530U
49.3 s * -8%
Gemiddeld Intel Core Ultra 7 155H
  (37.5 - 79.2, n=47)
48.7 s * -7%
Acer Swift X SFX16-52G-52VE
Intel Core i5-1240P
47.2 s * -4%
Lenovo Yoga 7 2-in-1 16IML9
Intel Core Ultra 5 125U
47 s * -3%
Dell Inspiron 16 7640 2-in-1
Intel Core Ultra 7 155H
45.6 s *
Lenovo ThinkPad T16 G2 21K70035GE
AMD Ryzen 7 7840U
44.5 s * +2%
Dell Inspiron 16 Plus 7640
Intel Core Ultra 7 155H
43.5 s * +5%
Samsung Galaxy Book4 Pro 360
Intel Core Ultra 5 125H
42.7 s * +6%
HP Spectre x360 2-in-1 16-f1075ng
Intel Core i7-12700H
42 s * +8%
Samsung Galaxy Book3 Pro 16
Intel Core i5-1340P
42 s * +8%
Lenovo Yoga Pro 9 16IMH9 RTX 4050
Intel Core Ultra 9 185H
38.8 s * +15%
R Benchmark 2.5 / Overall mean
Samsung Galaxy Book3 Ultra 16, i9-13900H RTX 4070
Intel Core i9-13900H
0.723 sec * -49%
LG Gram 2in1 16 16T90R - G.AA78G
Intel Core i7-1360P
0.583 sec * -21%
Lenovo IdeaPad Flex 5 16ABR G8
AMD Ryzen 7 7730U
0.534 sec * -10%
Acer Swift X SFX16-52G-52VE
Intel Core i5-1240P
0.533 sec * -10%
Lenovo Yoga 7 2-in-1 16IML9
Intel Core Ultra 5 125U
0.533 sec * -10%
Dell Inspiron 16 7635 2-in-1
AMD Ryzen 5 7530U
0.528 sec * -9%
Acer Swift Edge SFE16-42-R1GM
AMD Ryzen 7 7735U
0.51 sec * -5%
Lenovo Thinkpad X1 Fold 16
Intel Core i7-1250U
0.508 sec * -5%
Samsung Galaxy Book4 Pro 360
Intel Core Ultra 5 125H
0.503 sec * -4%
Samsung Galaxy Book3 Pro 16
Intel Core i5-1340P
0.502 sec * -4%
Asus ExpertBook B5 Flip B5602FBN
Intel Core i7-1260P
0.4839 sec * -0%
Dell Inspiron 16 7640 2-in-1
Intel Core Ultra 7 155H
0.4837 sec *
Gemiddeld Intel Core Ultra 7 155H
  (0.4457 - 0.53, n=47)
0.4814 sec * -0%
Lenovo ThinkPad T16 G2 21K70035GE
AMD Ryzen 7 7840U
0.4753 sec * +2%
Dell Inspiron 16 Plus 7640
Intel Core Ultra 7 155H
0.4709 sec * +3%
HP Envy x360 2-in-1 16-ad0097nr
AMD Ryzen 7 8840HS
0.4638 sec * +4%
HP Spectre x360 2-in-1 16-f1075ng
Intel Core i7-12700H
0.4632 sec * +4%
Lenovo Yoga Pro 9 16IMH9 RTX 4050
Intel Core Ultra 9 185H
0.4555 sec * +6%
CPU Performance Rating: Percent
Cinebench R23: Multi Core | Single Core
Cinebench R20: CPU (Multi Core) | CPU (Single Core)
Cinebench R15: CPU Multi 64Bit | CPU Single 64Bit
Blender: v2.79 BMW27 CPU
7-Zip 18.03: 7z b 4 | 7z b 4 -mmt1
Geekbench 6.3: Multi-Core | Single-Core
Geekbench 5.5: Multi-Core | Single-Core
HWBOT x265 Benchmark v2.2: 4k Preset
LibreOffice : 20 Documents To PDF
R Benchmark 2.5: Overall mean

* ... kleiner is beter

Cinebench R15 CPU Multi 64Bit
2680 Points
Cinebench R15 OpenGL 64Bit
152.6 fps
Cinebench R15 Ref. Match 64Bit
97.8 %
Cinebench R15 CPU Single 64Bit
256 Points
Cinebench R20 CPU (Multi Core)
6185 Points
Cinebench R20 CPU (Single Core)
667 Points
Cinebench R23 Single Core
1756 Points
Cinebench R23 Multi Core
15802 Points
Cinebench 2024 CPU Multi Core
866 Points
Help
Performance Rating
Lenovo IdeaPad Pro 5 16IMH G9
Intel Core Ultra 7 155H, Arc 8-Core
92.9 pt
HP Envy x360 2-in-1 16-ad0097nr
AMD Ryzen 7 8840HS, Radeon 780M
91.1 pt
Dell Inspiron 16 7640 2-in-1
Intel Core Ultra 7 155H, Arc 8-Core
81.8 pt
Dell Inspiron 16 Plus 7640
Intel Core Ultra 7 155H, NVIDIA GeForce RTX 4060 Laptop GPU
78.5 pt
Gemiddeld Intel Core Ultra 7 155H
 
78.2 pt
Dell Inspiron 16 7635 2-in-1
AMD Ryzen 5 7530U, Vega 7
56.1 pt
Samsung Galaxy Book4 Pro 360
Intel Core Ultra 5 125H, Arc 7-Core
55 pt
AIDA64 / FP32 Ray-Trace
HP Envy x360 2-in-1 16-ad0097nr
AMD Ryzen 7 8840HS, Radeon 780M
20007 KRay/s +40%
Lenovo IdeaPad Pro 5 16IMH G9
Intel Core Ultra 7 155H, Arc 8-Core
17004 KRay/s +19%
Dell Inspiron 16 7640 2-in-1
Intel Core Ultra 7 155H, Arc 8-Core
14281 KRay/s
Dell Inspiron 16 Plus 7640
Intel Core Ultra 7 155H, NVIDIA GeForce RTX 4060 Laptop GPU
14038 KRay/s -2%
Gemiddeld Intel Core Ultra 7 155H
  (6670 - 18470, n=48)
13201 KRay/s -8%
Dell Inspiron 16 7635 2-in-1
AMD Ryzen 5 7530U, Vega 7
9804 KRay/s -31%
Samsung Galaxy Book4 Pro 360
Intel Core Ultra 5 125H, Arc 7-Core
8546 KRay/s -40%
AIDA64 / FPU Julia
Lenovo IdeaPad Pro 5 16IMH G9
Intel Core Ultra 7 155H, Arc 8-Core
87764 Points +16%
HP Envy x360 2-in-1 16-ad0097nr
AMD Ryzen 7 8840HS, Radeon 780M
84591 Points +12%
Dell Inspiron 16 7640 2-in-1
Intel Core Ultra 7 155H, Arc 8-Core
75538 Points
Dell Inspiron 16 Plus 7640
Intel Core Ultra 7 155H, NVIDIA GeForce RTX 4060 Laptop GPU
70839 Points -6%
Gemiddeld Intel Core Ultra 7 155H
  (40905 - 93181, n=48)
70073 Points -7%
Dell Inspiron 16 7635 2-in-1
AMD Ryzen 5 7530U, Vega 7
62595 Points -17%
Samsung Galaxy Book4 Pro 360
Intel Core Ultra 5 125H, Arc 7-Core
43652 Points -42%
AIDA64 / CPU SHA3
Lenovo IdeaPad Pro 5 16IMH G9
Intel Core Ultra 7 155H, Arc 8-Core
3969 MB/s +14%
HP Envy x360 2-in-1 16-ad0097nr
AMD Ryzen 7 8840HS, Radeon 780M
3847 MB/s +11%
Dell Inspiron 16 7640 2-in-1
Intel Core Ultra 7 155H, Arc 8-Core
3480 MB/s
Dell Inspiron 16 Plus 7640
Intel Core Ultra 7 155H, NVIDIA GeForce RTX 4060 Laptop GPU
3277 MB/s -6%
Gemiddeld Intel Core Ultra 7 155H
  (1940 - 4436, n=48)
3269 MB/s -6%
Samsung Galaxy Book4 Pro 360
Intel Core Ultra 5 125H, Arc 7-Core
2070 MB/s -41%
Dell Inspiron 16 7635 2-in-1
AMD Ryzen 5 7530U, Vega 7
2068 MB/s -41%
AIDA64 / CPU Queen
HP Envy x360 2-in-1 16-ad0097nr
AMD Ryzen 7 8840HS, Radeon 780M
107640 Points +20%
Dell Inspiron 16 7640 2-in-1
Intel Core Ultra 7 155H, Arc 8-Core
89661 Points
Dell Inspiron 16 Plus 7640
Intel Core Ultra 7 155H, NVIDIA GeForce RTX 4060 Laptop GPU
87819 Points -2%
Lenovo IdeaPad Pro 5 16IMH G9
Intel Core Ultra 7 155H, Arc 8-Core
85567 Points -5%
Gemiddeld Intel Core Ultra 7 155H
  (64698 - 94181, n=48)
83471 Points -7%
Samsung Galaxy Book4 Pro 360
Intel Core Ultra 5 125H, Arc 7-Core
77892 Points -13%
Dell Inspiron 16 7635 2-in-1
AMD Ryzen 5 7530U, Vega 7
73066 Points -19%
AIDA64 / FPU SinJulia
HP Envy x360 2-in-1 16-ad0097nr
AMD Ryzen 7 8840HS, Radeon 780M
12929 Points +28%
Lenovo IdeaPad Pro 5 16IMH G9
Intel Core Ultra 7 155H, Arc 8-Core
10647 Points +6%
Dell Inspiron 16 7640 2-in-1
Intel Core Ultra 7 155H, Arc 8-Core
10066 Points
Dell Inspiron 16 Plus 7640
Intel Core Ultra 7 155H, NVIDIA GeForce RTX 4060 Laptop GPU
9893 Points -2%
Gemiddeld Intel Core Ultra 7 155H
  (5639 - 10647, n=48)
9159 Points -9%
Dell Inspiron 16 7635 2-in-1
AMD Ryzen 5 7530U, Vega 7
8803 Points -13%
Samsung Galaxy Book4 Pro 360
Intel Core Ultra 5 125H, Arc 7-Core
6855 Points -32%
AIDA64 / FPU Mandel
HP Envy x360 2-in-1 16-ad0097nr
AMD Ryzen 7 8840HS, Radeon 780M
44969 Points +22%
Lenovo IdeaPad Pro 5 16IMH G9
Intel Core Ultra 7 155H, Arc 8-Core
43855 Points +19%
Dell Inspiron 16 7640 2-in-1
Intel Core Ultra 7 155H, Arc 8-Core
36925 Points
Dell Inspiron 16 Plus 7640
Intel Core Ultra 7 155H, NVIDIA GeForce RTX 4060 Laptop GPU
35006 Points -5%
Dell Inspiron 16 7635 2-in-1
AMD Ryzen 5 7530U, Vega 7
34487 Points -7%
Gemiddeld Intel Core Ultra 7 155H
  (18236 - 47685, n=48)
34082 Points -8%
Samsung Galaxy Book4 Pro 360
Intel Core Ultra 5 125H, Arc 7-Core
21250 Points -42%
AIDA64 / CPU AES
Lenovo IdeaPad Pro 5 16IMH G9
Intel Core Ultra 7 155H, Arc 8-Core
83176 MB/s +12%
Gemiddeld Intel Core Ultra 7 155H
  (45713 - 152179, n=48)
78005 MB/s +5%
Dell Inspiron 16 7640 2-in-1
Intel Core Ultra 7 155H, Arc 8-Core
74058 MB/s
HP Envy x360 2-in-1 16-ad0097nr
AMD Ryzen 7 8840HS, Radeon 780M
70892 MB/s -4%
Dell Inspiron 16 Plus 7640
Intel Core Ultra 7 155H, NVIDIA GeForce RTX 4060 Laptop GPU
68050 MB/s -8%
Samsung Galaxy Book4 Pro 360
Intel Core Ultra 5 125H, Arc 7-Core
45524 MB/s -39%
Dell Inspiron 16 7635 2-in-1
AMD Ryzen 5 7530U, Vega 7
35283 MB/s -52%
AIDA64 / CPU ZLib
Lenovo IdeaPad Pro 5 16IMH G9
Intel Core Ultra 7 155H, Arc 8-Core
1160 MB/s +14%
Dell Inspiron 16 Plus 7640
Intel Core Ultra 7 155H, NVIDIA GeForce RTX 4060 Laptop GPU
1045 MB/s +3%
Dell Inspiron 16 7640 2-in-1
Intel Core Ultra 7 155H, Arc 8-Core
1018 MB/s
Gemiddeld Intel Core Ultra 7 155H
  (557 - 1250, n=48)
967 MB/s -5%
HP Envy x360 2-in-1 16-ad0097nr
AMD Ryzen 7 8840HS, Radeon 780M
857 MB/s -16%
Samsung Galaxy Book4 Pro 360
Intel Core Ultra 5 125H, Arc 7-Core
594 MB/s -42%
Dell Inspiron 16 7635 2-in-1
AMD Ryzen 5 7530U, Vega 7
554 MB/s -46%
AIDA64 / FP64 Ray-Trace
HP Envy x360 2-in-1 16-ad0097nr
AMD Ryzen 7 8840HS, Radeon 780M
10571 KRay/s +38%
Lenovo IdeaPad Pro 5 16IMH G9
Intel Core Ultra 7 155H, Arc 8-Core
8903 KRay/s +17%
Dell Inspiron 16 7640 2-in-1
Intel Core Ultra 7 155H, Arc 8-Core
7640 KRay/s
Dell Inspiron 16 Plus 7640
Intel Core Ultra 7 155H, NVIDIA GeForce RTX 4060 Laptop GPU
7347 KRay/s -4%
Gemiddeld Intel Core Ultra 7 155H
  (3569 - 9802, n=48)
6914 KRay/s -10%
Dell Inspiron 16 7635 2-in-1
AMD Ryzen 5 7530U, Vega 7
5246 KRay/s -31%
Samsung Galaxy Book4 Pro 360
Intel Core Ultra 5 125H, Arc 7-Core
4345 KRay/s -43%
AIDA64 / CPU PhotoWorxx
Lenovo IdeaPad Pro 5 16IMH G9
Intel Core Ultra 7 155H, Arc 8-Core
53611 MPixel/s +24%
Gemiddeld Intel Core Ultra 7 155H
  (32719 - 54223, n=48)
46830 MPixel/s +8%
Samsung Galaxy Book4 Pro 360
Intel Core Ultra 5 125H, Arc 7-Core
45724 MPixel/s +6%
Dell Inspiron 16 7640 2-in-1
Intel Core Ultra 7 155H, Arc 8-Core
43340 MPixel/s
Dell Inspiron 16 Plus 7640
Intel Core Ultra 7 155H, NVIDIA GeForce RTX 4060 Laptop GPU
39530 MPixel/s -9%
HP Envy x360 2-in-1 16-ad0097nr
AMD Ryzen 7 8840HS, Radeon 780M
31491 MPixel/s -27%
Dell Inspiron 16 7635 2-in-1
AMD Ryzen 5 7530U, Vega 7
19525 MPixel/s -55%

Stresstest

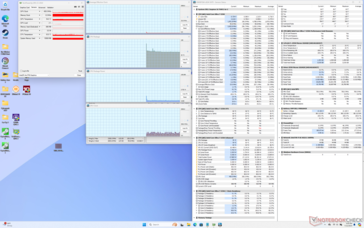
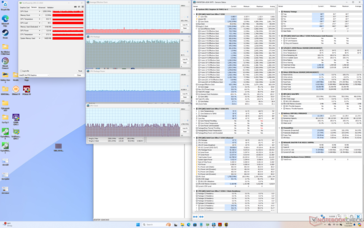
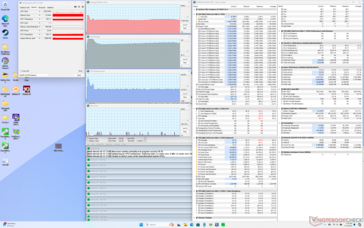
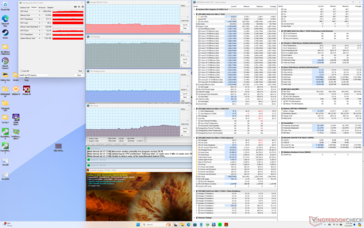
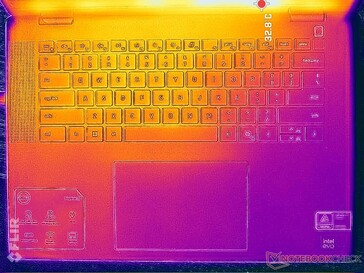
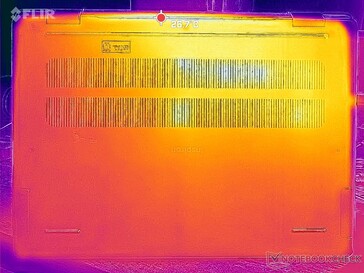
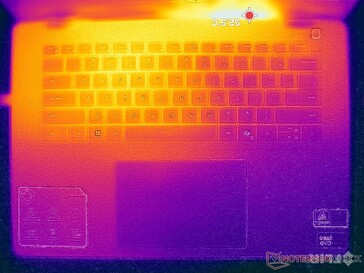
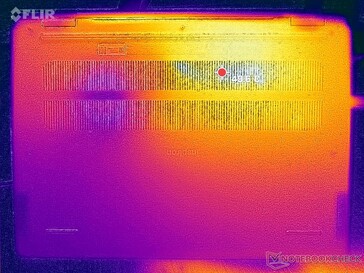
De CPU ging omhoog naar 3,2 GHz en 88 W gedurende slechts enkele seconden voordat een zeer hoge kerntemperatuur van 109 C (!) werd bereikt. Daarna daalde hij snel naar slechts 2,3 GHz en 44 W om een koelere kerntemperatuur van 86 C te handhaven. De temperatuurbereiken zijn desondanks warmer dan wat we op de Inspiron 16 7635 2-in-1 registreerden, vooral tijdens het spelen van games, waarbij onze CPU zich in het hoge bereik van 90 C stabiliseerde, vergeleken met het bereik van 70 C op de oudere Inspiron 16 7635 2-in-1. Dit verschil draagt ook bij aan de algehele warmere oppervlaktetemperaturen, zoals weergegeven in het gedeelte Temperatuur van de Inspiron 16 7635 2-in-1. Dit verschil zou ook bijdragen aan de algehele warmere oppervlaktetemperaturen zoals weergegeven in onze sectie Temperatuur hieronder.

Systeem inactief
Systeem inactief
Cyberpunk 2077 stress
Prime95 stress
Prime95 stress
Prime95+FurMark stress
Gemiddelde CPU-klok (GHz) GPU-klok (MHz) Gemiddelde CPU-temperatuur (°C)
Inactief systeem -- -- 55
Prime95 Stress 2.3 -- 86
Prime95 + FurMark Stress 1.4 1250 - 1850 87
Cyberpunk 2077 Stress 0.6 1650 - 2250 90 - 98

Systeemprestaties

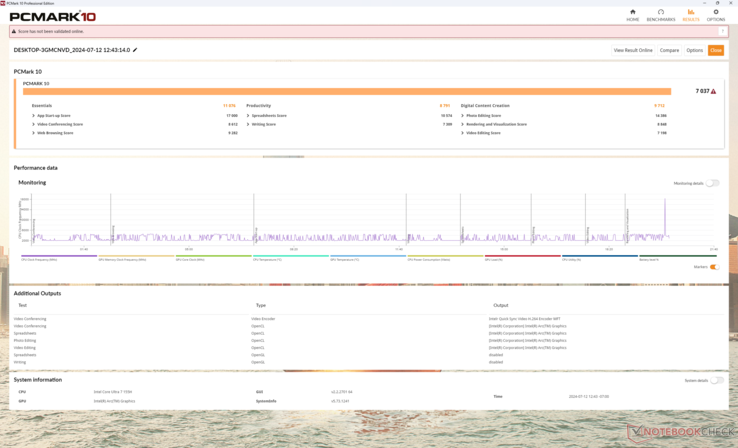
De resultaten van PCMark zijn uitstekend en vergelijkbaar met andere machines in onze database met dezelfde CPU en geïntegreerde GPU. Onze gemiddelde score voor de Dell is een van de hoogste van alle 16-inch convertibles, maar alternatieven met discrete GPU's zoals de HP Spectre x360 16 zullen nog steeds snellere grafische prestaties bieden.

PCMark 10 Standaard
PCMark 10 Standaard
PCMark 10 / Score
Lenovo IdeaPad Pro 5 16IMH G9
Arc 8-Core, Ultra 7 155H, Samsung PM9C1a MZAL81T0HDLB
7186 Points +2%
Dell Inspiron 16 Plus 7640
NVIDIA GeForce RTX 4060 Laptop GPU, Ultra 7 155H, SK hynix BC901 HFS001TEJ4X164N
7042 Points 0%
Dell Inspiron 16 7640 2-in-1
Arc 8-Core, Ultra 7 155H, Micron 2550 1TB
7037 Points
HP Envy x360 2-in-1 16-ad0097nr
Radeon 780M, R7 8840HS, KIOXIA BG5 KBG50ZNV1T02
6958 Points -1%
Gemiddeld Intel Core Ultra 7 155H, Intel Arc 8-Core iGPU
  (5159 - 7529, n=33)
6729 Points -4%
Samsung Galaxy Book4 Pro 360
Arc 7-Core, Ultra 5 125H, Samsung PM9B1 512GB MZVL4512HBLU
6330 Points -10%
Dell Inspiron 16 7635 2-in-1
Vega 7, R5 7530U, Kioxia BG5 KBG50ZNS512G
6127 Points -13%
PCMark 10 / Essentials
Lenovo IdeaPad Pro 5 16IMH G9
Arc 8-Core, Ultra 7 155H, Samsung PM9C1a MZAL81T0HDLB
11289 Points +2%
Dell Inspiron 16 7640 2-in-1
Arc 8-Core, Ultra 7 155H, Micron 2550 1TB
11076 Points
Dell Inspiron 16 7635 2-in-1
Vega 7, R5 7530U, Kioxia BG5 KBG50ZNS512G
10603 Points -4%
Samsung Galaxy Book4 Pro 360
Arc 7-Core, Ultra 5 125H, Samsung PM9B1 512GB MZVL4512HBLU
10584 Points -4%
Gemiddeld Intel Core Ultra 7 155H, Intel Arc 8-Core iGPU
  (8580 - 11289, n=33)
10555 Points -5%
HP Envy x360 2-in-1 16-ad0097nr
Radeon 780M, R7 8840HS, KIOXIA BG5 KBG50ZNV1T02
10503 Points -5%
Dell Inspiron 16 Plus 7640
NVIDIA GeForce RTX 4060 Laptop GPU, Ultra 7 155H, SK hynix BC901 HFS001TEJ4X164N
10279 Points -7%
PCMark 10 / Productivity
HP Envy x360 2-in-1 16-ad0097nr
Radeon 780M, R7 8840HS, KIOXIA BG5 KBG50ZNV1T02
9933 Points +13%
Dell Inspiron 16 7635 2-in-1
Vega 7, R5 7530U, Kioxia BG5 KBG50ZNS512G
9772 Points +11%
Lenovo IdeaPad Pro 5 16IMH G9
Arc 8-Core, Ultra 7 155H, Samsung PM9C1a MZAL81T0HDLB
8927 Points +2%
Dell Inspiron 16 7640 2-in-1
Arc 8-Core, Ultra 7 155H, Micron 2550 1TB
8791 Points
Gemiddeld Intel Core Ultra 7 155H, Intel Arc 8-Core iGPU
  (7822 - 10591, n=33)
8742 Points -1%
Dell Inspiron 16 Plus 7640
NVIDIA GeForce RTX 4060 Laptop GPU, Ultra 7 155H, SK hynix BC901 HFS001TEJ4X164N
8079 Points -8%
Samsung Galaxy Book4 Pro 360
Arc 7-Core, Ultra 5 125H, Samsung PM9B1 512GB MZVL4512HBLU
7933 Points -10%
PCMark 10 / Digital Content Creation
Dell Inspiron 16 Plus 7640
NVIDIA GeForce RTX 4060 Laptop GPU, Ultra 7 155H, SK hynix BC901 HFS001TEJ4X164N
11413 Points +18%
Lenovo IdeaPad Pro 5 16IMH G9
Arc 8-Core, Ultra 7 155H, Samsung PM9C1a MZAL81T0HDLB
9993 Points +3%
Dell Inspiron 16 7640 2-in-1
Arc 8-Core, Ultra 7 155H, Micron 2550 1TB
9712 Points
Gemiddeld Intel Core Ultra 7 155H, Intel Arc 8-Core iGPU
  (4985 - 10709, n=33)
9009 Points -7%
HP Envy x360 2-in-1 16-ad0097nr
Radeon 780M, R7 8840HS, KIOXIA BG5 KBG50ZNV1T02
8763 Points -10%
Samsung Galaxy Book4 Pro 360
Arc 7-Core, Ultra 5 125H, Samsung PM9B1 512GB MZVL4512HBLU
8198 Points -16%
Dell Inspiron 16 7635 2-in-1
Vega 7, R5 7530U, Kioxia BG5 KBG50ZNS512G
6024 Points -38%
CrossMark / Overall
Dell Inspiron 16 7640 2-in-1
Arc 8-Core, Ultra 7 155H, Micron 2550 1TB
1707 Points
Dell Inspiron 16 Plus 7640
NVIDIA GeForce RTX 4060 Laptop GPU, Ultra 7 155H, SK hynix BC901 HFS001TEJ4X164N
1685 Points -1%
Gemiddeld Intel Core Ultra 7 155H, Intel Arc 8-Core iGPU
  (1366 - 1903, n=33)
1657 Points -3%
HP Envy x360 2-in-1 16-ad0097nr
Radeon 780M, R7 8840HS, KIOXIA BG5 KBG50ZNV1T02
1643 Points -4%
Samsung Galaxy Book4 Pro 360
Arc 7-Core, Ultra 5 125H, Samsung PM9B1 512GB MZVL4512HBLU
1633 Points -4%
Lenovo IdeaPad Pro 5 16IMH G9
Arc 8-Core, Ultra 7 155H, Samsung PM9C1a MZAL81T0HDLB
1546 Points -9%
Dell Inspiron 16 7635 2-in-1
Vega 7, R5 7530U, Kioxia BG5 KBG50ZNS512G
1223 Points -28%
CrossMark / Productivity
Dell Inspiron 16 7640 2-in-1
Arc 8-Core, Ultra 7 155H, Micron 2550 1TB
1628 Points
HP Envy x360 2-in-1 16-ad0097nr
Radeon 780M, R7 8840HS, KIOXIA BG5 KBG50ZNV1T02
1611 Points -1%
Dell Inspiron 16 Plus 7640
NVIDIA GeForce RTX 4060 Laptop GPU, Ultra 7 155H, SK hynix BC901 HFS001TEJ4X164N
1592 Points -2%
Gemiddeld Intel Core Ultra 7 155H, Intel Arc 8-Core iGPU
  (1291 - 1798, n=32)
1582 Points -3%
Samsung Galaxy Book4 Pro 360
Arc 7-Core, Ultra 5 125H, Samsung PM9B1 512GB MZVL4512HBLU
1577 Points -3%
Lenovo IdeaPad Pro 5 16IMH G9
Arc 8-Core, Ultra 7 155H, Samsung PM9C1a MZAL81T0HDLB
1447 Points -11%
Dell Inspiron 16 7635 2-in-1
Vega 7, R5 7530U, Kioxia BG5 KBG50ZNS512G
1254 Points -23%
CrossMark / Creativity
Dell Inspiron 16 Plus 7640
NVIDIA GeForce RTX 4060 Laptop GPU, Ultra 7 155H, SK hynix BC901 HFS001TEJ4X164N
1929 Points +1%
Dell Inspiron 16 7640 2-in-1
Arc 8-Core, Ultra 7 155H, Micron 2550 1TB
1913 Points
Lenovo IdeaPad Pro 5 16IMH G9
Arc 8-Core, Ultra 7 155H, Samsung PM9C1a MZAL81T0HDLB
1848 Points -3%
Gemiddeld Intel Core Ultra 7 155H, Intel Arc 8-Core iGPU
  (1519 - 1929, n=32)
1820 Points -5%
HP Envy x360 2-in-1 16-ad0097nr
Radeon 780M, R7 8840HS, KIOXIA BG5 KBG50ZNV1T02
1790 Points -6%
Samsung Galaxy Book4 Pro 360
Arc 7-Core, Ultra 5 125H, Samsung PM9B1 512GB MZVL4512HBLU
1758 Points -8%
Dell Inspiron 16 7635 2-in-1
Vega 7, R5 7530U, Kioxia BG5 KBG50ZNS512G
1315 Points -31%
CrossMark / Responsiveness
Samsung Galaxy Book4 Pro 360
Arc 7-Core, Ultra 5 125H, Samsung PM9B1 512GB MZVL4512HBLU
1456 Points +4%
Gemiddeld Intel Core Ultra 7 155H, Intel Arc 8-Core iGPU
  (939 - 1802, n=32)
1401 Points 0%
Dell Inspiron 16 7640 2-in-1
Arc 8-Core, Ultra 7 155H, Micron 2550 1TB
1397 Points
HP Envy x360 2-in-1 16-ad0097nr
Radeon 780M, R7 8840HS, KIOXIA BG5 KBG50ZNV1T02
1347 Points -4%
Dell Inspiron 16 Plus 7640
NVIDIA GeForce RTX 4060 Laptop GPU, Ultra 7 155H, SK hynix BC901 HFS001TEJ4X164N
1333 Points -5%
Lenovo IdeaPad Pro 5 16IMH G9
Arc 8-Core, Ultra 7 155H, Samsung PM9C1a MZAL81T0HDLB
1106 Points -21%
Dell Inspiron 16 7635 2-in-1
Vega 7, R5 7530U, Kioxia BG5 KBG50ZNS512G
912 Points -35%
WebXPRT 3 / Overall
HP Envy x360 2-in-1 16-ad0097nr
Radeon 780M, R7 8840HS, KIOXIA BG5 KBG50ZNV1T02
297 Points +4%
Dell Inspiron 16 Plus 7640
NVIDIA GeForce RTX 4060 Laptop GPU, Ultra 7 155H, SK hynix BC901 HFS001TEJ4X164N
290 Points +2%
Lenovo IdeaPad Pro 5 16IMH G9
Arc 8-Core, Ultra 7 155H, Samsung PM9C1a MZAL81T0HDLB
285 Points 0%
Dell Inspiron 16 7640 2-in-1
Arc 8-Core, Ultra 7 155H, Micron 2550 1TB
285 Points
Gemiddeld Intel Core Ultra 7 155H, Intel Arc 8-Core iGPU
  (252 - 299, n=33)
276 Points -3%
Dell Inspiron 16 7635 2-in-1
Vega 7, R5 7530U, Kioxia BG5 KBG50ZNS512G
272 Points -5%
Samsung Galaxy Book4 Pro 360
Arc 7-Core, Ultra 5 125H, Samsung PM9B1 512GB MZVL4512HBLU
263 Points -8%
WebXPRT 4 / Overall
Lenovo IdeaPad Pro 5 16IMH G9
Arc 8-Core, Ultra 7 155H, Samsung PM9C1a MZAL81T0HDLB
259 Points 0%
Dell Inspiron 16 7640 2-in-1
Arc 8-Core, Ultra 7 155H, Micron 2550 1TB
258 Points
Dell Inspiron 16 Plus 7640
NVIDIA GeForce RTX 4060 Laptop GPU, Ultra 7 155H, SK hynix BC901 HFS001TEJ4X164N
257 Points 0%
Gemiddeld Intel Core Ultra 7 155H, Intel Arc 8-Core iGPU
  (234 - 309, n=28)
254 Points -2%
HP Envy x360 2-in-1 16-ad0097nr
Radeon 780M, R7 8840HS, KIOXIA BG5 KBG50ZNV1T02
246 Points -5%
Samsung Galaxy Book4 Pro 360
Arc 7-Core, Ultra 5 125H, Samsung PM9B1 512GB MZVL4512HBLU
237 Points -8%
Dell Inspiron 16 7635 2-in-1
Vega 7, R5 7530U, Kioxia BG5 KBG50ZNS512G
209 Points -19%
Mozilla Kraken 1.1 / Total
Dell Inspiron 16 7635 2-in-1
Vega 7, R5 7530U, Kioxia BG5 KBG50ZNS512G
627 ms * -19%
Samsung Galaxy Book4 Pro 360
Arc 7-Core, Ultra 5 125H, Samsung PM9B1 512GB MZVL4512HBLU
575 ms * -9%
Gemiddeld Intel Core Ultra 7 155H, Intel Arc 8-Core iGPU
  (517 - 614, n=34)
541 ms * -2%
HP Envy x360 2-in-1 16-ad0097nr
Radeon 780M, R7 8840HS, KIOXIA BG5 KBG50ZNV1T02
538 ms * -2%
Dell Inspiron 16 7640 2-in-1
Arc 8-Core, Ultra 7 155H, Micron 2550 1TB
529 ms *
Dell Inspiron 16 Plus 7640
NVIDIA GeForce RTX 4060 Laptop GPU, Ultra 7 155H, SK hynix BC901 HFS001TEJ4X164N
519 ms * +2%
Lenovo IdeaPad Pro 5 16IMH G9
Arc 8-Core, Ultra 7 155H, Samsung PM9C1a MZAL81T0HDLB
517 ms * +2%

* ... kleiner is beter

PCMark 10 Score
7037 punten
Help
AIDA64 / Memory Copy
Lenovo IdeaPad Pro 5 16IMH G9
Intel Core Ultra 7 155H, Arc 8-Core
94158 MB/s +19%
Samsung Galaxy Book4 Pro 360
Intel Core Ultra 5 125H, Arc 7-Core
86739 MB/s +10%
Gemiddeld Intel Core Ultra 7 155H
  (62397 - 96791, n=48)
83297 MB/s +5%
Dell Inspiron 16 7640 2-in-1
Intel Core Ultra 7 155H, Arc 8-Core
78983 MB/s
HP Envy x360 2-in-1 16-ad0097nr
AMD Ryzen 7 8840HS, Radeon 780M
68720 MB/s -13%
Dell Inspiron 16 Plus 7640
Intel Core Ultra 7 155H, NVIDIA GeForce RTX 4060 Laptop GPU
63520 MB/s -20%
Dell Inspiron 16 7635 2-in-1
AMD Ryzen 5 7530U, Vega 7
42853 MB/s -46%
AIDA64 / Memory Read
Lenovo IdeaPad Pro 5 16IMH G9
Intel Core Ultra 7 155H, Arc 8-Core
87063 MB/s +18%
Gemiddeld Intel Core Ultra 7 155H
  (60544 - 90647, n=48)
80179 MB/s +9%
Dell Inspiron 16 Plus 7640
Intel Core Ultra 7 155H, NVIDIA GeForce RTX 4060 Laptop GPU
77153 MB/s +5%
Samsung Galaxy Book4 Pro 360
Intel Core Ultra 5 125H, Arc 7-Core
75519 MB/s +3%
Dell Inspiron 16 7640 2-in-1
Intel Core Ultra 7 155H, Arc 8-Core
73509 MB/s
HP Envy x360 2-in-1 16-ad0097nr
AMD Ryzen 7 8840HS, Radeon 780M
50273 MB/s -32%
Dell Inspiron 16 7635 2-in-1
AMD Ryzen 5 7530U, Vega 7
39517 MB/s -46%
AIDA64 / Memory Write
HP Envy x360 2-in-1 16-ad0097nr
AMD Ryzen 7 8840HS, Radeon 780M
91050 MB/s +20%
Dell Inspiron 16 7640 2-in-1
Intel Core Ultra 7 155H, Arc 8-Core
76048 MB/s
Lenovo IdeaPad Pro 5 16IMH G9
Intel Core Ultra 7 155H, Arc 8-Core
75937 MB/s 0%
Gemiddeld Intel Core Ultra 7 155H
  (58692 - 93451, n=48)
72637 MB/s -4%
Samsung Galaxy Book4 Pro 360
Intel Core Ultra 5 125H, Arc 7-Core
72329 MB/s -5%
Dell Inspiron 16 Plus 7640
Intel Core Ultra 7 155H, NVIDIA GeForce RTX 4060 Laptop GPU
65616 MB/s -14%
Dell Inspiron 16 7635 2-in-1
AMD Ryzen 5 7530U, Vega 7
41838 MB/s -45%
AIDA64 / Memory Latency
Dell Inspiron 16 7640 2-in-1
Intel Core Ultra 7 155H, Arc 8-Core
143.9 ns *
Gemiddeld Intel Core Ultra 7 155H
  (116.2 - 233, n=48)
142.9 ns * +1%
Lenovo IdeaPad Pro 5 16IMH G9
Intel Core Ultra 7 155H, Arc 8-Core
137.6 ns * +4%
Samsung Galaxy Book4 Pro 360
Intel Core Ultra 5 125H, Arc 7-Core
129 ns * +10%
HP Envy x360 2-in-1 16-ad0097nr
AMD Ryzen 7 8840HS, Radeon 780M
121.8 ns * +15%
Dell Inspiron 16 Plus 7640
Intel Core Ultra 7 155H, NVIDIA GeForce RTX 4060 Laptop GPU
120.2 ns * +16%
Dell Inspiron 16 7635 2-in-1
AMD Ryzen 5 7530U, Vega 7
109 ns * +24%

* ... kleiner is beter

DPC latentie

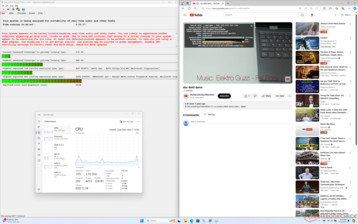
LatencyMon laat kleine DPC-problemen zien bij het openen van meerdere browsertabbladen van onze startpagina. We zijn ook in staat om 2 dropped frames op te nemen tijdens een minutenlange 4K60 videotest, terwijl dat er idealiter 0 zouden moeten zijn. De verschillen zijn gelukkig klein genoeg om in wezen onmerkbaar te zijn tijdens daadwerkelijk gebruik.

LatencyMon
LatencyMon
Drivers lijst
Drivers lijst
DPC Latencies / LatencyMon - interrupt to process latency (max), Web, Youtube, Prime95
Samsung Galaxy Book4 Pro 360
Arc 7-Core, Ultra 5 125H, Samsung PM9B1 512GB MZVL4512HBLU
7075.7 μs * -739%
HP Envy x360 2-in-1 16-ad0097nr
Radeon 780M, R7 8840HS, KIOXIA BG5 KBG50ZNV1T02
1639.8 μs * -95%
Dell Inspiron 16 7640 2-in-1
Arc 8-Core, Ultra 7 155H, Micron 2550 1TB
842.9 μs *
Lenovo IdeaPad Pro 5 16IMH G9
Arc 8-Core, Ultra 7 155H, Samsung PM9C1a MZAL81T0HDLB
824.4 μs * +2%
Dell Inspiron 16 Plus 7640
NVIDIA GeForce RTX 4060 Laptop GPU, Ultra 7 155H, SK hynix BC901 HFS001TEJ4X164N
770.1 μs * +9%
Dell Inspiron 16 7635 2-in-1
Vega 7, R5 7530U, Kioxia BG5 KBG50ZNS512G
722.5 μs * +14%

* ... kleiner is beter

Opslagapparaten

Dell betrekt zijn SSD's van meerdere leveranciers voor de Inspiron-serie, waaronder Kioxia, SK Hynix en Micron. Onze specifieke testunit wordt geleverd met de Micron 2550 wat een middelgrote PCIe4 NVMe SSD is die leessnelheden tot 5200 MB/s kan halen. Duurdere schijven zoals de Samsung PM9A1 kunnen in vergelijking meer dan 7000 MB/s halen, maar de Micron 2550 is voldoende en geschikt voor een middenklasse model zoals onze Inspiron 16 2-in-1.

De overdrachtsnelheden zijn veel hoger dan die van de Kioxia BG5 in de Inspiron 16 7635 2-in-1 van vorig jaar, zelfs als rekening wordt gehouden met eventuele throttling bij belasting.

AS SSD
AS SSD
CDM 8
CDM 8
Model ondersteunt slechts één M.2 SSD
Micron 2550 1TB
Sequential Read: 5193 MB/s
Sequential Write: 4573 MB/s
512K Read: 390.2 MB/s
512K Write: 454.5 MB/s
4K Read: 2706 MB/s
4K Write: 3099 MB/s
4K QD32 Read: 58.52 MB/s
4K QD32 Write: 135 MB/s
Drive Performance Rating - Percent
Samsung Galaxy Book4 Pro 360
Samsung PM9B1 512GB MZVL4512HBLU
86.5 pt
Dell Inspiron 16 7640 2-in-1
Micron 2550 1TB
77.1 pt
Lenovo IdeaPad Pro 5 16IMH G9
Samsung PM9C1a MZAL81T0HDLB
73.2 pt
Dell Inspiron 16 Plus 7640
SK hynix BC901 HFS001TEJ4X164N
63.4 pt
HP Envy x360 2-in-1 16-ad0097nr
KIOXIA BG5 KBG50ZNV1T02
54.9 pt
Dell Inspiron 16 7635 2-in-1
Kioxia BG5 KBG50ZNS512G
44.1 pt
DiskSpd
seq read
Lenovo IdeaPad Pro 5 16IMH G9
Samsung PM9C1a MZAL81T0HDLB
3237 (3127.1min - 3236.53max) MB/s +17%
Dell Inspiron 16 7640 2-in-1
Micron 2550 1TB
2772 (2598.84min - 2771.51max) MB/s
Samsung Galaxy Book4 Pro 360
Samsung PM9B1 512GB MZVL4512HBLU
2710 (2686.45min - 2710.15max) MB/s -2%
HP Envy x360 2-in-1 16-ad0097nr
KIOXIA BG5 KBG50ZNV1T02
2381 (2369.66min - 2380.54max) MB/s -14%
Dell Inspiron 16 Plus 7640
SK hynix BC901 HFS001TEJ4X164N
2253 (2222.1min - 2252.66max) MB/s -19%
Dell Inspiron 16 7635 2-in-1
Kioxia BG5 KBG50ZNS512G
1724 (1710.37min - 1724.49max) MB/s -38%
seq write
Dell Inspiron 16 7640 2-in-1
Micron 2550 1TB
3150 (2866.18min - 3149.7max) MB/s
Lenovo IdeaPad Pro 5 16IMH G9
Samsung PM9C1a MZAL81T0HDLB
2916 (2664.35min - 2915.5max) MB/s -7%
Samsung Galaxy Book4 Pro 360
Samsung PM9B1 512GB MZVL4512HBLU
2472 (2455.35min - 2471.91max) MB/s -22%
Dell Inspiron 16 Plus 7640
SK hynix BC901 HFS001TEJ4X164N
2368 (2226.29min - 2367.89max) MB/s -25%
HP Envy x360 2-in-1 16-ad0097nr
KIOXIA BG5 KBG50ZNV1T02
2320 (2187.12min - 2319.66max) MB/s -26%
Dell Inspiron 16 7635 2-in-1
Kioxia BG5 KBG50ZNS512G
2025 (1674.58min - 2025.43max) MB/s -36%
seq q8 t1 read
Dell Inspiron 16 7640 2-in-1
Micron 2550 1TB
5199 (4613.53min - 5199.14max) MB/s
Lenovo IdeaPad Pro 5 16IMH G9
Samsung PM9C1a MZAL81T0HDLB
5148 (4531.57min - 5148.3max) MB/s -1%
Samsung Galaxy Book4 Pro 360
Samsung PM9B1 512GB MZVL4512HBLU
3623 (3166.28min - 3622.92max) MB/s -30%
Dell Inspiron 16 Plus 7640
SK hynix BC901 HFS001TEJ4X164N
3290 (2756.65min - 3289.51max) MB/s -37%
HP Envy x360 2-in-1 16-ad0097nr
KIOXIA BG5 KBG50ZNV1T02
2723 (2395.19min - 2722.52max) MB/s -48%
Dell Inspiron 16 7635 2-in-1
Kioxia BG5 KBG50ZNS512G
2129 (1793.69min - 2129.38max) MB/s -59%
seq q8 t1 write
Dell Inspiron 16 7640 2-in-1
Micron 2550 1TB
4537 (4423.9min - 4536.71max) MB/s
Dell Inspiron 16 Plus 7640
SK hynix BC901 HFS001TEJ4X164N
4053 (3806.69min - 4053.03max) MB/s -11%
Lenovo IdeaPad Pro 5 16IMH G9
Samsung PM9C1a MZAL81T0HDLB
3925 (3848.76min - 3924.82max) MB/s -13%
HP Envy x360 2-in-1 16-ad0097nr
KIOXIA BG5 KBG50ZNV1T02
2939 (2905.25min - 2938.94max) MB/s -35%
Dell Inspiron 16 7635 2-in-1
Kioxia BG5 KBG50ZNS512G
2718 (421.94min - 2718.14max) MB/s -40%
Samsung Galaxy Book4 Pro 360
Samsung PM9B1 512GB MZVL4512HBLU
2510 (2494.14min - 2510.29max) MB/s -45%
4k q1 t1 read
Samsung Galaxy Book4 Pro 360
Samsung PM9B1 512GB MZVL4512HBLU
79.7 (78.91min - 79.65max) MB/s +33%
Dell Inspiron 16 7640 2-in-1
Micron 2550 1TB
60 (58.96min - 60.01max) MB/s
HP Envy x360 2-in-1 16-ad0097nr
KIOXIA BG5 KBG50ZNV1T02
52.5 (51.53min - 52.46max) MB/s -12%
Lenovo IdeaPad Pro 5 16IMH G9
Samsung PM9C1a MZAL81T0HDLB
51.2 (49.25min - 51.22max) MB/s -15%
Dell Inspiron 16 7635 2-in-1
Kioxia BG5 KBG50ZNS512G
47.4 (45.51min - 47.39max) MB/s -21%
Dell Inspiron 16 Plus 7640
SK hynix BC901 HFS001TEJ4X164N
44.5 (43.13min - 44.5max) MB/s -26%
4k q1 t1 write
Samsung Galaxy Book4 Pro 360
Samsung PM9B1 512GB MZVL4512HBLU
183 (179.84min - 182.98max) MB/s +30%
Dell Inspiron 16 7640 2-in-1
Micron 2550 1TB
141.2 (137.96min - 141.21max) MB/s
HP Envy x360 2-in-1 16-ad0097nr
KIOXIA BG5 KBG50ZNV1T02
136.5 (133.54min - 136.47max) MB/s -3%
Dell Inspiron 16 Plus 7640
SK hynix BC901 HFS001TEJ4X164N
123 (117.55min - 122.97max) MB/s -13%
Dell Inspiron 16 7635 2-in-1
Kioxia BG5 KBG50ZNS512G
104.3 (96.19min - 104.26max) MB/s -26%
Lenovo IdeaPad Pro 5 16IMH G9
Samsung PM9C1a MZAL81T0HDLB
69.4 (65.86min - 69.42max) MB/s -51%
4k q32 t16 read
Samsung Galaxy Book4 Pro 360
Samsung PM9B1 512GB MZVL4512HBLU
1830 (1819.65min - 1829.74max) MB/s +222%
HP Envy x360 2-in-1 16-ad0097nr
KIOXIA BG5 KBG50ZNV1T02
859 (846.09min - 858.76max) MB/s +51%
Dell Inspiron 16 7635 2-in-1
Kioxia BG5 KBG50ZNS512G
687 (664.05min - 686.61max) MB/s +21%
Dell Inspiron 16 Plus 7640
SK hynix BC901 HFS001TEJ4X164N
575 (568.91min - 575.1max) MB/s +1%
Dell Inspiron 16 7640 2-in-1
Micron 2550 1TB
569 (553.78min - 569.31max) MB/s
Lenovo IdeaPad Pro 5 16IMH G9
Samsung PM9C1a MZAL81T0HDLB
387 (351.99min - 386.95max) MB/s -32%
4k q32 t16 write
Samsung Galaxy Book4 Pro 360
Samsung PM9B1 512GB MZVL4512HBLU
1868 (1861.35min - 1868.28max) MB/s +395%
Dell Inspiron 16 Plus 7640
SK hynix BC901 HFS001TEJ4X164N
394 (375.37min - 394.14max) MB/s +5%
HP Envy x360 2-in-1 16-ad0097nr
KIOXIA BG5 KBG50ZNV1T02
384 (367.4min - 383.87max) MB/s +2%
Dell Inspiron 16 7640 2-in-1
Micron 2550 1TB
377 (370.57min - 377.49max) MB/s
Dell Inspiron 16 7635 2-in-1
Kioxia BG5 KBG50ZNS512G
342 (305min - 341.74max) MB/s -9%
Lenovo IdeaPad Pro 5 16IMH G9
Samsung PM9C1a MZAL81T0HDLB
230 (216.81min - 229.87max) MB/s -39%
AS SSD
Score Total
Samsung Galaxy Book4 Pro 360
Samsung PM9B1 512GB MZVL4512HBLU
5210 Points +13%
Dell Inspiron 16 7640 2-in-1
Micron 2550 1TB
4613 Points
Dell Inspiron 16 Plus 7640
SK hynix BC901 HFS001TEJ4X164N
4307 Points -7%
Lenovo IdeaPad Pro 5 16IMH G9
Samsung PM9C1a MZAL81T0HDLB
3893 Points -16%
HP Envy x360 2-in-1 16-ad0097nr
KIOXIA BG5 KBG50ZNV1T02
2449 Points -47%
Dell Inspiron 16 7635 2-in-1
Kioxia BG5 KBG50ZNS512G
1924 Points -58%
Score Read
Samsung Galaxy Book4 Pro 360
Samsung PM9B1 512GB MZVL4512HBLU
2027 Points +61%
Dell Inspiron 16 Plus 7640
SK hynix BC901 HFS001TEJ4X164N
1260 Points 0%
Dell Inspiron 16 7640 2-in-1
Micron 2550 1TB
1256 Points
HP Envy x360 2-in-1 16-ad0097nr
KIOXIA BG5 KBG50ZNV1T02
1151 Points -8%
Dell Inspiron 16 7635 2-in-1
Kioxia BG5 KBG50ZNS512G
933 Points -26%
Lenovo IdeaPad Pro 5 16IMH G9
Samsung PM9C1a MZAL81T0HDLB
887 Points -29%
Score Write
Dell Inspiron 16 7640 2-in-1
Micron 2550 1TB
2763 Points
Lenovo IdeaPad Pro 5 16IMH G9
Samsung PM9C1a MZAL81T0HDLB
2619 Points -5%
Dell Inspiron 16 Plus 7640
SK hynix BC901 HFS001TEJ4X164N
2482 Points -10%
Samsung Galaxy Book4 Pro 360
Samsung PM9B1 512GB MZVL4512HBLU
2182 Points -21%
HP Envy x360 2-in-1 16-ad0097nr
KIOXIA BG5 KBG50ZNV1T02
738 Points -73%
Dell Inspiron 16 7635 2-in-1
Kioxia BG5 KBG50ZNS512G
573 Points -79%
Seq Read
Lenovo IdeaPad Pro 5 16IMH G9
Samsung PM9C1a MZAL81T0HDLB
4728 MB/s +16%
Dell Inspiron 16 7640 2-in-1
Micron 2550 1TB
4076.04 MB/s
Dell Inspiron 16 Plus 7640
SK hynix BC901 HFS001TEJ4X164N
4056.14 MB/s 0%
Samsung Galaxy Book4 Pro 360
Samsung PM9B1 512GB MZVL4512HBLU
3176 MB/s -22%
Dell Inspiron 16 7635 2-in-1
Kioxia BG5 KBG50ZNS512G
2689.62 MB/s -34%
HP Envy x360 2-in-1 16-ad0097nr
KIOXIA BG5 KBG50ZNV1T02
2597 MB/s -36%
Seq Write
Lenovo IdeaPad Pro 5 16IMH G9
Samsung PM9C1a MZAL81T0HDLB
2934 MB/s +4%
Dell Inspiron 16 7640 2-in-1
Micron 2550 1TB
2810.56 MB/s
Dell Inspiron 16 Plus 7640
SK hynix BC901 HFS001TEJ4X164N
2267 MB/s -19%
Samsung Galaxy Book4 Pro 360
Samsung PM9B1 512GB MZVL4512HBLU
2211 MB/s -21%
HP Envy x360 2-in-1 16-ad0097nr
KIOXIA BG5 KBG50ZNV1T02
1738.71 MB/s -38%
Dell Inspiron 16 7635 2-in-1
Kioxia BG5 KBG50ZNS512G
1273.97 MB/s -55%
4K Read
Samsung Galaxy Book4 Pro 360
Samsung PM9B1 512GB MZVL4512HBLU
68.5 MB/s +16%
Lenovo IdeaPad Pro 5 16IMH G9
Samsung PM9C1a MZAL81T0HDLB
64.1 MB/s +8%
Dell Inspiron 16 7640 2-in-1
Micron 2550 1TB
59.26 MB/s
HP Envy x360 2-in-1 16-ad0097nr
KIOXIA BG5 KBG50ZNV1T02
52.79 MB/s -11%
Dell Inspiron 16 Plus 7640
SK hynix BC901 HFS001TEJ4X164N
49.59 MB/s -16%
Dell Inspiron 16 7635 2-in-1
Kioxia BG5 KBG50ZNS512G
45.37 MB/s -23%
4K Write
Dell Inspiron 16 7640 2-in-1
Micron 2550 1TB
176.9 MB/s
Dell Inspiron 16 Plus 7640
SK hynix BC901 HFS001TEJ4X164N
164.61 MB/s -7%
Samsung Galaxy Book4 Pro 360
Samsung PM9B1 512GB MZVL4512HBLU
164.1 MB/s -7%
Lenovo IdeaPad Pro 5 16IMH G9
Samsung PM9C1a MZAL81T0HDLB
161.7 MB/s -9%
HP Envy x360 2-in-1 16-ad0097nr
KIOXIA BG5 KBG50ZNV1T02
156.53 MB/s -12%
Dell Inspiron 16 7635 2-in-1
Kioxia BG5 KBG50ZNS512G
111.85 MB/s -37%
4K-64 Read
Samsung Galaxy Book4 Pro 360
Samsung PM9B1 512GB MZVL4512HBLU
1641 MB/s +108%
HP Envy x360 2-in-1 16-ad0097nr
KIOXIA BG5 KBG50ZNV1T02
838.9 MB/s +6%
Dell Inspiron 16 Plus 7640
SK hynix BC901 HFS001TEJ4X164N
804.71 MB/s +2%
Dell Inspiron 16 7640 2-in-1
Micron 2550 1TB
788.91 MB/s
Dell Inspiron 16 7635 2-in-1
Kioxia BG5 KBG50ZNS512G
618.54 MB/s -22%
Lenovo IdeaPad Pro 5 16IMH G9
Samsung PM9C1a MZAL81T0HDLB
350 MB/s -56%
4K-64 Write
Dell Inspiron 16 7640 2-in-1
Micron 2550 1TB
2304.92 MB/s
Lenovo IdeaPad Pro 5 16IMH G9
Samsung PM9C1a MZAL81T0HDLB
2164 MB/s -6%
Dell Inspiron 16 Plus 7640
SK hynix BC901 HFS001TEJ4X164N
2090.45 MB/s -9%
Samsung Galaxy Book4 Pro 360
Samsung PM9B1 512GB MZVL4512HBLU
1797 MB/s -22%
HP Envy x360 2-in-1 16-ad0097nr
KIOXIA BG5 KBG50ZNV1T02
407.67 MB/s -82%
Dell Inspiron 16 7635 2-in-1
Kioxia BG5 KBG50ZNS512G
333.93 MB/s -86%
Access Time Read
Dell Inspiron 16 7635 2-in-1
Kioxia BG5 KBG50ZNS512G
0.129 ms * -40%
HP Envy x360 2-in-1 16-ad0097nr
KIOXIA BG5 KBG50ZNV1T02
0.109 ms * -18%
Dell Inspiron 16 Plus 7640
SK hynix BC901 HFS001TEJ4X164N
0.093 ms * -1%
Dell Inspiron 16 7640 2-in-1
Micron 2550 1TB
0.092 ms *
Lenovo IdeaPad Pro 5 16IMH G9
Samsung PM9C1a MZAL81T0HDLB
0.037 ms * +60%
Samsung Galaxy Book4 Pro 360
Samsung PM9B1 512GB MZVL4512HBLU
0.034 ms * +63%
Access Time Write
Dell Inspiron 16 Plus 7640
SK hynix BC901 HFS001TEJ4X164N
0.318 ms * -405%
Dell Inspiron 16 7635 2-in-1
Kioxia BG5 KBG50ZNS512G
0.122 ms * -94%
HP Envy x360 2-in-1 16-ad0097nr
KIOXIA BG5 KBG50ZNV1T02
0.078 ms * -24%
Dell Inspiron 16 7640 2-in-1
Micron 2550 1TB
0.063 ms *
Samsung Galaxy Book4 Pro 360
Samsung PM9B1 512GB MZVL4512HBLU
0.032 ms * +49%
Lenovo IdeaPad Pro 5 16IMH G9
Samsung PM9C1a MZAL81T0HDLB
0.026 ms * +59%

* ... kleiner is beter

Disk Throttling: DiskSpd Read Loop, Queue Depth 8

02655307951060132515901855212023852650291531803445371039754240450547705035Tooltip
Dell Inspiron 16 7640 2-in-1 Micron 2550 1TB; diskspd 2.0.17 f: Ø5042 (4206.02-5201.36)
Dell Inspiron 16 7635 2-in-1 Kioxia BG5 KBG50ZNS512G: Ø2038 (1861.27-2208.92)

GPU-prestaties

De grafische prestaties zijn vrij goed en een van de snelste voor een convertible zonder gebruik te maken van discrete opties. De Arc 8 GPU is vergelijkbaar met de Radeon 780M en ligt ver voor op de oudere Iris Xe 96 EU's of Radeon RX Vega oplossingen met meer dan 2x in veel gevallen. De Radeon RX Vega 7 in de Inspiron 16 7635 2-in-1 van vorig jaar loopt bijvoorbeeld bijna 60 procent achter.

Gebruikers die prestaties op gamingniveau en CUDA-versnelling eisen, kunnen de Spectre x360 16 met de GeForce RTX 4050 wat nog eens 2x meer grafische prestaties is dan de Arc 8. Natuurlijk is de Spectre ook aanzienlijk duurder dan onze Dell.

Houd er rekening mee dat de Arc 8 GPU alleen beschikbaar is met de Core Ultra 7 155H configuratie. Als u kiest voor de Core Ultra 5 125U, moet u genoegen nemen met de Arc 4 wat een aanzienlijke daling van 40 tot 45 procent in grafische prestaties met zich meebrengt.

Vermogen ProfielFire Strike Grafische ScoreFire Strike Fysica ScoreGecombineerde Score
Prestatiemodus8567256872982
Evenwichtige modus8640 (-0%)26567 (-0%)2781 (-7%)
Batterijvoeding7734 (-10%)25155 (-2%)2886 (-3%)

Het draaien in de gebalanceerde modus zou de prestaties hooguit minimaal beïnvloeden op basis van onze resultaten op Fire Strike in de bovenstaande tabel. Het prestatietekort bij het werken op batterijvoeding is lager dan verwacht, namelijk slechts 10 procent voor een goede consistentie tussen de verschillende energiemodi.

3DMark 11
3DMark 11
Cloud Gate
Cloud Gate
Fire Strike
Fire Strike
Time Spy
Time Spy
3DMark Performance Rating - Percent
Dell Inspiron 16 Plus 7640 -1!
NVIDIA GeForce RTX 4060 Laptop GPU, Intel Core Ultra 7 155H
100 pt
HP Spectre x360 16 RTX 4050 -1!
NVIDIA GeForce RTX 4050 Laptop GPU, Intel Core Ultra 7 155H
81.9 pt
Dell Inspiron 16 7640 2-in-1
Intel Arc 8-Core iGPU, Intel Core Ultra 7 155H
54.2 pt
Gemiddeld Intel Arc 8-Core iGPU
 
51.8 pt
Lenovo ThinkPad T16 G2 21K70035GE
AMD Radeon 780M, AMD Ryzen 7 7840U
51.6 pt
HP Envy x360 2-in-1 16-ad0097nr
AMD Radeon 780M, AMD Ryzen 7 8840HS
50.1 pt
Acer Swift X SFX16-52G-52VE
Intel Arc A370M, Intel Core i5-1240P
47.3 pt
Acer Swift Edge SFE16-42-R1GM
AMD Radeon 680M, AMD Ryzen 7 7735U
45.8 pt
Asus ExpertBook B5 Flip B5602FBN
Intel Arc A350M, Intel Core i7-1260P
41.3 pt
Samsung Galaxy Book4 Pro 360 -1!
Intel Arc 7-Core iGPU, Intel Core Ultra 5 125H
37.3 pt
LG Gram 2in1 16 16T90R - G.AA78G
Intel Iris Xe Graphics G7 96EUs, Intel Core i7-1360P
34.1 pt
Lenovo Yoga 7 2-in-1 16IML9
Intel Graphics 4-Core iGPU (Arc), Intel Core Ultra 5 125U
30.6 pt
HP Spectre x360 2-in-1 16-f1075ng
Intel Iris Xe Graphics G7 96EUs, Intel Core i7-12700H
27.8 pt
Samsung Galaxy Book3 Pro 16
Intel Iris Xe Graphics G7 80EUs, Intel Core i5-1340P
25.2 pt
Lenovo ThinkPad E16 G1 Core i5-1335U
Intel Iris Xe Graphics G7 80EUs, Intel Core i5-1335U
24.2 pt
Lenovo Thinkpad X1 Fold 16
Intel Iris Xe Graphics G7 96EUs, Intel Core i7-1250U
23.2 pt
Lenovo IdeaPad Flex 5 16ABR G8 -1!
AMD Radeon RX Vega 8 (Ryzen 4000/5000), AMD Ryzen 7 7730U
18.8 pt
Dell Inspiron 16 7635 2-in-1 -1!
AMD Radeon RX Vega 7, AMD Ryzen 5 7530U
17.9 pt
3DMark 11 - 1280x720 Performance GPU
Dell Inspiron 16 Plus 7640
NVIDIA GeForce RTX 4060 Laptop GPU, Intel Core Ultra 7 155H
30097 Points +138%
HP Spectre x360 16 RTX 4050
NVIDIA GeForce RTX 4050 Laptop GPU, Intel Core Ultra 7 155H
24603 Points +94%
Dell Inspiron 16 7640 2-in-1
Intel Arc 8-Core iGPU, Intel Core Ultra 7 155H
12670 Points
Lenovo ThinkPad T16 G2 21K70035GE
AMD Radeon 780M, AMD Ryzen 7 7840U
12453 Points -2%
HP Envy x360 2-in-1 16-ad0097nr
AMD Radeon 780M, AMD Ryzen 7 8840HS
12413 Points -2%
Gemiddeld Intel Arc 8-Core iGPU
  (8064 - 13716, n=36)
11932 Points -6%
Acer Swift X SFX16-52G-52VE
Intel Arc A370M, Intel Core i5-1240P
11748 Points -7%
Samsung Galaxy Book4 Pro 360
Intel Arc 7-Core iGPU, Intel Core Ultra 5 125H
11528 Points -9%
Asus ExpertBook B5 Flip B5602FBN
Intel Arc A350M, Intel Core i7-1260P
10773 Points -15%
Acer Swift Edge SFE16-42-R1GM
AMD Radeon 680M, AMD Ryzen 7 7735U
9702 Points -23%
LG Gram 2in1 16 16T90R - G.AA78G
Intel Iris Xe Graphics G7 96EUs, Intel Core i7-1360P
7098 Points -44%
Lenovo Yoga 7 2-in-1 16IML9
Intel Graphics 4-Core iGPU (Arc), Intel Core Ultra 5 125U
6711 Points -47%
HP Spectre x360 2-in-1 16-f1075ng
Intel Iris Xe Graphics G7 96EUs, Intel Core i7-12700H
6582 Points -48%
Lenovo IdeaPad Flex 5 16ABR G8
AMD Radeon RX Vega 8 (Ryzen 4000/5000), AMD Ryzen 7 7730U
6556 Points -48%
Dell Inspiron 16 7635 2-in-1
AMD Radeon RX Vega 7, AMD Ryzen 5 7530U
6249 Points -51%
Samsung Galaxy Book3 Pro 16
Intel Iris Xe Graphics G7 80EUs, Intel Core i5-1340P
6225 Points -51%
Lenovo ThinkPad E16 G1 Core i5-1335U
Intel Iris Xe Graphics G7 80EUs, Intel Core i5-1335U
5160 Points -59%
Lenovo Thinkpad X1 Fold 16
Intel Iris Xe Graphics G7 96EUs, Intel Core i7-1250U
4817 Points -62%
3DMark
1280x720 Cloud Gate Standard Graphics
Dell Inspiron 16 7640 2-in-1
Intel Arc 8-Core iGPU, Intel Core Ultra 7 155H
47143 Points
Lenovo ThinkPad T16 G2 21K70035GE
AMD Radeon 780M, AMD Ryzen 7 7840U
46613 Points -1%
HP Envy x360 2-in-1 16-ad0097nr
AMD Radeon 780M, AMD Ryzen 7 8840HS
44702 Points -5%
Acer Swift Edge SFE16-42-R1GM
AMD Radeon 680M, AMD Ryzen 7 7735U
43943 Points -7%
Gemiddeld Intel Arc 8-Core iGPU
  (31876 - 52200, n=23)
43103 Points -9%
Acer Swift X SFX16-52G-52VE
Intel Arc A370M, Intel Core i5-1240P
35604 Points -24%
LG Gram 2in1 16 16T90R - G.AA78G
Intel Iris Xe Graphics G7 96EUs, Intel Core i7-1360P
31618 Points -33%
Asus ExpertBook B5 Flip B5602FBN
Intel Arc A350M, Intel Core i7-1260P
28623 Points -39%
Lenovo Yoga 7 2-in-1 16IML9
Intel Graphics 4-Core iGPU (Arc), Intel Core Ultra 5 125U
27316 Points -42%
HP Spectre x360 2-in-1 16-f1075ng
Intel Iris Xe Graphics G7 96EUs, Intel Core i7-12700H
24123 Points -49%
Lenovo ThinkPad E16 G1 Core i5-1335U
Intel Iris Xe Graphics G7 80EUs, Intel Core i5-1335U
23328 Points -51%
Lenovo Thinkpad X1 Fold 16
Intel Iris Xe Graphics G7 96EUs, Intel Core i7-1250U
20456 Points -57%
Samsung Galaxy Book3 Pro 16
Intel Iris Xe Graphics G7 80EUs, Intel Core i5-1340P
18764 Points -60%
1920x1080 Fire Strike Graphics
Dell Inspiron 16 Plus 7640
NVIDIA GeForce RTX 4060 Laptop GPU, Intel Core Ultra 7 155H
22476 Points +162%
HP Spectre x360 16 RTX 4050
NVIDIA GeForce RTX 4050 Laptop GPU, Intel Core Ultra 7 155H
17908 Points +109%
Dell Inspiron 16 7640 2-in-1
Intel Arc 8-Core iGPU, Intel Core Ultra 7 155H
8567 Points
Samsung Galaxy Book4 Pro 360
Intel Arc 7-Core iGPU, Intel Core Ultra 5 125H
8366 Points -2%
Gemiddeld Intel Arc 8-Core iGPU
  (5568 - 9692, n=40)
8275 Points -3%
Acer Swift X SFX16-52G-52VE
Intel Arc A370M, Intel Core i5-1240P
8149 Points -5%
Lenovo ThinkPad T16 G2 21K70035GE
AMD Radeon 780M, AMD Ryzen 7 7840U
7663 Points -11%
HP Envy x360 2-in-1 16-ad0097nr
AMD Radeon 780M, AMD Ryzen 7 8840HS
7357 Points -14%
Asus ExpertBook B5 Flip B5602FBN
Intel Arc A350M, Intel Core i7-1260P
7147 Points -17%
Acer Swift Edge SFE16-42-R1GM
AMD Radeon 680M, AMD Ryzen 7 7735U
6777 Points -21%
LG Gram 2in1 16 16T90R - G.AA78G
Intel Iris Xe Graphics G7 96EUs, Intel Core i7-1360P
5779 Points -33%
Samsung Galaxy Book3 Pro 16
Intel Iris Xe Graphics G7 80EUs, Intel Core i5-1340P
5127 Points -40%
Lenovo Yoga 7 2-in-1 16IML9
Intel Graphics 4-Core iGPU (Arc), Intel Core Ultra 5 125U
4786 Points -44%
HP Spectre x360 2-in-1 16-f1075ng
Intel Iris Xe Graphics G7 96EUs, Intel Core i7-12700H
4629 Points -46%
Lenovo Thinkpad X1 Fold 16
Intel Iris Xe Graphics G7 96EUs, Intel Core i7-1250U
4186 Points -51%
Lenovo IdeaPad Flex 5 16ABR G8
AMD Radeon RX Vega 8 (Ryzen 4000/5000), AMD Ryzen 7 7730U
4159 Points -51%
Dell Inspiron 16 7635 2-in-1
AMD Radeon RX Vega 7, AMD Ryzen 5 7530U
3996 Points -53%
Lenovo ThinkPad E16 G1 Core i5-1335U
Intel Iris Xe Graphics G7 80EUs, Intel Core i5-1335U
3596 Points -58%
2560x1440 Time Spy Graphics
Dell Inspiron 16 Plus 7640
NVIDIA GeForce RTX 4060 Laptop GPU, Intel Core Ultra 7 155H
8229 Points +172%
HP Spectre x360 16 RTX 4050
NVIDIA GeForce RTX 4050 Laptop GPU, Intel Core Ultra 7 155H
6941 Points +130%
Gemiddeld Intel Arc 8-Core iGPU
  (2018 - 3770, n=43)
3224 Points +7%
Acer Swift X SFX16-52G-52VE
Intel Arc A370M, Intel Core i5-1240P
3167 Points +5%
Asus ExpertBook B5 Flip B5602FBN
Intel Arc A350M, Intel Core i7-1260P
3050 Points +1%
Dell Inspiron 16 7640 2-in-1
Intel Arc 8-Core iGPU, Intel Core Ultra 7 155H
3023 Points
Samsung Galaxy Book4 Pro 360
Intel Arc 7-Core iGPU, Intel Core Ultra 5 125H
3000 Points -1%
Lenovo ThinkPad T16 G2 21K70035GE
AMD Radeon 780M, AMD Ryzen 7 7840U
2631 Points -13%
HP Envy x360 2-in-1 16-ad0097nr
AMD Radeon 780M, AMD Ryzen 7 8840HS
2591 Points -14%
Acer Swift Edge SFE16-42-R1GM
AMD Radeon 680M, AMD Ryzen 7 7735U
2276 Points -25%
Lenovo Yoga 7 2-in-1 16IML9
Intel Graphics 4-Core iGPU (Arc), Intel Core Ultra 5 125U
1704 Points -44%
LG Gram 2in1 16 16T90R - G.AA78G
Intel Iris Xe Graphics G7 96EUs, Intel Core i7-1360P
1662 Points -45%
Samsung Galaxy Book3 Pro 16
Intel Iris Xe Graphics G7 80EUs, Intel Core i5-1340P
1445 Points -52%
HP Spectre x360 2-in-1 16-f1075ng
Intel Iris Xe Graphics G7 96EUs, Intel Core i7-12700H
1444 Points -52%
Lenovo IdeaPad Flex 5 16ABR G8
AMD Radeon RX Vega 8 (Ryzen 4000/5000), AMD Ryzen 7 7730U
1330 Points -56%
Dell Inspiron 16 7635 2-in-1
AMD Radeon RX Vega 7, AMD Ryzen 5 7530U
1245 Points -59%
Lenovo Thinkpad X1 Fold 16
Intel Iris Xe Graphics G7 96EUs, Intel Core i7-1250U
1209 Points -60%
Lenovo ThinkPad E16 G1 Core i5-1335U
Intel Iris Xe Graphics G7 80EUs, Intel Core i5-1335U
1150 Points -62%
3DMark 11 Performance
12925 punten
3DMark Cloud Gate Standard Score
35844 punten
3DMark Fire Strike Score
7879 punten
3DMark Time Spy Score
3390 punten
Help
Blender
v3.3 Classroom HIP/AMD
Dell Inspiron 16 7635 2-in-1
AMD Radeon RX Vega 7, AMD Ryzen 5 7530U
622 Seconds *
Lenovo IdeaPad Flex 5 16ABR G8
AMD Radeon RX Vega 8 (Ryzen 4000/5000), AMD Ryzen 7 7730U
612 Seconds *
Acer Swift Edge SFE16-42-R1GM
AMD Radeon 680M, AMD Ryzen 7 7735U
347 Seconds *
v3.3 Classroom OPTIX/RTX
HP Spectre x360 16 RTX 4050
NVIDIA GeForce RTX 4050 Laptop GPU, Intel Core Ultra 7 155H
31 Seconds *
Dell Inspiron 16 Plus 7640
NVIDIA GeForce RTX 4060 Laptop GPU, Intel Core Ultra 7 155H
24 Seconds *
v3.3 Classroom CUDA
HP Spectre x360 16 RTX 4050
NVIDIA GeForce RTX 4050 Laptop GPU, Intel Core Ultra 7 155H
54 Seconds *
Dell Inspiron 16 Plus 7640
NVIDIA GeForce RTX 4060 Laptop GPU, Intel Core Ultra 7 155H
44 Seconds *
v3.3 Classroom CPU
Lenovo Thinkpad X1 Fold 16
Intel Iris Xe Graphics G7 96EUs, Intel Core i7-1250U
1001 Seconds * -173%
Samsung Galaxy Book4 Pro 360
Intel Arc 7-Core iGPU, Intel Core Ultra 5 125H
671 Seconds * -83%
Lenovo ThinkPad E16 G1 Core i5-1335U
Intel Iris Xe Graphics G7 80EUs, Intel Core i5-1335U
658 Seconds * -79%
Dell Inspiron 16 7635 2-in-1
AMD Radeon RX Vega 7, AMD Ryzen 5 7530U
646 Seconds * -76%
LG Gram 2in1 16 16T90R - G.AA78G
Intel Iris Xe Graphics G7 96EUs, Intel Core i7-1360P
607 Seconds * -65%
Samsung Galaxy Book3 Pro 16
Intel Iris Xe Graphics G7 80EUs, Intel Core i5-1340P
559 Seconds * -52%
Acer Swift X SFX16-52G-52VE
Intel Arc A370M, Intel Core i5-1240P
552 Seconds * -50%
Acer Swift Edge SFE16-42-R1GM
AMD Radeon 680M, AMD Ryzen 7 7735U
540 Seconds * -47%
Asus ExpertBook B5 Flip B5602FBN
Intel Arc A350M, Intel Core i7-1260P
526 Seconds * -43%
Lenovo IdeaPad Flex 5 16ABR G8
AMD Radeon RX Vega 8 (Ryzen 4000/5000), AMD Ryzen 7 7730U
488 Seconds * -33%
HP Spectre x360 2-in-1 16-f1075ng
Intel Iris Xe Graphics G7 96EUs, Intel Core i7-12700H
487 Seconds * -33%
Gemiddeld Intel Arc 8-Core iGPU
  (294 - 692, n=39)
428 Seconds * -17%
Lenovo ThinkPad T16 G2 21K70035GE
AMD Radeon 780M, AMD Ryzen 7 7840U
407 Seconds * -11%
HP Envy x360 2-in-1 16-ad0097nr
AMD Radeon 780M, AMD Ryzen 7 8840HS
405 Seconds * -10%
HP Spectre x360 16 RTX 4050
NVIDIA GeForce RTX 4050 Laptop GPU, Intel Core Ultra 7 155H
397 Seconds * -8%
Dell Inspiron 16 7640 2-in-1
Intel Arc 8-Core iGPU, Intel Core Ultra 7 155H
367 Seconds *
Dell Inspiron 16 Plus 7640
NVIDIA GeForce RTX 4060 Laptop GPU, Intel Core Ultra 7 155H
365 Seconds * +1%
v3.3 Classroom oneAPI/Intel
Gemiddeld Intel Arc 8-Core iGPU
  (208 - 261, n=14)
230 Seconds * -5%
Dell Inspiron 16 7640 2-in-1
Intel Arc 8-Core iGPU, Intel Core Ultra 7 155H
219 Seconds *

* ... kleiner is beter

Performance Rating - Percent
Dell Inspiron 16 Plus 7640
Intel Core Ultra 7 155H, NVIDIA GeForce RTX 4060 Laptop GPU
100 pt
Lenovo IdeaPad Pro 5 16IMH G9
Intel Core Ultra 7 155H, Intel Arc 8-Core iGPU
40.8 pt
Dell Inspiron 16 7640 2-in-1
Intel Core Ultra 7 155H, Intel Arc 8-Core iGPU
37.8 pt
HP Envy x360 2-in-1 16-ad0097nr
AMD Ryzen 7 8840HS, AMD Radeon 780M
33.8 pt
Samsung Galaxy Book4 Pro 360 -1!
Intel Core Ultra 5 125H, Intel Arc 7-Core iGPU
31.2 pt
Dell Inspiron 16 7635 2-in-1 -1!
AMD Ryzen 5 7530U, AMD Radeon RX Vega 7
23.9 pt
The Witcher 3 - 1920x1080 Ultra Graphics & Postprocessing (HBAO+)
Dell Inspiron 16 Plus 7640
Intel Core Ultra 7 155H, NVIDIA GeForce RTX 4060 Laptop GPU
84.1 (80min) fps +252%
HP Envy x360 2-in-1 16-ad0097nr
AMD Ryzen 7 8840HS, AMD Radeon 780M
28.8 (24min) fps +21%
Lenovo IdeaPad Pro 5 16IMH G9
Intel Core Ultra 7 155H, Intel Arc 8-Core iGPU
25.5 (24min, 24P1) fps +7%
Dell Inspiron 16 7640 2-in-1
Intel Core Ultra 7 155H, Intel Arc 8-Core iGPU
23.9 (23min) fps
Samsung Galaxy Book4 Pro 360
Intel Core Ultra 5 125H, Intel Arc 7-Core iGPU
18.3 (9min, 12P1) fps -23%
Dell Inspiron 16 7635 2-in-1
AMD Ryzen 5 7530U, AMD Radeon RX Vega 7
15.7 (14min) fps -34%
Final Fantasy XV Benchmark - 1920x1080 High Quality
Dell Inspiron 16 Plus 7640
Intel Core Ultra 7 155H, NVIDIA GeForce RTX 4060 Laptop GPU
78.8 fps +194%
Lenovo IdeaPad Pro 5 16IMH G9
Intel Core Ultra 7 155H, Intel Arc 8-Core iGPU
30.5 fps +14%
Dell Inspiron 16 7640 2-in-1
Intel Core Ultra 7 155H, Intel Arc 8-Core iGPU
26.8 fps
HP Envy x360 2-in-1 16-ad0097nr
AMD Ryzen 7 8840HS, AMD Radeon 780M
25.2 fps -6%
Samsung Galaxy Book4 Pro 360
Intel Core Ultra 5 125H, Intel Arc 7-Core iGPU
22.2 fps -17%
Dell Inspiron 16 7635 2-in-1
AMD Ryzen 5 7530U, AMD Radeon RX Vega 7
12.9 fps -52%
Strange Brigade - 1920x1080 ultra AA:ultra AF:16
Dell Inspiron 16 Plus 7640
Intel Core Ultra 7 155H, NVIDIA GeForce RTX 4060 Laptop GPU
153.5 (48min, 114.7P1) fps +238%
Lenovo IdeaPad Pro 5 16IMH G9
Intel Core Ultra 7 155H, Intel Arc 8-Core iGPU
55 fps +21%
Dell Inspiron 16 7640 2-in-1
Intel Core Ultra 7 155H, Intel Arc 8-Core iGPU
45.4 (5min, 8.91P1) fps
HP Envy x360 2-in-1 16-ad0097nr
AMD Ryzen 7 8840HS, AMD Radeon 780M
42.2 (7.1min, 9.18P1) fps -7%
Samsung Galaxy Book4 Pro 360
Intel Core Ultra 5 125H, Intel Arc 7-Core iGPU
40 fps -12%
Dell Inspiron 16 7635 2-in-1
AMD Ryzen 5 7530U, AMD Radeon RX Vega 7
23.2 (7.3min, 9.35P1) fps -49%
Dota 2 Reborn - 1920x1080 ultra (3/3) best looking
Dell Inspiron 16 Plus 7640
Intel Core Ultra 7 155H, NVIDIA GeForce RTX 4060 Laptop GPU
135.1 (116.3min) fps +73%
Lenovo IdeaPad Pro 5 16IMH G9
Intel Core Ultra 7 155H, Intel Arc 8-Core iGPU
80.6 (55.9min) fps +3%
Dell Inspiron 16 7640 2-in-1
Intel Core Ultra 7 155H, Intel Arc 8-Core iGPU
78 (52.7min) fps
HP Envy x360 2-in-1 16-ad0097nr
AMD Ryzen 7 8840HS, AMD Radeon 780M
65.4 (54.7min) fps -16%
Samsung Galaxy Book4 Pro 360
Intel Core Ultra 5 125H, Intel Arc 7-Core iGPU
58.7 (42.1min) fps -25%
Dell Inspiron 16 7635 2-in-1
AMD Ryzen 5 7530U, AMD Radeon RX Vega 7
52.4 (46.9min) fps -33%
X-Plane 11.11 - 1920x1080 high (fps_test=3)
Dell Inspiron 16 Plus 7640
Intel Core Ultra 7 155H, NVIDIA GeForce RTX 4060 Laptop GPU
86.5 fps +116%
Dell Inspiron 16 7640 2-in-1
Intel Core Ultra 7 155H, Intel Arc 8-Core iGPU
40.1 fps
Lenovo IdeaPad Pro 5 16IMH G9
Intel Core Ultra 7 155H, Intel Arc 8-Core iGPU
33.5 fps -16%
Samsung Galaxy Book4 Pro 360
Intel Core Ultra 5 125H, Intel Arc 7-Core iGPU
31.5 fps -21%
HP Envy x360 2-in-1 16-ad0097nr
AMD Ryzen 7 8840HS, AMD Radeon 780M
27.9 fps -30%
Dell Inspiron 16 7635 2-in-1
AMD Ryzen 5 7530U, AMD Radeon RX Vega 7
26.3 fps -34%
Far Cry 5 - 1920x1080 Ultra Preset AA:T
Dell Inspiron 16 Plus 7640
Intel Core Ultra 7 155H, NVIDIA GeForce RTX 4060 Laptop GPU
110 (81min) fps +224%
Lenovo IdeaPad Pro 5 16IMH G9
Intel Core Ultra 7 155H, Intel Arc 8-Core iGPU
46 fps +35%
Dell Inspiron 16 7640 2-in-1
Intel Core Ultra 7 155H, Intel Arc 8-Core iGPU
34 (28min) fps
HP Envy x360 2-in-1 16-ad0097nr
AMD Ryzen 7 8840HS, AMD Radeon 780M
31 (23min) fps -9%
Tiny Tina's Wonderlands
1280x720 Lowest Preset (DX12)
HP Envy x360 2-in-1 16-ad0097nr
AMD Ryzen 7 8840HS, AMD Radeon 780M
97.4 fps +12%
Dell Inspiron 16 7640 2-in-1
Intel Core Ultra 7 155H, Intel Arc 8-Core iGPU
86.6 fps
Gemiddeld Intel Arc 8-Core iGPU
  (77.4 - 96.1, n=12)
84.1 fps -3%
Acer Swift Edge SFE16-42-R1GM
AMD Ryzen 7 7735U, AMD Radeon 680M
68.9 fps -20%
Dell Inspiron 16 7635 2-in-1
AMD Ryzen 5 7530U, AMD Radeon RX Vega 7
59.2 fps -32%
Lenovo Yoga 7 2-in-1 16IML9
Intel Core Ultra 5 125U, Intel Graphics 4-Core iGPU (Arc)
54.8 fps -37%
Lenovo ThinkPad E16 G1 Core i5-1335U
Intel Core i5-1335U, Intel Iris Xe Graphics G7 80EUs
38.1 fps -56%
1920x1080 Low Preset (DX12)
Dell Inspiron 16 Plus 7640
Intel Core Ultra 7 155H, NVIDIA GeForce RTX 4060 Laptop GPU
177.4 fps +261%
HP Spectre x360 16 RTX 4050
Intel Core Ultra 7 155H, NVIDIA GeForce RTX 4050 Laptop GPU
135.1 fps +175%
Gemiddeld Intel Arc 8-Core iGPU
  (44.9 - 54.6, n=12)
50.2 fps +2%
HP Envy x360 2-in-1 16-ad0097nr
AMD Ryzen 7 8840HS, AMD Radeon 780M
49.8 fps +1%
Dell Inspiron 16 7640 2-in-1
Intel Core Ultra 7 155H, Intel Arc 8-Core iGPU
49.2 fps
Acer Swift Edge SFE16-42-R1GM
AMD Ryzen 7 7735U, AMD Radeon 680M
37.9 fps -23%
Lenovo Yoga 7 2-in-1 16IML9
Intel Core Ultra 5 125U, Intel Graphics 4-Core iGPU (Arc)
29.9 fps -39%
Dell Inspiron 16 7635 2-in-1
AMD Ryzen 5 7530U, AMD Radeon RX Vega 7
28.8 fps -41%
Lenovo ThinkPad E16 G1 Core i5-1335U
Intel Core i5-1335U, Intel Iris Xe Graphics G7 80EUs
20.6 fps -58%
1920x1080 Medium Preset (DX12)
Dell Inspiron 16 Plus 7640
Intel Core Ultra 7 155H, NVIDIA GeForce RTX 4060 Laptop GPU
116 fps +211%
HP Spectre x360 16 RTX 4050
Intel Core Ultra 7 155H, NVIDIA GeForce RTX 4050 Laptop GPU
113.4 fps +204%
Gemiddeld Intel Arc 8-Core iGPU
  (35.3 - 45, n=12)
40.7 fps +9%
HP Envy x360 2-in-1 16-ad0097nr
AMD Ryzen 7 8840HS, AMD Radeon 780M
38 fps +2%
Dell Inspiron 16 7640 2-in-1
Intel Core Ultra 7 155H, Intel Arc 8-Core iGPU
37.3 fps
Acer Swift Edge SFE16-42-R1GM
AMD Ryzen 7 7735U, AMD Radeon 680M
30 fps -20%
Lenovo Yoga 7 2-in-1 16IML9
Intel Core Ultra 5 125U, Intel Graphics 4-Core iGPU (Arc)
24 fps -36%
Dell Inspiron 16 7635 2-in-1
AMD Ryzen 5 7530U, AMD Radeon RX Vega 7
21.2 fps -43%
Lenovo ThinkPad E16 G1 Core i5-1335U
Intel Core i5-1335U, Intel Iris Xe Graphics G7 80EUs
15.3 fps -59%
1920x1080 High Preset (DX12)
Dell Inspiron 16 Plus 7640
Intel Core Ultra 7 155H, NVIDIA GeForce RTX 4060 Laptop GPU
91.9 fps +248%
HP Spectre x360 16 RTX 4050
Intel Core Ultra 7 155H, NVIDIA GeForce RTX 4050 Laptop GPU
75.4 fps +186%
Gemiddeld Intel Arc 8-Core iGPU
  (24.7 - 31.6, n=12)
28.7 fps +9%
Dell Inspiron 16 7640 2-in-1
Intel Core Ultra 7 155H, Intel Arc 8-Core iGPU
26.4 fps
HP Envy x360 2-in-1 16-ad0097nr
AMD Ryzen 7 8840HS, AMD Radeon 780M
24 fps -9%
Acer Swift Edge SFE16-42-R1GM
AMD Ryzen 7 7735U, AMD Radeon 680M
19.8 fps -25%
Lenovo Yoga 7 2-in-1 16IML9
Intel Core Ultra 5 125U, Intel Graphics 4-Core iGPU (Arc)
16.1 fps -39%
Dell Inspiron 16 7635 2-in-1
AMD Ryzen 5 7530U, AMD Radeon RX Vega 7
12.9 fps -51%
Lenovo ThinkPad E16 G1 Core i5-1335U
Intel Core i5-1335U, Intel Iris Xe Graphics G7 80EUs
10.4 fps -61%
1920x1080 Badass Preset (DX12)
Dell Inspiron 16 Plus 7640
Intel Core Ultra 7 155H, NVIDIA GeForce RTX 4060 Laptop GPU
71.1 fps +235%
HP Spectre x360 16 RTX 4050
Intel Core Ultra 7 155H, NVIDIA GeForce RTX 4050 Laptop GPU
59.1 fps +179%
Gemiddeld Intel Arc 8-Core iGPU
  (20.2 - 25.9, n=12)
23.2 fps +9%
Dell Inspiron 16 7640 2-in-1
Intel Core Ultra 7 155H, Intel Arc 8-Core iGPU
21.2 fps
HP Envy x360 2-in-1 16-ad0097nr
AMD Ryzen 7 8840HS, AMD Radeon 780M
19.5 fps -8%
Acer Swift Edge SFE16-42-R1GM
AMD Ryzen 7 7735U, AMD Radeon 680M
16 fps -25%
Lenovo Yoga 7 2-in-1 16IML9
Intel Core Ultra 5 125U, Intel Graphics 4-Core iGPU (Arc)
12.7 fps -40%
Dell Inspiron 16 7635 2-in-1
AMD Ryzen 5 7530U, AMD Radeon RX Vega 7
9.2 fps -57%
Lenovo ThinkPad E16 G1 Core i5-1335U
Intel Core i5-1335U, Intel Iris Xe Graphics G7 80EUs
8.1 fps -62%
The Witcher 3
1024x768 Low Graphics & Postprocessing
Dell Inspiron 16 Plus 7640
Intel Core Ultra 7 155H, NVIDIA GeForce RTX 4060 Laptop GPU
375.8 (348min) fps +166%
HP Spectre x360 16 RTX 4050
Intel Core Ultra 7 155H, NVIDIA GeForce RTX 4050 Laptop GPU
299 (264min) fps +111%
Dell Inspiron 16 7640 2-in-1
Intel Core Ultra 7 155H, Intel Arc 8-Core iGPU
141.5 (128min) fps
Asus ExpertBook B5 Flip B5602FBN
Intel Core i7-1260P, Intel Arc A350M
140.1 (127min) fps -1%
Gemiddeld Intel Arc 8-Core iGPU
  (92 - 160, n=25)
137.9 fps -3%
Samsung Galaxy Book4 Pro 360
Intel Core Ultra 5 125H, Intel Arc 7-Core iGPU
136 fps -4%
Lenovo ThinkPad T16 G2 21K70035GE
AMD Ryzen 7 7840U, AMD Radeon 780M
129.5 (108min) fps -8%
HP Envy x360 2-in-1 16-ad0097nr
AMD Ryzen 7 8840HS, AMD Radeon 780M
129.2 (115min) fps -9%
Acer Swift X SFX16-52G-52VE
Intel Core i5-1240P, Intel Arc A370M
121 fps -14%
Acer Swift Edge SFE16-42-R1GM
AMD Ryzen 7 7735U, AMD Radeon 680M
104.3 fps -26%
Samsung Galaxy Book3 Pro 16
Intel Core i5-1340P, Intel Iris Xe Graphics G7 80EUs
89.1 (70min) fps -37%
Lenovo Yoga 7 2-in-1 16IML9
Intel Core Ultra 5 125U, Intel Graphics 4-Core iGPU (Arc)
86.8 (78min) fps -39%
HP Spectre x360 2-in-1 16-f1075ng
Intel Core i7-12700H, Intel Iris Xe Graphics G7 96EUs
82.4 (24.1min, 37.8P0.1, 50.3P1) fps -42%
Dell Inspiron 16 7635 2-in-1
AMD Ryzen 5 7530U, AMD Radeon RX Vega 7
79.6 (70min) fps -44%
Lenovo IdeaPad Flex 5 16ABR G8
AMD Ryzen 7 7730U, AMD Radeon RX Vega 8 (Ryzen 4000/5000)
77 fps -46%
Lenovo Thinkpad X1 Fold 16
Intel Core i7-1250U, Intel Iris Xe Graphics G7 96EUs
75.3 (59min) fps -47%
Lenovo ThinkPad E16 G1 Core i5-1335U
Intel Core i5-1335U, Intel Iris Xe Graphics G7 80EUs
73.6 (57min) fps -48%
1366x768 Medium Graphics & Postprocessing
Dell Inspiron 16 Plus 7640
Intel Core Ultra 7 155H, NVIDIA GeForce RTX 4060 Laptop GPU
276.8 (262min) fps +241%
HP Spectre x360 16 RTX 4050
Intel Core Ultra 7 155H, NVIDIA GeForce RTX 4050 Laptop GPU
209.6 (183min) fps +158%
Acer Swift X SFX16-52G-52VE
Intel Core i5-1240P, Intel Arc A370M
87 fps +7%
Samsung Galaxy Book4 Pro 360
Intel Core Ultra 5 125H, Intel Arc 7-Core iGPU
85 fps +5%
Gemiddeld Intel Arc 8-Core iGPU
  (59 - 100, n=23)
84.8 fps +4%
Asus ExpertBook B5 Flip B5602FBN
Intel Core i7-1260P, Intel Arc A350M
83.6 (77min) fps +3%
Lenovo ThinkPad T16 G2 21K70035GE
AMD Ryzen 7 7840U, AMD Radeon 780M
83.2 (71min) fps +2%
Dell Inspiron 16 7640 2-in-1
Intel Core Ultra 7 155H, Intel Arc 8-Core iGPU
81.2 (77min) fps
Samsung Galaxy Book3 Pro 16
Intel Core i5-1340P, Intel Iris Xe Graphics G7 80EUs
56.9 (50min) fps -30%
HP Spectre x360 2-in-1 16-f1075ng
Intel Core i7-12700H, Intel Iris Xe Graphics G7 96EUs
52.7 (21.9min, 22.9P0.1, 28.6P1) fps -35%
Lenovo Yoga 7 2-in-1 16IML9
Intel Core Ultra 5 125U, Intel Graphics 4-Core iGPU (Arc)
49.6 (40min) fps -39%
Lenovo Thinkpad X1 Fold 16
Intel Core i7-1250U, Intel Iris Xe Graphics G7 96EUs
47.7 (44min) fps -41%
Lenovo ThinkPad E16 G1 Core i5-1335U
Intel Core i5-1335U, Intel Iris Xe Graphics G7 80EUs
45.1 (40min) fps -44%
LG Gram 2in1 16 16T90R - G.AA78G
Intel Core i7-1360P, Intel Iris Xe Graphics G7 96EUs
37.2 (10min) fps -54%
1920x1080 High Graphics & Postprocessing (Nvidia HairWorks Off)
Dell Inspiron 16 Plus 7640
Intel Core Ultra 7 155H, NVIDIA GeForce RTX 4060 Laptop GPU
160.3 (154min) fps +260%
HP Spectre x360 16 RTX 4050
Intel Core Ultra 7 155H, NVIDIA GeForce RTX 4050 Laptop GPU
120.1 (108min) fps +170%
Samsung Galaxy Book4 Pro 360
Intel Core Ultra 5 125H, Intel Arc 7-Core iGPU
51 fps +15%
Gemiddeld Intel Arc 8-Core iGPU
  (36 - 58, n=25)
48.3 fps +9%
HP Envy x360 2-in-1 16-ad0097nr
AMD Ryzen 7 8840HS, AMD Radeon 780M
47.6 (33min) fps +7%
Acer Swift X SFX16-52G-52VE
Intel Core i5-1240P, Intel Arc A370M
45 fps +1%
Asus ExpertBook B5 Flip B5602FBN
Intel Core i7-1260P, Intel Arc A350M
45 (39min) fps +1%
Dell Inspiron 16 7640 2-in-1
Intel Core Ultra 7 155H, Intel Arc 8-Core iGPU
44.5 (41min) fps
Lenovo ThinkPad T16 G2 21K70035GE
AMD Ryzen 7 7840U, AMD Radeon 780M
42 (34min) fps -6%
Acer Swift Edge SFE16-42-R1GM
AMD Ryzen 7 7735U, AMD Radeon 680M
32.7 fps -27%
Samsung Galaxy Book3 Pro 16
Intel Core i5-1340P, Intel Iris Xe Graphics G7 80EUs
30.5 (26min) fps -31%
Lenovo Yoga 7 2-in-1 16IML9
Intel Core Ultra 5 125U, Intel Graphics 4-Core iGPU (Arc)
28.4 (25min) fps -36%
Lenovo Thinkpad X1 Fold 16
Intel Core i7-1250U, Intel Iris Xe Graphics G7 96EUs
25.8 (23min) fps -42%
HP Spectre x360 2-in-1 16-f1075ng
Intel Core i7-12700H, Intel Iris Xe Graphics G7 96EUs
25.6 (12.6min, 13.1P0.1, 15.9P1) fps -42%
Dell Inspiron 16 7635 2-in-1
AMD Ryzen 5 7530U, AMD Radeon RX Vega 7
24.5 (22min) fps -45%
Lenovo IdeaPad Flex 5 16ABR G8
AMD Ryzen 7 7730U, AMD Radeon RX Vega 8 (Ryzen 4000/5000)
24 fps -46%
Lenovo ThinkPad E16 G1 Core i5-1335U
Intel Core i5-1335U, Intel Iris Xe Graphics G7 80EUs
22.1 (19min) fps -50%
1920x1080 Ultra Graphics & Postprocessing (HBAO+)
Dell Inspiron 16 Plus 7640
Intel Core Ultra 7 155H, NVIDIA GeForce RTX 4060 Laptop GPU
84.1 (80min) fps +252%
HP Spectre x360 16 RTX 4050
Intel Core Ultra 7 155H, NVIDIA GeForce RTX 4050 Laptop GPU
62.7 (57min) fps +162%
HP Envy x360 2-in-1 16-ad0097nr
AMD Ryzen 7 8840HS, AMD Radeon 780M
28.8 (24min) fps +21%
Acer Swift X SFX16-52G-52VE
Intel Core i5-1240P, Intel Arc A370M
25 fps +5%
Lenovo ThinkPad T16 G2 21K70035GE
AMD Ryzen 7 7840U, AMD Radeon 780M
24.9 (20min) fps +4%
Dell Inspiron 16 7640 2-in-1
Intel Core Ultra 7 155H, Intel Arc 8-Core iGPU
23.9 (23min) fps
Gemiddeld Intel Arc 8-Core iGPU
  (14.5 - 43.1, n=31)
23.7 fps -1%
Asus ExpertBook B5 Flip B5602FBN
Intel Core i7-1260P, Intel Arc A350M
20.5 (18min) fps -14%
Acer Swift Edge SFE16-42-R1GM
AMD Ryzen 7 7735U, AMD Radeon 680M
20.3 fps -15%
Samsung Galaxy Book4 Pro 360
Intel Core Ultra 5 125H, Intel Arc 7-Core iGPU
18.3 (9min, 12P1) fps -23%
Dell Inspiron 16 7635 2-in-1
AMD Ryzen 5 7530U, AMD Radeon RX Vega 7
15.7 (14min) fps -34%
Lenovo Yoga 7 2-in-1 16IML9
Intel Core Ultra 5 125U, Intel Graphics 4-Core iGPU (Arc)
15 (11min) fps -37%
Lenovo IdeaPad Flex 5 16ABR G8
AMD Ryzen 7 7730U, AMD Radeon RX Vega 8 (Ryzen 4000/5000)
14.7 (12min, 14P1) fps -38%
Samsung Galaxy Book3 Pro 16
Intel Core i5-1340P, Intel Iris Xe Graphics G7 80EUs
14.4 (12min) fps -40%
LG Gram 2in1 16 16T90R - G.AA78G
Intel Core i7-1360P, Intel Iris Xe Graphics G7 96EUs
13.9 (13min, 13P1) fps -42%
HP Spectre x360 2-in-1 16-f1075ng
Intel Core i7-12700H, Intel Iris Xe Graphics G7 96EUs
12.8 (4.76min, 5.9P0.1, 7.32P1) fps -46%
Lenovo Thinkpad X1 Fold 16
Intel Core i7-1250U, Intel Iris Xe Graphics G7 96EUs
11.6 (10min) fps -51%
Lenovo ThinkPad E16 G1 Core i5-1335U
Intel Core i5-1335U, Intel Iris Xe Graphics G7 80EUs
11.1 (10min) fps -54%
Final Fantasy XV Benchmark
1280x720 Lite Quality
Dell Inspiron 16 Plus 7640
Intel Core Ultra 7 155H, NVIDIA GeForce RTX 4060 Laptop GPU
137.6 fps +112%
HP Spectre x360 16 RTX 4050
Intel Core Ultra 7 155H, NVIDIA GeForce RTX 4050 Laptop GPU
132.7 fps +104%
Lenovo ThinkPad T16 G2 21K70035GE
AMD Ryzen 7 7840U, AMD Radeon 780M
70.4 fps +8%
Acer Swift X SFX16-52G-52VE
Intel Core i5-1240P, Intel Arc A370M
66.9 fps +3%
Dell Inspiron 16 7640 2-in-1
Intel Core Ultra 7 155H, Intel Arc 8-Core iGPU
65 fps
Asus ExpertBook B5 Flip B5602FBN
Intel Core i7-1260P, Intel Arc A350M
64.8 fps 0%
HP Envy x360 2-in-1 16-ad0097nr
AMD Ryzen 7 8840HS, AMD Radeon 780M
64.5 fps -1%
Gemiddeld Intel Arc 8-Core iGPU
  (35.6 - 85.9, n=39)
63.1 fps -3%
Acer Swift Edge SFE16-42-R1GM
AMD Ryzen 7 7735U, AMD Radeon 680M
57.9 fps -11%
Samsung Galaxy Book4 Pro 360
Intel Core Ultra 5 125H, Intel Arc 7-Core iGPU
52.1 fps -20%
LG Gram 2in1 16 16T90R - G.AA78G
Intel Core i7-1360P, Intel Iris Xe Graphics G7 96EUs
46.8 fps -28%
HP Spectre x360 2-in-1 16-f1075ng
Intel Core i7-12700H, Intel Iris Xe Graphics G7 96EUs
38.5 fps -41%
Samsung Galaxy Book3 Pro 16
Intel Core i5-1340P, Intel Iris Xe Graphics G7 80EUs
38.1 fps -41%
Lenovo Yoga 7 2-in-1 16IML9
Intel Core Ultra 5 125U, Intel Graphics 4-Core iGPU (Arc)
37.6 fps -42%
Dell Inspiron 16 7635 2-in-1
AMD Ryzen 5 7530U, AMD Radeon RX Vega 7
37.5 fps -42%
Lenovo Thinkpad X1 Fold 16
Intel Core i7-1250U, Intel Iris Xe Graphics G7 96EUs
33.2 fps -49%
Lenovo ThinkPad E16 G1 Core i5-1335U
Intel Core i5-1335U, Intel Iris Xe Graphics G7 80EUs
31 fps -52%
1920x1080 Standard Quality
Dell Inspiron 16 Plus 7640
Intel Core Ultra 7 155H, NVIDIA GeForce RTX 4060 Laptop GPU
98.4 fps +170%
HP Spectre x360 16 RTX 4050
Intel Core Ultra 7 155H, NVIDIA GeForce RTX 4050 Laptop GPU
94.5 fps +159%
Gemiddeld Intel Arc 8-Core iGPU
  (28 - 45.9, n=41)
36.6 fps 0%
Dell Inspiron 16 7640 2-in-1
Intel Core Ultra 7 155H, Intel Arc 8-Core iGPU
36.5 fps
Acer Swift X SFX16-52G-52VE
Intel Core i5-1240P, Intel Arc A370M
34.4 fps -6%
HP Envy x360 2-in-1 16-ad0097nr
AMD Ryzen 7 8840HS, AMD Radeon 780M
34.1 fps -7%
Lenovo ThinkPad T16 G2 21K70035GE
AMD Ryzen 7 7840U, AMD Radeon 780M
33.6 fps -8%
Asus ExpertBook B5 Flip B5602FBN
Intel Core i7-1260P, Intel Arc A350M
33.2 fps -9%
Samsung Galaxy Book4 Pro 360
Intel Core Ultra 5 125H, Intel Arc 7-Core iGPU
32.4 fps -11%
Acer Swift Edge SFE16-42-R1GM
AMD Ryzen 7 7735U, AMD Radeon 680M
26.7 fps -27%
LG Gram 2in1 16 16T90R - G.AA78G
Intel Core i7-1360P, Intel Iris Xe Graphics G7 96EUs
23.8 fps -35%
Lenovo Yoga 7 2-in-1 16IML9
Intel Core Ultra 5 125U, Intel Graphics 4-Core iGPU (Arc)
23 fps -37%
Samsung Galaxy Book3 Pro 16
Intel Core i5-1340P, Intel Iris Xe Graphics G7 80EUs
20.7 fps -43%
HP Spectre x360 2-in-1 16-f1075ng
Intel Core i7-12700H, Intel Iris Xe Graphics G7 96EUs
19.9 fps -45%
Dell Inspiron 16 7635 2-in-1
AMD Ryzen 5 7530U, AMD Radeon RX Vega 7
18.8 fps -48%
Lenovo Thinkpad X1 Fold 16
Intel Core i7-1250U, Intel Iris Xe Graphics G7 96EUs
18.5 fps -49%
Lenovo ThinkPad E16 G1 Core i5-1335U
Intel Core i5-1335U, Intel Iris Xe Graphics G7 80EUs
16.9 fps -54%
1920x1080 High Quality
Dell Inspiron 16 Plus 7640
Intel Core Ultra 7 155H, NVIDIA GeForce RTX 4060 Laptop GPU
78.8 fps +194%
HP Spectre x360 16 RTX 4050
Intel Core Ultra 7 155H, NVIDIA GeForce RTX 4050 Laptop GPU
68.6 fps +156%
Dell Inspiron 16 7640 2-in-1
Intel Core Ultra 7 155H, Intel Arc 8-Core iGPU
26.8 fps
HP Envy x360 2-in-1 16-ad0097nr
AMD Ryzen 7 8840HS, AMD Radeon 780M
25.2 fps -6%
Gemiddeld Intel Arc 8-Core iGPU
  (14.7 - 31.7, n=42)
24.8 fps -7%
Lenovo ThinkPad T16 G2 21K70035GE
AMD Ryzen 7 7840U, AMD Radeon 780M
24.5 fps -9%
Samsung Galaxy Book4 Pro 360
Intel Core Ultra 5 125H, Intel Arc 7-Core iGPU
22.2 fps -17%
Acer Swift X SFX16-52G-52VE
Intel Core i5-1240P, Intel Arc A370M
19.6 fps -27%
Acer Swift Edge SFE16-42-R1GM
AMD Ryzen 7 7735U, AMD Radeon 680M
19.3 fps -28%
Asus ExpertBook B5 Flip B5602FBN
Intel Core i7-1260P, Intel Arc A350M
18.2 fps -32%
LG Gram 2in1 16 16T90R - G.AA78G
Intel Core i7-1360P, Intel Iris Xe Graphics G7 96EUs
17.2 fps -36%
Lenovo Yoga 7 2-in-1 16IML9
Intel Core Ultra 5 125U, Intel Graphics 4-Core iGPU (Arc)
16.3 fps -39%
Lenovo Thinkpad X1 Fold 16
Intel Core i7-1250U, Intel Iris Xe Graphics G7 96EUs
15.7 fps -41%
HP Spectre x360 2-in-1 16-f1075ng
Intel Core i7-12700H, Intel Iris Xe Graphics G7 96EUs
14.6 fps -46%
Samsung Galaxy Book3 Pro 16
Intel Core i5-1340P, Intel Iris Xe Graphics G7 80EUs
13.3 fps -50%
Dell Inspiron 16 7635 2-in-1
AMD Ryzen 5 7530U, AMD Radeon RX Vega 7
12.9 fps -52%
Lenovo ThinkPad E16 G1 Core i5-1335U
Intel Core i5-1335U, Intel Iris Xe Graphics G7 80EUs
12.1 fps -55%
F1 22
1280x720 Ultra Low Preset AA:T AF:16x
Dell Inspiron 16 Plus 7640
Intel Core Ultra 7 155H, NVIDIA GeForce RTX 4060 Laptop GPU
231 (141min, 120P1) fps +92%
HP Spectre x360 16 RTX 4050
Intel Core Ultra 7 155H, NVIDIA GeForce RTX 4050 Laptop GPU
175.1 (117min, 95P1) fps +46%
HP Envy x360 2-in-1 16-ad0097nr
AMD Ryzen 7 8840HS, AMD Radeon 780M
126.9 (104min, 83P1) fps +6%
Dell Inspiron 16 7640 2-in-1
Intel Core Ultra 7 155H, Intel Arc 8-Core iGPU
120.1 (100min, 88P1) fps
Asus ExpertBook B5 Flip B5602FBN
Intel Core i7-1260P, Intel Arc A350M
118.4 fps -1%
Gemiddeld Intel Arc 8-Core iGPU
  (86.6 - 136, n=14)
114 fps -5%
Acer Swift Edge SFE16-42-R1GM
AMD Ryzen 7 7735U, AMD Radeon 680M
113.1 (93min, 74P1) fps -6%
HP Spectre x360 2-in-1 16-f1075ng
Intel Core i7-12700H, Intel Iris Xe Graphics G7 96EUs
69.9 (57min, 54P1) fps -42%
Dell Inspiron 16 7635 2-in-1
AMD Ryzen 5 7530U, AMD Radeon RX Vega 7
69.2 (56min, 56P1) fps -42%
Lenovo Yoga 7 2-in-1 16IML9
Intel Core Ultra 5 125U, Intel Graphics 4-Core iGPU (Arc)
63.9 (54min, 53P1) fps -47%
Lenovo Thinkpad X1 Fold 16
Intel Core i7-1250U, Intel Iris Xe Graphics G7 96EUs
59.4 (49min, 47P1) fps -51%
Lenovo ThinkPad E16 G1 Core i5-1335U
Intel Core i5-1335U, Intel Iris Xe Graphics G7 80EUs
56.6 (45min, 44P1) fps -53%
1920x1080 Low Preset AA:T AF:16x
Dell Inspiron 16 Plus 7640
Intel Core Ultra 7 155H, NVIDIA GeForce RTX 4060 Laptop GPU
197 (138min, 114P1) fps +186%
HP Spectre x360 16 RTX 4050
Intel Core Ultra 7 155H, NVIDIA GeForce RTX 4050 Laptop GPU
159.4 (117min, 92P1) fps +132%
Acer Swift X SFX16-52G-52VE
Intel Core i5-1240P, Intel Arc A370M
127.2 (99min, 92P1) fps +85%
Gemiddeld Intel Arc 8-Core iGPU
  (56.2 - 96.1, n=18)
74.1 fps +8%
HP Envy x360 2-in-1 16-ad0097nr
AMD Ryzen 7 8840HS, AMD Radeon 780M
70.2 (59min, 50P1) fps +2%
Dell Inspiron 16 7640 2-in-1
Intel Core Ultra 7 155H, Intel Arc 8-Core iGPU
68.8 (51min, 53P1) fps
Acer Swift Edge SFE16-42-R1GM
AMD Ryzen 7 7735U, AMD Radeon 680M
66.7 (48min, 39P1) fps -3%
Asus ExpertBook B5 Flip B5602FBN
Intel Core i7-1260P, Intel Arc A350M
52.1 (45min, 39P1) fps -24%
Lenovo Yoga 7 2-in-1 16IML9
Intel Core Ultra 5 125U, Intel Graphics 4-Core iGPU (Arc)
41.7 (34min, 33P1) fps -39%
HP Spectre x360 2-in-1 16-f1075ng
Intel Core i7-12700H, Intel Iris Xe Graphics G7 96EUs
40.4 (35min, 32P1) fps -41%
Lenovo IdeaPad Flex 5 16ABR G8
AMD Ryzen 7 7730U, AMD Radeon RX Vega 8 (Ryzen 4000/5000)
39.4 (33min, 32P1) fps -43%
Dell Inspiron 16 7635 2-in-1
AMD Ryzen 5 7530U, AMD Radeon RX Vega 7
36.2 (28min, 28P1) fps -47%
Lenovo Thinkpad X1 Fold 16
Intel Core i7-1250U, Intel Iris Xe Graphics G7 96EUs
34.8 (27min, 27P1) fps -49%
Lenovo ThinkPad E16 G1 Core i5-1335U
Intel Core i5-1335U, Intel Iris Xe Graphics G7 80EUs
32.8 (27min, 27P1) fps -52%
1920x1080 Medium Preset AA:T AF:16x
Dell Inspiron 16 Plus 7640
Intel Core Ultra 7 155H, NVIDIA GeForce RTX 4060 Laptop GPU
184.3 (102min, 90P1) fps +181%
HP Spectre x360 16 RTX 4050
Intel Core Ultra 7 155H, NVIDIA GeForce RTX 4050 Laptop GPU
146.6 (46min, 79P1) fps +123%
Gemiddeld Intel Arc 8-Core iGPU
  (49.6 - 87, n=18)
67.1 fps +2%
Dell Inspiron 16 7640 2-in-1
Intel Core Ultra 7 155H, Intel Arc 8-Core iGPU
65.6 (54min, 52P1) fps
HP Envy x360 2-in-1 16-ad0097nr
AMD Ryzen 7 8840HS, AMD Radeon 780M
60 (49min, 41P1) fps -9%
Acer Swift Edge SFE16-42-R1GM
AMD Ryzen 7 7735U, AMD Radeon 680M
55.4 (37min, 33P1) fps -16%
Asus ExpertBook B5 Flip B5602FBN
Intel Core i7-1260P, Intel Arc A350M
51.4 (40min, 36P1) fps -22%
Acer Swift X SFX16-52G-52VE
Intel Core i5-1240P, Intel Arc A370M
49.5 (41min, 38P1) fps -25%
Lenovo Yoga 7 2-in-1 16IML9
Intel Core Ultra 5 125U, Intel Graphics 4-Core iGPU (Arc)
39.7 (33min, 32P1) fps -39%
HP Spectre x360 2-in-1 16-f1075ng
Intel Core i7-12700H, Intel Iris Xe Graphics G7 96EUs
37.2 (32min, 29P1) fps -43%
Lenovo IdeaPad Flex 5 16ABR G8
AMD Ryzen 7 7730U, AMD Radeon RX Vega 8 (Ryzen 4000/5000)
34.8 (29min, 27P1) fps -47%
Dell Inspiron 16 7635 2-in-1
AMD Ryzen 5 7530U, AMD Radeon RX Vega 7
32.3 (28min, 26P1) fps -51%
Lenovo ThinkPad E16 G1 Core i5-1335U
Intel Core i5-1335U, Intel Iris Xe Graphics G7 80EUs
29.1 (24min, 24P1) fps -56%
Lenovo Thinkpad X1 Fold 16
Intel Core i7-1250U, Intel Iris Xe Graphics G7 96EUs
28 (19min, 20P1) fps -57%
X-Plane 11.11
1280x720 low (fps_test=1)
Dell Inspiron 16 Plus 7640
Intel Core Ultra 7 155H, NVIDIA GeForce RTX 4060 Laptop GPU
123.7 fps +144%
HP Spectre x360 16 RTX 4050
Intel Core Ultra 7 155H, NVIDIA GeForce RTX 4050 Laptop GPU
100.6 fps +98%
LG Gram 2in1 16 16T90R - G.AA78G
Intel Core i7-1360P, Intel Iris Xe Graphics G7 96EUs
58.46 fps +15%
HP Spectre x360 2-in-1 16-f1075ng
Intel Core i7-12700H, Intel Iris Xe Graphics G7 96EUs
54.9 fps +8%
Gemiddeld Intel Arc 8-Core iGPU
  (46.1 - 66.6, n=43)
54.1 fps +6%
Dell Inspiron 16 7640 2-in-1
Intel Core Ultra 7 155H, Intel Arc 8-Core iGPU
50.8 fps
Acer Swift Edge SFE16-42-R1GM
AMD Ryzen 7 7735U, AMD Radeon 680M
48.2 fps -5%
HP Envy x360 2-in-1 16-ad0097nr
AMD Ryzen 7 8840HS, AMD Radeon 780M
47.8 fps -6%
Samsung Galaxy Book4 Pro 360
Intel Core Ultra 5 125H, Intel Arc 7-Core iGPU
47.5 fps -6%
Asus ExpertBook B5 Flip B5602FBN
Intel Core i7-1260P, Intel Arc A350M
43.9 fps -14%
Lenovo ThinkPad T16 G2 21K70035GE
AMD Ryzen 7 7840U, AMD Radeon 780M
43.2 fps -15%
Lenovo Thinkpad X1 Fold 16
Intel Core i7-1250U, Intel Iris Xe Graphics G7 96EUs
40.7 fps -20%
Samsung Galaxy Book3 Pro 16
Intel Core i5-1340P, Intel Iris Xe Graphics G7 80EUs
39.2 fps -23%
Lenovo IdeaPad Flex 5 16ABR G8
AMD Ryzen 7 7730U, AMD Radeon RX Vega 8 (Ryzen 4000/5000)
38.9 fps -23%
Dell Inspiron 16 7635 2-in-1
AMD Ryzen 5 7530U, AMD Radeon RX Vega 7
38.4 fps -24%
Acer Swift X SFX16-52G-52VE
Intel Core i5-1240P, Intel Arc A370M
36.9 fps -27%
Lenovo Yoga 7 2-in-1 16IML9
Intel Core Ultra 5 125U, Intel Graphics 4-Core iGPU (Arc)
36.5 fps -28%
Lenovo ThinkPad E16 G1 Core i5-1335U
Intel Core i5-1335U, Intel Iris Xe Graphics G7 80EUs
28.6 fps -44%
1920x1080 med (fps_test=2)
Dell Inspiron 16 Plus 7640
Intel Core Ultra 7 155H, NVIDIA GeForce RTX 4060 Laptop GPU
109 fps +167%
HP Spectre x360 16 RTX 4050
Intel Core Ultra 7 155H, NVIDIA GeForce RTX 4050 Laptop GPU
86.7 fps +113%
HP Spectre x360 2-in-1 16-f1075ng
Intel Core i7-12700H, Intel Iris Xe Graphics G7 96EUs
44.4 fps +9%
LG Gram 2in1 16 16T90R - G.AA78G
Intel Core i7-1360P, Intel Iris Xe Graphics G7 96EUs
43.46 fps +7%
Gemiddeld Intel Arc 8-Core iGPU
  (31.1 - 52.1, n=44)
41.8 fps +2%
Dell Inspiron 16 7640 2-in-1
Intel Core Ultra 7 155H, Intel Arc 8-Core iGPU
40.8 fps
Acer Swift Edge SFE16-42-R1GM
AMD Ryzen 7 7735U, AMD Radeon 680M
36.6 fps -10%
Samsung Galaxy Book4 Pro 360
Intel Core Ultra 5 125H, Intel Arc 7-Core iGPU
35.9 fps -12%
HP Envy x360 2-in-1 16-ad0097nr
AMD Ryzen 7 8840HS, AMD Radeon 780M
33.9 fps -17%
Lenovo IdeaPad Flex 5 16ABR G8
AMD Ryzen 7 7730U, AMD Radeon RX Vega 8 (Ryzen 4000/5000)
32.3 fps -21%
Asus ExpertBook B5 Flip B5602FBN
Intel Core i7-1260P, Intel Arc A350M
32.2 fps -21%
Lenovo ThinkPad T16 G2 21K70035GE
AMD Ryzen 7 7840U, AMD Radeon 780M
32.1 fps -21%
Lenovo Thinkpad X1 Fold 16
Intel Core i7-1250U, Intel Iris Xe Graphics G7 96EUs
32 fps -22%
Samsung Galaxy Book3 Pro 16
Intel Core i5-1340P, Intel Iris Xe Graphics G7 80EUs
30.8 fps -25%
Dell Inspiron 16 7635 2-in-1
AMD Ryzen 5 7530U, AMD Radeon RX Vega 7
30.4 fps -25%
Lenovo Yoga 7 2-in-1 16IML9
Intel Core Ultra 5 125U, Intel Graphics 4-Core iGPU (Arc)
28 fps -31%
Acer Swift X SFX16-52G-52VE
Intel Core i5-1240P, Intel Arc A370M
27.4 fps -33%
Lenovo ThinkPad E16 G1 Core i5-1335U
Intel Core i5-1335U, Intel Iris Xe Graphics G7 80EUs
22.5 fps -45%
1920x1080 high (fps_test=3)
Dell Inspiron 16 Plus 7640
Intel Core Ultra 7 155H, NVIDIA GeForce RTX 4060 Laptop GPU
86.5 fps +116%
HP Spectre x360 16 RTX 4050
Intel Core Ultra 7 155H, NVIDIA GeForce RTX 4050 Laptop GPU
69.7 fps +74%
HP Spectre x360 2-in-1 16-f1075ng
Intel Core i7-12700H, Intel Iris Xe Graphics G7 96EUs
40.1 fps 0%
Dell Inspiron 16 7640 2-in-1
Intel Core Ultra 7 155H, Intel Arc 8-Core iGPU
40.1 fps
LG Gram 2in1 16 16T90R - G.AA78G
Intel Core i7-1360P, Intel Iris Xe Graphics G7 96EUs
37.95 fps -5%
Gemiddeld Intel Arc 8-Core iGPU
  (27.9 - 43.9, n=43)
35 fps -13%
Samsung Galaxy Book4 Pro 360
Intel Core Ultra 5 125H, Intel Arc 7-Core iGPU
31.5 fps -21%
Acer Swift Edge SFE16-42-R1GM
AMD Ryzen 7 7735U, AMD Radeon 680M
30.2 fps -25%
Lenovo Thinkpad X1 Fold 16
Intel Core i7-1250U, Intel Iris Xe Graphics G7 96EUs
28.8 fps -28%
Asus ExpertBook B5 Flip B5602FBN
Intel Core i7-1260P, Intel Arc A350M
27.9 fps -30%
HP Envy x360 2-in-1 16-ad0097nr
AMD Ryzen 7 8840HS, AMD Radeon 780M
27.9 fps -30%
Lenovo IdeaPad Flex 5 16ABR G8
AMD Ryzen 7 7730U, AMD Radeon RX Vega 8 (Ryzen 4000/5000)
27.7 fps -31%
Lenovo ThinkPad T16 G2 21K70035GE
AMD Ryzen 7 7840U, AMD Radeon 780M
26.6 fps -34%
Dell Inspiron 16 7635 2-in-1
AMD Ryzen 5 7530U, AMD Radeon RX Vega 7
26.3 fps -34%
Samsung Galaxy Book3 Pro 16
Intel Core i5-1340P, Intel Iris Xe Graphics G7 80EUs
25.1 fps -37%
Acer Swift X SFX16-52G-52VE
Intel Core i5-1240P, Intel Arc A370M
23.9 fps -40%
Lenovo Yoga 7 2-in-1 16IML9
Intel Core Ultra 5 125U, Intel Graphics 4-Core iGPU (Arc)
23.4 fps -42%
Lenovo ThinkPad E16 G1 Core i5-1335U
Intel Core i5-1335U, Intel Iris Xe Graphics G7 80EUs
21 fps -48%
Dota 2 Reborn
1280x720 min (0/3) fastest
Dell Inspiron 16 Plus 7640
Intel Core Ultra 7 155H, NVIDIA GeForce RTX 4060 Laptop GPU
173.5 (150.9min) fps +71%
HP Spectre x360 16 RTX 4050
Intel Core Ultra 7 155H, NVIDIA GeForce RTX 4050 Laptop GPU
142 (123.9min) fps +40%
LG Gram 2in1 16 16T90R - G.AA78G
Intel Core i7-1360P, Intel Iris Xe Graphics G7 96EUs
124 (95.9min) fps +22%
HP Envy x360 2-in-1 16-ad0097nr
AMD Ryzen 7 8840HS, AMD Radeon 780M
123.7 (106.8min) fps +22%
HP Spectre x360 2-in-1 16-f1075ng
Intel Core i7-12700H, Intel Iris Xe Graphics G7 96EUs
116.4 (98min) fps +15%
Lenovo ThinkPad T16 G2 21K70035GE
AMD Ryzen 7 7840U, AMD Radeon 780M
115.1 (100.4min) fps +13%
Acer Swift Edge SFE16-42-R1GM
AMD Ryzen 7 7735U, AMD Radeon 680M
112.9 (93.4min) fps +11%
Lenovo IdeaPad Flex 5 16ABR G8
AMD Ryzen 7 7730U, AMD Radeon RX Vega 8 (Ryzen 4000/5000)
109.6 (94.8min) fps +8%
Dell Inspiron 16 7635 2-in-1
AMD Ryzen 5 7530U, AMD Radeon RX Vega 7
109 (92.7min) fps +7%
Asus ExpertBook B5 Flip B5602FBN
Intel Core i7-1260P, Intel Arc A350M
102.1 (74.1min) fps +1%
Lenovo Yoga 7 2-in-1 16IML9
Intel Core Ultra 5 125U, Intel Graphics 4-Core iGPU (Arc)
101.9 (62min) fps 0%
Dell Inspiron 16 7640 2-in-1
Intel Core Ultra 7 155H, Intel Arc 8-Core iGPU
101.5 (58.8min) fps
Gemiddeld Intel Arc 8-Core iGPU
  (78.3 - 110.5, n=42)
101 fps 0%
Lenovo ThinkPad E16 G1 Core i5-1335U
Intel Core i5-1335U, Intel Iris Xe Graphics G7 80EUs
100.7 (80.4min) fps -1%
Samsung Galaxy Book3 Pro 16
Intel Core i5-1340P, Intel Iris Xe Graphics G7 80EUs
100.3 (72.8min) fps -1%
Samsung Galaxy Book4 Pro 360
Intel Core Ultra 5 125H, Intel Arc 7-Core iGPU
94.3 (63.9min) fps -7%
Lenovo Thinkpad X1 Fold 16
Intel Core i7-1250U, Intel Iris Xe Graphics G7 96EUs
89.8 (69.2min) fps -12%
Acer Swift X SFX16-52G-52VE
Intel Core i5-1240P, Intel Arc A370M
82.6 (55.3min) fps -19%
1366x768 med (1/3)
Dell Inspiron 16 Plus 7640
Intel Core Ultra 7 155H, NVIDIA GeForce RTX 4060 Laptop GPU
152.1 (133.4min) fps +63%
HP Spectre x360 16 RTX 4050
Intel Core Ultra 7 155H, NVIDIA GeForce RTX 4050 Laptop GPU
124.2 (106.7min) fps +33%
HP Envy x360 2-in-1 16-ad0097nr
AMD Ryzen 7 8840HS, AMD Radeon 780M
103.7 (87.1min) fps +11%
Acer Swift Edge SFE16-42-R1GM
AMD Ryzen 7 7735U, AMD Radeon 680M
97.2 (84.3min) fps +4%
Dell Inspiron 16 7640 2-in-1
Intel Core Ultra 7 155H, Intel Arc 8-Core iGPU
93.3 (53.6min) fps
Lenovo ThinkPad T16 G2 21K70035GE
AMD Ryzen 7 7840U, AMD Radeon 780M
92.7 (80.4min) fps -1%
Lenovo IdeaPad Flex 5 16ABR G8
AMD Ryzen 7 7730U, AMD Radeon RX Vega 8 (Ryzen 4000/5000)
92.6 (75.3min) fps -1%
Dell Inspiron 16 7635 2-in-1
AMD Ryzen 5 7530U, AMD Radeon RX Vega 7
90.7 (73.5min) fps -3%
Samsung Galaxy Book4 Pro 360
Intel Core Ultra 5 125H, Intel Arc 7-Core iGPU
89.2 (52.5min) fps -4%
LG Gram 2in1 16 16T90R - G.AA78G
Intel Core i7-1360P, Intel Iris Xe Graphics G7 96EUs
89.1 (65.8min) fps -5%
Asus ExpertBook B5 Flip B5602FBN
Intel Core i7-1260P, Intel Arc A350M
85.8 (64.6min) fps -8%
HP Spectre x360 2-in-1 16-f1075ng
Intel Core i7-12700H, Intel Iris Xe Graphics G7 96EUs
83.7 (68.2min) fps -10%
Gemiddeld Intel Arc 8-Core iGPU
  (36.2 - 99.9, n=42)
83.7 fps -10%
Samsung Galaxy Book3 Pro 16
Intel Core i5-1340P, Intel Iris Xe Graphics G7 80EUs
81.5 (62.3min) fps -13%
Lenovo ThinkPad E16 G1 Core i5-1335U
Intel Core i5-1335U, Intel Iris Xe Graphics G7 80EUs
75.2 (61.2min) fps -19%
Acer Swift X SFX16-52G-52VE
Intel Core i5-1240P, Intel Arc A370M
69.2 (50.3min) fps -26%
Lenovo Thinkpad X1 Fold 16
Intel Core i7-1250U, Intel Iris Xe Graphics G7 96EUs
69 (52.3min) fps -26%
Lenovo Yoga 7 2-in-1 16IML9
Intel Core Ultra 5 125U, Intel Graphics 4-Core iGPU (Arc)
60.7 (38.1min) fps -35%
1920x1080 high (2/3)
Dell Inspiron 16 Plus 7640
Intel Core Ultra 7 155H, NVIDIA GeForce RTX 4060 Laptop GPU
143.2 (112.1min) fps +84%
HP Spectre x360 16 RTX 4050
Intel Core Ultra 7 155H, NVIDIA GeForce RTX 4050 Laptop GPU
119.6 (101.8min) fps +54%
Dell Inspiron 16 7640 2-in-1
Intel Core Ultra 7 155H, Intel Arc 8-Core iGPU
77.8 (54.2min) fps
Lenovo ThinkPad T16 G2 21K70035GE
AMD Ryzen 7 7840U, AMD Radeon 780M
76.2 (67.6min) fps -2%
HP Envy x360 2-in-1 16-ad0097nr
AMD Ryzen 7 8840HS, AMD Radeon 780M
73 (61.3min) fps -6%
LG Gram 2in1 16 16T90R - G.AA78G
Intel Core i7-1360P, Intel Iris Xe Graphics G7 96EUs
71.2 (58.9min) fps -8%
Gemiddeld Intel Arc 8-Core iGPU
  (35.9 - 87.8, n=42)
70.8 fps -9%
Acer Swift Edge SFE16-42-R1GM
AMD Ryzen 7 7735U, AMD Radeon 680M
69.7 (60min) fps -10%
Samsung Galaxy Book4 Pro 360
Intel Core Ultra 5 125H, Intel Arc 7-Core iGPU
66.3 (48min) fps -15%
Acer Swift X SFX16-52G-52VE
Intel Core i5-1240P, Intel Arc A370M
62.2 (45.3min) fps -20%
Lenovo Yoga 7 2-in-1 16IML9
Intel Core Ultra 5 125U, Intel Graphics 4-Core iGPU (Arc)
61.1 (37.9min) fps -21%
Asus ExpertBook B5 Flip B5602FBN
Intel Core i7-1260P, Intel Arc A350M
60.6 (34min) fps -22%
Lenovo IdeaPad Flex 5 16ABR G8
AMD Ryzen 7 7730U, AMD Radeon RX Vega 8 (Ryzen 4000/5000)
56.8 (49.8min) fps -27%
Dell Inspiron 16 7635 2-in-1
AMD Ryzen 5 7530U, AMD Radeon RX Vega 7
55.4 (47.9min) fps -29%
Lenovo Thinkpad X1 Fold 16
Intel Core i7-1250U, Intel Iris Xe Graphics G7 96EUs
55.3 (45.5min) fps -29%
HP Spectre x360 2-in-1 16-f1075ng
Intel Core i7-12700H, Intel Iris Xe Graphics G7 96EUs
53 (48.5min) fps -32%
Samsung Galaxy Book3 Pro 16
Intel Core i5-1340P, Intel Iris Xe Graphics G7 80EUs
50.7 (45min) fps -35%
Lenovo ThinkPad E16 G1 Core i5-1335U
Intel Core i5-1335U, Intel Iris Xe Graphics G7 80EUs
49.2 (45.6min) fps -37%
1920x1080 ultra (3/3) best looking
Dell Inspiron 16 Plus 7640
Intel Core Ultra 7 155H, NVIDIA GeForce RTX 4060 Laptop GPU
135.1 (116.3min) fps +73%
HP Spectre x360 16 RTX 4050
Intel Core Ultra 7 155H, NVIDIA GeForce RTX 4050 Laptop GPU
106.4 (89.8min) fps +36%
Dell Inspiron 16 7640 2-in-1
Intel Core Ultra 7 155H, Intel Arc 8-Core iGPU
78 (52.7min) fps
Gemiddeld Intel Arc 8-Core iGPU
  (35.2 - 80.9, n=42)
67.1 fps -14%
Lenovo ThinkPad T16 G2 21K70035GE
AMD Ryzen 7 7840U, AMD Radeon 780M
65.8 (57.7min) fps -16%
HP Envy x360 2-in-1 16-ad0097nr
AMD Ryzen 7 8840HS, AMD Radeon 780M
65.4 (54.7min) fps -16%
LG Gram 2in1 16 16T90R - G.AA78G
Intel Core i7-1360P, Intel Iris Xe Graphics G7 96EUs
62.9 (53.2min) fps -19%
Acer Swift Edge SFE16-42-R1GM
AMD Ryzen 7 7735U, AMD Radeon 680M
61 (52.3min) fps -22%
Samsung Galaxy Book4 Pro 360
Intel Core Ultra 5 125H, Intel Arc 7-Core iGPU
58.7 (42.1min) fps -25%
Acer Swift X SFX16-52G-52VE
Intel Core i5-1240P, Intel Arc A370M
57.7 (43.4min) fps -26%
Lenovo Yoga 7 2-in-1 16IML9
Intel Core Ultra 5 125U, Intel Graphics 4-Core iGPU (Arc)
57.6 (37.5min) fps -26%
Asus ExpertBook B5 Flip B5602FBN
Intel Core i7-1260P, Intel Arc A350M
56.1 (33.4min) fps -28%
Lenovo IdeaPad Flex 5 16ABR G8
AMD Ryzen 7 7730U, AMD Radeon RX Vega 8 (Ryzen 4000/5000)
53.3 (46.9min) fps -32%
Dell Inspiron 16 7635 2-in-1
AMD Ryzen 5 7530U, AMD Radeon RX Vega 7
52.4 (46.9min) fps -33%
HP Spectre x360 2-in-1 16-f1075ng
Intel Core i7-12700H, Intel Iris Xe Graphics G7 96EUs
48.8 (44.1min) fps -37%
Lenovo ThinkPad E16 G1 Core i5-1335U
Intel Core i5-1335U, Intel Iris Xe Graphics G7 80EUs
45 (41.1min) fps -42%
Samsung Galaxy Book3 Pro 16
Intel Core i5-1340P, Intel Iris Xe Graphics G7 80EUs
44.9 (40min) fps -42%
Lenovo Thinkpad X1 Fold 16
Intel Core i7-1250U, Intel Iris Xe Graphics G7 96EUs
41.3 (32.3min) fps -47%
Strange Brigade
1280x720 lowest AF:1
Dell Inspiron 16 Plus 7640
Intel Core Ultra 7 155H, NVIDIA GeForce RTX 4060 Laptop GPU
360 (222min, 268P1) fps +147%
HP Spectre x360 16 RTX 4050
Intel Core Ultra 7 155H, NVIDIA GeForce RTX 4050 Laptop GPU
299 (47.1min, 215P1) fps +105%
Acer Swift X SFX16-52G-52VE
Intel Core i5-1240P, Intel Arc A370M
184.8 (101.3min, 113.5P1) fps +27%
Asus ExpertBook B5 Flip B5602FBN
Intel Core i7-1260P, Intel Arc A350M
163.4 (57.2min, 64.4P1) fps +12%
Gemiddeld Intel Arc 8-Core iGPU
  (121 - 208, n=37)
162.9 fps +12%
Dell Inspiron 16 7640 2-in-1
Intel Core Ultra 7 155H, Intel Arc 8-Core iGPU
145.6 (11.6min, 70.2P1) fps
Lenovo ThinkPad T16 G2 21K70035GE
AMD Ryzen 7 7840U, AMD Radeon 780M
140.2 (70.5min, 108.2P1) fps -4%
HP Envy x360 2-in-1 16-ad0097nr
AMD Ryzen 7 8840HS, AMD Radeon 780M
138.2 (14.6min, 108.4P1) fps -5%
Samsung Galaxy Book4 Pro 360
Intel Core Ultra 5 125H, Intel Arc 7-Core iGPU
133 fps -9%
Acer Swift Edge SFE16-42-R1GM
AMD Ryzen 7 7735U, AMD Radeon 680M
128.9 (16.6min, 102.8P1) fps -11%
Lenovo Yoga 7 2-in-1 16IML9
Intel Core Ultra 5 125U, Intel Graphics 4-Core iGPU (Arc)
120.4 (39.2min, 96.2P1) fps -17%
LG Gram 2in1 16 16T90R - G.AA78G
Intel Core i7-1360P, Intel Iris Xe Graphics G7 96EUs
97.6 (11.3min, 36.4P1) fps -33%
Lenovo IdeaPad Flex 5 16ABR G8
AMD Ryzen 7 7730U, AMD Radeon RX Vega 8 (Ryzen 4000/5000)
88.6 (62.5min, 76.7P1) fps -39%
Dell Inspiron 16 7635 2-in-1
AMD Ryzen 5 7530U, AMD Radeon RX Vega 7
86.8 (40.5min, 74P1) fps -40%
HP Spectre x360 2-in-1 16-f1075ng
Intel Core i7-12700H, Intel Iris Xe Graphics G7 96EUs
86.6 (20.5min, 30.7P1) fps -41%
Samsung Galaxy Book3 Pro 16
Intel Core i5-1340P, Intel Iris Xe Graphics G7 80EUs
81.9 (18.2min, 27.6P1) fps -44%
Lenovo ThinkPad E16 G1 Core i5-1335U
Intel Core i5-1335U, Intel Iris Xe Graphics G7 80EUs
70.3 (16.2min, 22.7P1) fps -52%
Lenovo Thinkpad X1 Fold 16
Intel Core i7-1250U, Intel Iris Xe Graphics G7 96EUs
70.2 (15.4min, 22.4P1) fps -52%
1920x1080 medium AA:medium AF:4
Dell Inspiron 16 Plus 7640
Intel Core Ultra 7 155H, NVIDIA GeForce RTX 4060 Laptop GPU
225 (62.5min, 186.2P1) fps +213%
HP Spectre x360 16 RTX 4050
Intel Core Ultra 7 155H, NVIDIA GeForce RTX 4050 Laptop GPU
171.1 (14.5min, 135.8P1) fps +138%
Acer Swift X SFX16-52G-52VE
Intel Core i5-1240P, Intel Arc A370M
76.7 (63min, 65.8P1) fps +7%
Dell Inspiron 16 7640 2-in-1
Intel Core Ultra 7 155H, Intel Arc 8-Core iGPU
71.8 (6.8min, 59.5P1) fps
Asus ExpertBook B5 Flip B5602FBN
Intel Core i7-1260P, Intel Arc A350M
71.6 (58min, 62P1) fps 0%
Gemiddeld Intel Arc 8-Core iGPU
  (51.1 - 88, n=37)
70.1 fps -2%
Samsung Galaxy Book4 Pro 360
Intel Core Ultra 5 125H, Intel Arc 7-Core iGPU
63 fps -12%
HP Envy x360 2-in-1 16-ad0097nr
AMD Ryzen 7 8840HS, AMD Radeon 780M
60.3 (10.3min, 50.5P1) fps -16%
Lenovo ThinkPad T16 G2 21K70035GE
AMD Ryzen 7 7840U, AMD Radeon 780M
59.7 (21.8min, 50.3P1) fps -17%
Acer Swift Edge SFE16-42-R1GM
AMD Ryzen 7 7735U, AMD Radeon 680M
54.3 (8.4min, 45.9P1) fps -24%
Lenovo Yoga 7 2-in-1 16IML9
Intel Core Ultra 5 125U, Intel Graphics 4-Core iGPU (Arc)
50 (24.3min, 41.3P1) fps -30%
LG Gram 2in1 16 16T90R - G.AA78G
Intel Core i7-1360P, Intel Iris Xe Graphics G7 96EUs
43.8 (9min, 24P1) fps -39%
HP Spectre x360 2-in-1 16-f1075ng
Intel Core i7-12700H, Intel Iris Xe Graphics G7 96EUs
36.1 (13.1min, 20.5P1) fps -50%
Lenovo IdeaPad Flex 5 16ABR G8
AMD Ryzen 7 7730U, AMD Radeon RX Vega 8 (Ryzen 4000/5000)
34.9 (28.5min, 30.8P1) fps -51%
Samsung Galaxy Book3 Pro 16
Intel Core i5-1340P, Intel Iris Xe Graphics G7 80EUs
34.2 (12min, 19.5P1) fps -52%
Dell Inspiron 16 7635 2-in-1
AMD Ryzen 5 7530U, AMD Radeon RX Vega 7
33.8 (22.5min, 29.6P1) fps -53%
Lenovo Thinkpad X1 Fold 16
Intel Core i7-1250U, Intel Iris Xe Graphics G7 96EUs
31.5 (8.5min, 15.9P1) fps -56%
Lenovo ThinkPad E16 G1 Core i5-1335U
Intel Core i5-1335U, Intel Iris Xe Graphics G7 80EUs
27.3 (7.9min, 12.3P1) fps -62%
1920x1080 high AA:high AF:8
Dell Inspiron 16 Plus 7640
Intel Core Ultra 7 155H, NVIDIA GeForce RTX 4060 Laptop GPU
178.1 (44.1min, 131.8P1) fps +221%
HP Spectre x360 16 RTX 4050
Intel Core Ultra 7 155H, NVIDIA GeForce RTX 4050 Laptop GPU
137.4 (50.7min, 105.7P1) fps +148%
Acer Swift X SFX16-52G-52VE
Intel Core i5-1240P, Intel Arc A370M
64.2 (45min, 49P1) fps +16%
Asus ExpertBook B5 Flip B5602FBN
Intel Core i7-1260P, Intel Arc A350M
58.7 (11.3min, 46P1) fps +6%
Gemiddeld Intel Arc 8-Core iGPU
  (39 - 74, n=37)
57.2 fps +3%
Dell Inspiron 16 7640 2-in-1
Intel Core Ultra 7 155H, Intel Arc 8-Core iGPU
55.4 (6.8min, 15.4P1) fps
Lenovo ThinkPad T16 G2 21K70035GE
AMD Ryzen 7 7840U, AMD Radeon 780M
51 (17min, 38.8P1) fps -8%
HP Envy x360 2-in-1 16-ad0097nr
AMD Ryzen 7 8840HS, AMD Radeon 780M
50.2 (8.3min, 15.8P1) fps -9%
Samsung Galaxy Book4 Pro 360
Intel Core Ultra 5 125H, Intel Arc 7-Core iGPU
50 fps -10%
Acer Swift Edge SFE16-42-R1GM
AMD Ryzen 7 7735U, AMD Radeon 680M
44.9 (7.8min, 12.1P1) fps -19%
Lenovo Yoga 7 2-in-1 16IML9
Intel Core Ultra 5 125U, Intel Graphics 4-Core iGPU (Arc)
39.2 (10min, 24P1) fps -29%
LG Gram 2in1 16 16T90R - G.AA78G
Intel Core i7-1360P, Intel Iris Xe Graphics G7 96EUs
35.3 (9min, 14.1P1) fps -36%
HP Spectre x360 2-in-1 16-f1075ng
Intel Core i7-12700H, Intel Iris Xe Graphics G7 96EUs
29.6 (10.8min, 15.8P1) fps -47%
Lenovo IdeaPad Flex 5 16ABR G8
AMD Ryzen 7 7730U, AMD Radeon RX Vega 8 (Ryzen 4000/5000)
29.1 (9.9min, 20.8P1) fps -47%
Dell Inspiron 16 7635 2-in-1
AMD Ryzen 5 7530U, AMD Radeon RX Vega 7
28.1 (7.3min, 13.2P1) fps -49%
Samsung Galaxy Book3 Pro 16
Intel Core i5-1340P, Intel Iris Xe Graphics G7 80EUs
27.5 fps -50%
Lenovo Thinkpad X1 Fold 16
Intel Core i7-1250U, Intel Iris Xe Graphics G7 96EUs
24.1 (6.2min, 8.71P1) fps -56%
Lenovo ThinkPad E16 G1 Core i5-1335U
Intel Core i5-1335U, Intel Iris Xe Graphics G7 80EUs
22.4 (5.7min, 7.62P1) fps -60%
1920x1080 ultra AA:ultra AF:16
Dell Inspiron 16 Plus 7640
Intel Core Ultra 7 155H, NVIDIA GeForce RTX 4060 Laptop GPU
153.5 (48min, 114.7P1) fps +238%
HP Spectre x360 16 RTX 4050
Intel Core Ultra 7 155H, NVIDIA GeForce RTX 4050 Laptop GPU
121.3 (49.1min, 95P1) fps +167%
Acer Swift X SFX16-52G-52VE
Intel Core i5-1240P, Intel Arc A370M
54.3 (41.2min, 42.6P1) fps +20%
Asus ExpertBook B5 Flip B5602FBN
Intel Core i7-1260P, Intel Arc A350M
49.1 (37.2min, 39.5P1) fps +8%
Dell Inspiron 16 7640 2-in-1
Intel Core Ultra 7 155H, Intel Arc 8-Core iGPU
45.4 (5min, 8.91P1) fps
Gemiddeld Intel Arc 8-Core iGPU
  (27.1 - 58.9, n=38)
45 fps -1%
Lenovo ThinkPad T16 G2 21K70035GE
AMD Ryzen 7 7840U, AMD Radeon 780M
43.7 (17.1min, 33.7P1) fps -4%
HP Envy x360 2-in-1 16-ad0097nr
AMD Ryzen 7 8840HS, AMD Radeon 780M
42.2 (7.1min, 9.18P1) fps -7%
Samsung Galaxy Book4 Pro 360
Intel Core Ultra 5 125H, Intel Arc 7-Core iGPU
40 fps -12%
Acer Swift Edge SFE16-42-R1GM
AMD Ryzen 7 7735U, AMD Radeon 680M
36.4 (6.6min, 8.1P1) fps -20%
Lenovo Yoga 7 2-in-1 16IML9
Intel Core Ultra 5 125U, Intel Graphics 4-Core iGPU (Arc)
30.2 (7.6min, 10.6P1) fps -33%
LG Gram 2in1 16 16T90R - G.AA78G
Intel Core i7-1360P, Intel Iris Xe Graphics G7 96EUs
28.5 (5.7min, 7.83P1) fps -37%
Lenovo IdeaPad Flex 5 16ABR G8
AMD Ryzen 7 7730U, AMD Radeon RX Vega 8 (Ryzen 4000/5000)
24.1 (6.1min, 7.58P1) fps -47%
HP Spectre x360 2-in-1 16-f1075ng
Intel Core i7-12700H, Intel Iris Xe Graphics G7 96EUs
23.7 (7.7min, 9.06P1) fps -48%
Dell Inspiron 16 7635 2-in-1
AMD Ryzen 5 7530U, AMD Radeon RX Vega 7
23.2 (7.3min, 9.35P1) fps -49%
Lenovo Thinkpad X1 Fold 16
Intel Core i7-1250U, Intel Iris Xe Graphics G7 96EUs
19 (5min, 5P1) fps -58%
Lenovo ThinkPad E16 G1 Core i5-1335U
Intel Core i5-1335U, Intel Iris Xe Graphics G7 80EUs
18.3 (5min, 5P1) fps -60%
Baldur's Gate 3
1280x720 Low Preset
HP Envy x360 2-in-1 16-ad0097nr
AMD Ryzen 7 8840HS, AMD Radeon 780M
51.3 fps +10%
Gemiddeld Intel Arc 8-Core iGPU
  (33.8 - 57.6, n=11)
48.4 fps +4%
Dell Inspiron 16 7640 2-in-1
Intel Core Ultra 7 155H, Intel Arc 8-Core iGPU
46.7 fps
Lenovo Yoga 7 2-in-1 16IML9
Intel Core Ultra 5 125U, Intel Graphics 4-Core iGPU (Arc)
24.9 fps -47%
1920x1080 Low Preset
Dell Inspiron 16 Plus 7640
Intel Core Ultra 7 155H, NVIDIA GeForce RTX 4060 Laptop GPU
111.1 fps +261%
HP Spectre x360 16 RTX 4050
Intel Core Ultra 7 155H, NVIDIA GeForce RTX 4050 Laptop GPU
84.9 fps +176%
HP Envy x360 2-in-1 16-ad0097nr
AMD Ryzen 7 8840HS, AMD Radeon 780M
35 fps +14%
Gemiddeld Intel Arc 8-Core iGPU
  (21 - 40.3, n=22)
31.8 fps +3%
Dell Inspiron 16 7640 2-in-1
Intel Core Ultra 7 155H, Intel Arc 8-Core iGPU
30.8 fps
Lenovo Yoga 7 2-in-1 16IML9
Intel Core Ultra 5 125U, Intel Graphics 4-Core iGPU (Arc)
15.4 fps -50%
1920x1080 Medium Preset
Dell Inspiron 16 Plus 7640
Intel Core Ultra 7 155H, NVIDIA GeForce RTX 4060 Laptop GPU
93.2 fps +240%
HP Spectre x360 16 RTX 4050
Intel Core Ultra 7 155H, NVIDIA GeForce RTX 4050 Laptop GPU
71.4 fps +161%
HP Envy x360 2-in-1 16-ad0097nr
AMD Ryzen 7 8840HS, AMD Radeon 780M
28.5 fps +4%
Dell Inspiron 16 7640 2-in-1
Intel Core Ultra 7 155H, Intel Arc 8-Core iGPU
27.4 fps
Gemiddeld Intel Arc 8-Core iGPU
  (16.3 - 31.1, n=23)
25.7 fps -6%
1920x1080 High Preset
Dell Inspiron 16 Plus 7640
Intel Core Ultra 7 155H, NVIDIA GeForce RTX 4060 Laptop GPU
82.4 fps +248%
HP Spectre x360 16 RTX 4050
Intel Core Ultra 7 155H, NVIDIA GeForce RTX 4050 Laptop GPU
64 fps +170%
Dell Inspiron 16 7640 2-in-1
Intel Core Ultra 7 155H, Intel Arc 8-Core iGPU
23.7 fps
HP Envy x360 2-in-1 16-ad0097nr
AMD Ryzen 7 8840HS, AMD Radeon 780M
22.6 fps -5%
Gemiddeld Intel Arc 8-Core iGPU
  (15.4 - 27.7, n=23)
22.5 fps -5%
1920x1080 Ultra Preset
Dell Inspiron 16 Plus 7640
Intel Core Ultra 7 155H, NVIDIA GeForce RTX 4060 Laptop GPU
76.7 fps +249%
HP Spectre x360 16 RTX 4050
Intel Core Ultra 7 155H, NVIDIA GeForce RTX 4050 Laptop GPU
63.1 fps +187%
HP Envy x360 2-in-1 16-ad0097nr
AMD Ryzen 7 8840HS, AMD Radeon 780M
22.2 fps +1%
Dell Inspiron 16 7640 2-in-1
Intel Core Ultra 7 155H, Intel Arc 8-Core iGPU
22 fps
Gemiddeld Intel Arc 8-Core iGPU
  (14.2 - 26.2, n=22)
21.6 fps -2%
Cyberpunk 2077 2.1 Phantom Liberty
1280x720 Low Preset (FSR off)
Dell Inspiron 16 Plus 7640
Intel Core Ultra 7 155H, NVIDIA GeForce RTX 4060 Laptop GPU
108.2 (88.1min) fps +185%
HP Spectre x360 16 RTX 4050
Intel Core Ultra 7 155H, NVIDIA GeForce RTX 4050 Laptop GPU
83.1 (32.7min) fps +119%
HP Envy x360 2-in-1 16-ad0097nr
AMD Ryzen 7 8840HS, AMD Radeon 780M
58.5 (20.6min) fps +54%
Gemiddeld Intel Arc 8-Core iGPU
  (34.5 - 58, n=16)
46.1 fps +21%
Dell Inspiron 16 7640 2-in-1
Intel Core Ultra 7 155H, Intel Arc 8-Core iGPU
38 (27.9min) fps
Lenovo Yoga 7 2-in-1 16IML9
Intel Core Ultra 5 125U, Intel Graphics 4-Core iGPU (Arc)
32.8 (7.65min) fps -14%
LG Gram 2in1 16 16T90R - G.AA78G
Intel Core i7-1360P, Intel Iris Xe Graphics G7 96EUs
29.2 (6.93min) fps -23%
Lenovo Thinkpad X1 Fold 16
Intel Core i7-1250U, Intel Iris Xe Graphics G7 96EUs
21.4 (3.17min) fps -44%
1920x1080 Low Preset (FSR off)
Dell Inspiron 16 Plus 7640
Intel Core Ultra 7 155H, NVIDIA GeForce RTX 4060 Laptop GPU
96.8 (78.1min) fps +212%
HP Spectre x360 16 RTX 4050
Intel Core Ultra 7 155H, NVIDIA GeForce RTX 4050 Laptop GPU
79.3 (21.3min) fps +156%
HP Envy x360 2-in-1 16-ad0097nr
AMD Ryzen 7 8840HS, AMD Radeon 780M
35.5 (19.3min) fps +15%
Dell Inspiron 16 7640 2-in-1
Intel Core Ultra 7 155H, Intel Arc 8-Core iGPU
31 (25.4min) fps
Gemiddeld Intel Arc 8-Core iGPU
  (11.3 - 38, n=34)
30 fps -3%
Samsung Galaxy Book4 Pro 360
Intel Core Ultra 5 125H, Intel Arc 7-Core iGPU
29.2 (22.1min) fps -6%
Lenovo Yoga 7 2-in-1 16IML9
Intel Core Ultra 5 125U, Intel Graphics 4-Core iGPU (Arc)
20.9 (8.34min) fps -33%
LG Gram 2in1 16 16T90R - G.AA78G
Intel Core i7-1360P, Intel Iris Xe Graphics G7 96EUs
17.7 (12min) fps -43%
Lenovo Thinkpad X1 Fold 16
Intel Core i7-1250U, Intel Iris Xe Graphics G7 96EUs
13.1 (9.86min) fps -58%
1920x1080 Medium Preset (FSR off)
Dell Inspiron 16 Plus 7640
Intel Core Ultra 7 155H, NVIDIA GeForce RTX 4060 Laptop GPU
83.1 (71.3min) fps +216%
HP Spectre x360 16 RTX 4050
Intel Core Ultra 7 155H, NVIDIA GeForce RTX 4050 Laptop GPU
63.3 (24.8min) fps +141%
HP Envy x360 2-in-1 16-ad0097nr
AMD Ryzen 7 8840HS, AMD Radeon 780M
27.8 (15.3min) fps +6%
Dell Inspiron 16 7640 2-in-1
Intel Core Ultra 7 155H, Intel Arc 8-Core iGPU
26.3 (20.8min) fps
Gemiddeld Intel Arc 8-Core iGPU
  (9.42 - 31.4, n=31)
25.6 fps -3%
Samsung Galaxy Book4 Pro 360
Intel Core Ultra 5 125H, Intel Arc 7-Core iGPU
21.7 (17.4min) fps -17%
Lenovo Yoga 7 2-in-1 16IML9
Intel Core Ultra 5 125U, Intel Graphics 4-Core iGPU (Arc)
16.9 (7.96min) fps -36%
LG Gram 2in1 16 16T90R - G.AA78G
Intel Core i7-1360P, Intel Iris Xe Graphics G7 96EUs
14.2 (3.7min) fps -46%
1920x1080 High Preset (FSR off)
Dell Inspiron 16 Plus 7640
Intel Core Ultra 7 155H, NVIDIA GeForce RTX 4060 Laptop GPU
69.9 (60.2min) fps +219%
HP Spectre x360 16 RTX 4050
Intel Core Ultra 7 155H, NVIDIA GeForce RTX 4050 Laptop GPU
53.5 (36.3min) fps +144%
HP Envy x360 2-in-1 16-ad0097nr
AMD Ryzen 7 8840HS, AMD Radeon 780M
22.1 (11min) fps +1%
Dell Inspiron 16 7640 2-in-1
Intel Core Ultra 7 155H, Intel Arc 8-Core iGPU
21.9 (16.8min) fps
Gemiddeld Intel Arc 8-Core iGPU
  (7.3 - 27.6, n=33)
21.6 fps -1%
Samsung Galaxy Book4 Pro 360
Intel Core Ultra 5 125H, Intel Arc 7-Core iGPU
19.1 (14.4min) fps -13%
Lenovo Yoga 7 2-in-1 16IML9
Intel Core Ultra 5 125U, Intel Graphics 4-Core iGPU (Arc)
14.3 (3.34min) fps -35%
LG Gram 2in1 16 16T90R - G.AA78G
Intel Core i7-1360P, Intel Iris Xe Graphics G7 96EUs
11.9 (2.78min) fps -46%
1920x1080 Ultra Preset (FSR off)
Dell Inspiron 16 Plus 7640
Intel Core Ultra 7 155H, NVIDIA GeForce RTX 4060 Laptop GPU
59.8 (50.5min) fps
HP Spectre x360 16 RTX 4050
Intel Core Ultra 7 155H, NVIDIA GeForce RTX 4050 Laptop GPU
46 (29.2min) fps
Gemiddeld Intel Arc 8-Core iGPU
  (13 - 24.7, n=25)
20.2 fps
HP Envy x360 2-in-1 16-ad0097nr
AMD Ryzen 7 8840HS, AMD Radeon 780M
19.1 (9.74min) fps
Samsung Galaxy Book4 Pro 360
Intel Core Ultra 5 125H, Intel Arc 7-Core iGPU
16.4 (11.1min) fps
Lenovo Yoga 7 2-in-1 16IML9
Intel Core Ultra 5 125U, Intel Graphics 4-Core iGPU (Arc)
12.5 (2.72min) fps
LG Gram 2in1 16 16T90R - G.AA78G
Intel Core i7-1360P, Intel Iris Xe Graphics G7 96EUs
11.3 (8.8min) fps
Far Cry 5
1280x720 Low Preset AA:T
Dell Inspiron 16 Plus 7640
Intel Core Ultra 7 155H, NVIDIA GeForce RTX 4060 Laptop GPU
138 (99min) fps +103%
HP Spectre x360 16 RTX 4050
Intel Core Ultra 7 155H, NVIDIA GeForce RTX 4050 Laptop GPU
97 (3min) fps +43%
Asus ExpertBook B5 Flip B5602FBN
Intel Core i7-1260P, Intel Arc A350M
89 (74min) fps +31%
Acer Swift X SFX16-52G-52VE
Intel Core i5-1240P, Intel Arc A370M
87 (49min) fps +28%
Dell Inspiron 16 7640 2-in-1
Intel Core Ultra 7 155H, Intel Arc 8-Core iGPU
68 (21min) fps
Gemiddeld Intel Arc 8-Core iGPU
  (47 - 91, n=29)
66.5 fps -2%
HP Envy x360 2-in-1 16-ad0097nr
AMD Ryzen 7 8840HS, AMD Radeon 780M
63 (46min) fps -7%
Acer Swift Edge SFE16-42-R1GM
AMD Ryzen 7 7735U, AMD Radeon 680M
59 (42min) fps -13%
Samsung Galaxy Book3 Pro 16
Intel Core i5-1340P, Intel Iris Xe Graphics G7 80EUs
55 (47min) fps -19%
Lenovo IdeaPad Flex 5 16ABR G8
AMD Ryzen 7 7730U, AMD Radeon RX Vega 8 (Ryzen 4000/5000)
48 fps -29%
HP Spectre x360 2-in-1 16-f1075ng
Intel Core i7-12700H, Intel Iris Xe Graphics G7 96EUs
47 (41min) fps -31%
Lenovo Yoga 7 2-in-1 16IML9
Intel Core Ultra 5 125U, Intel Graphics 4-Core iGPU (Arc)
46 (39min) fps -32%
Lenovo ThinkPad E16 G1 Core i5-1335U
Intel Core i5-1335U, Intel Iris Xe Graphics G7 80EUs
40 (35min) fps -41%
Samsung Galaxy Book4 Pro 360
Intel Core Ultra 5 125H, Intel Arc 7-Core iGPU
37 fps -46%
Lenovo Thinkpad X1 Fold 16
Intel Core i7-1250U, Intel Iris Xe Graphics G7 96EUs
27 (22min) fps -60%
1920x1080 Medium Preset AA:T
Dell Inspiron 16 Plus 7640
Intel Core Ultra 7 155H, NVIDIA GeForce RTX 4060 Laptop GPU
125 (94min) fps +229%
HP Spectre x360 16 RTX 4050
Intel Core Ultra 7 155H, NVIDIA GeForce RTX 4050 Laptop GPU
93 (13min) fps +145%
Acer Swift X SFX16-52G-52VE
Intel Core i5-1240P, Intel Arc A370M
48 (43min) fps +26%
Asus ExpertBook B5 Flip B5602FBN
Intel Core i7-1260P, Intel Arc A350M
44 (38min) fps +16%
Gemiddeld Intel Arc 8-Core iGPU
  (30 - 54, n=31)
40.4 fps +6%
Dell Inspiron 16 7640 2-in-1
Intel Core Ultra 7 155H, Intel Arc 8-Core iGPU
38 (12min) fps
HP Envy x360 2-in-1 16-ad0097nr
AMD Ryzen 7 8840HS, AMD Radeon 780M
36 (6min) fps -5%
Samsung Galaxy Book4 Pro 360
Intel Core Ultra 5 125H, Intel Arc 7-Core iGPU
34 fps -11%
Acer Swift Edge SFE16-42-R1GM
AMD Ryzen 7 7735U, AMD Radeon 680M
33 (6min) fps -13%
Samsung Galaxy Book3 Pro 16
Intel Core i5-1340P, Intel Iris Xe Graphics G7 80EUs
27 (23min) fps -29%
Lenovo Yoga 7 2-in-1 16IML9
Intel Core Ultra 5 125U, Intel Graphics 4-Core iGPU (Arc)
25 (17min) fps -34%
HP Spectre x360 2-in-1 16-f1075ng
Intel Core i7-12700H, Intel Iris Xe Graphics G7 96EUs
23 (20min) fps -39%
Lenovo IdeaPad Flex 5 16ABR G8
AMD Ryzen 7 7730U, AMD Radeon RX Vega 8 (Ryzen 4000/5000)
23 fps -39%
Lenovo ThinkPad E16 G1 Core i5-1335U
Intel Core i5-1335U, Intel Iris Xe Graphics G7 80EUs
19 (18min) fps -50%
Lenovo Thinkpad X1 Fold 16
Intel Core i7-1250U, Intel Iris Xe Graphics G7 96EUs
18 (15min) fps -53%
1920x1080 High Preset AA:T
Dell Inspiron 16 Plus 7640
Intel Core Ultra 7 155H, NVIDIA GeForce RTX 4060 Laptop GPU
118 (88min) fps +228%
HP Spectre x360 16 RTX 4050
Intel Core Ultra 7 155H, NVIDIA GeForce RTX 4050 Laptop GPU
95 (75min) fps +164%
Acer Swift X SFX16-52G-52VE
Intel Core i5-1240P, Intel Arc A370M
45 (40min) fps +25%
Asus ExpertBook B5 Flip B5602FBN
Intel Core i7-1260P, Intel Arc A350M
41 (36min) fps +14%
Gemiddeld Intel Arc 8-Core iGPU
  (22 - 50, n=33)
36.8 fps +2%
Dell Inspiron 16 7640 2-in-1
Intel Core Ultra 7 155H, Intel Arc 8-Core iGPU
36 (24min) fps
HP Envy x360 2-in-1 16-ad0097nr
AMD Ryzen 7 8840HS, AMD Radeon 780M
33 (20min) fps -8%
Acer Swift Edge SFE16-42-R1GM
AMD Ryzen 7 7735U, AMD Radeon 680M
31 (10min) fps -14%
Samsung Galaxy Book4 Pro 360
Intel Core Ultra 5 125H, Intel Arc 7-Core iGPU
31 fps -14%
LG Gram 2in1 16 16T90R - G.AA78G
Intel Core i7-1360P, Intel Iris Xe Graphics G7 96EUs
29 (26min) fps -19%
Lenovo Yoga 7 2-in-1 16IML9
Intel Core Ultra 5 125U, Intel Graphics 4-Core iGPU (Arc)
25 (22min) fps -31%
Samsung Galaxy Book3 Pro 16
Intel Core i5-1340P, Intel Iris Xe Graphics G7 80EUs
24 (13min) fps -33%
HP Spectre x360 2-in-1 16-f1075ng
Intel Core i7-12700H, Intel Iris Xe Graphics G7 96EUs
22 (20min) fps -39%
Lenovo IdeaPad Flex 5 16ABR G8
AMD Ryzen 7 7730U, AMD Radeon RX Vega 8 (Ryzen 4000/5000)
20 fps -44%
Lenovo ThinkPad E16 G1 Core i5-1335U
Intel Core i5-1335U, Intel Iris Xe Graphics G7 80EUs
18 (16min) fps -50%
Lenovo Thinkpad X1 Fold 16
Intel Core i7-1250U, Intel Iris Xe Graphics G7 96EUs
16 (14min) fps -56%
1920x1080 Ultra Preset AA:T
Dell Inspiron 16 Plus 7640
Intel Core Ultra 7 155H, NVIDIA GeForce RTX 4060 Laptop GPU
110 (81min) fps +224%
HP Spectre x360 16 RTX 4050
Intel Core Ultra 7 155H, NVIDIA GeForce RTX 4050 Laptop GPU
87 (64min) fps +156%
Acer Swift X SFX16-52G-52VE
Intel Core i5-1240P, Intel Arc A370M
42 (39min) fps +24%
Asus ExpertBook B5 Flip B5602FBN
Intel Core i7-1260P, Intel Arc A350M
38 (33min) fps +12%
Gemiddeld Intel Arc 8-Core iGPU
  (25 - 46, n=33)
34.6 fps +2%
Dell Inspiron 16 7640 2-in-1
Intel Core Ultra 7 155H, Intel Arc 8-Core iGPU
34 (28min) fps
HP Envy x360 2-in-1 16-ad0097nr
AMD Ryzen 7 8840HS, AMD Radeon 780M
31 (23min) fps -9%
Acer Swift Edge SFE16-42-R1GM
AMD Ryzen 7 7735U, AMD Radeon 680M
28 (17min) fps -18%
LG Gram 2in1 16 16T90R - G.AA78G
Intel Core i7-1360P, Intel Iris Xe Graphics G7 96EUs
27 (24min) fps -21%
Samsung Galaxy Book3 Pro 16
Intel Core i5-1340P, Intel Iris Xe Graphics G7 80EUs
23 (21min) fps -32%
Lenovo Yoga 7 2-in-1 16IML9
Intel Core Ultra 5 125U, Intel Graphics 4-Core iGPU (Arc)
23 (20min) fps -32%
HP Spectre x360 2-in-1 16-f1075ng
Intel Core i7-12700H, Intel Iris Xe Graphics G7 96EUs
20 (18min) fps -41%
Lenovo IdeaPad Flex 5 16ABR G8
AMD Ryzen 7 7730U, AMD Radeon RX Vega 8 (Ryzen 4000/5000)
19 fps -44%
Lenovo ThinkPad E16 G1 Core i5-1335U
Intel Core i5-1335U, Intel Iris Xe Graphics G7 80EUs
17 (15min) fps -50%
Lenovo Thinkpad X1 Fold 16
Intel Core i7-1250U, Intel Iris Xe Graphics G7 96EUs
15 (13min) fps -56%

Cyberpunk 2077 ultra FPS Chart

012345678910111213141516171819Tooltip
Dell Inspiron 16 7640 2-in-1 Ultra 7 155H, Arc 8-Core: Ø18.9 (16.4-19.6)
lagegem.hogeultra
The Witcher 3 (2015) 141.5 81.2 44.5 23.9
Dota 2 Reborn (2015) 101.5 93.3 77.8 78
Final Fantasy XV Benchmark (2018) 65 36.5 26.8
X-Plane 11.11 (2018) 50.8 40.8 40.1
Far Cry 5 (2018) 68 38 36 34
Strange Brigade (2018) 145.6 71.8 55.4 45.4
Tiny Tina's Wonderlands (2022) 49.2 37.3 26.4 21.2
F1 22 (2022) 68.8 65.6
Baldur's Gate 3 (2023) 30.8 27.4 23.7 22
Cyberpunk 2077 2.1 Phantom Liberty (2023) 31 26.3 21.9

Uitstoot

Systeemgeluid - Luid en trots

Zonder grote veranderingen aan de koeloplossing ten opzichte van het model 2023, ondanks onze veeleisendere processor, zal de interne ventilator even hard of harder moeten draaien dan voorheen en dat is precies wat we in onze tests hebben vastgesteld. De ventilator in de Inspiron 16 7640 2-in-1 versnelt sneller van stil naar luid wanneer er zwaardere belastingen worden ingevoerd. We kunnen bijvoorbeeld een ventilatorgeluid van 45 dB(A) registreren minder dan halverwege de eerste benchmarkscène van 3DMark 06, terwijl de Inspiron 16 7635 2-in-1 zou uitkomen op 40 dB(A). Het draaien van games resulteert ook in een ventilatorgeluid van 45 dB(A), waardoor onze Dell een van de luidste 16-inch convertibles op de markt is.

De koeloplossing bestaat uit een grote ventilator van ~65 mm en een korte koperen heat pipe
We merken geen elektronische ruis of spoelgejank op in ons testapparaat
Geluidsprofiel ventilator (Wit: Achtergrond, Rood: Systeem inactief, Blauw: 3DMark 06, Oranje: Cyberpunk 2077, Groen: Prime95+FurMark stress)

Geluidsniveau

Onbelast
22.9 / 22.9 / 25 dB (A)
Belasting
45.1 / 44.9 dB (A)
  red to green bar
 
 
30 dB
stil
40 dB(A)
hoorbaar
50 dB(A)
luid
 
min: dark, med: mid, max: light   Earthworks M23R, Arta (15 cm afstand)   omgevingslawaai: 22.9 dB(A)
dB(A) 0102030405060708090Deep BassMiddle BassHigh BassLower RangeMidsHigher MidsLower HighsMid HighsUpper HighsSuper Highs2030.930.435.635.230.72521.721.824.524.820.73123.822.525.423.221.8402120.922.718.820.85021.52119.723.422.56325.52621.622.824.88023.122.920.821.422.910019.720.216.819.319.712521.721.21515.222.516023.323.612.314.12420023.723.912.914.124.625032.83311.512.732.831531.631.712.313.432.340026.927.110.911.62850029.129.39.810.529.663028.728.49.89.728.780033.233.69.19.633.1100032.1329.69.631.4125033.933.89.99.633.4160035.1359.89.835.1200035.135.410.29.935.225003333.710.510.333.3315031.731.710.910.731.9400033.233.411.21133.6500032.232.411.911.731.9630034.334.311.711.634.2800031.932.211.711.731.9100002626.111.811.625.91250023.523.811.911.723.51600018.718.811.31118.5SPL44.945.122.922.944.9N55.10.40.45.1median 31.7median 31.7median 11.3median 11.6median 31.9Delta4.24.71.11.74.4hearing rangehide median Fan NoiseDell Inspiron 16 7640 2-in-1
Dell Inspiron 16 7640 2-in-1
Arc 8-Core, Ultra 7 155H, Micron 2550 1TB
Dell Inspiron 16 Plus 7640
NVIDIA GeForce RTX 4060 Laptop GPU, Ultra 7 155H, SK hynix BC901 HFS001TEJ4X164N
Dell Inspiron 16 7635 2-in-1
Vega 7, R5 7530U, Kioxia BG5 KBG50ZNS512G
HP Envy x360 2-in-1 16-ad0097nr
Radeon 780M, R7 8840HS, KIOXIA BG5 KBG50ZNV1T02
Lenovo IdeaPad Pro 5 16IMH G9
Arc 8-Core, Ultra 7 155H, Samsung PM9C1a MZAL81T0HDLB
Samsung Galaxy Book4 Pro 360
Arc 7-Core, Ultra 5 125H, Samsung PM9B1 512GB MZVL4512HBLU
Noise
2%
2%
10%
-4%
2%
uit / omgeving *
22.9
23.8
-4%
23.6
-3%
22.9
-0%
24.1
-5%
24.1
-5%
Idle Minimum *
22.9
24.2
-6%
23.6
-3%
23
-0%
24.1
-5%
24.1
-5%
Idle Average *
22.9
24.2
-6%
23.6
-3%
23
-0%
24.1
-5%
24.1
-5%
Idle Maximum *
25
24.2
3%
23.6
6%
23
8%
28.2
-13%
26.4
-6%
Load Average *
45.1
28.9
36%
40.3
11%
23.8
47%
44.4
2%
35.2
22%
Cyberpunk 2077 ultra *
44.9
Load Maximum *
44.9
51
-14%
44.2
2%
43.8
2%
44.4
1%
39.2
13%
Witcher 3 ultra *
51
44.2
43.8
36.5
38.5

* ... kleiner is beter

Temperatuur

De oppervlaktetemperaturen zijn op de linkerhelft van het chassis weer warmer dan op de rechterhelft, vanwege de asymmetrische koeloplossing. Dit keer kunnen de gemiddelde temperaturen echter veel hoger zijn dan voorheen vanwege de krachtigere Core H-serie CPU. Hete plekken op ons apparaat kunnen bijvoorbeeld oplopen tot 47 C op zowel de C- als de D-kap, vergeleken met slechts 39 C tot 42 C op het model van vorig jaar. Deze plekken bevinden zich gelukkig aan de achterkant van het apparaat, waar vingers minder snel in aanraking komen met het apparaat.

Achteruitlaat
Achteruitlaat
AC-adapter kan meer dan 46 C bereiken bij zware belastingen
Max. Belasting
 45.8 °C46.8 °C45.2 °C 
 43 °C43.4 °C36 °C 
 33.8 °C31.4 °C30.8 °C 
Maximum: 46.8 °C
Gemiddelde: 39.6 °C
34.6 °C43 °C45.6 °C
33 °C41.4 °C43.2 °C
29.8 °C33.4 °C35.4 °C
Maximum: 45.6 °C
Gemiddelde: 37.7 °C
Stroomadapter (max.)  47.6 °C | Kamertemperatuur 20 °C | Fluke 62 Mini IR Thermometer
(-) De gemiddelde temperatuur voor de bovenzijde bij maximale belasting bedraagt 39.6 °C / 103 F, vergeleken met het gemiddelde van 30.2 °C / ###class_avg_f## F voor de apparaten van de klasse Convertible.
(-) De maximumtemperatuur aan de bovenzijde bedraagt 46.8 °C / 116 F, vergeleken met het gemiddelde van 35.3 °C / 96 F, variërend van 19.6 tot 60 °C voor de klasse Convertible.
(-) De bodem warmt op tot een maximum van 45.6 °C / 114 F, vergeleken met een gemiddelde van 36.8 °C / 98 F
(+) Bij onbelast gebruik bedraagt de gemiddelde temperatuur voor de bovenzijde 29.9 °C / 86 F, vergeleken met het apparaatgemiddelde van 30.2 °C / 86 F.
(+) De handpalmsteunen en het touchpad bereiken maximaal de huidtemperatuur (33.8 °C / 92.8 F) en zijn dus niet heet.
(-) De gemiddelde temperatuur van de handpalmsteun van soortgelijke toestellen bedroeg 28 °C / 82.4 F (-5.8 °C / -10.4 F).
Systeem inactief (C-afdekking)
Systeem inactief (deksel D)
Prime95+FurMark stress (C omslag)
Prime95+FurMark stress (D omslag)
Dell Inspiron 16 7640 2-in-1
Intel Core Ultra 7 155H, Intel Arc 8-Core iGPU
Dell Inspiron 16 Plus 7640
Intel Core Ultra 7 155H, NVIDIA GeForce RTX 4060 Laptop GPU
Dell Inspiron 16 7635 2-in-1
AMD Ryzen 5 7530U, AMD Radeon RX Vega 7
HP Envy x360 2-in-1 16-ad0097nr
AMD Ryzen 7 8840HS, AMD Radeon 780M
Lenovo IdeaPad Pro 5 16IMH G9
Intel Core Ultra 7 155H, Intel Arc 8-Core iGPU
Samsung Galaxy Book4 Pro 360
Intel Core Ultra 5 125H, Intel Arc 7-Core iGPU
Heat
3%
11%
8%
19%
18%
Maximum Upper Side *
46.8
43.4
7%
41.6
11%
42.6
9%
36.3
22%
38.6
18%
Maximum Bottom *
45.6
41.6
9%
39
14%
47.8
-5%
39.1
14%
39.2
14%
Idle Upper Side *
32.2
32.8
-2%
29.4
9%
27.4
15%
24.9
23%
25.2
22%
Idle Bottom *
31.4
32.4
-3%
28.6
9%
27.8
11%
26.1
17%
25.7
18%

* ... kleiner is beter

Luidsprekers

Roze ruis toont een goed maximaal volume en een fatsoenlijke basweergave
Twee naar boven gerichte luidsprekers met nog eens twee naar beneden gerichte luidsprekers voor een totaal van vier
dB(A) 0102030405060708090Deep BassMiddle BassHigh BassLower RangeMidsHigher MidsLower HighsMid HighsUpper HighsSuper Highs2032.535.632.52520.924.520.93120.825.420.84019.322.719.35019.619.719.66322.121.622.18025.520.825.51003116.83112540.31540.316058.912.358.920068.412.968.425072.711.572.731571.712.371.740069.110.969.1500699.86963067.89.867.880072.59.172.51000739.673125076.99.976.9160075.49.875.4200073.410.273.4250073.210.573.2315072.110.972.1400068.811.268.850006311.963630062.711.762.7800062.511.762.5100006311.8631250065.311.965.31600067.711.367.7SPL8422.984N60.10.460.1median 68.8median 11.3median 68.8Delta5.91.15.926.325.821.422.12624.925.127.622.532.523.448.72655.818.860.922.167.2267019.372.317.674.217.774.319.575.31571.711.871.311.27410.574.21072.710.17210.67210.97511.374.811.671.71269.71269.612.371.112.669.61270.111.269.824.784.70.666.6median 12median 71.73.42.2hearing rangehide median Pink NoiseDell Inspiron 16 7640 2-in-1Apple MacBook Pro 16 2021 M1 Pro
Frequentiediagram (selectievakjes kunnen worden aan- en uitgezet om toestellen te vergelijken)
Dell Inspiron 16 7640 2-in-1 audioanalyse

(+) | luidsprekers kunnen relatief luid spelen (84 dB)
Bas 100 - 315 Hz
(±) | verminderde zeebaars - gemiddeld 13.9% lager dan de mediaan
(±) | lineariteit van de lage tonen is gemiddeld (14% delta ten opzichte van de vorige frequentie)
Midden 400 - 2000 Hz
(+) | evenwichtige middens - slechts 3.6% verwijderd van de mediaan
(+) | de middentonen zijn lineair (3.6% delta ten opzichte van de vorige frequentie)
Hoog 2 - 16 kHz
(+) | evenwichtige hoogtepunten - slechts 4.5% verwijderd van de mediaan
(+) | de hoge tonen zijn lineair (2.8% delta naar de vorige frequentie)
Algemeen 100 - 16.000 Hz
(+) | het totale geluid is lineair (12% verschil met de mediaan)
Vergeleken met dezelfde klasse
» 10% van alle geteste apparaten in deze klasse waren beter, 4% vergelijkbaar, 86% slechter
» De beste had een delta van 6%, het gemiddelde was 21%, de slechtste was 57%
Vergeleken met alle geteste toestellen
» 7% van alle geteste apparaten waren beter, 2% gelijk, 90% slechter
» De beste had een delta van 4%, het gemiddelde was 25%, de slechtste was 134%

Apple MacBook Pro 16 2021 M1 Pro audioanalyse

(+) | luidsprekers kunnen relatief luid spelen (84.7 dB)
Bas 100 - 315 Hz
(+) | goede baars - slechts 3.8% verwijderd van de mediaan
(+) | de lage tonen zijn lineair (5.2% delta naar de vorige frequentie)
Midden 400 - 2000 Hz
(+) | evenwichtige middens - slechts 1.3% verwijderd van de mediaan
(+) | de middentonen zijn lineair (2.1% delta ten opzichte van de vorige frequentie)
Hoog 2 - 16 kHz
(+) | evenwichtige hoogtepunten - slechts 1.9% verwijderd van de mediaan
(+) | de hoge tonen zijn lineair (2.7% delta naar de vorige frequentie)
Algemeen 100 - 16.000 Hz
(+) | het totale geluid is lineair (4.6% verschil met de mediaan)
Vergeleken met dezelfde klasse
» 0% van alle geteste apparaten in deze klasse waren beter, 0% vergelijkbaar, 100% slechter
» De beste had een delta van 5%, het gemiddelde was 18%, de slechtste was 45%
Vergeleken met alle geteste toestellen
» 0% van alle geteste apparaten waren beter, 0% gelijk, 100% slechter
» De beste had een delta van 4%, het gemiddelde was 25%, de slechtste was 134%

Energiebeheer - Core-H en mini-LED kunnen veeleisend zijn

Stroomverbruik

Stationair draaien op de desktop vraagt tussen de 6 W en 14 W, afhankelijk van de helderheidsinstelling, wat een aantal watt hoger is dan wat we op de Inspiron 16 7635 2-in-1. Natuurlijk zijn de veeleisendere CPU uit de H-serie en het mini-LED-scherm met hogere resolutie beide verantwoordelijk voor het over het algemeen hogere verbruik.

Het verbruik is opnieuw meer dan 40% hoger dan bij de Inspiron 16 7635 2-in-1 wanneer er meer veeleisende toepassingen zoals games worden uitgevoerd. Met een GPU prestatieverbetering van meer dan 2x ten opzichte van de RX Vega 7 zou de verbruikstoename voor de meeste gebruikers echter de moeite waard moeten zijn. Een soortgelijke conclusie kan ook worden getrokken voor CPU-intensieve taken wanneer Prime95 wordt uitgevoerd. Als de levensduur van de batterij belangrijker is dan de prestaties, dan zal het kiezen voor de goedkopere en langzamere Core Ultra 5 125U configuratie naar verwachting veel energie besparen in dit opzicht.

We zijn in staat om een maximaal verbruik van 110 W te registreren, ook al is de kleine-medium (~12,2 x 5,9 x 2,7 cm) USB-C wisselstroomadapter slechts berekend op 100 W. Dit maximale verbruik is slechts tijdelijk, zoals blijkt uit onze onderstaande grafiek, vanwege thermische beperkingen. Het is niettemin veel hoger dan wat we op de Inspiron 16 7635 2-in-1 vaststelden, dankzij het hogere Turbo Boost-potentieel van de Core H-serie CPU.

3DMark 06 verbruik
3DMark 06 verbruik
Cyberpunk 2077 1080p Ultraverbruik
Het verbruik piekte naar 110 W gedurende slechts enkele seconden bij het starten van Prime95 stress voordat het uiteindelijk daalde naar 73 W vanwege de beperkte Turbo Boost-duurzaamheid
Prime95+FurMark stress ingezet bij 10s markering
Stroomgebruik
Uit / Standbydarklight 0.43 / 1 Watt
Inactiefdarkmidlight 6.1 / 13.5 / 13.8 Watt
Belasting midlight 63.6 / 109.7 Watt
 color bar
Key: min: dark, med: mid, max: light        Metrahit Energy
Dell Inspiron 16 7640 2-in-1
Ultra 7 155H, Arc 8-Core, Micron 2550 1TB, Mini-LED, 2560x1600, 16"
Dell Inspiron 16 Plus 7640
Ultra 7 155H, NVIDIA GeForce RTX 4060 Laptop GPU, SK hynix BC901 HFS001TEJ4X164N, IPS, 2560x1600, 16"
Dell Inspiron 16 7635 2-in-1
R5 7530U, Vega 7, Kioxia BG5 KBG50ZNS512G, IPS, 1920x1200, 16"
HP Envy x360 2-in-1 16-ad0097nr
R7 8840HS, Radeon 780M, KIOXIA BG5 KBG50ZNV1T02, OLED, 2880x1800, 16"
Lenovo IdeaPad Pro 5 16IMH G9
Ultra 7 155H, Arc 8-Core, Samsung PM9C1a MZAL81T0HDLB, IPS, 2560x1600, 16"
Samsung Galaxy Book4 Pro 360
Ultra 5 125H, Arc 7-Core, Samsung PM9B1 512GB MZVL4512HBLU, OLED, 2880x1800, 16"
Power Consumption
7%
35%
26%
22%
44%
Idle Minimum *
6.1
4.2
31%
4.8
21%
5
18%
3.5
43%
3
51%
Idle Average *
13.5
6.9
49%
7.6
44%
6.2
54%
9.6
29%
6.3
53%
Idle Maximum *
13.8
15.2
-10%
8.7
37%
14.7
-7%
9.9
28%
6.5
53%
Load Average *
63.6
70.4
-11%
47.1
26%
49.9
22%
62.7
1%
49.3
22%
Cyberpunk 2077 ultra external monitor *
64.6
Cyberpunk 2077 ultra *
67
Load Maximum *
109.7
137.4
-25%
56.4
49%
65
41%
101.2
8%
65.5
40%
Witcher 3 ultra *
115.9
46.6
54.5
55.8
45.9

* ... kleiner is beter

Power Consumption Cyberpunk / Stress Test

0102030405060708090100Tooltip
Dell Inspiron 16 7640 2-in-1 Ultra 7 155H, Arc 8-Core; 1280x720 Prime95 28.10 and Furmark 1.25: Ø83.7 (72.5-109.3)
Dell Inspiron 16 7635 2-in-1 R5 7530U, Vega 7; 1280x720 Prime95 28.10 and Furmark 1.25: Ø48.2 (47-56.4)
Dell Inspiron 16 7640 2-in-1 Ultra 7 155H, Arc 8-Core; Idle 150cd/m2: Ø7.79 (7.48-9.2)
Dell Inspiron 16 7635 2-in-1 R5 7530U, Vega 7; Idle 150cd/m2: Ø6.24 (5.7-9.37)
Dell Inspiron 16 7640 2-in-1 Ultra 7 155H, Arc 8-Core; Cyberpunk 2077 FHD ultra no FSR 150cd: Ø67 (57.6-74.2)

Power Consumption external Monitor

0102030405060708090100Tooltip
Dell Inspiron 16 7640 2-in-1 Ultra 7 155H, Arc 8-Core; Prime95 V2810 Stress (external Monitor): Ø77.5 (71.8-109.7)
Dell Inspiron 16 7635 2-in-1 R5 7530U, Vega 7; Prime95 V2810 Stress (external Monitor): Ø44.2 (42.8-53.7)
Dell Inspiron 16 7640 2-in-1 Ultra 7 155H, Arc 8-Core; Cinebench R15 Multi (external Monitor): Ø109.4 (109.3-109.4)
Dell Inspiron 16 7635 2-in-1 R5 7530U, Vega 7; Cinebench R15 Multi (external Monitor): Ø42.8 (37.6-50.8)
Dell Inspiron 16 7640 2-in-1 Ultra 7 155H, Arc 8-Core; 1280x720 FurMark 1.19 GPU Stress Test (external Monitor): Ø56.5 (54.1-60.8)
Dell Inspiron 16 7635 2-in-1 R5 7530U, Vega 7; 1280x720 FurMark 1.19 GPU Stress Test (external Monitor): Ø42.6 (41.3-47.6)
Dell Inspiron 16 7640 2-in-1 Ultra 7 155H, Arc 8-Core; Idle 1min (external Monitor): Ø6.1 (5.51-12)
Dell Inspiron 16 7635 2-in-1 R5 7530U, Vega 7; Idle 1min (external Monitor): Ø4.96 (3.99-10.8)
Dell Inspiron 16 7640 2-in-1 Ultra 7 155H, Arc 8-Core; Cyberpunk 2077 FHD ultra no FSR (external Monitor): Ø64.6 (60-71.3)

Levensduur batterij

100 W USB-C netadapter

Het 90 Wh batterijpakket is groter dan het 64 Wh pakket in de Inspiron 16 7635 2-in-1 van vorig jaar. Desondanks is de gebruikstijd tijdens onze bladertest bijna drie uur korter door het veeleisendere beeldscherm en de CPU, zoals hierboven vermeld. De verschillen in looptijd gelden zelfs wanneer de schermen zijn ingesteld op een identiek helderheidsniveau van 150 nits.

Het opladen van de grote accu van lege naar volle capaciteit gaat relatief langzaam: ongeveer 2,5 uur vergeleken met 1,5 uur bij de meeste andere Ultrabooks.

Batterijduur
Inactief (zonder WLAN, minimale helderheid)
21h 50min
WiFi Websurfing
11h 26min
Belast (maximale helderheid)
1h 33min
Dell Inspiron 16 7640 2-in-1
Ultra 7 155H, Arc 8-Core, 90 Wh
Dell Inspiron 16 Plus 7640
Ultra 7 155H, NVIDIA GeForce RTX 4060 Laptop GPU, 90 Wh
Dell Inspiron 16 7635 2-in-1
R5 7530U, Vega 7, 64 Wh
HP Envy x360 2-in-1 16-ad0097nr
R7 8840HS, Radeon 780M, 68 Wh
Lenovo IdeaPad Pro 5 16IMH G9
Ultra 7 155H, Arc 8-Core, 84 Wh
Samsung Galaxy Book4 Pro 360
Ultra 5 125H, Arc 7-Core, 76 Wh
Batterijduur
16%
23%
-12%
-9%
0%
Reader / Idle
1310
1560
19%
935
-29%
WiFi v1.3
686
799
16%
869
27%
459
-33%
756
10%
531
-23%
Load
93
114
23%
116
25%
68
-27%
114
23%
H.264
957
881

Pro

+ helder 2,5K mini-LED-touchscreen voor het uitstekend afspelen van multimedia
+ zeer hoge CPU-prestaties voor een 16-inch convertible
+ relatief betaalbaar
+ sSD van hogere kwaliteit

Contra

- zwaarder en groter dan de meeste andere 16-inch convertibles
- langzame SD-kaartlezer
- luide ventilator onder belasting
- kortere batterijduur

Conclusie - Groot in omvang en prestaties

In review: Dell Inspiron 16 7640 2-in-1

Er zijn verschillende sterke punten aan de Inspiron 16 7640 2-in-1. Ten eerste zijn de prestaties met de Core Ultra 7 155H uitstekend, vooral in vergelijking met andere 16-inch convertibles die op geïntegreerde graphics draaien. Dit is een CPU van gamingklasse zonder grote throttling-problemen en hij zou alle content of multitasking-toepassingen die u op de machine kunt loslaten, moeten doorstaan. Ten tweede bevestigt het mini-LED paneel het model als een high-end multimediaspeler met een handige 2-in-1 vormfactor en actieve pen.

De Inspiron 16 7640 2-in-1 is groot en de baas. Hoewel de prestaties en het beeldscherm indrukwekkend zijn voor de prijs, betalen gebruikers hiervoor met een lompe behuizing en een kortere batterijlevensduur.

Hogere prestaties en helderdere schermen gaan gepaard met een voorspelbaar hoger stroomverbruik. De meer veeleisende onderdelen leiden tot meer warmteontwikkeling, wat resulteert in een luider ventilatorgeluid en kortere looptijden dan bij het model van vorig jaar. De verschillen zijn ook niet gering, zoals blijkt uit onze tests en metingen hierboven.

Daarnaast kunnen de grote afmetingen en het zware gewicht van het model niet genegeerd worden. Er zijn lichtere 16-inch convertibles verkrijgbaar, waaronder de LG Gram 16 2-in-1 of Samsung Galaxy Book4 Pro 360 voor een reisvriendelijkere ervaring. De Dell is groter en zwaarder dan zelfs de HP Spectre x360 16 die met name discrete GeForce graphics biedt.

De Inspiron 16 7640 2-in-1 is ondanks zijn gebreken toch aantrekkelijk vanwege zijn redelijke vraagprijs van $1000. Hij blinkt uit op het gebied van snelheid en beeldkwaliteit ten opzichte van andere laptops in dezelfde prijsklasse.

Prijs en beschikbaarheid

De basisconfiguratie met de Core Ultra 5 125U en standaard 1200p IPS-touchscreen begint bij $800, terwijl de Core Ultra 7 155H en 2,5K mini-LED-configuratie uit de review momenteel voor $1000 wordt geleverd.

Hinweis: We hebben ons beoordelingssysteem kürzlich geactualiseerd en de resultaten van versie 8 zijn niet vergelijkbaar met de resultaten van versie 7. Meer informatie vindt u hier beschikbaar.

Opmerking: We hebben ons beoordelingssysteem onlangs bijgewerkt en de resultaten van versie 8 zijn niet vergelijkbaar met de resultaten van versie 7. Meer informatie is beschikbaar hier .

Dell Inspiron 16 7640 2-in-1 - 19-07-2024 v8
Allen Ngo

Behuizing
85 / 98 → 87%
Toetsenbord
79%
Aanwijsapparaat
75%
Aansluitmogelijkheden
70 / 74 → 94%
Gewicht
62 / 20-75 → 77%
Batterij
89%
Beeldscherm
76%
Gaming-performance
49 / 65 → 75%
Applicatie-performance
81 / 92 → 88%
Temperatuur
87%
Luidheid
84%
Audio
83 / 91 → 92%
Camera
37 / 75 → 49%
Gemiddelde
65%
82%
Convertible - Gewogen Gemiddelde
CO2 Emissions
No Data
Materials
50%
Packaging
100%
Power Use
77.9%
Repairability
40%
Software Updates
22.3%
Recycle Logo Total Sustainability Score: 48.4%

Transparantie

De selectie van te beoordelen apparaten wordt gemaakt door onze redactie. Het testexemplaar werd ten behoeve van deze beoordeling door de fabrikant of detailhandelaar in bruikleen aan de auteur verstrekt. De kredietverstrekker had geen invloed op deze recensie, noch ontving de fabrikant vóór publicatie een exemplaar van deze recensie. Er bestond geen verplichting om deze recensie te publiceren. Wij accepteren nooit een compensatie of betaling in ruil voor onze beoordelingen. Als onafhankelijk mediabedrijf is Notebookcheck niet onderworpen aan het gezag van fabrikanten, detailhandelaren of uitgevers.

[transparency_disclaimer]

Dit is hoe Notebookcheck test

Elk jaar beoordeelt Notebookcheck onafhankelijk honderden laptops en smartphones met behulp van gestandaardiseerde procedures om ervoor te zorgen dat alle resultaten vergelijkbaar zijn. We hebben onze testmethoden al zo'n 20 jaar voortdurend ontwikkeld en daarbij de industriestandaard bepaald. In onze testlaboratoria wordt gebruik gemaakt van hoogwaardige meetapparatuur door ervaren technici en redacteuren. Deze tests omvatten een validatieproces in meerdere fasen. Ons complexe beoordelingssysteem is gebaseerd op honderden goed onderbouwde metingen en benchmarks, waardoor de objectiviteit behouden blijft. Meer informatie over onze testmethoden kunt u hier vinden.

Price comparison

Please share our article, every link counts!
Mail Logo
> Overzichten en testrapporten over laptops en mobieltjes > Testrapporten > Mini-LED op een 16-inch convertible: Dell Inspiron 16 7640 2-in-1 beoordeling
Allen Ngo, 2024-07-20 (Update: 2024-07-20)