

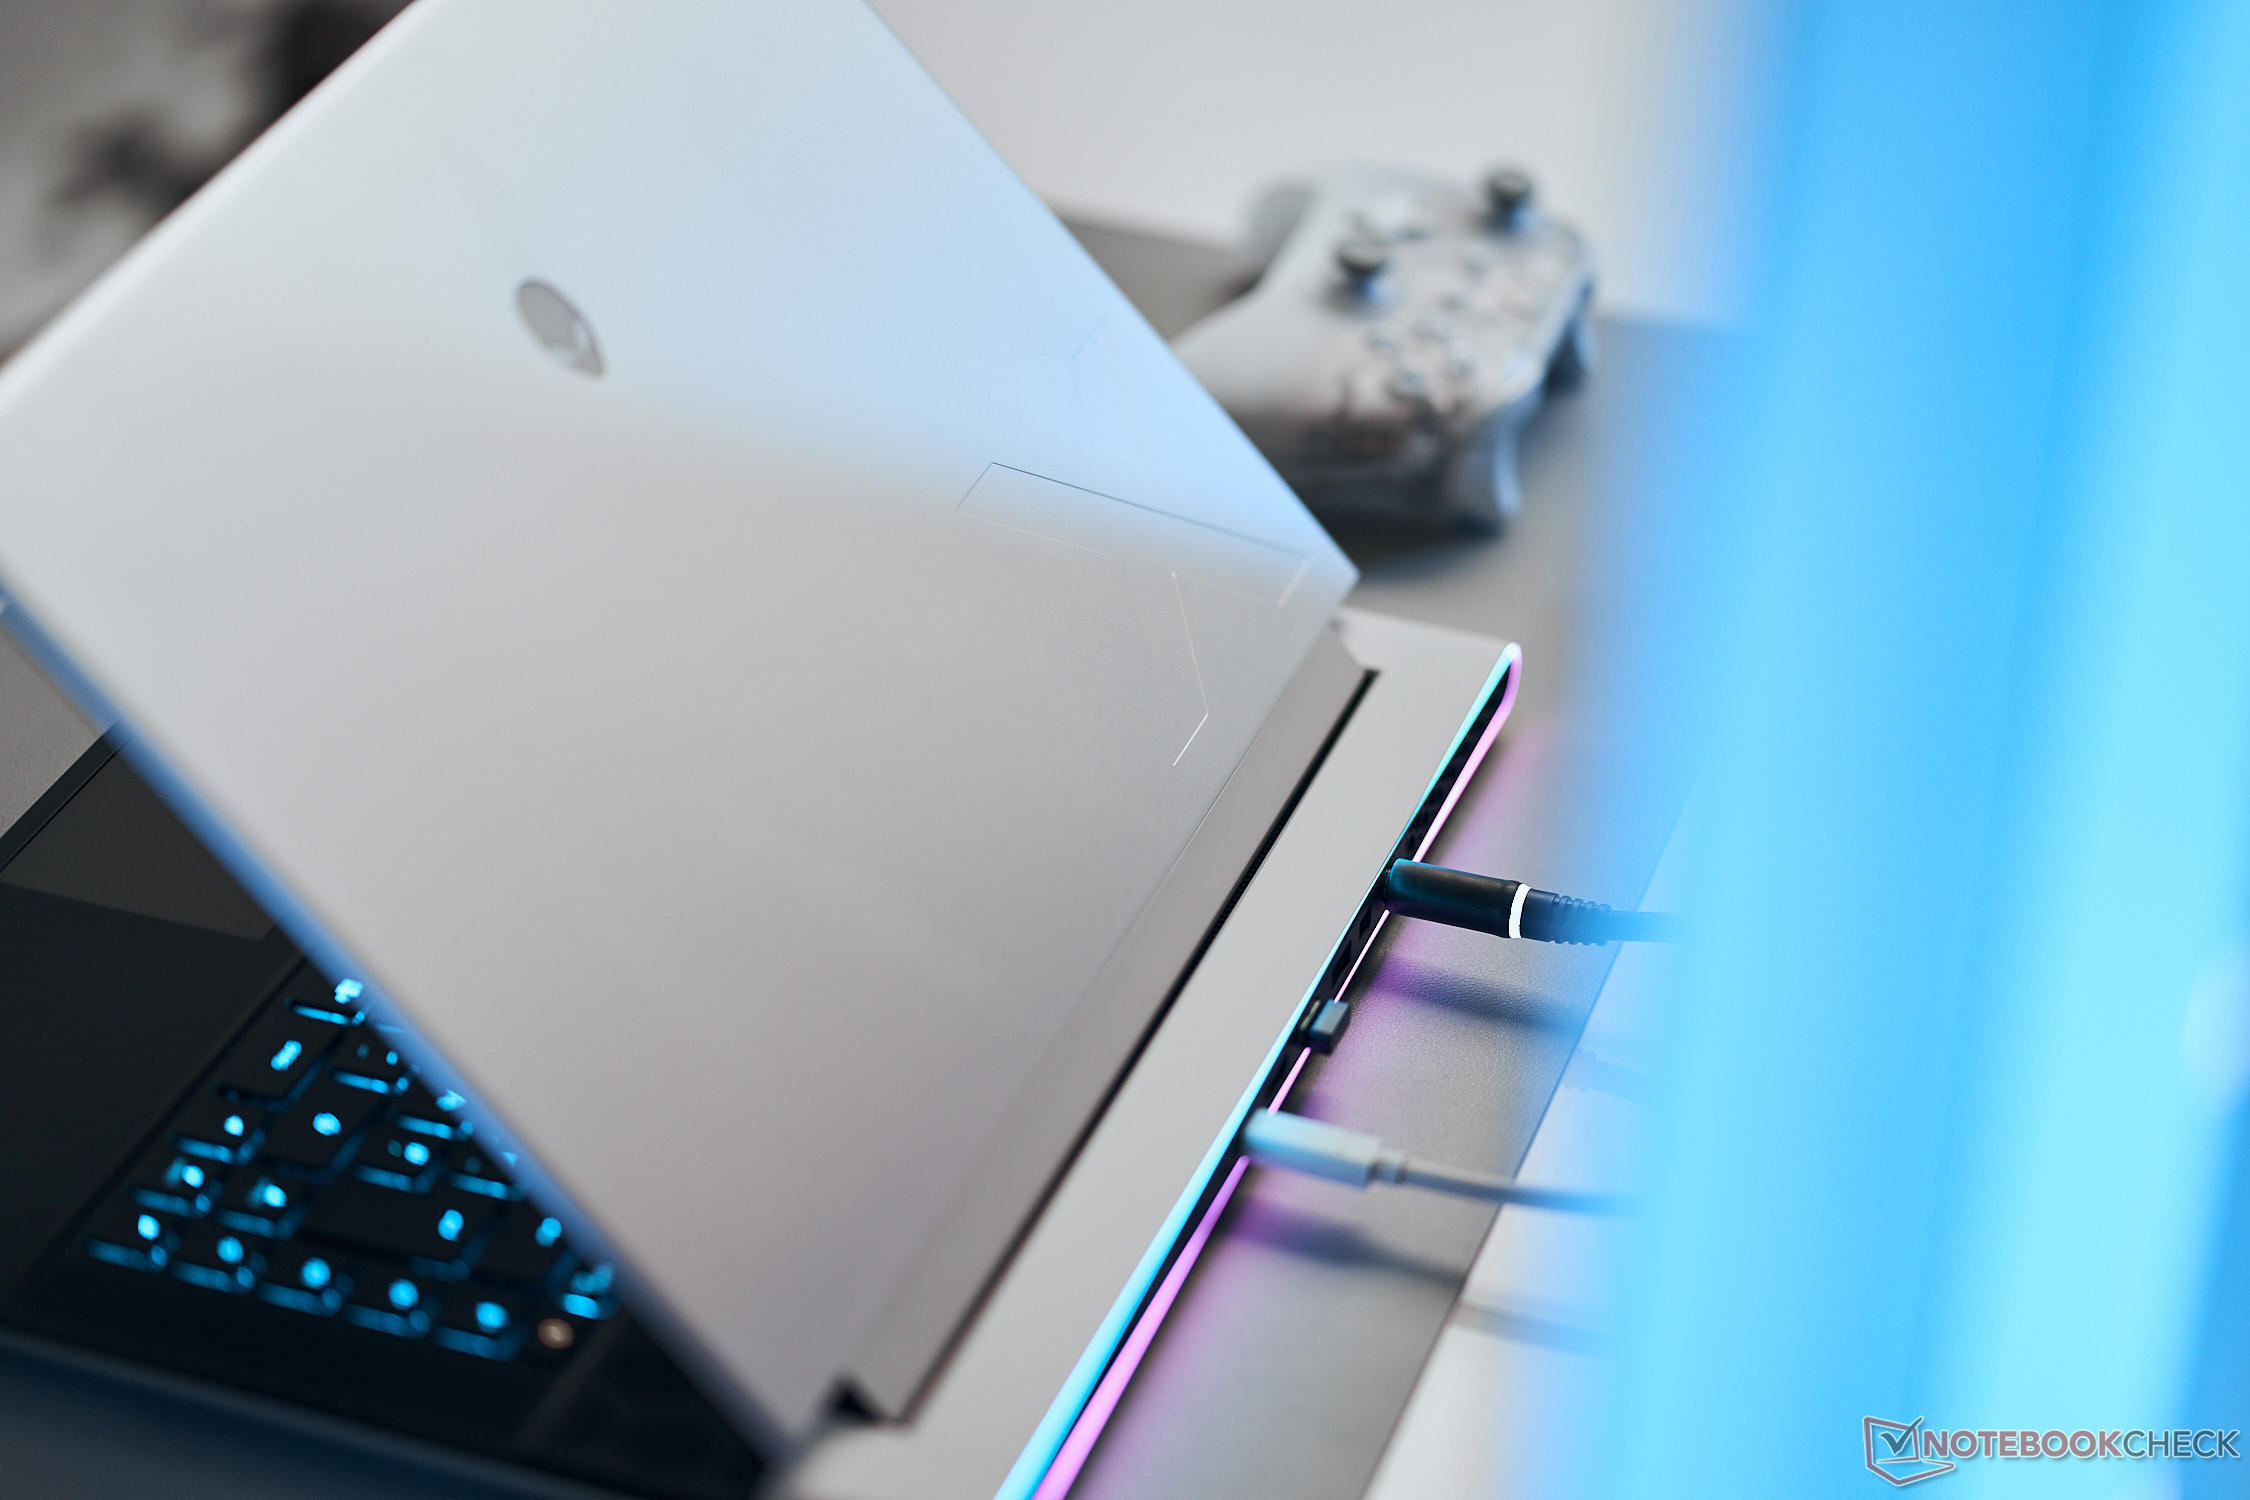
Alienware x16 R2 laptop test: Een stap opzij ten opzichte van de x16 R1

De ultradunne Alienware x16-serie werd eind vorig jaar gelanceerd met het debuut van de Alienware x16 R1. Voor 2024 is de serie opgefrist met de x16 R2. Het nieuwere model vervangt de oudere Raptor Lake-H processoropties door AI-ready Meteor Lake-H opties, terwijl al het andere in essentie hetzelfde blijft als het originele x16 R1 ontwerp. We raden u daarom aan om onze recensie van de x16 R1 omdat de meeste van onze opmerkingen nog steeds van toepassing zijn op de visueel identieke x16 R2. Alle opmerkelijke verschillen worden in deze recensie vermeld.
Ons apparaat in deze review is een high-end configuratie met de Core Ultra 9 185H CPU, 175 W GeForce RTX 4080 GPU, 1600p 240 Hz beeldscherm en ultra-low profile CherryMX mechanische toetsen voor ongeveer $3200 USD. Andere SKU's zijn gewone membraantoetsen en de Core Ultra 7 155H met GeForce RTX 4060, 4070 of 4090 grafische processor en 1200p 480 Hz IPS-scherm.
Alternatieven voor de Alienware x16 R2 zijn onder andere andere high-end 16-inch gaming laptops zoals de Razer Blade 16,Asus ROG Strix Scar 16,Lenovo Legion Pro 7 16of MSI Vector 16 HX.
Meer Dell beoordelingen:
Potentiële concurrenten in vergelijkings
Evaluatie | Datum | Model | Gewicht | Hoogte | Formaat | Resolutie | Beste prijs |
|---|---|---|---|---|---|---|---|
| 88.4 % v7 (old) | 05-2024 | Alienware x16 R2 P120F Ultra 9 185H, NVIDIA GeForce RTX 4080 Laptop GPU | 2.7 kg | 18.57 mm | 16.00" | 2560x1600 | |
| 88.4 % v7 (old) | 06-2023 | Alienware x16 R1 i9-13900HK, NVIDIA GeForce RTX 4080 Laptop GPU | 2.6 kg | 18.57 mm | 16.00" | 2560x1600 | Alternative specs
USD 3,299.99
|
| 90.2 % v7 (old) | 03-2024 | Alienware m16 R2 Ultra 7 155H, NVIDIA GeForce RTX 4070 Laptop GPU | 2.5 kg | 23.5 mm | 16.00" | 2560x1600 | from EUR 1850 |
| 87.6 % v7 (old) | 04-2024 | Asus ROG Strix Scar 16 G634JZR i9-14900HX, NVIDIA GeForce RTX 4080 Laptop GPU | 2.7 kg | 30.4 mm | 16.00" | 2560x1600 | |
| 89.5 % v7 (old) | 03-2024 | Lenovo Legion Pro 7 16IRX9H i9-14900HX, NVIDIA GeForce RTX 4080 Laptop GPU | 2.7 kg | 21.95 mm | 16.00" | 2560x1600 | |
| 88 % v7 (old) | 02-2024 | MSI Vector 16 HX A14V i9-14900HX, NVIDIA GeForce RTX 4080 Laptop GPU | 2.7 kg | 28.55 mm | 16.00" | 2560x1600 |
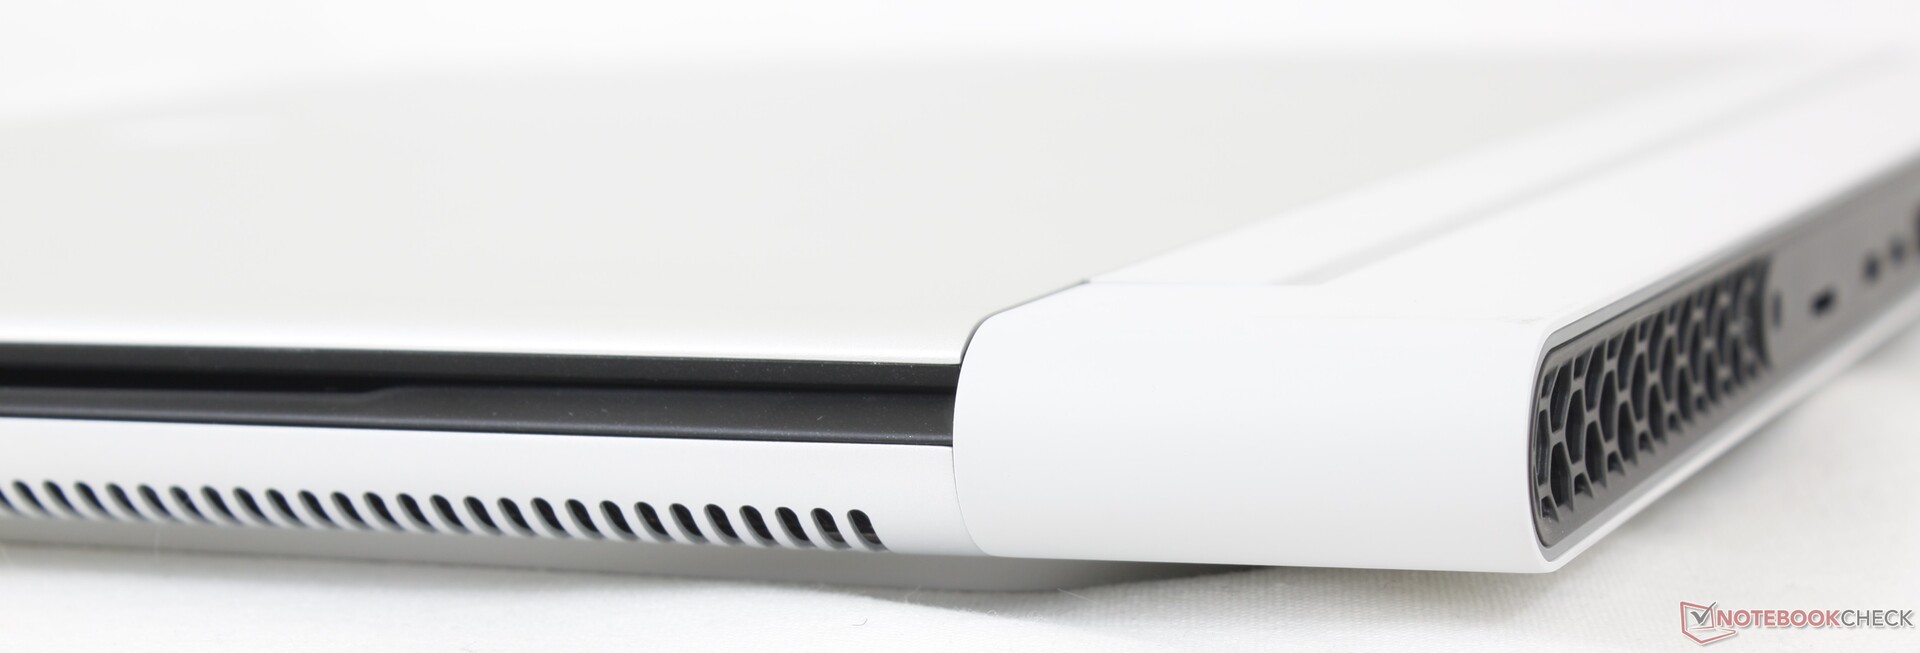
Geval - Geen externe wijzigingen
Connectiviteit


SD-kaartlezer
Interessant genoeg vertoonde de MicroSD-lezer op onze x16 R2 geen van de overdrachtsnelheidsproblemen die we op de x16 R1 van vorig jaar ondervonden.
| SD Card Reader | |
| average JPG Copy Test (av. of 3 runs) | |
| Alienware x16 R2 P120F (AV PRO microSD 128 GB V60) | |
| MSI Vector 16 HX A14V (Toshiba Exceria Pro SDXC 64 GB UHS-II) | |
| Alienware m16 R2 (AV PRO microSD 128 GB V60) | |
| Alienware x16 R1 (AV PRO microSD 128 GB V60) | |
| maximum AS SSD Seq Read Test (1GB) | |
| Alienware x16 R2 P120F (AV PRO microSD 128 GB V60) | |
| Alienware x16 R1 (AV PRO microSD 128 GB V60) | |
| Alienware m16 R2 (AV PRO microSD 128 GB V60) | |
| MSI Vector 16 HX A14V (Toshiba Exceria Pro SDXC 64 GB UHS-II) | |
Communicatie
Dell heeft de WLAN-module voor de update van dit jaar geüpgraded om Wi-Fi 7 te ondersteunen.
Webcam


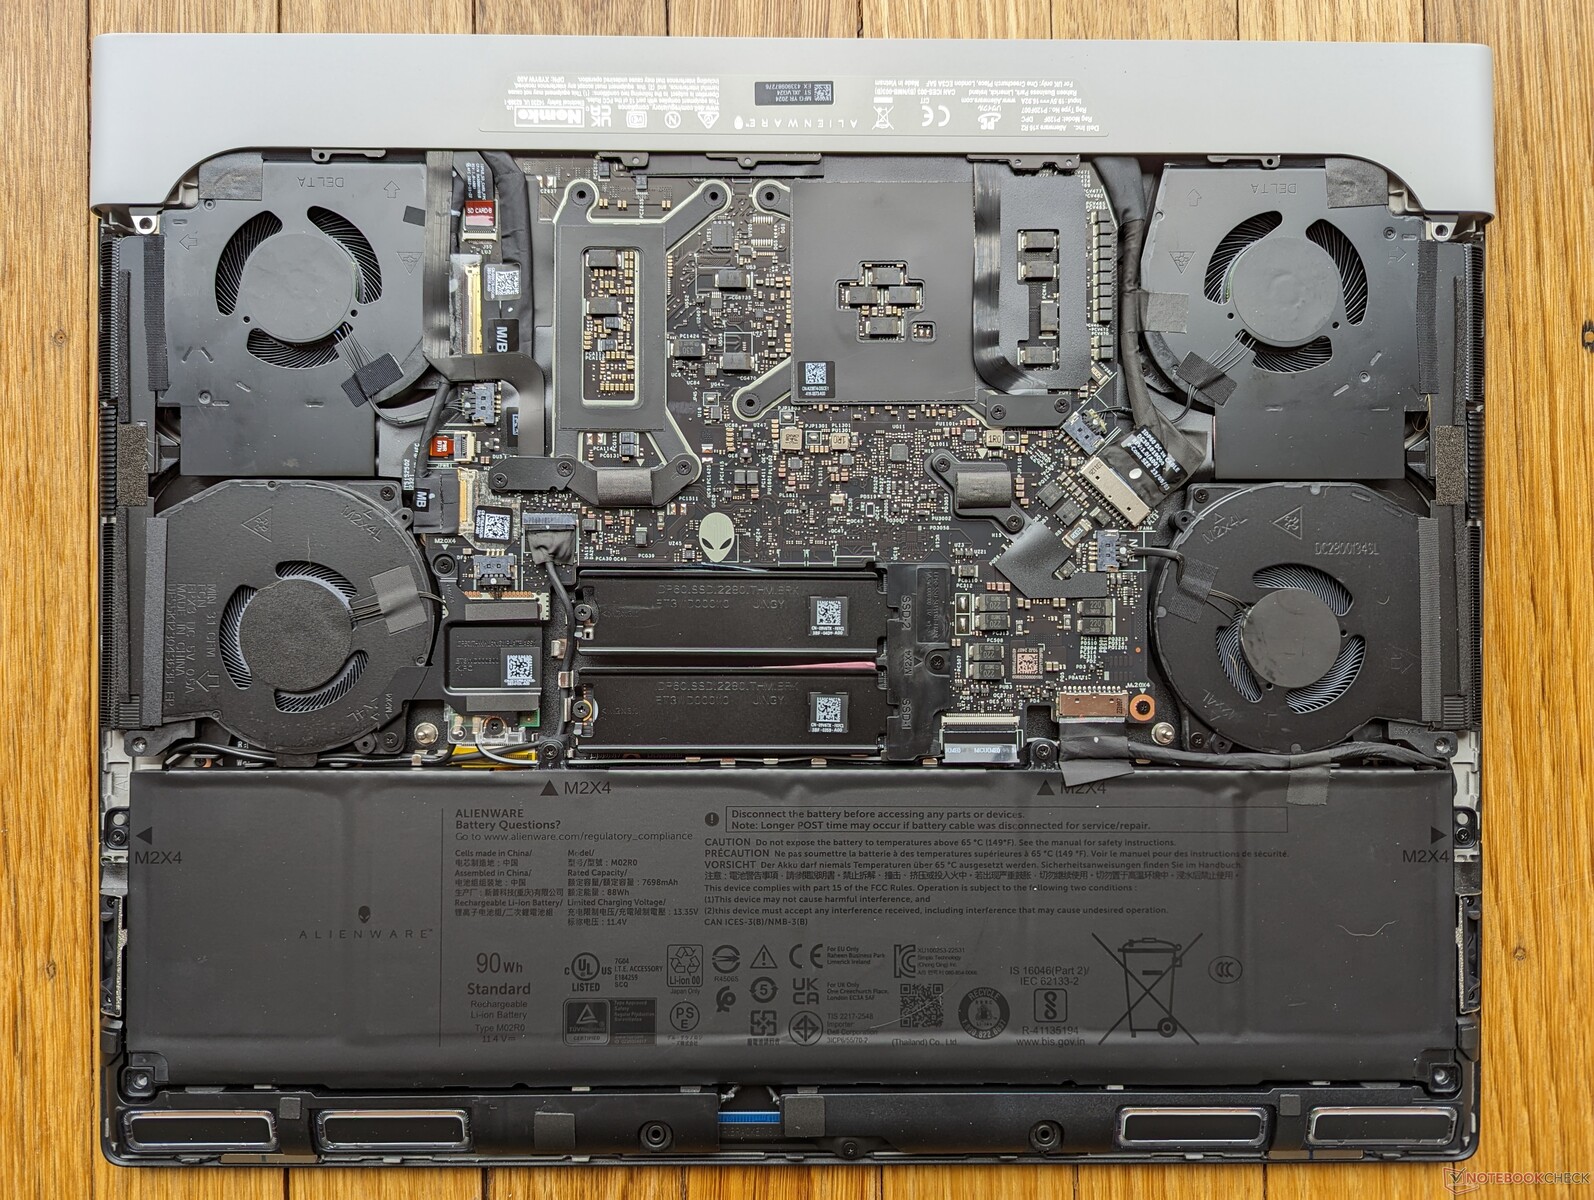
Onderhoud

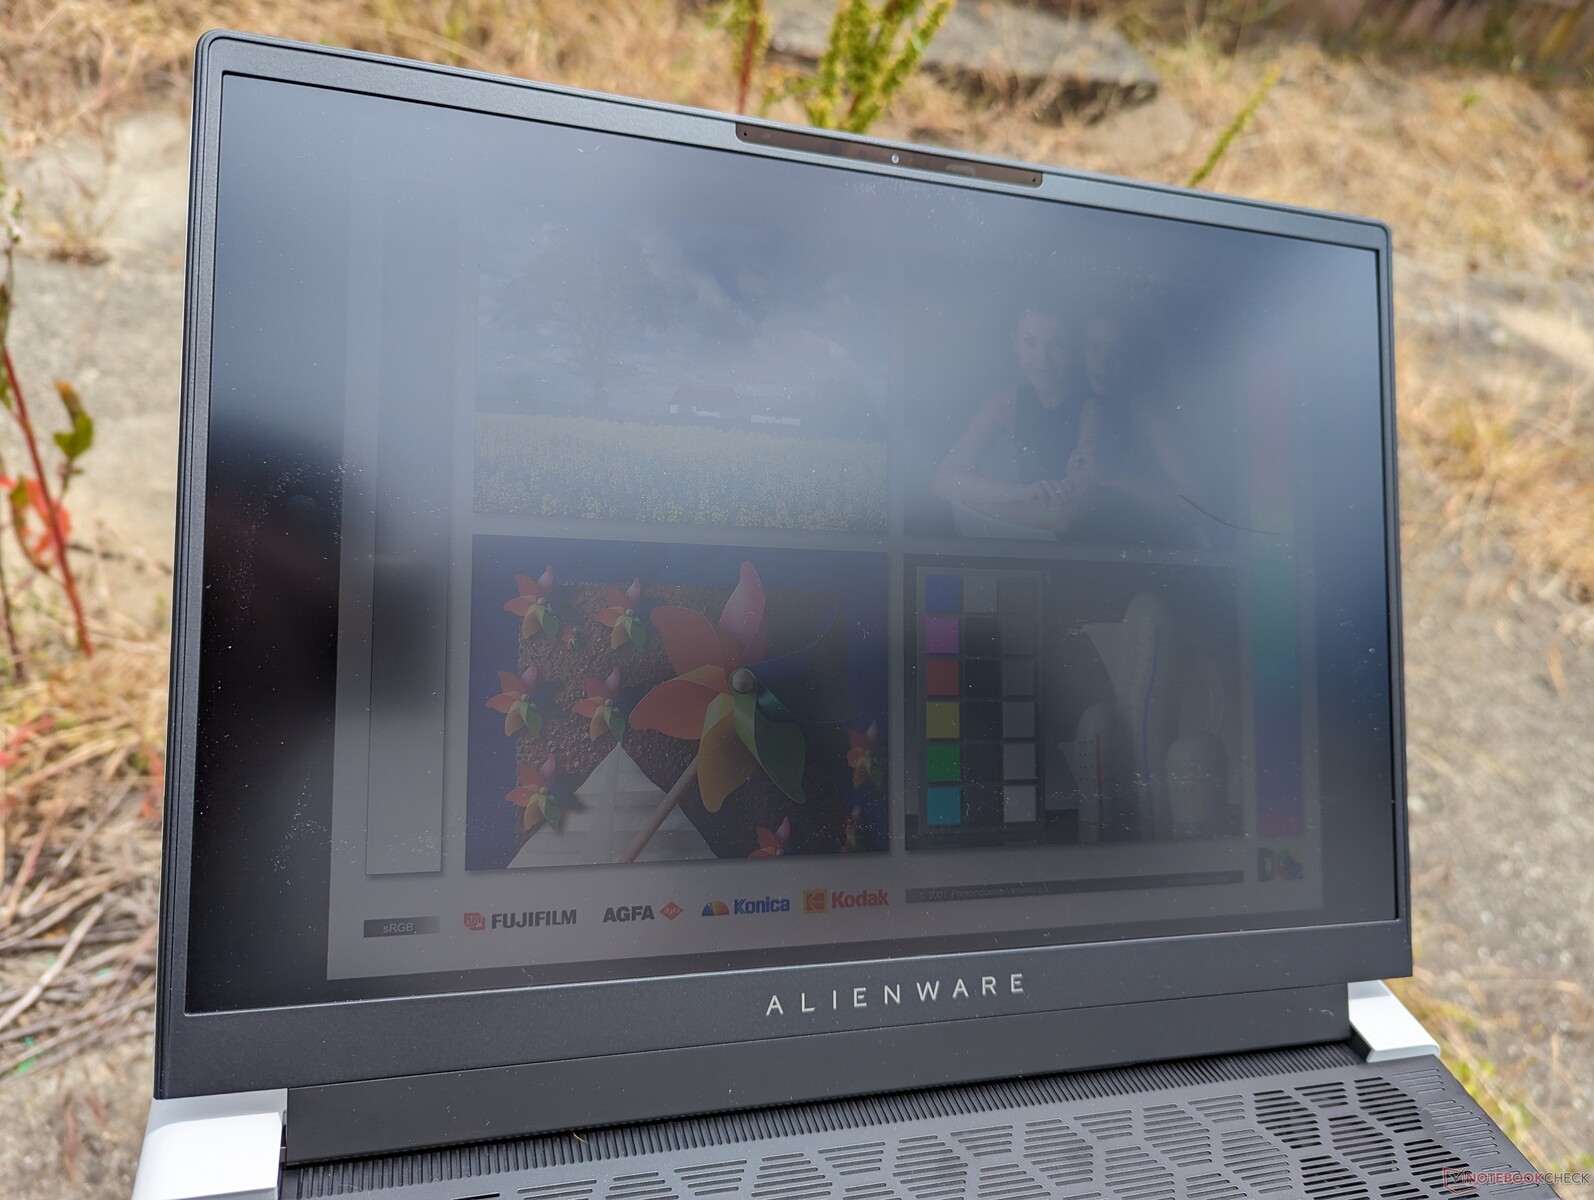
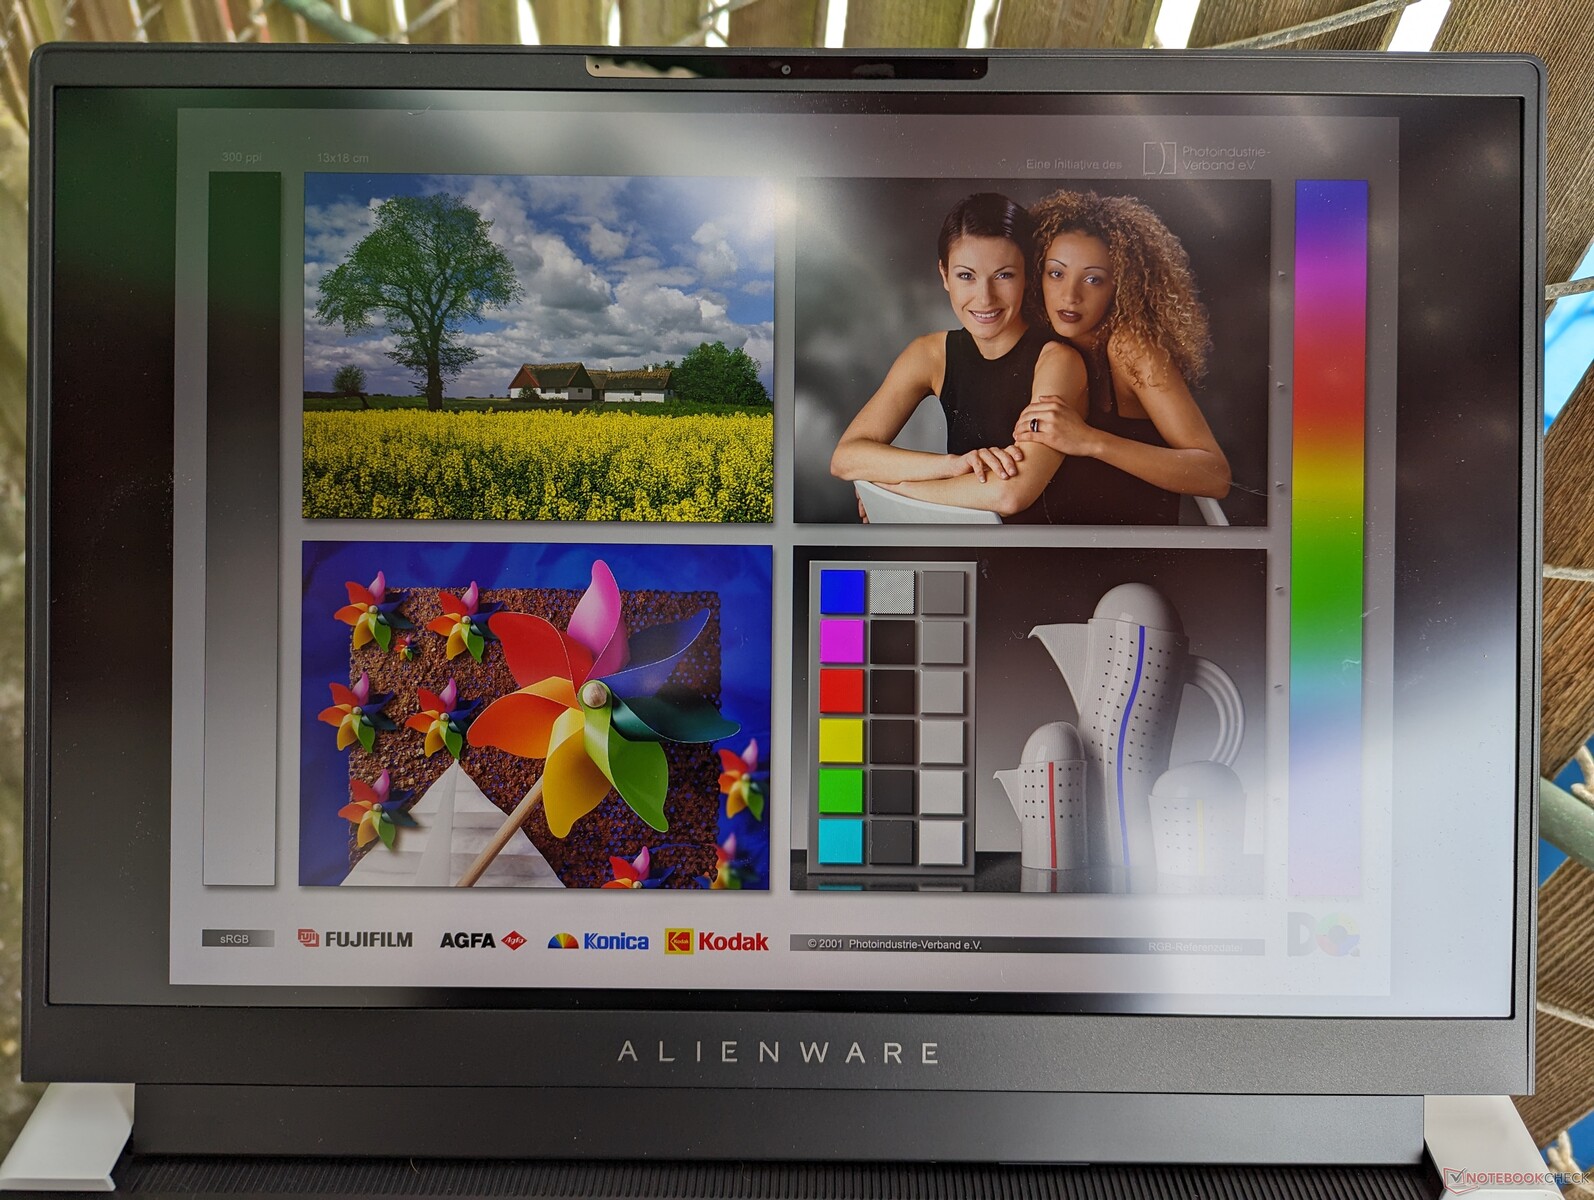
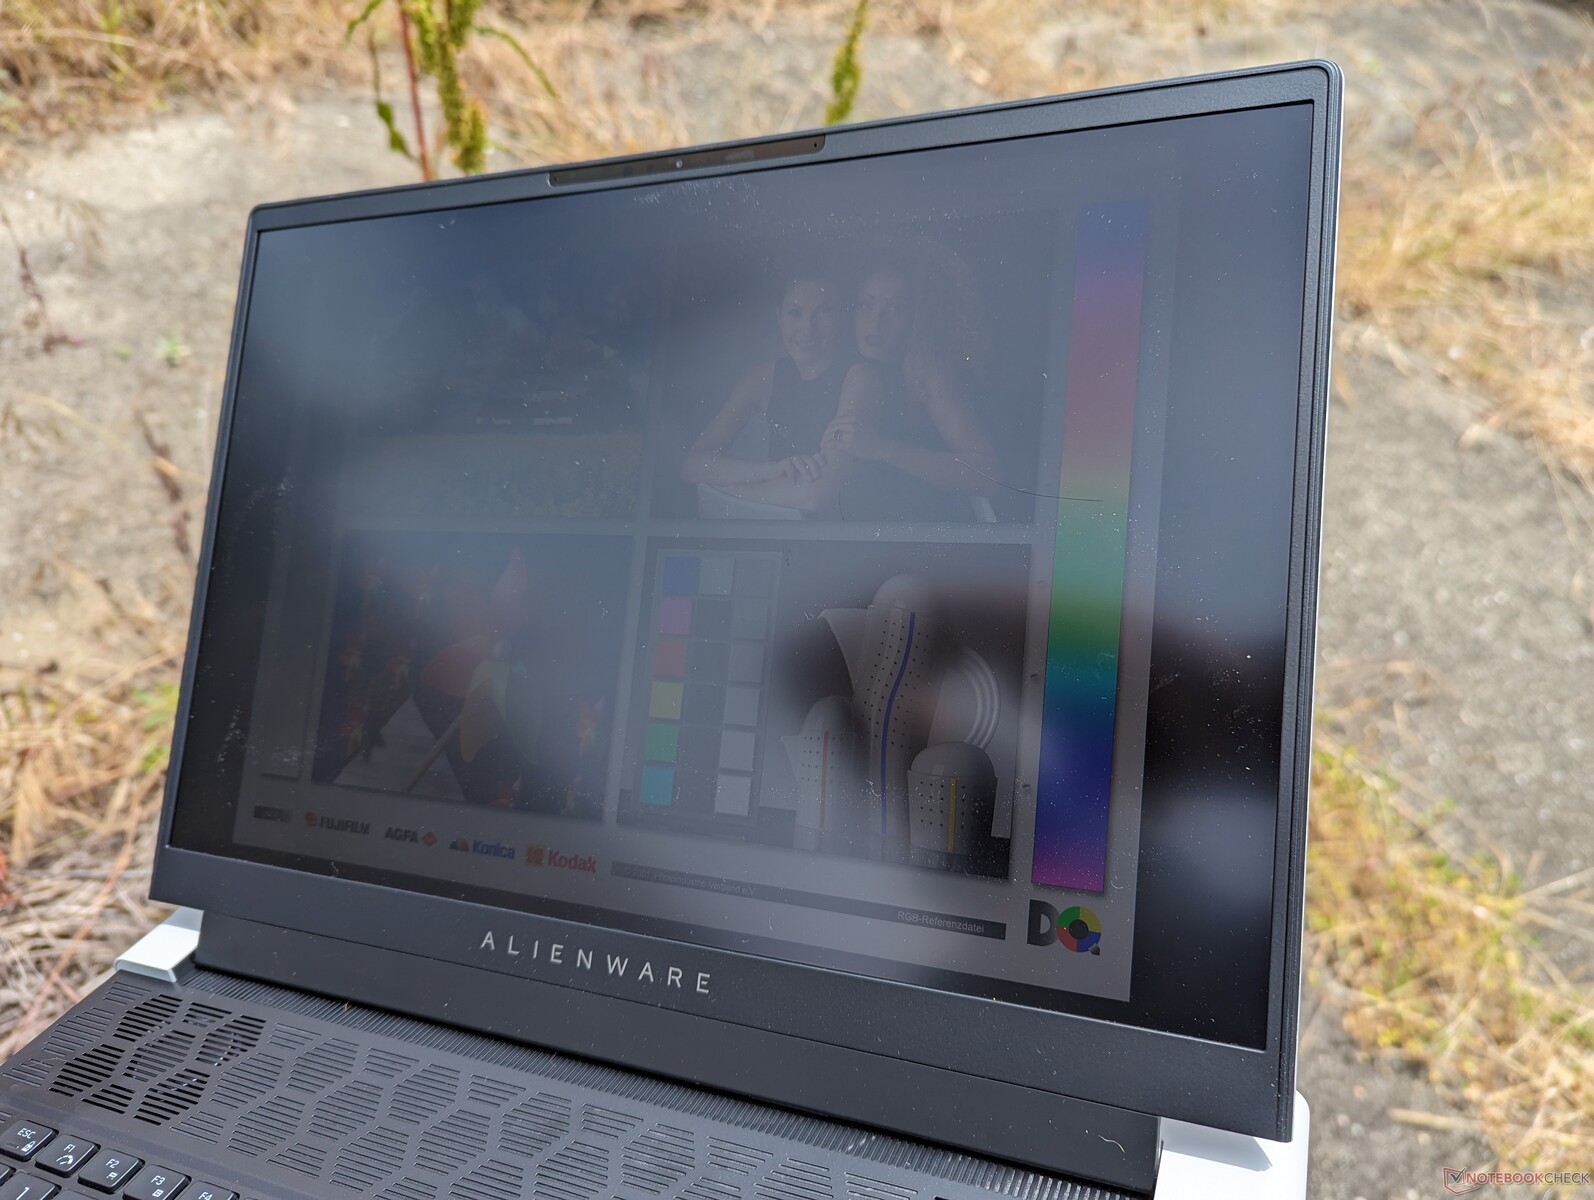
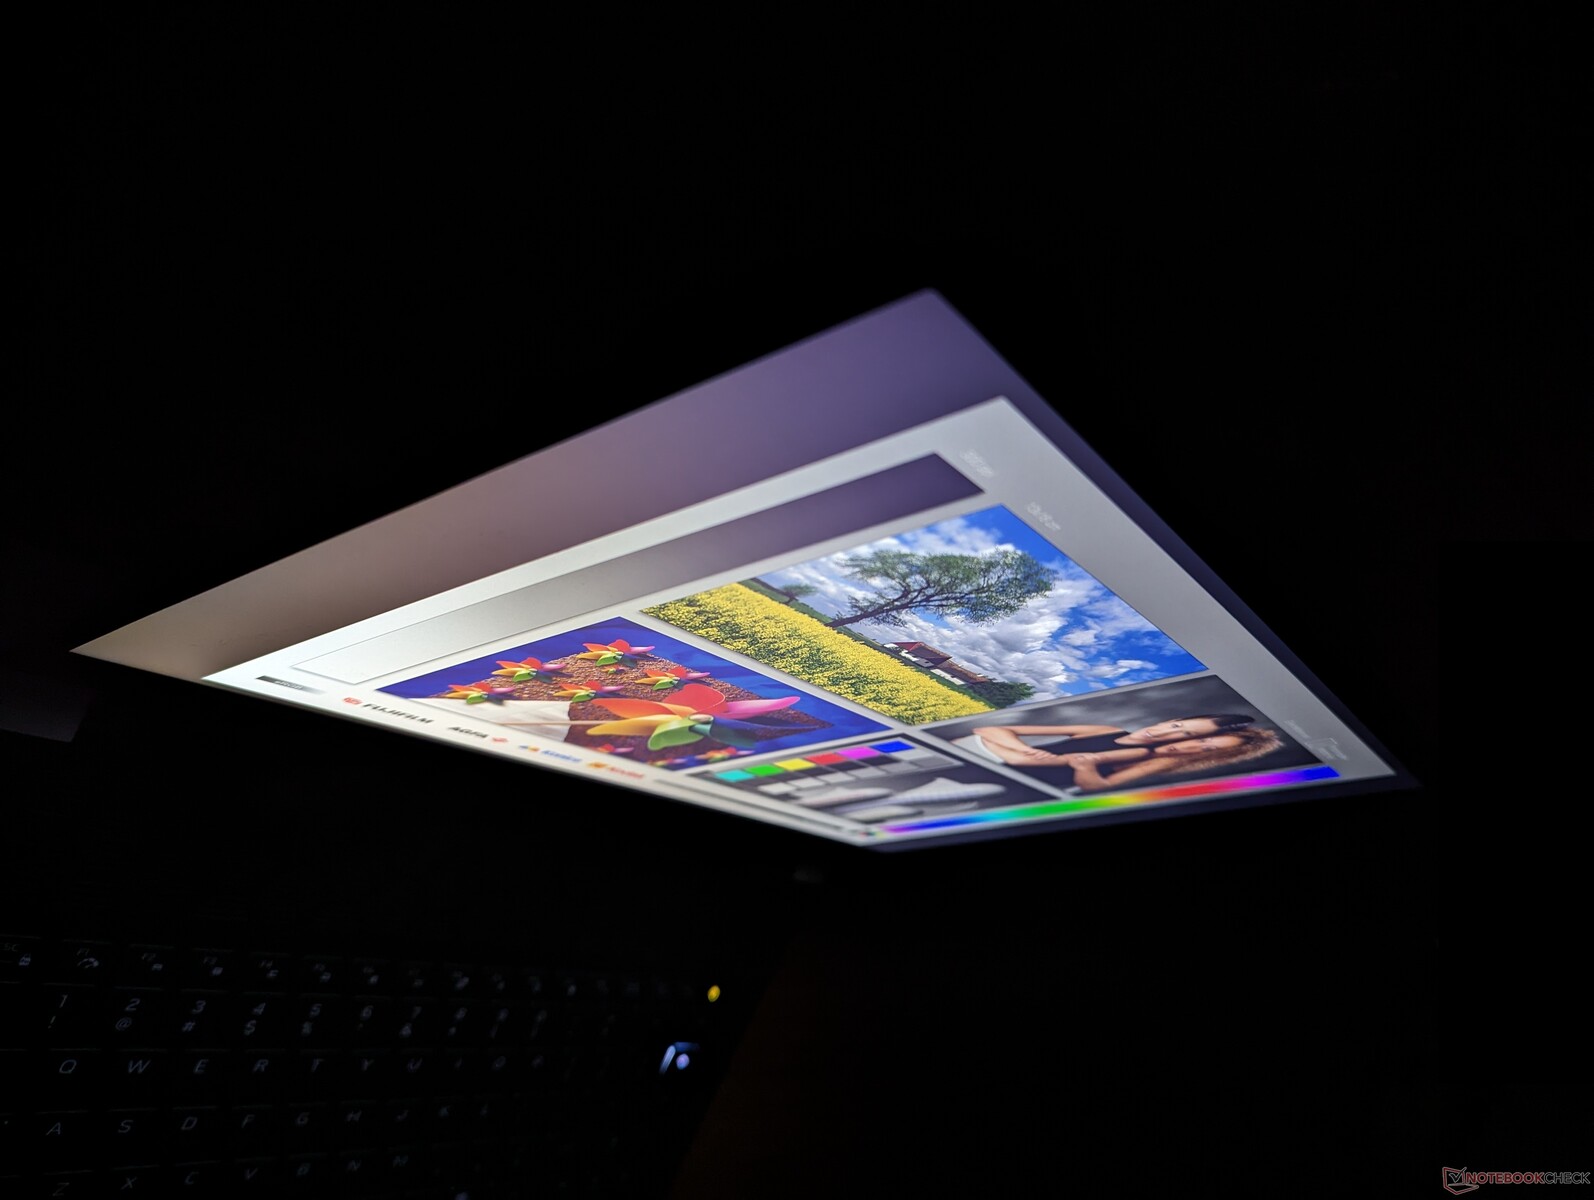
Display - Geen 165 Hz optie meer
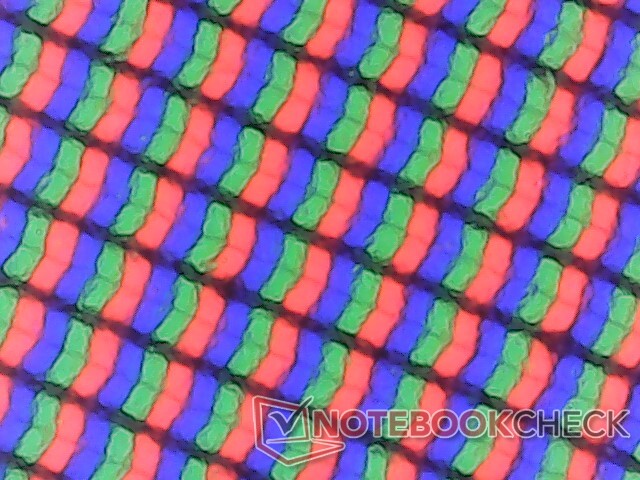
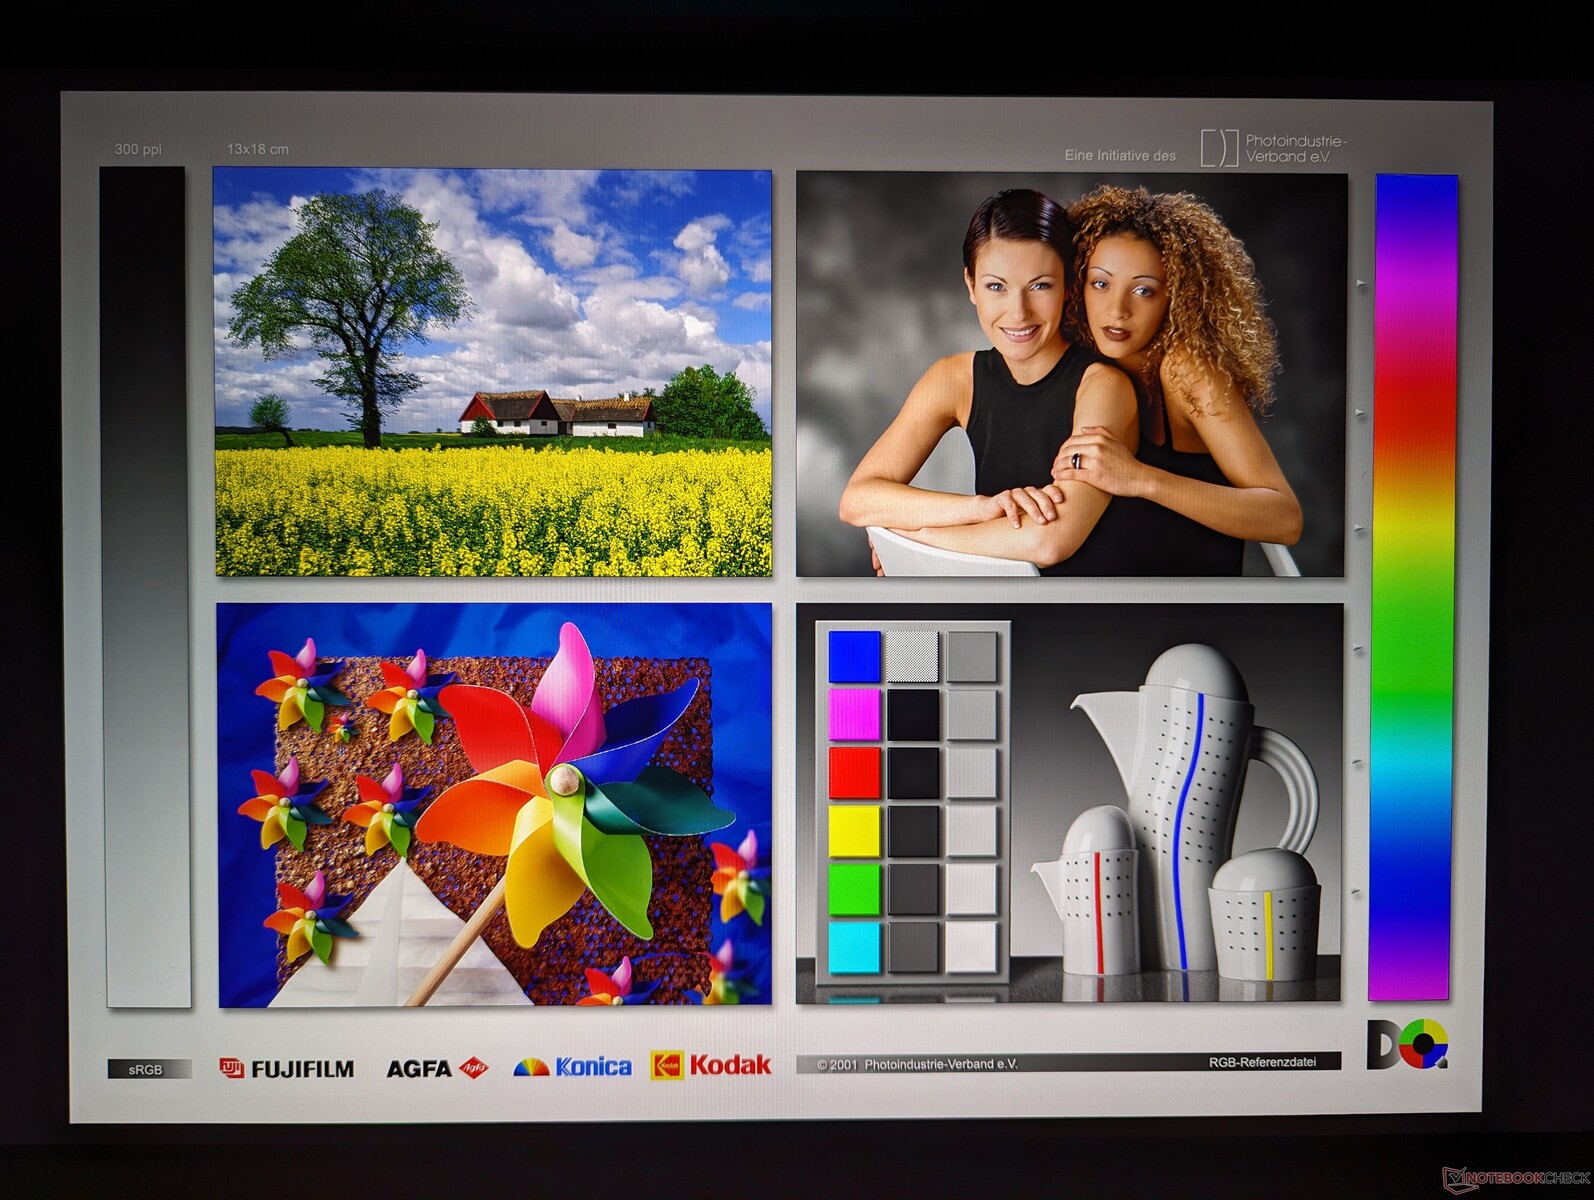
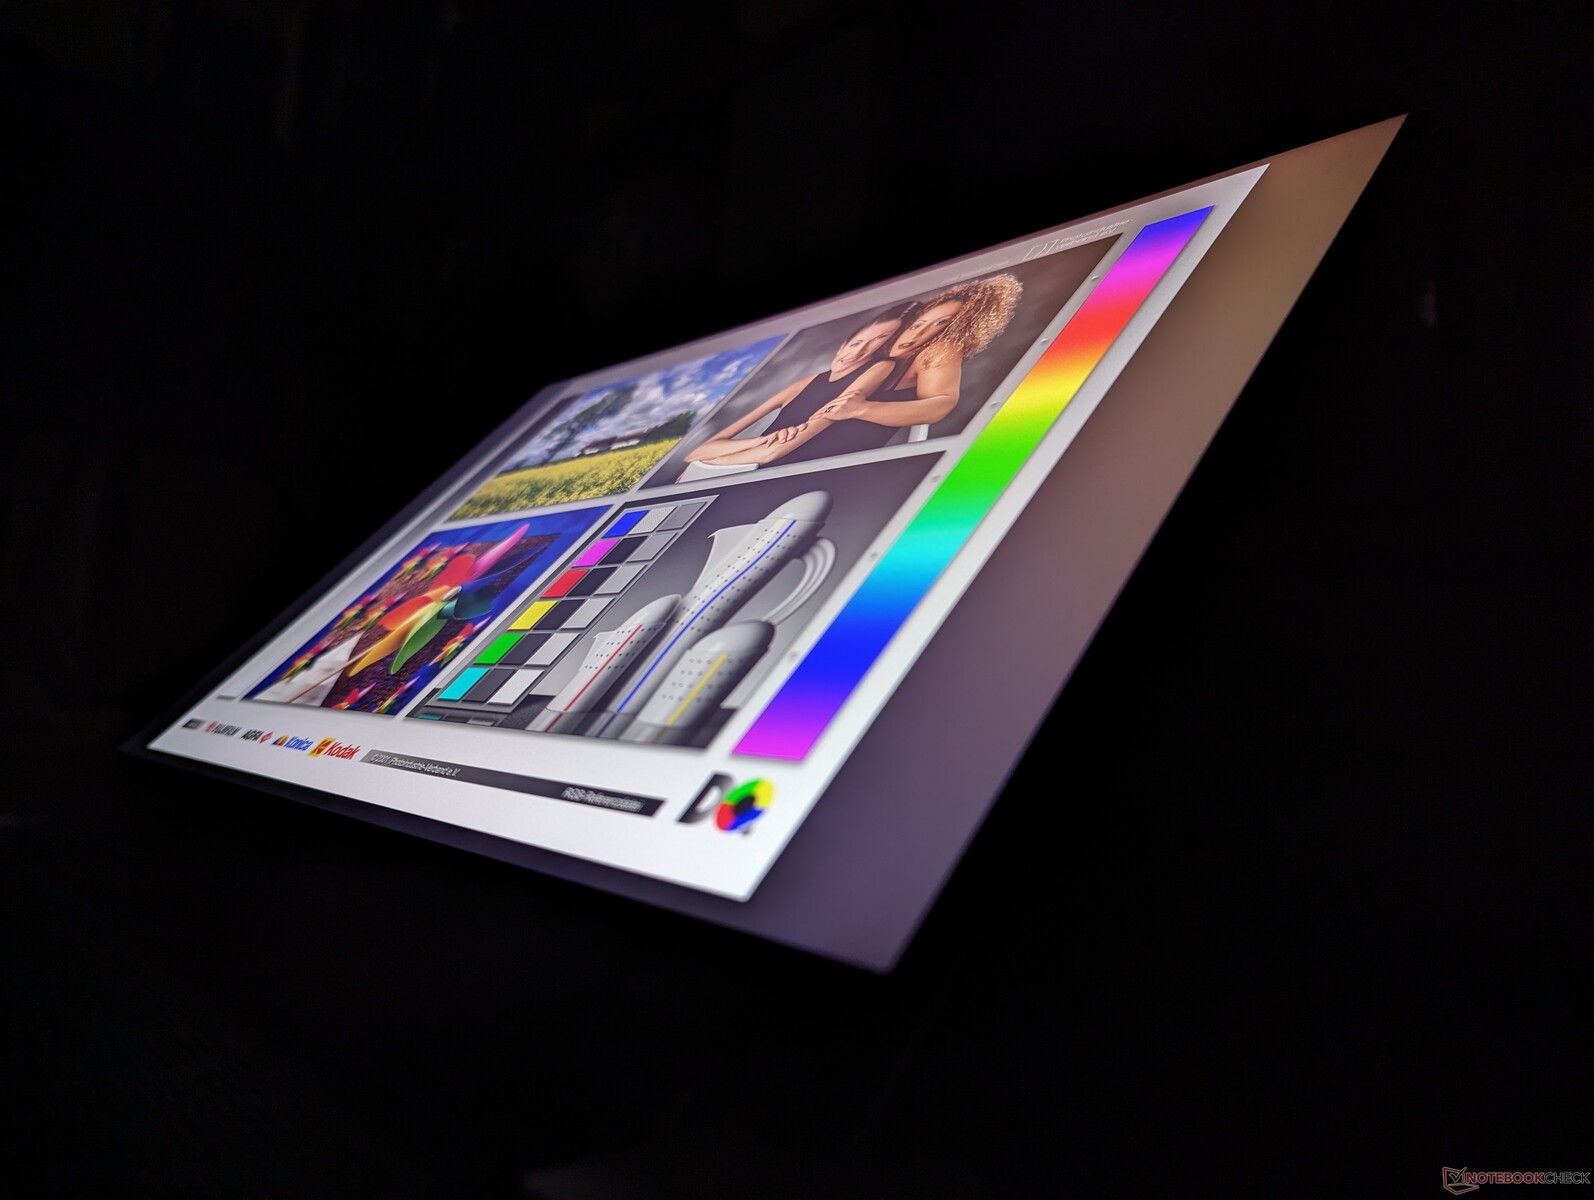
Dell heeft het BOE NE16NZ4 paneel op de x16 R1 van vorig jaar vervangen door de BOE B160QAN op de x16 R2 van dit jaar. De twee panelen zijn echter verder vrijwel identiek wat betreft kleurweergave, responstijden, helderheidsniveaus en contrast, voor een in wezen identieke kijkervaring.
De eigen vernieuwingsfrequentie kan worden ingesteld op 240 Hz of 60 Hz zonder variabele opties. G-Sync wordt alleen ondersteund wanneer het is ingesteld op de dGPU-modus en niet op de Optimus-modus.
Gebruikers kunnen configureren tussen twee beeldschermen zoals hieronder weergegeven, terwijl de x16 R1 er drie had:
- 2560 x 1600, 240 Hz, 100% DCI-P3, G-Sync, Advanced Optimus
- 1920 x 1200, 480 Hz, 100% DCI-P3, G-Sync, Advanced Optimus
| |||||||||||||||||||||||||
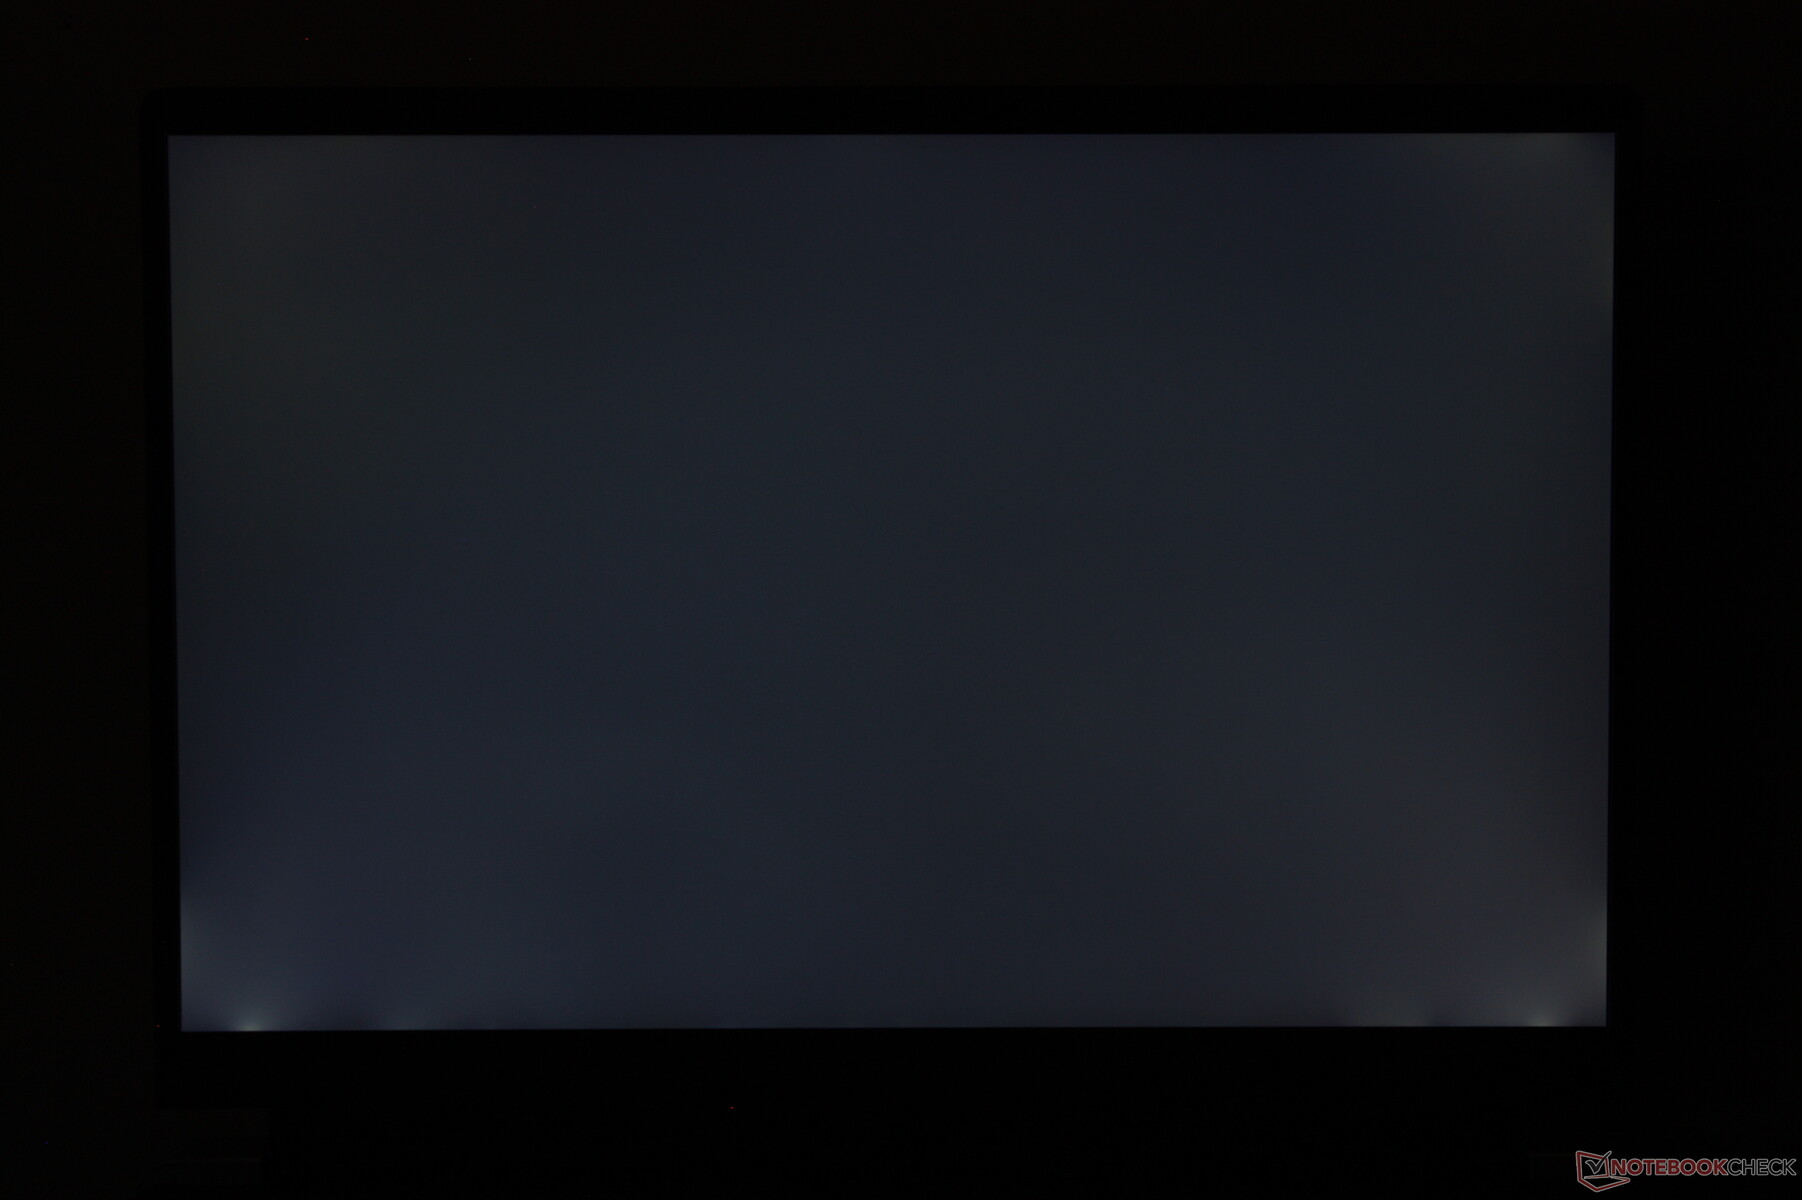
Helderheidsverdeling: 90 %
Helderheid in Batterij-modus: 348.4 cd/m²
Contrast: 1056:1 (Zwart: 0.33 cd/m²)
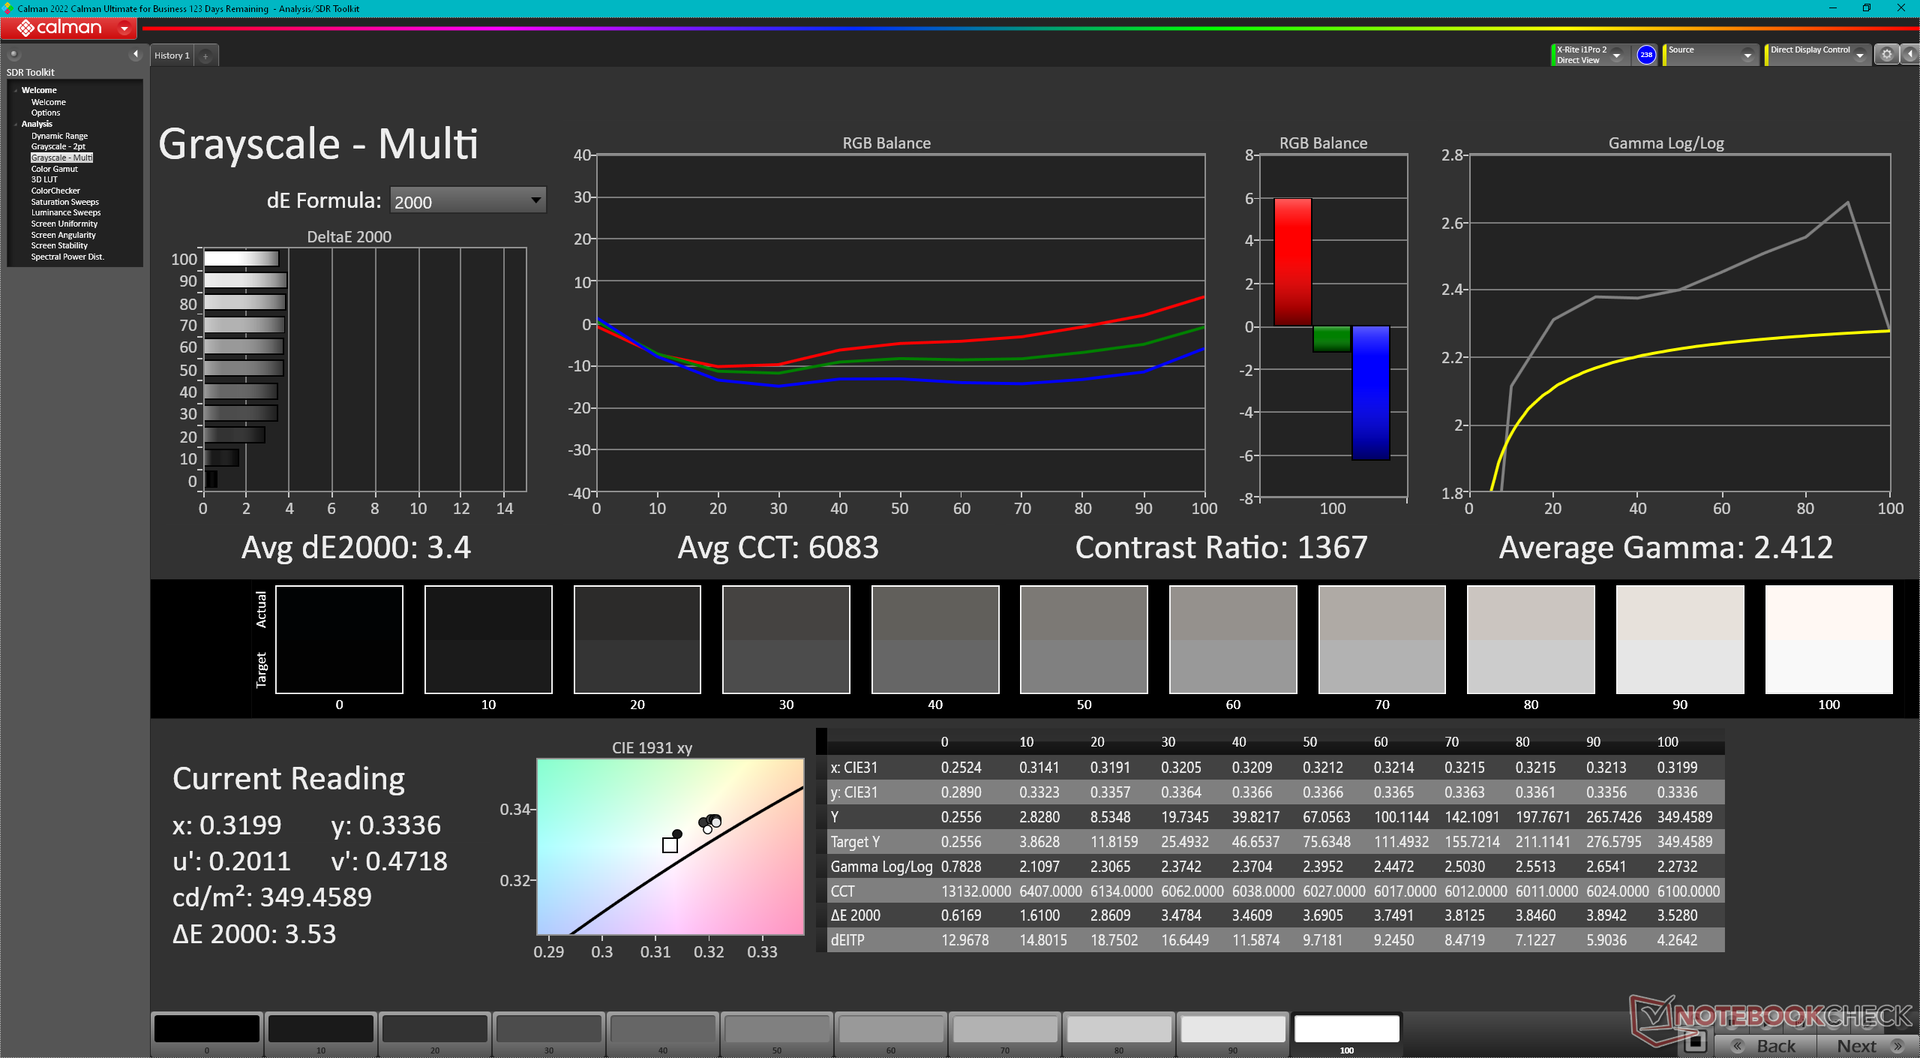
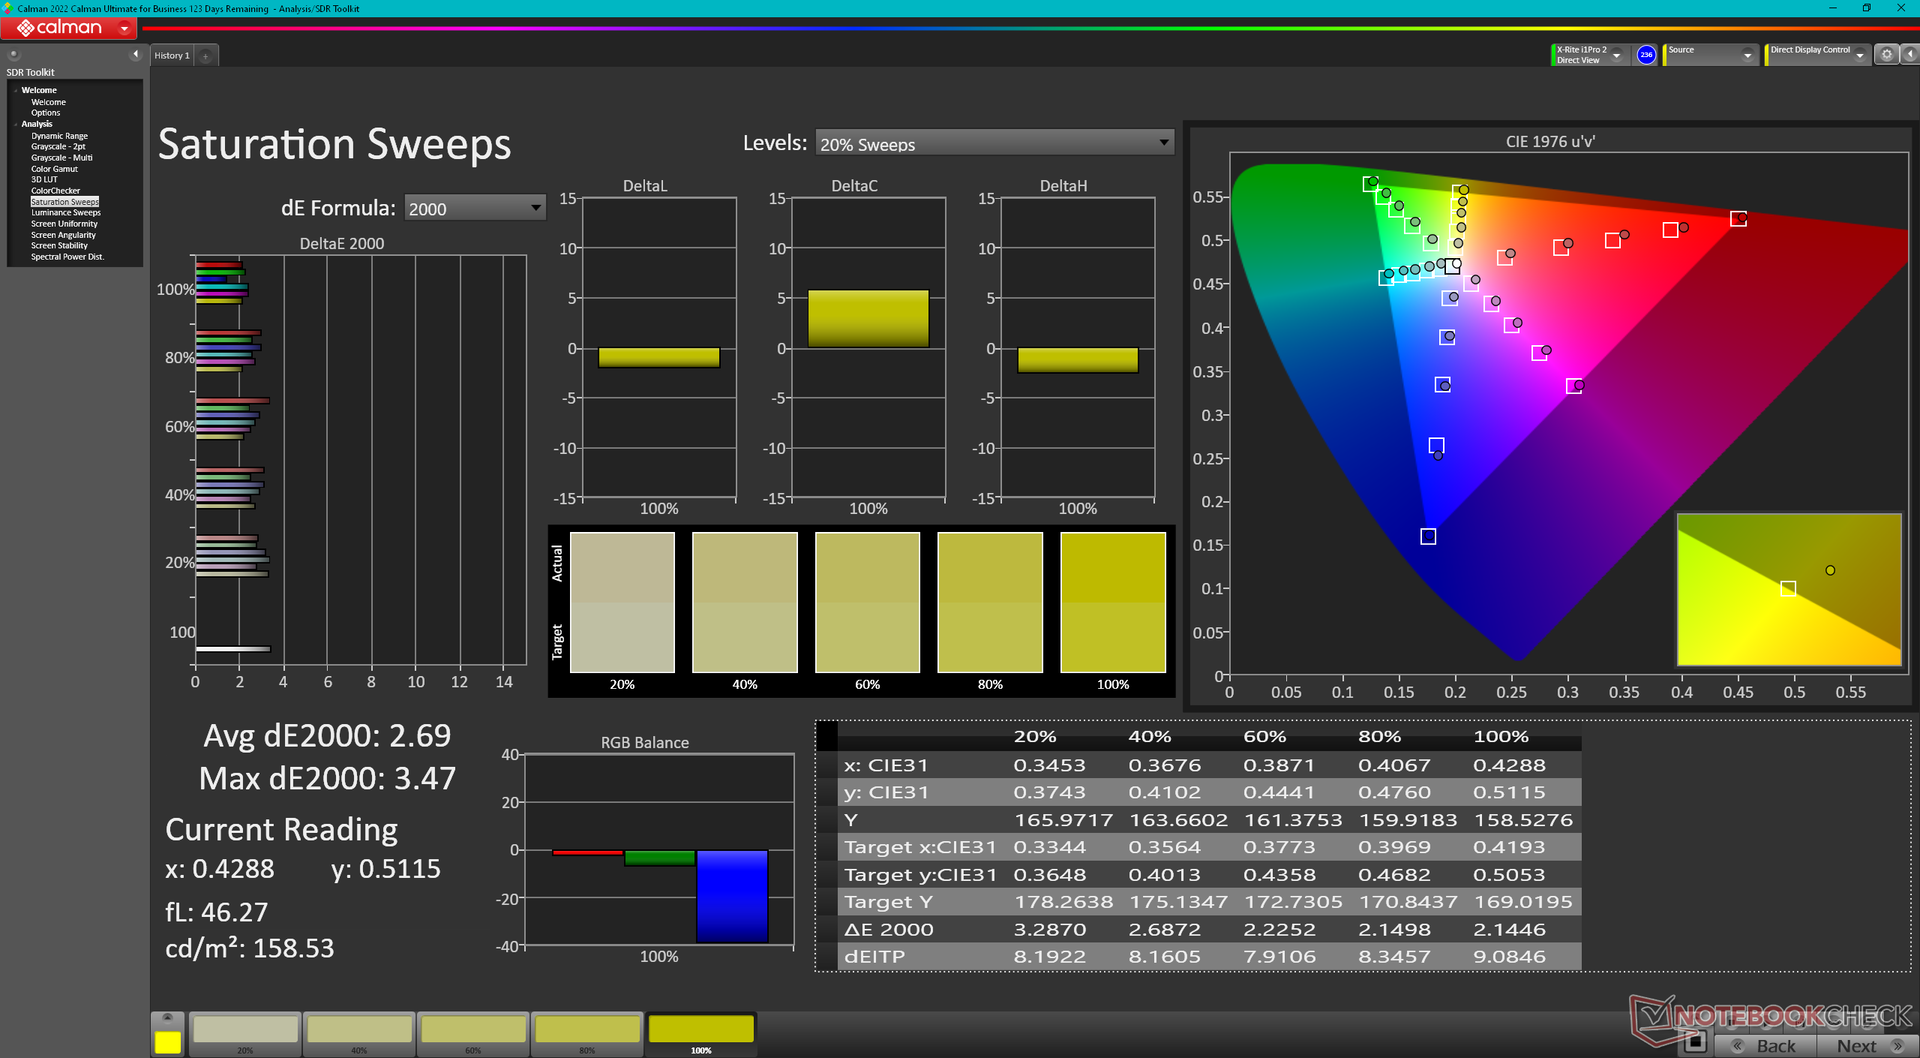
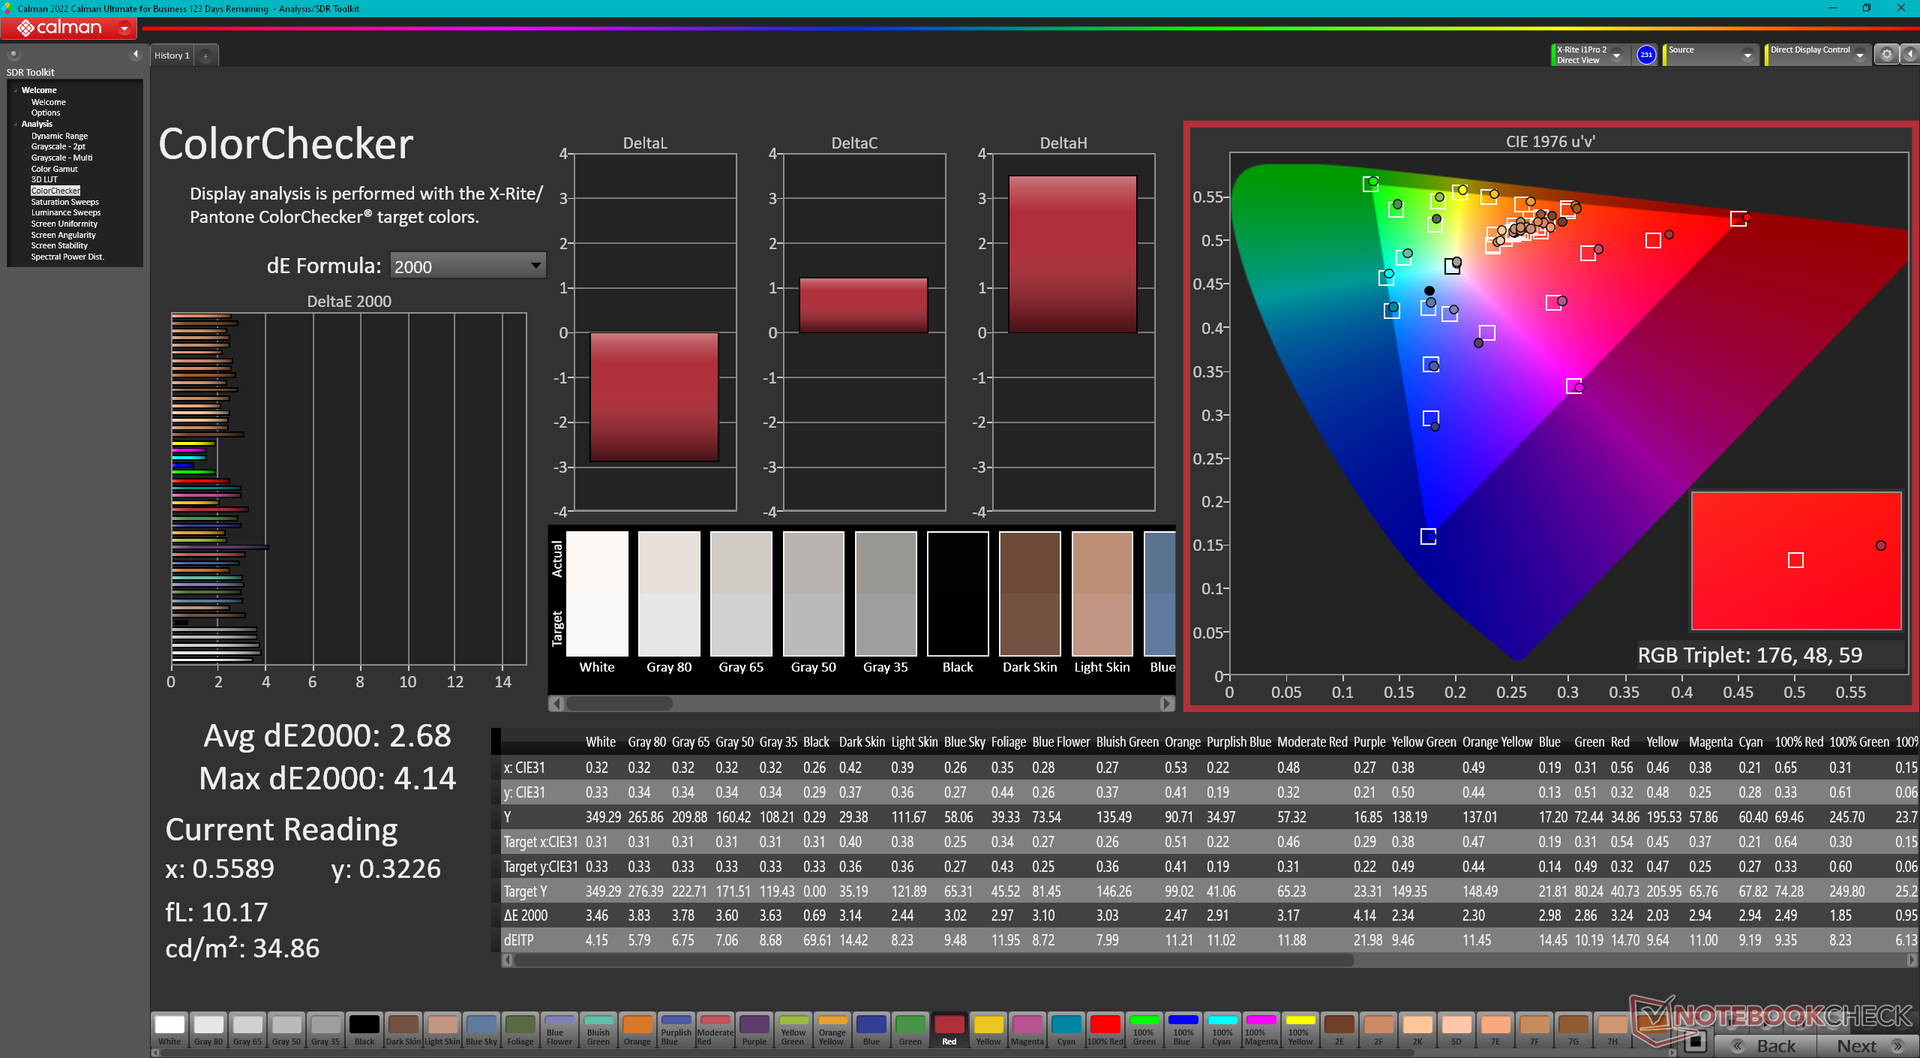
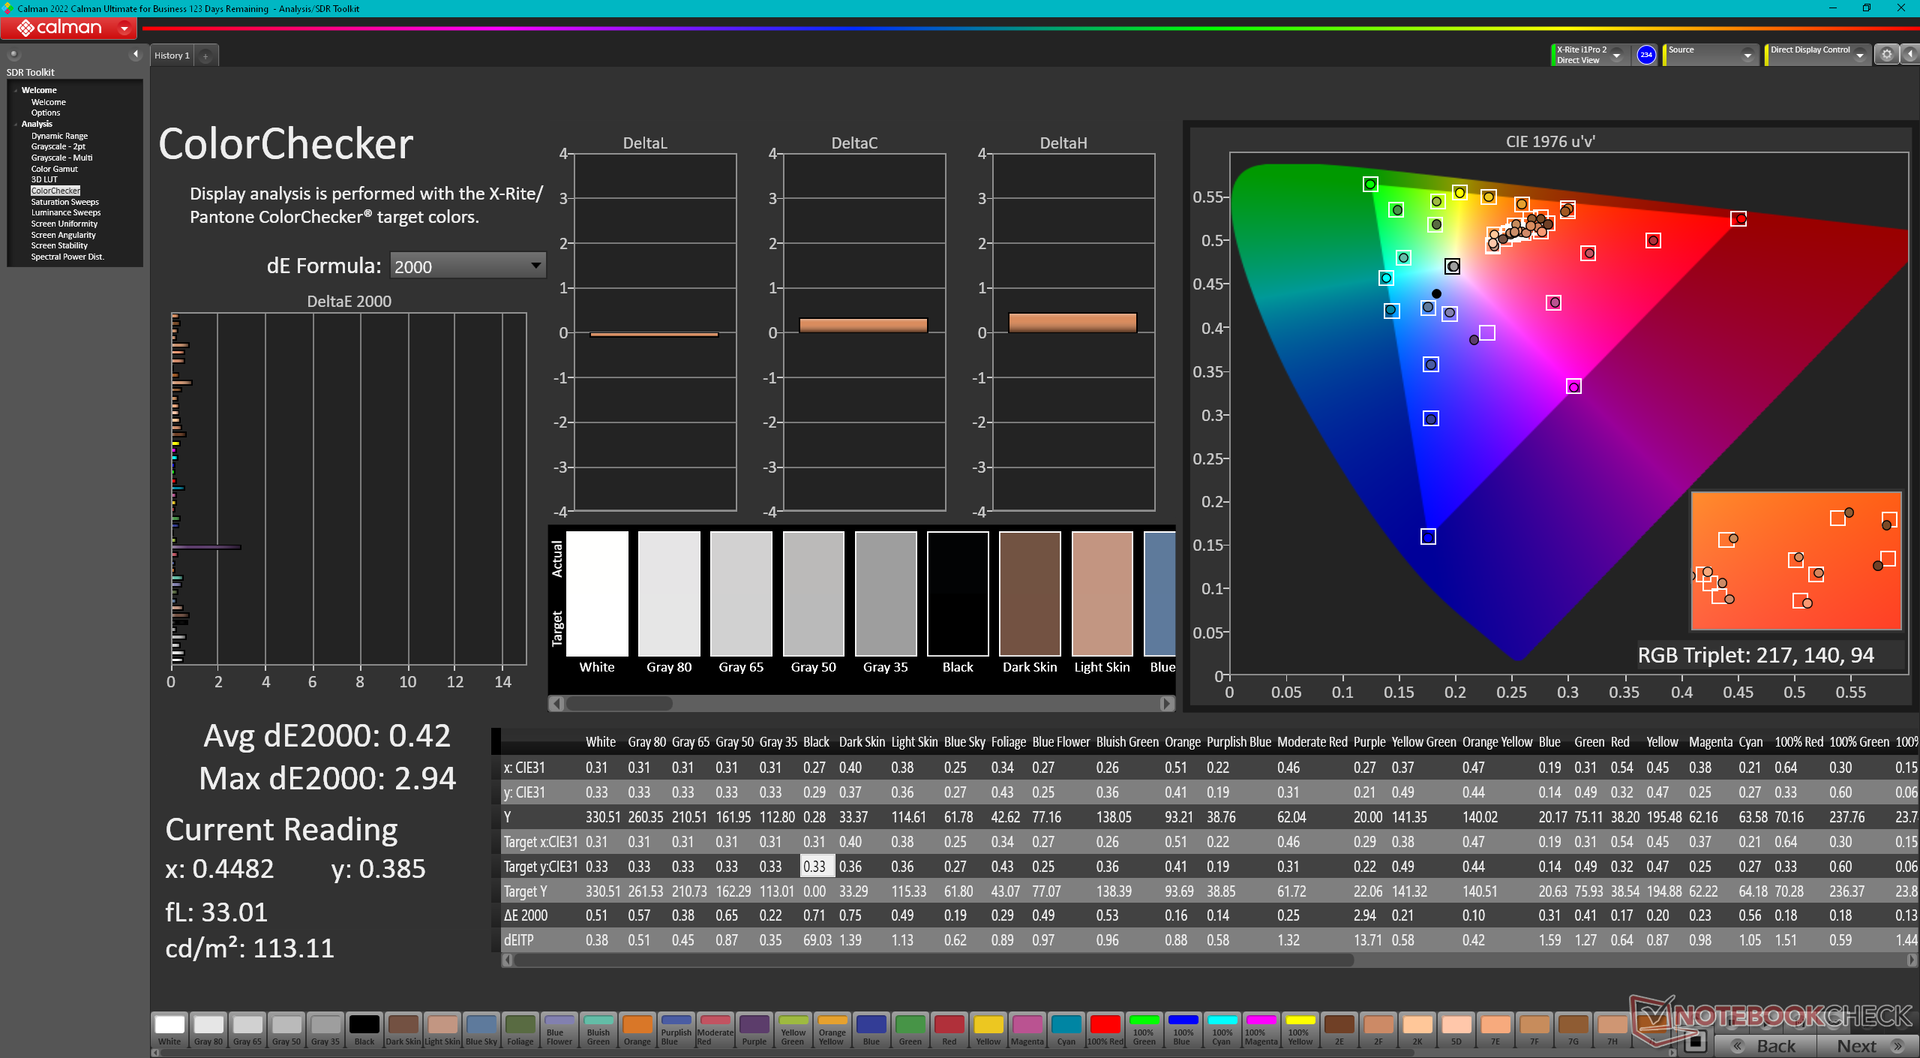
ΔE Color 2.68 | 0.5-29.43 Ø4.86, calibrated: 0.42
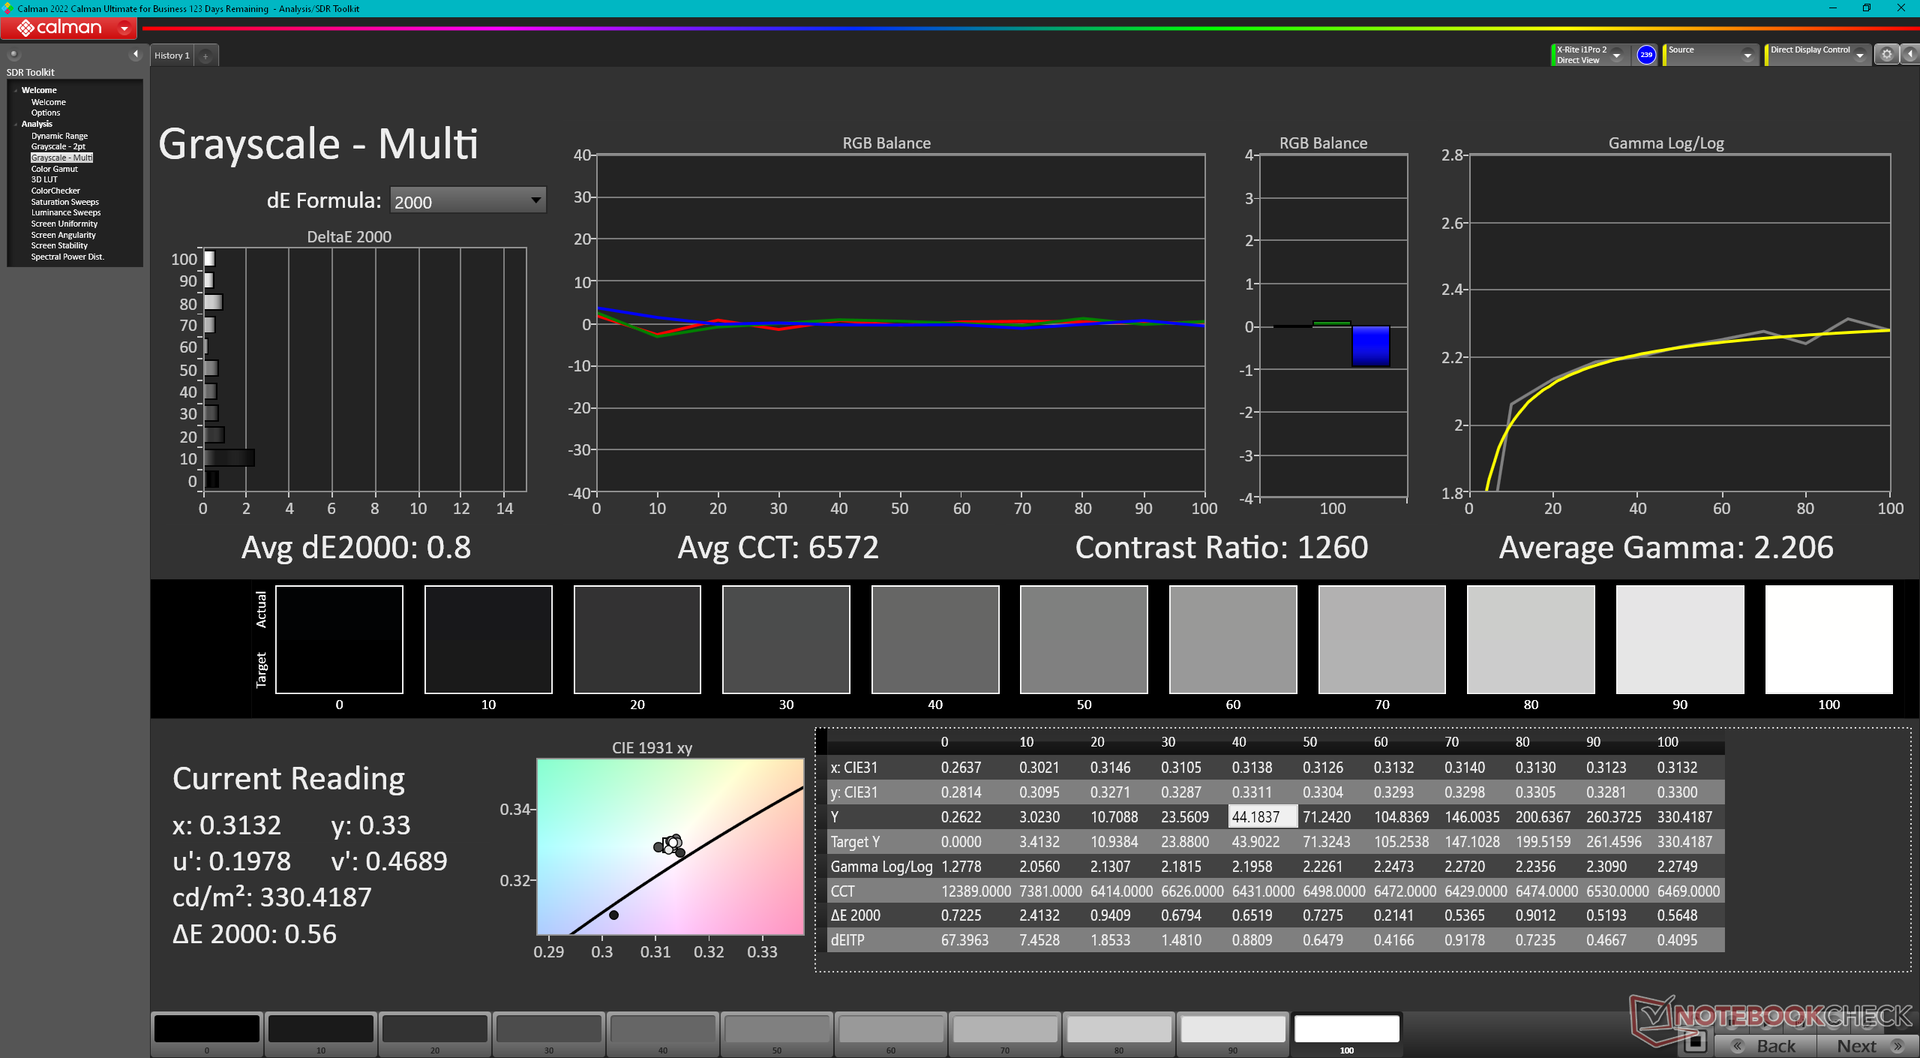
ΔE Greyscale 3.4 | 0.5-98 Ø5.1
88.8% AdobeRGB 1998 (Argyll 2.2.0 3D)
100% sRGB (Argyll 2.2.0 3D)
98.3% Display P3 (Argyll 2.2.0 3D)
Gamma: 2.41
| Alienware x16 R2 P120F BOE B160QAN, IPS, 2560x1600, 16" | Alienware x16 R1 BOE NE16NZ4, IPS, 2560x1600, 16" | Alienware m16 R2 BOE NE16NYH, IPS, 2560x1600, 16" | Asus ROG Strix Scar 16 G634JZR BOE NE160QDM-NM7, Mini LED, 2560x1600, 16" | Lenovo Legion Pro 7 16IRX9H BOE CQ NE16QDM-NZB, IPS, 2560x1600, 16" | MSI Vector 16 HX A14V Chi Mei N160GME-GTB, IPS, 2560x1600, 16" | |
|---|---|---|---|---|---|---|
| Display | 0% | -16% | 1% | -1% | -2% | |
| Display P3 Coverage | 98.3 | 99.2 1% | 71 -28% | 99.8 2% | 98.5 0% | 95.4 -3% |
| sRGB Coverage | 100 | 100 0% | 100 0% | 100 0% | 99.9 0% | 99.7 0% |
| AdobeRGB 1998 Coverage | 88.8 | 88.6 0% | 71.4 -20% | 90.8 2% | 86.7 -2% | 85.4 -4% |
| Response Times | -32% | -29% | -31% | -99% | -46% | |
| Response Time Grey 50% / Grey 80% * | 3.9 ? | 5.1 ? -31% | 5.7 ? -46% | 5 ? -28% | 12.6 ? -223% | 5.7 ? -46% |
| Response Time Black / White * | 7.8 ? | 10.3 ? -32% | 8.7 ? -12% | 10.4 ? -33% | 5.8 ? 26% | 11.4 ? -46% |
| PWM Frequency | 2040 ? | |||||
| Screen | -13% | 5% | 16% | 21% | -27% | |
| Brightness middle | 348.4 | 302.2 -13% | 345.8 -1% | 490 41% | 487 40% | 557.2 60% |
| Brightness | 340 | 285 -16% | 337 -1% | 487 43% | 460 35% | 506 49% |
| Brightness Distribution | 90 | 89 -1% | 87 -3% | 94 4% | 88 -2% | 83 -8% |
| Black Level * | 0.33 | 0.26 21% | 0.3 9% | 0.4 -21% | 0.42 -27% | 0.41 -24% |
| Contrast | 1056 | 1162 10% | 1153 9% | 1225 16% | 1160 10% | 1359 29% |
| Colorchecker dE 2000 * | 2.68 | 1.63 39% | 1.99 26% | 1.08 60% | 1.12 58% | 2.91 -9% |
| Colorchecker dE 2000 max. * | 4.14 | 4.13 -0% | 3.52 15% | 2.38 43% | 2.26 45% | 5.94 -43% |
| Colorchecker dE 2000 calibrated * | 0.42 | 1.17 -179% | 0.62 -48% | 0.9 -114% | 0.54 -29% | 1.63 -288% |
| Greyscale dE 2000 * | 3.4 | 2.5 26% | 2.1 38% | 1.1 68% | 1.4 59% | 3.8 -12% |
| Gamma | 2.41 91% | 2.23 99% | 2.32 95% | 2.13 103% | 2.242 98% | 2.23 99% |
| CCT | 6083 107% | 6590 99% | 6369 102% | 6724 97% | 6809 95% | 6408 101% |
| Totaal Gemiddelde (Programma / Instellingen) | -15% /
-13% | -13% /
-4% | -5% /
6% | -26% /
-1% | -25% /
-25% |
* ... kleiner is beter
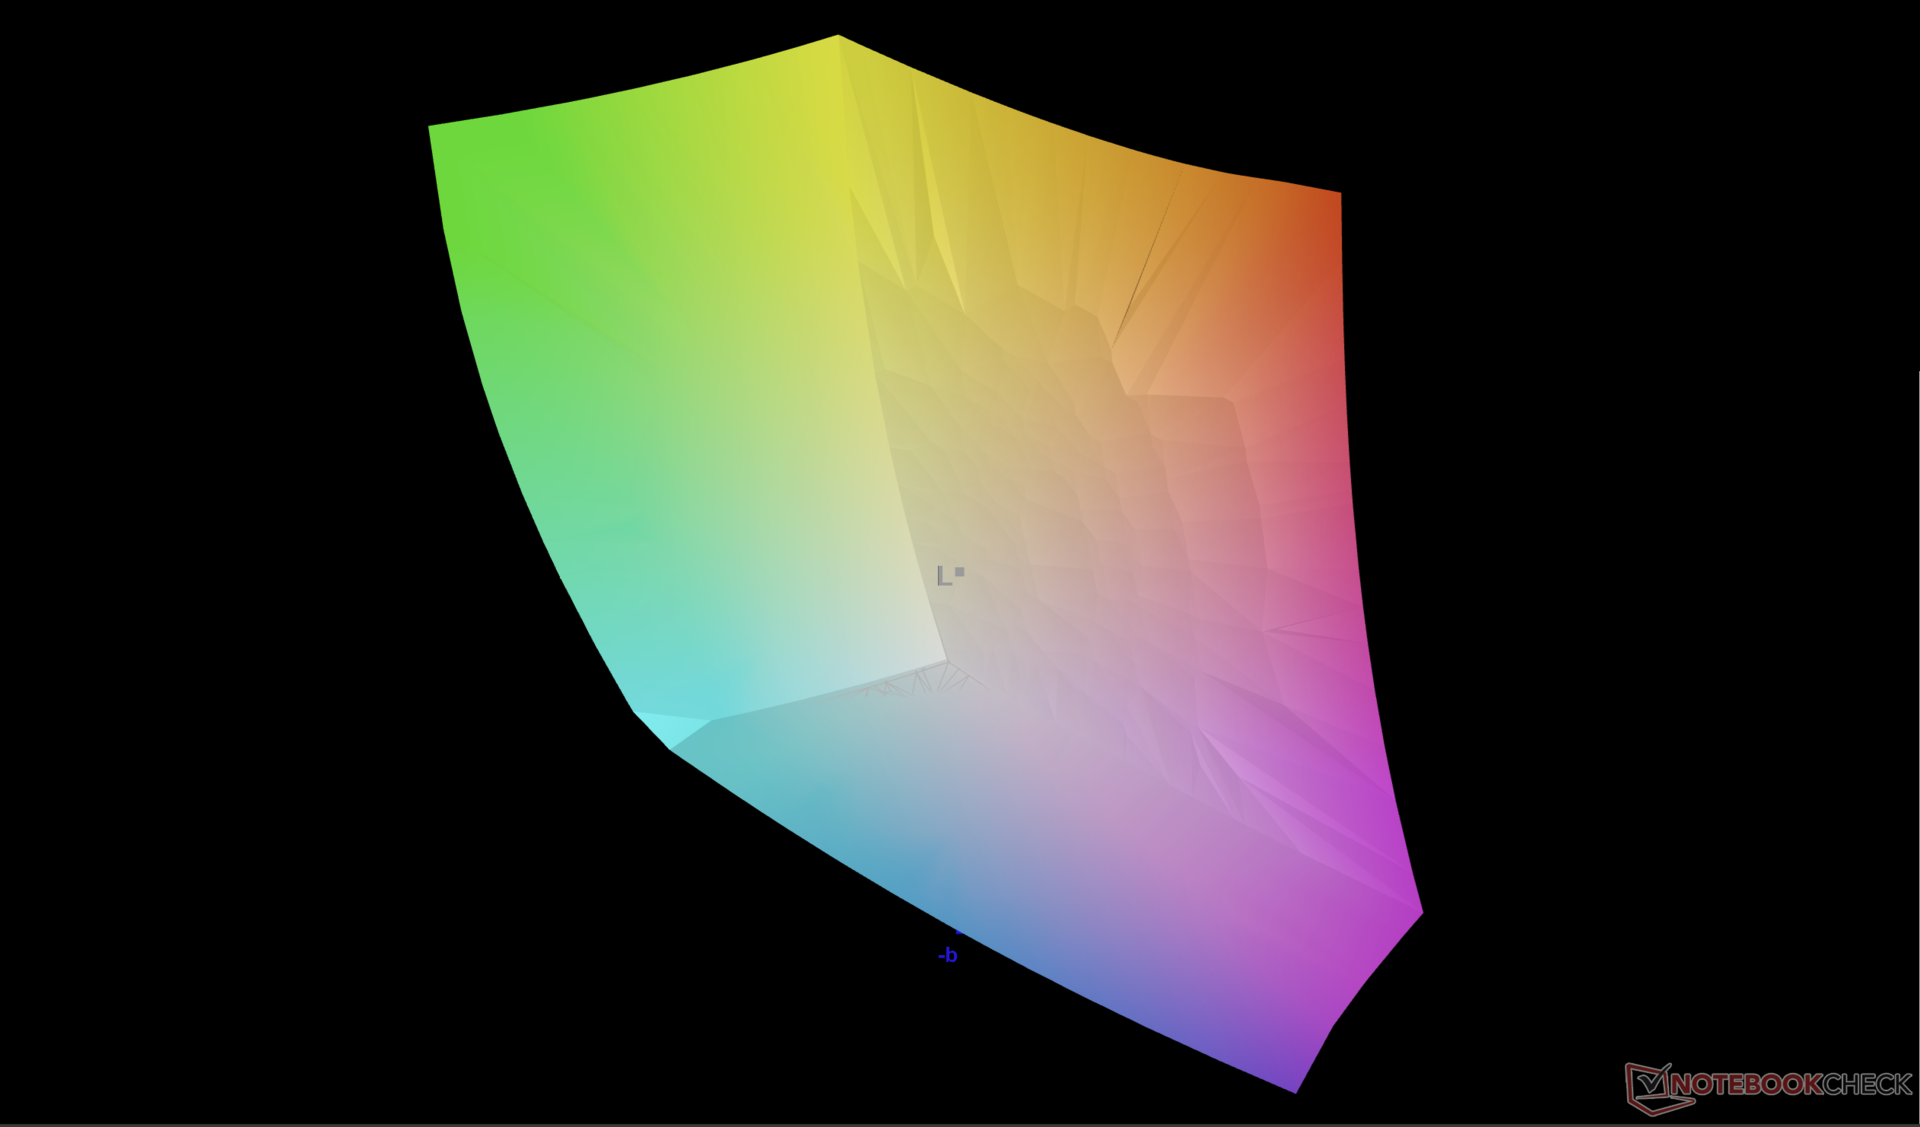
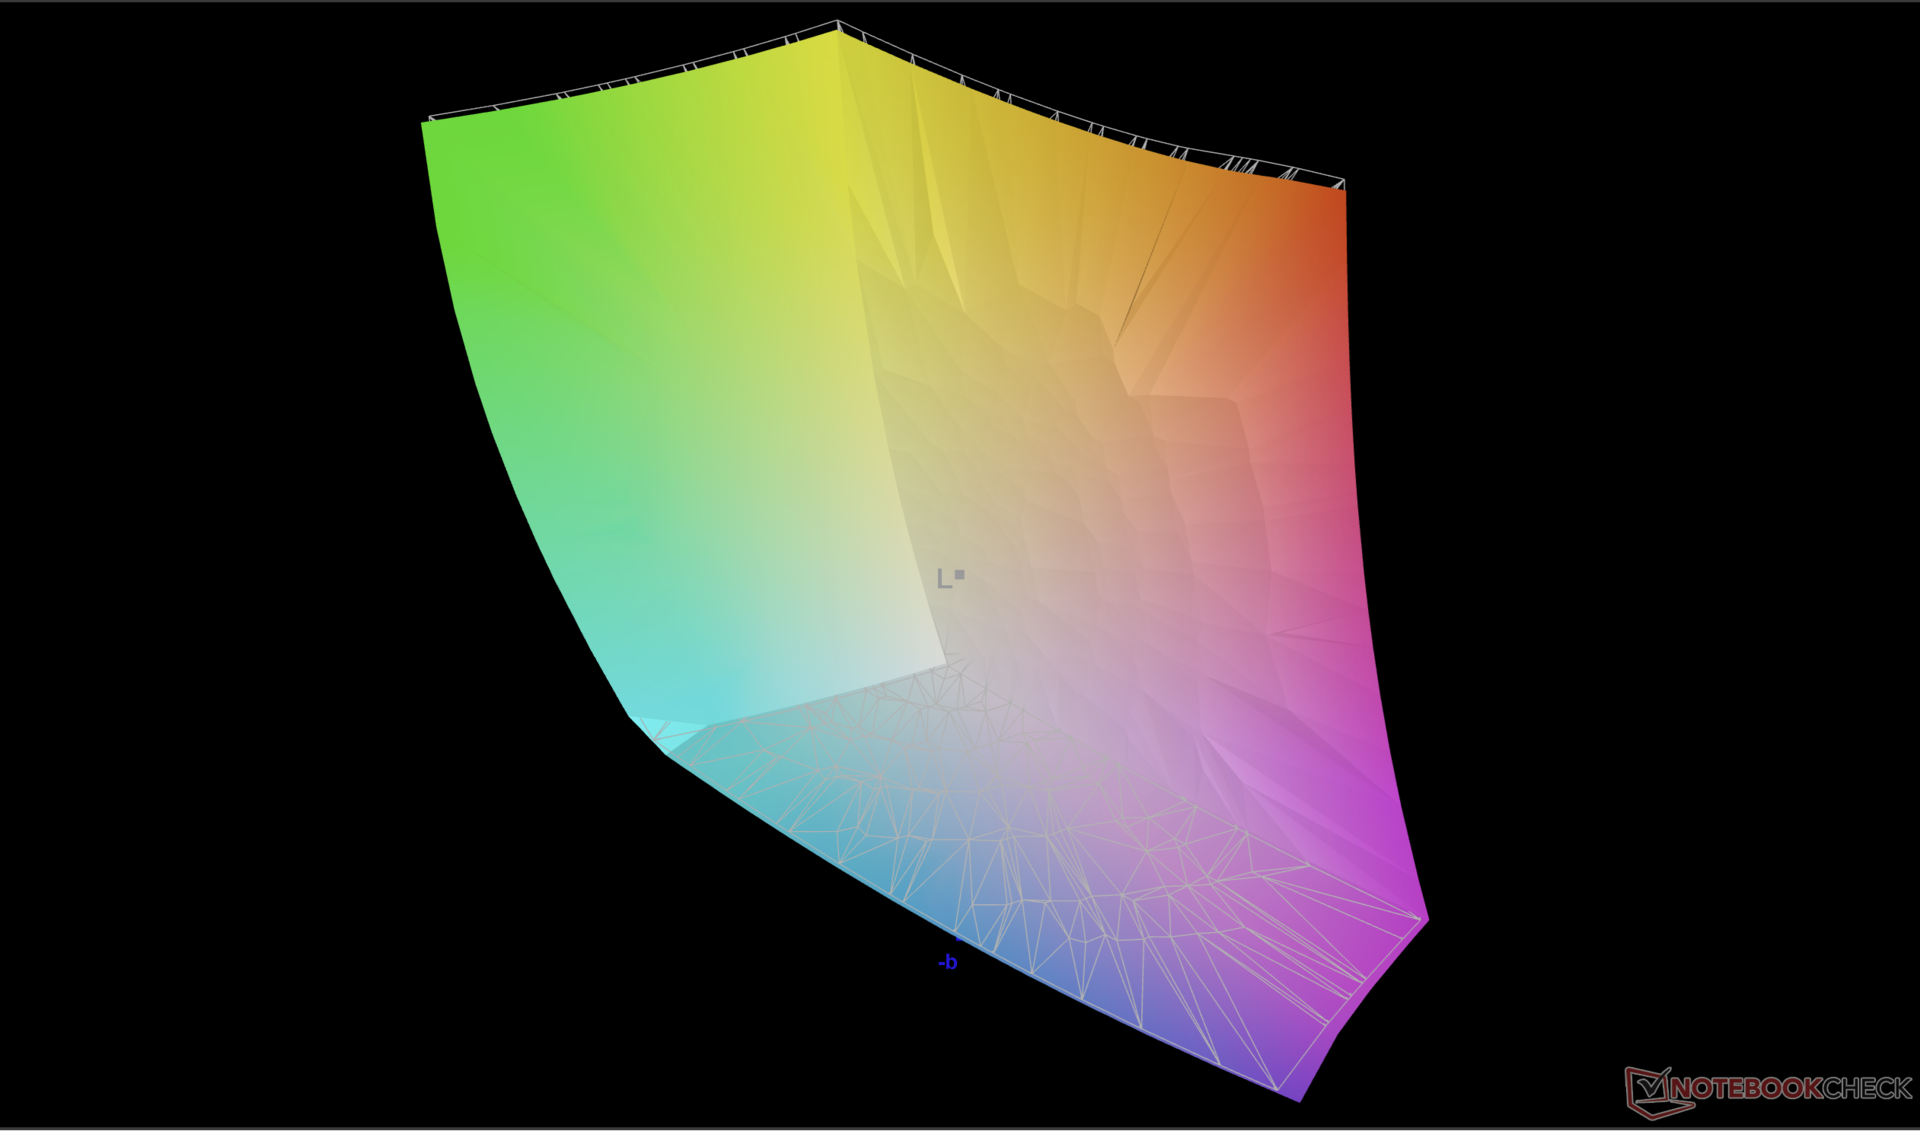
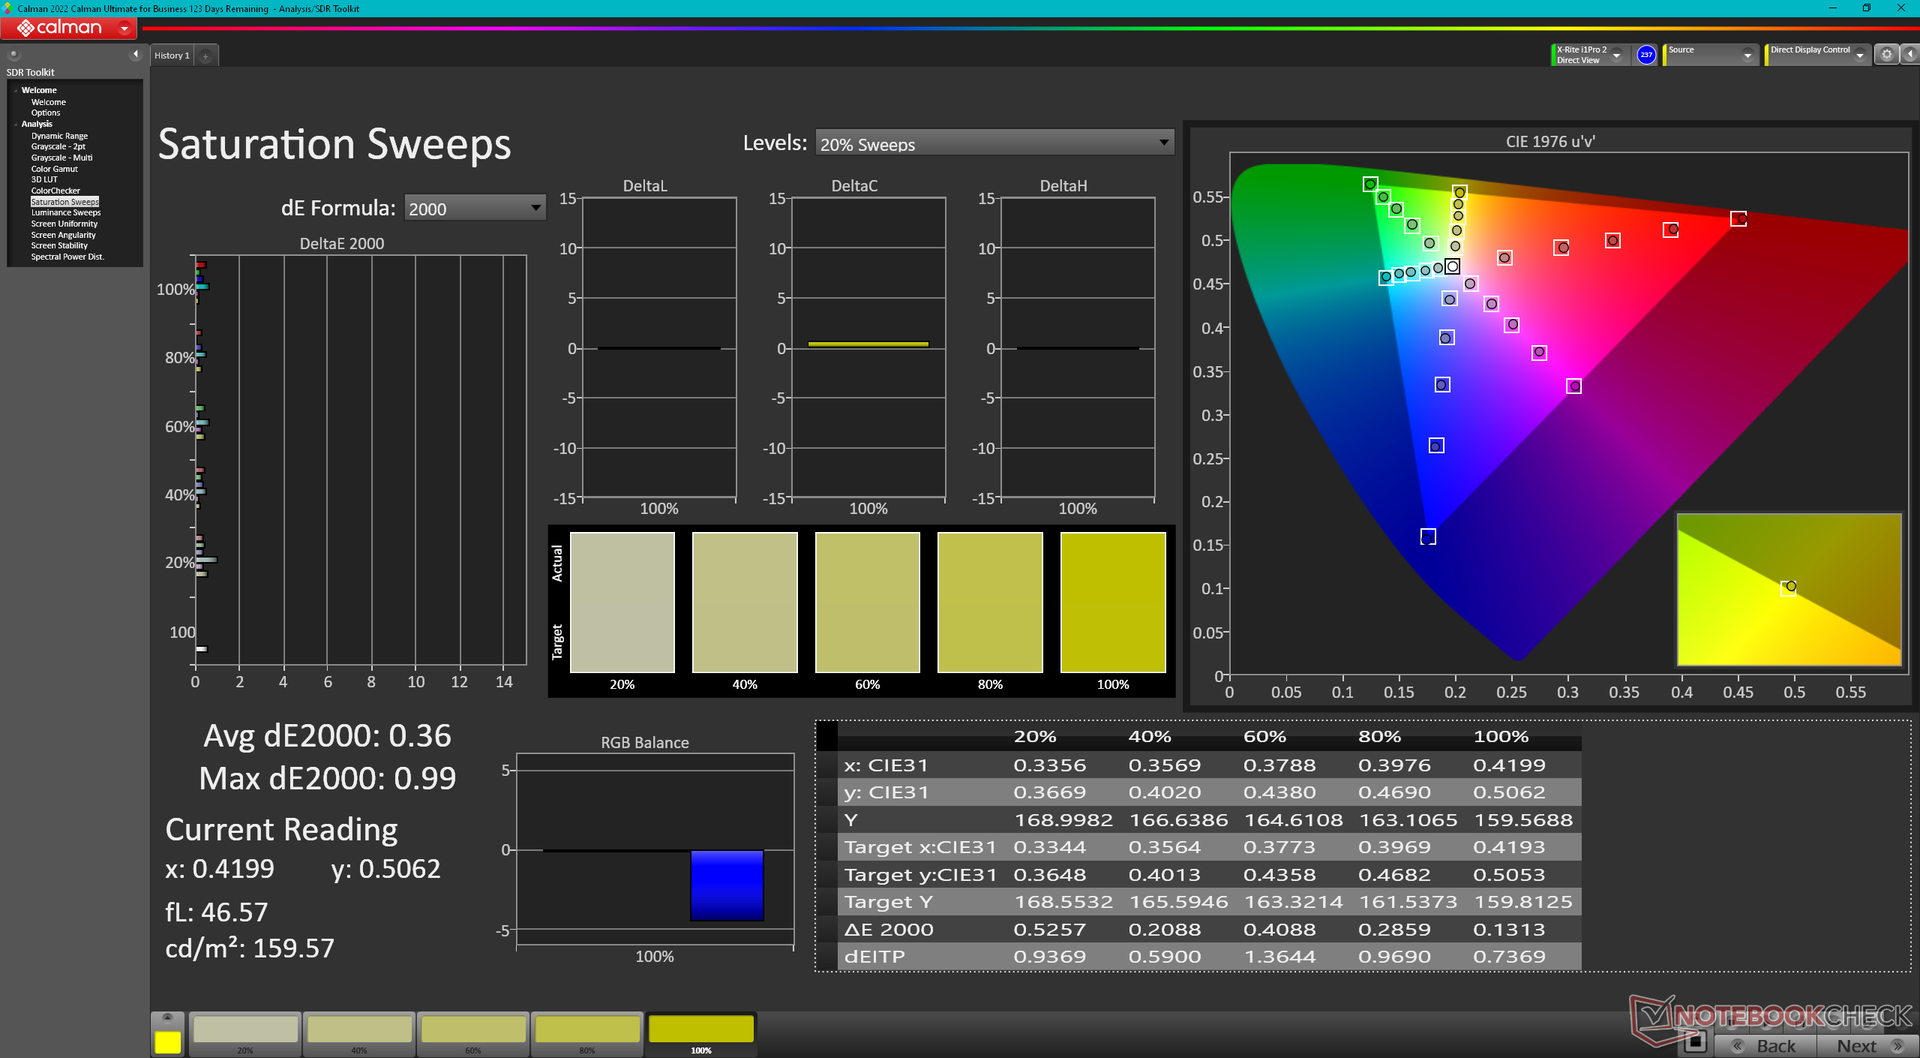
Het beeldscherm is standaard ingesteld op sRGB, hoewel het volledige P3-kleuren ondersteunt. Het is niettemin behoorlijk gekalibreerd, hoewel de kleurtemperatuur iets te warm is.
Responstijd Scherm
| ↔ Responstijd Zwart naar Wit | ||
|---|---|---|
| 7.8 ms ... stijging ↗ en daling ↘ gecombineerd | ↗ 3.9 ms stijging | 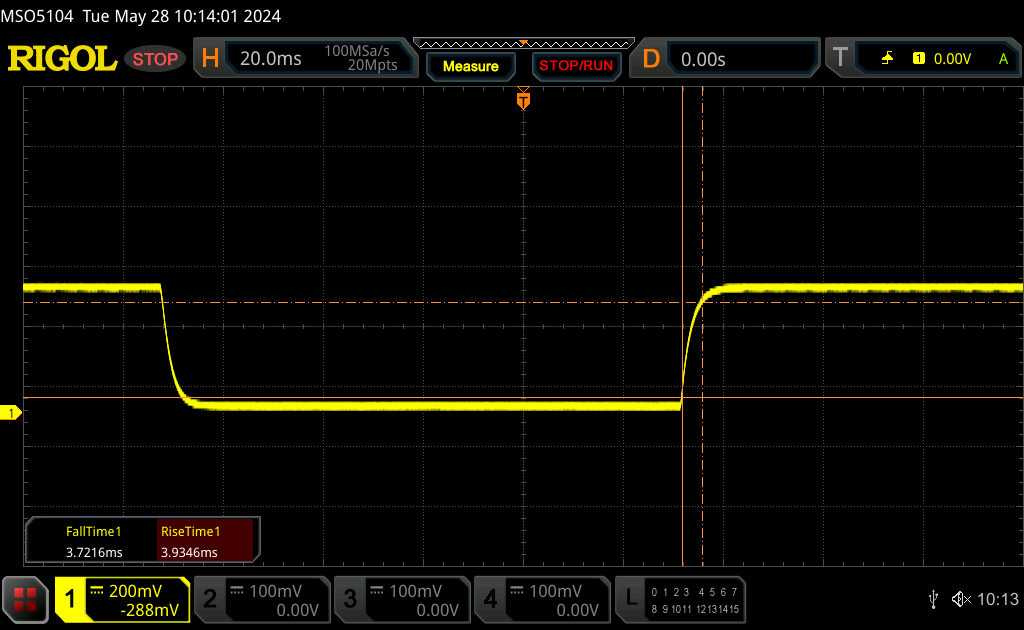 |
| ↘ 3.7 ms daling | ||
| Het scherm vertoonde erg snelle responstijden in onze tests en zou zeer geschikt moeten zijn voor snelle games. Ter vergelijking: alle testtoestellen variëren van 0.1 (minimum) tot 240 (maximum) ms. » 19 % van alle toestellen zijn beter. Dit betekent dat de gemeten responstijd beter is dan het gemiddelde (20.7 ms) van alle geteste toestellen. | ||
| ↔ Responstijd 50% Grijs naar 80% Grijs | ||
| 3.9 ms ... stijging ↗ en daling ↘ gecombineerd | ↗ 1.7 ms stijging | 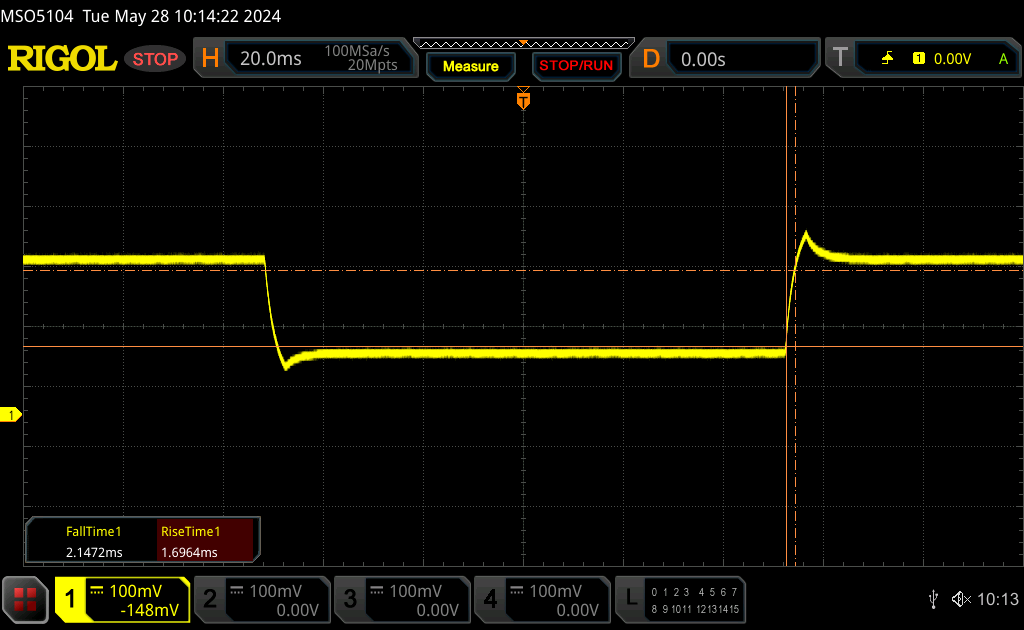 |
| ↘ 2.2 ms daling | ||
| Het scherm vertoonde erg snelle responstijden in onze tests en zou zeer geschikt moeten zijn voor snelle games. Ter vergelijking: alle testtoestellen variëren van 0.165 (minimum) tot 636 (maximum) ms. » 12 % van alle toestellen zijn beter. Dit betekent dat de gemeten responstijd beter is dan het gemiddelde (32.4 ms) van alle geteste toestellen. | ||
Screen Flickering / PWM (Pulse-Width Modulation)
| Screen flickering / PWM niet waargenomen | 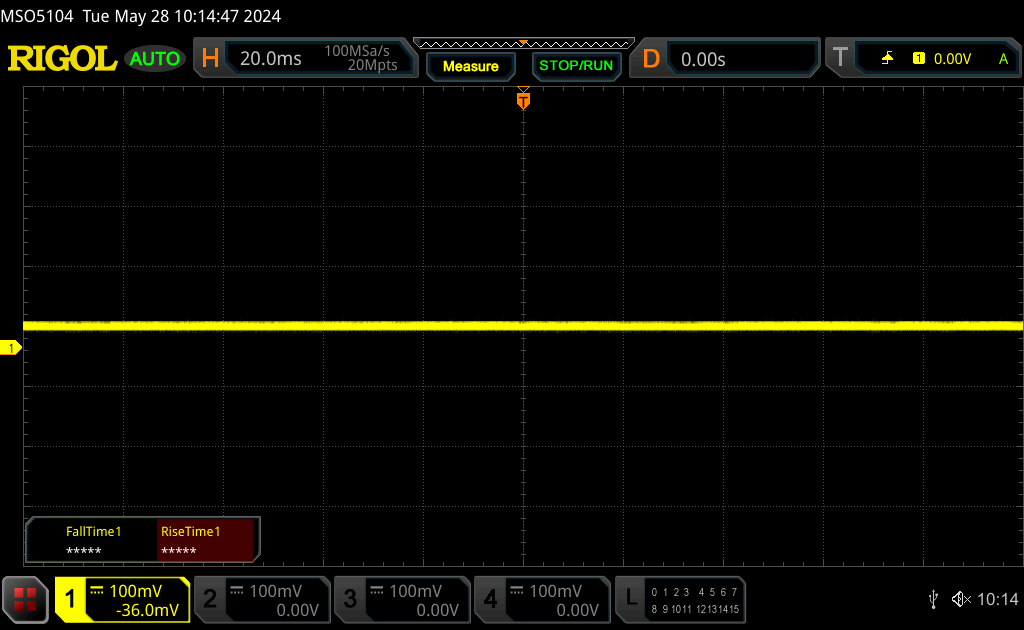 | ||
Ter vergelijking: 53 % van alle geteste toestellen maakten geen gebruik van PWM om de schermhelderheid te verlagen. Als het wel werd gebruikt, werd een gemiddelde van 8471 (minimum: 5 - maximum: 343500) Hz waargenomen. | |||
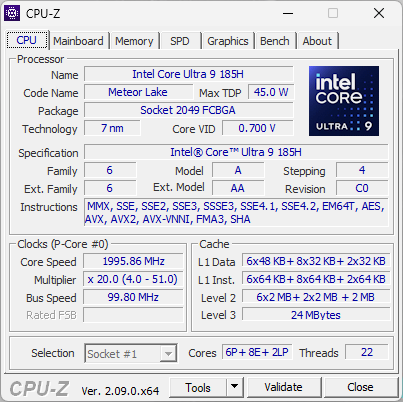
Prestaties - Core Ultra 9 185H vs. Core i9-13900HK
Testomstandigheden
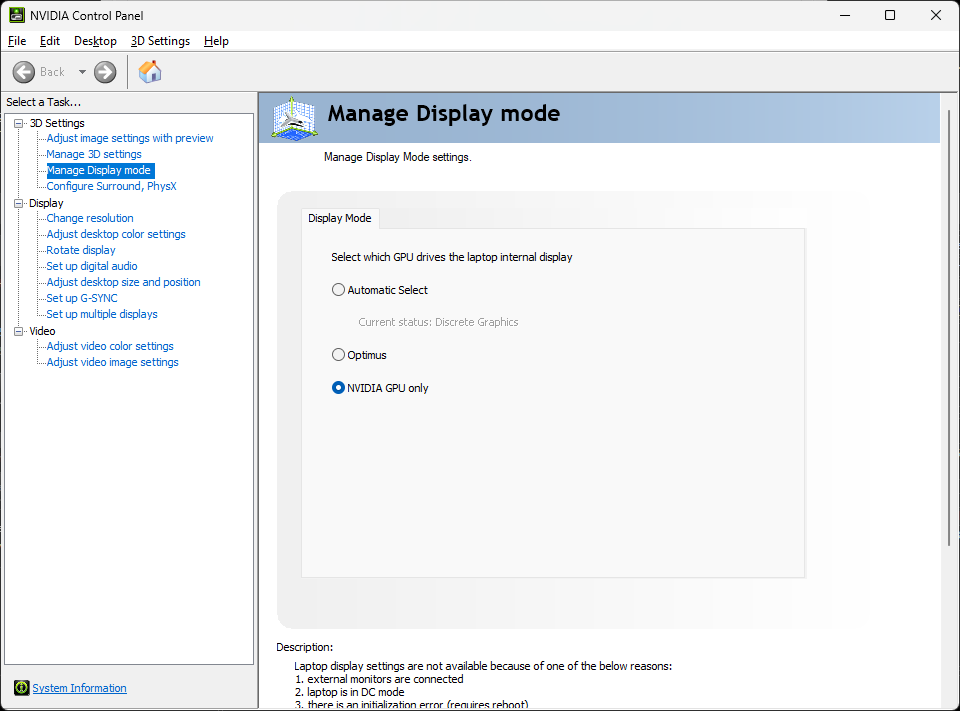
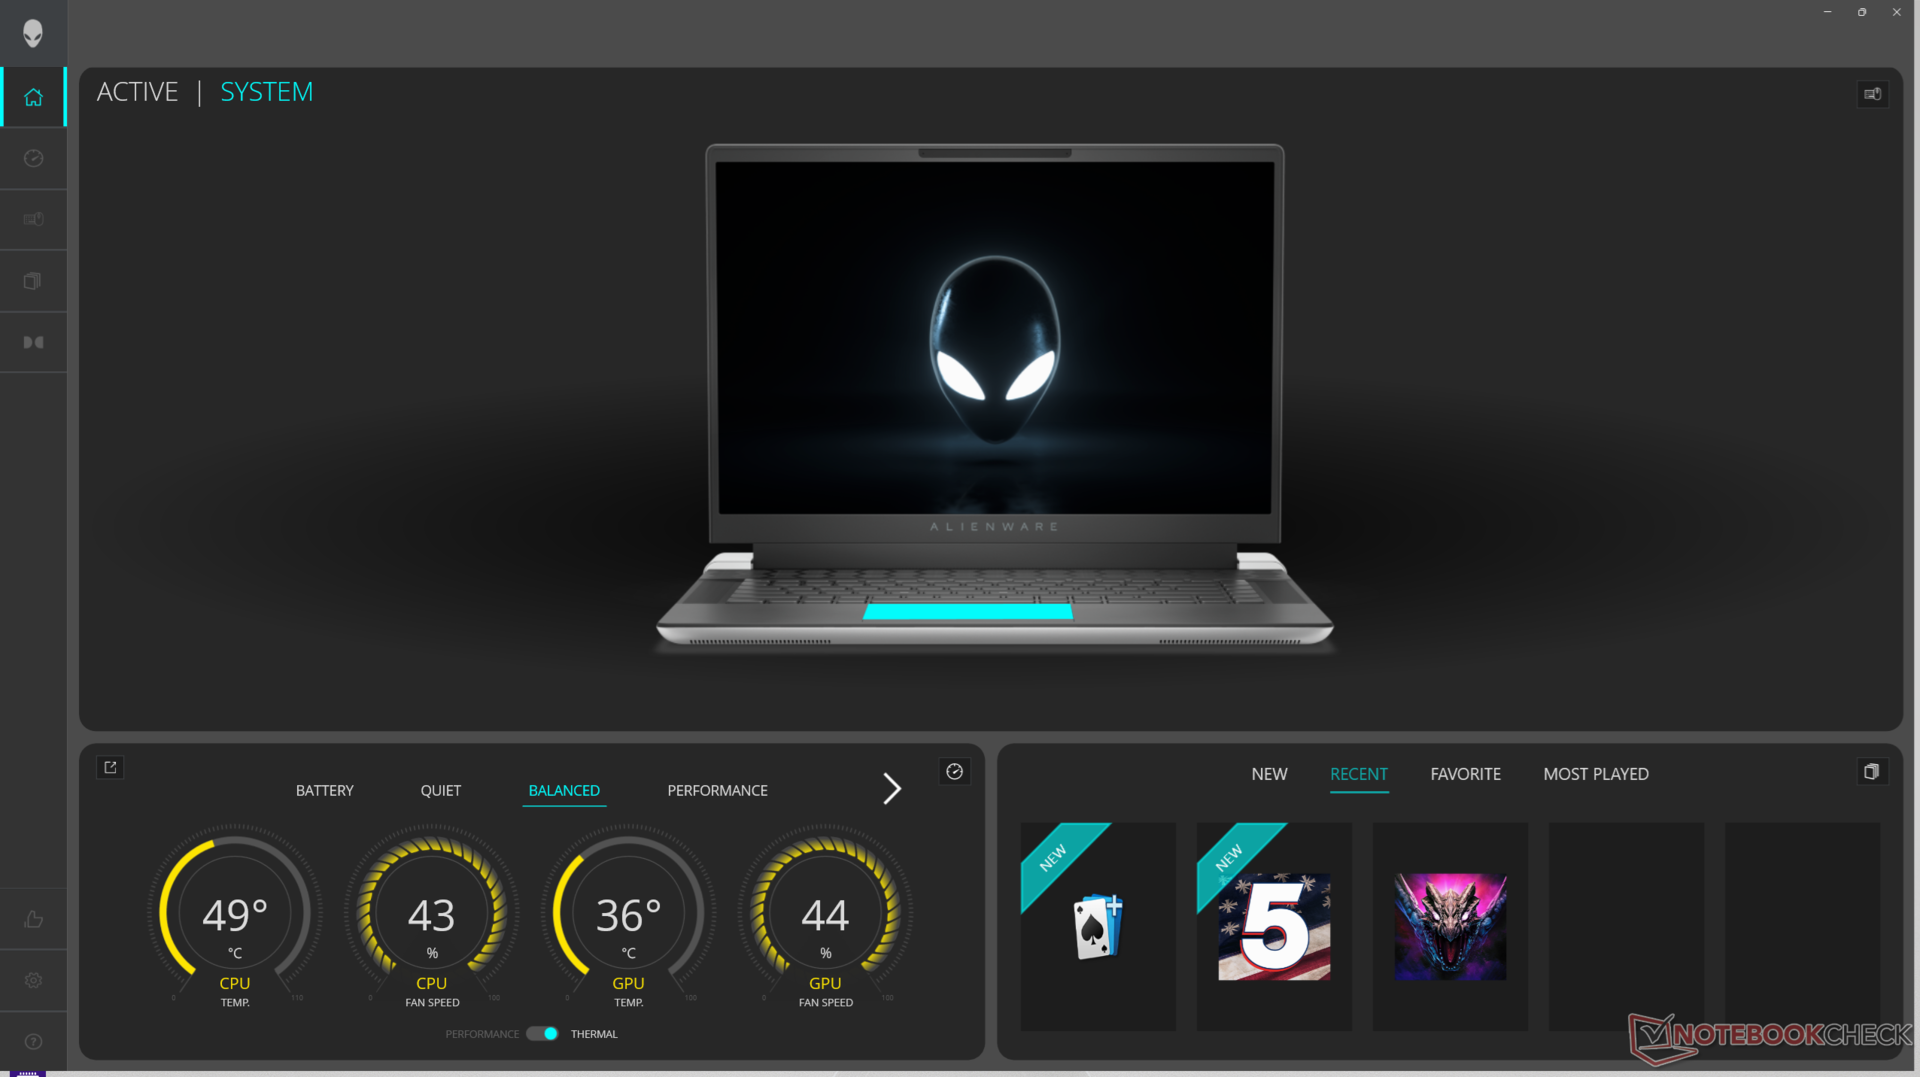
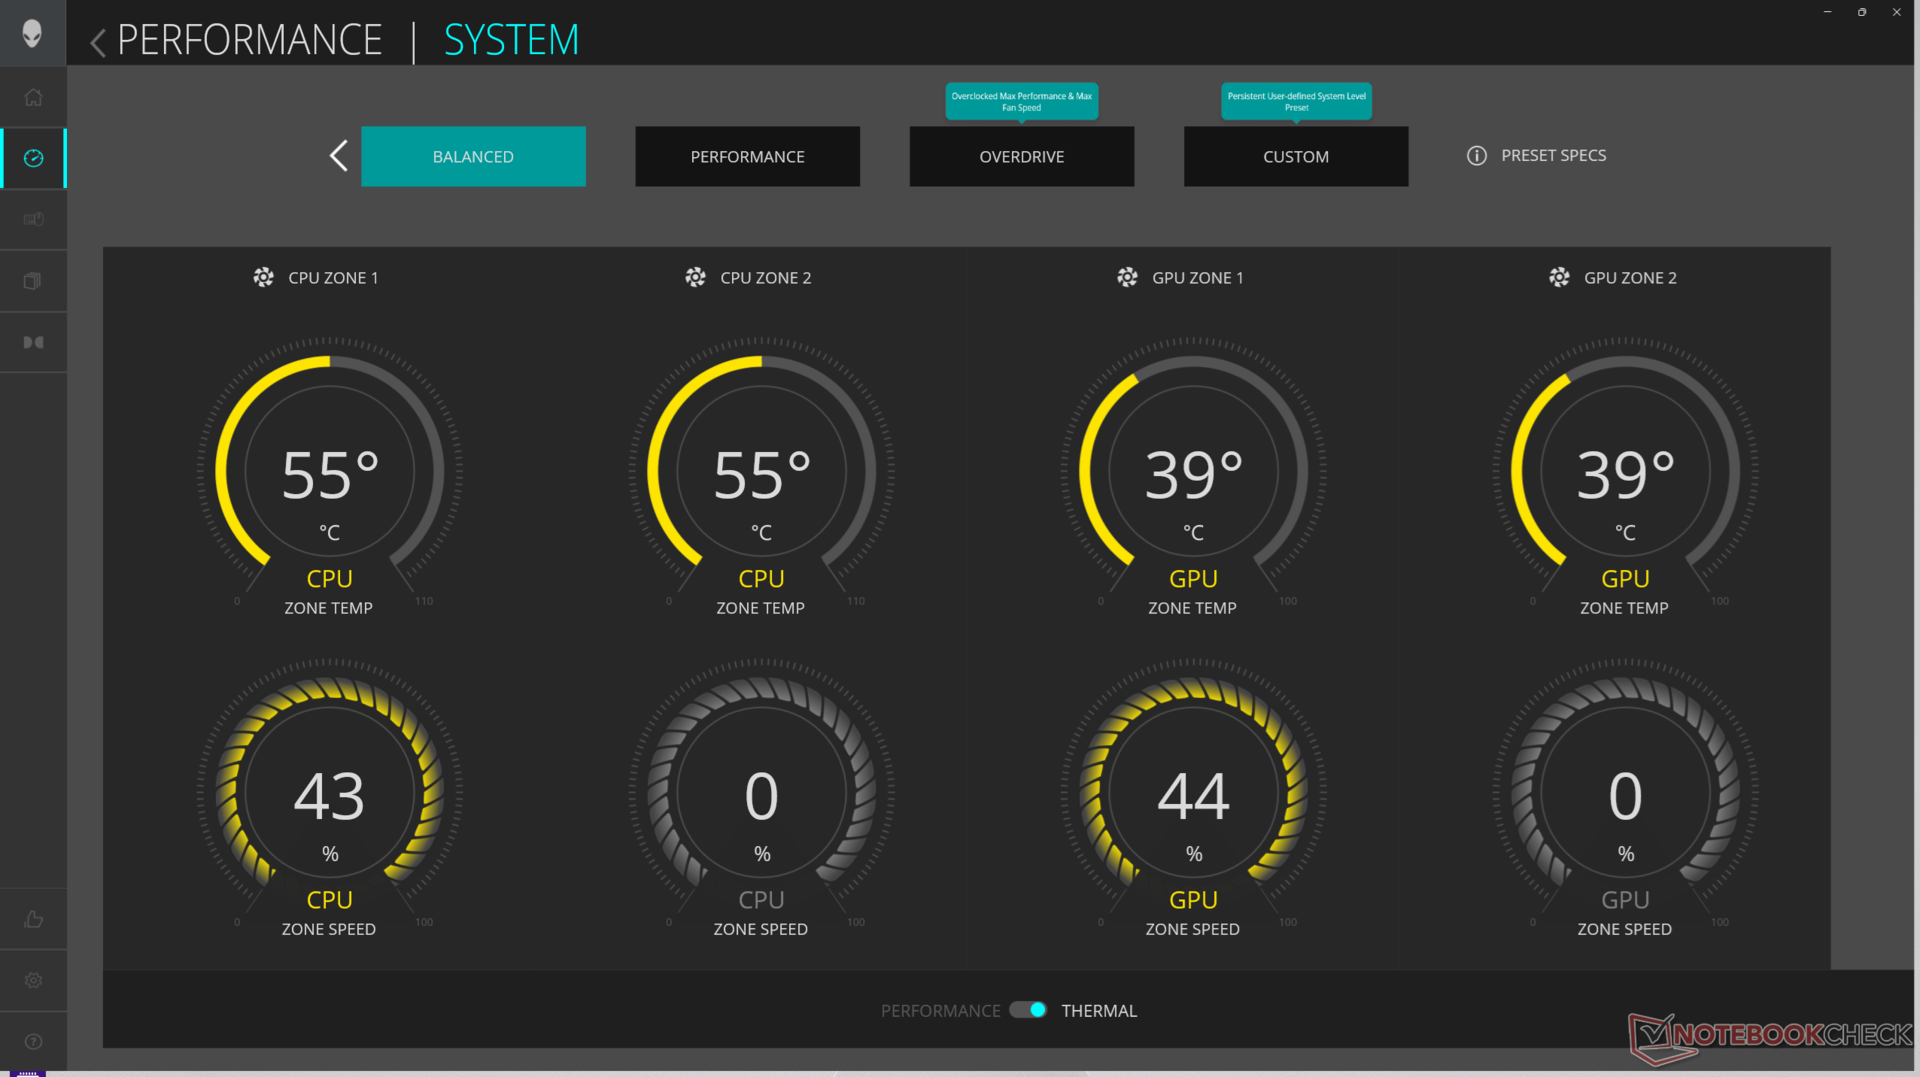
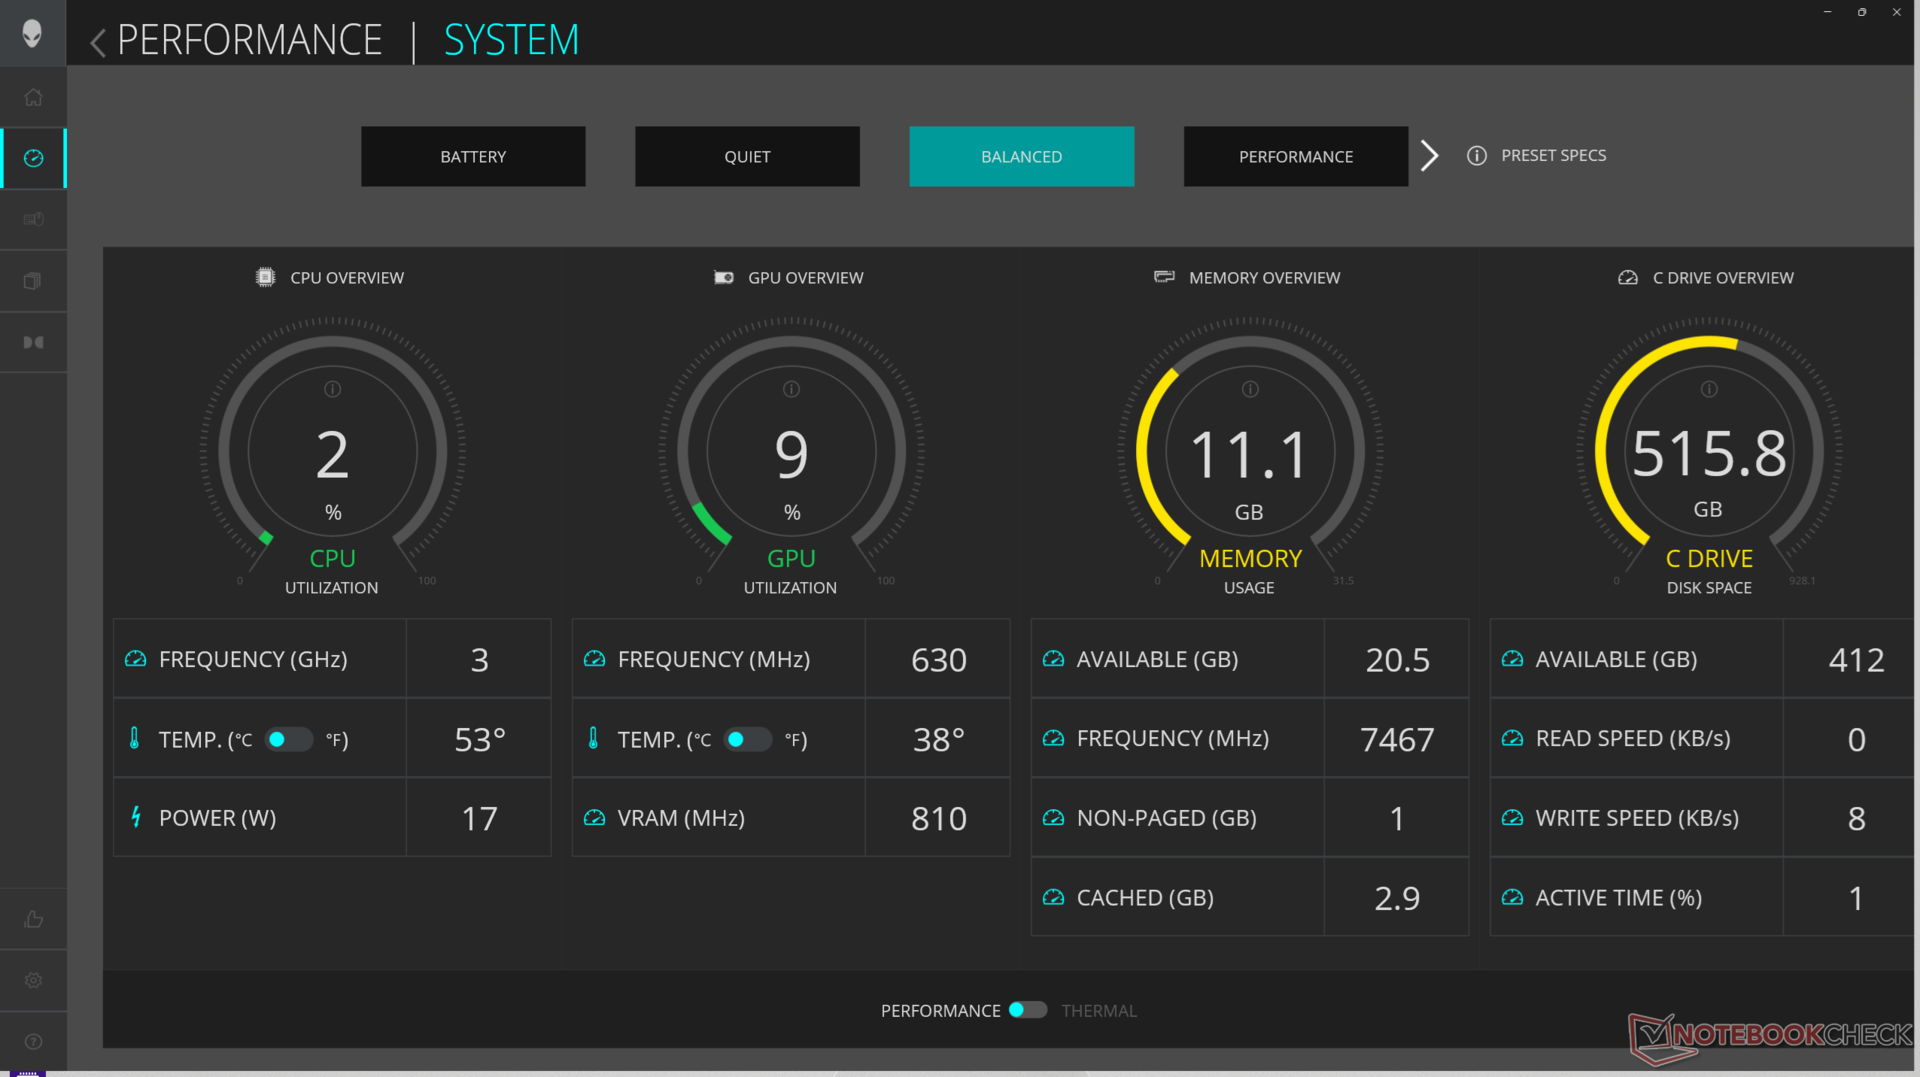
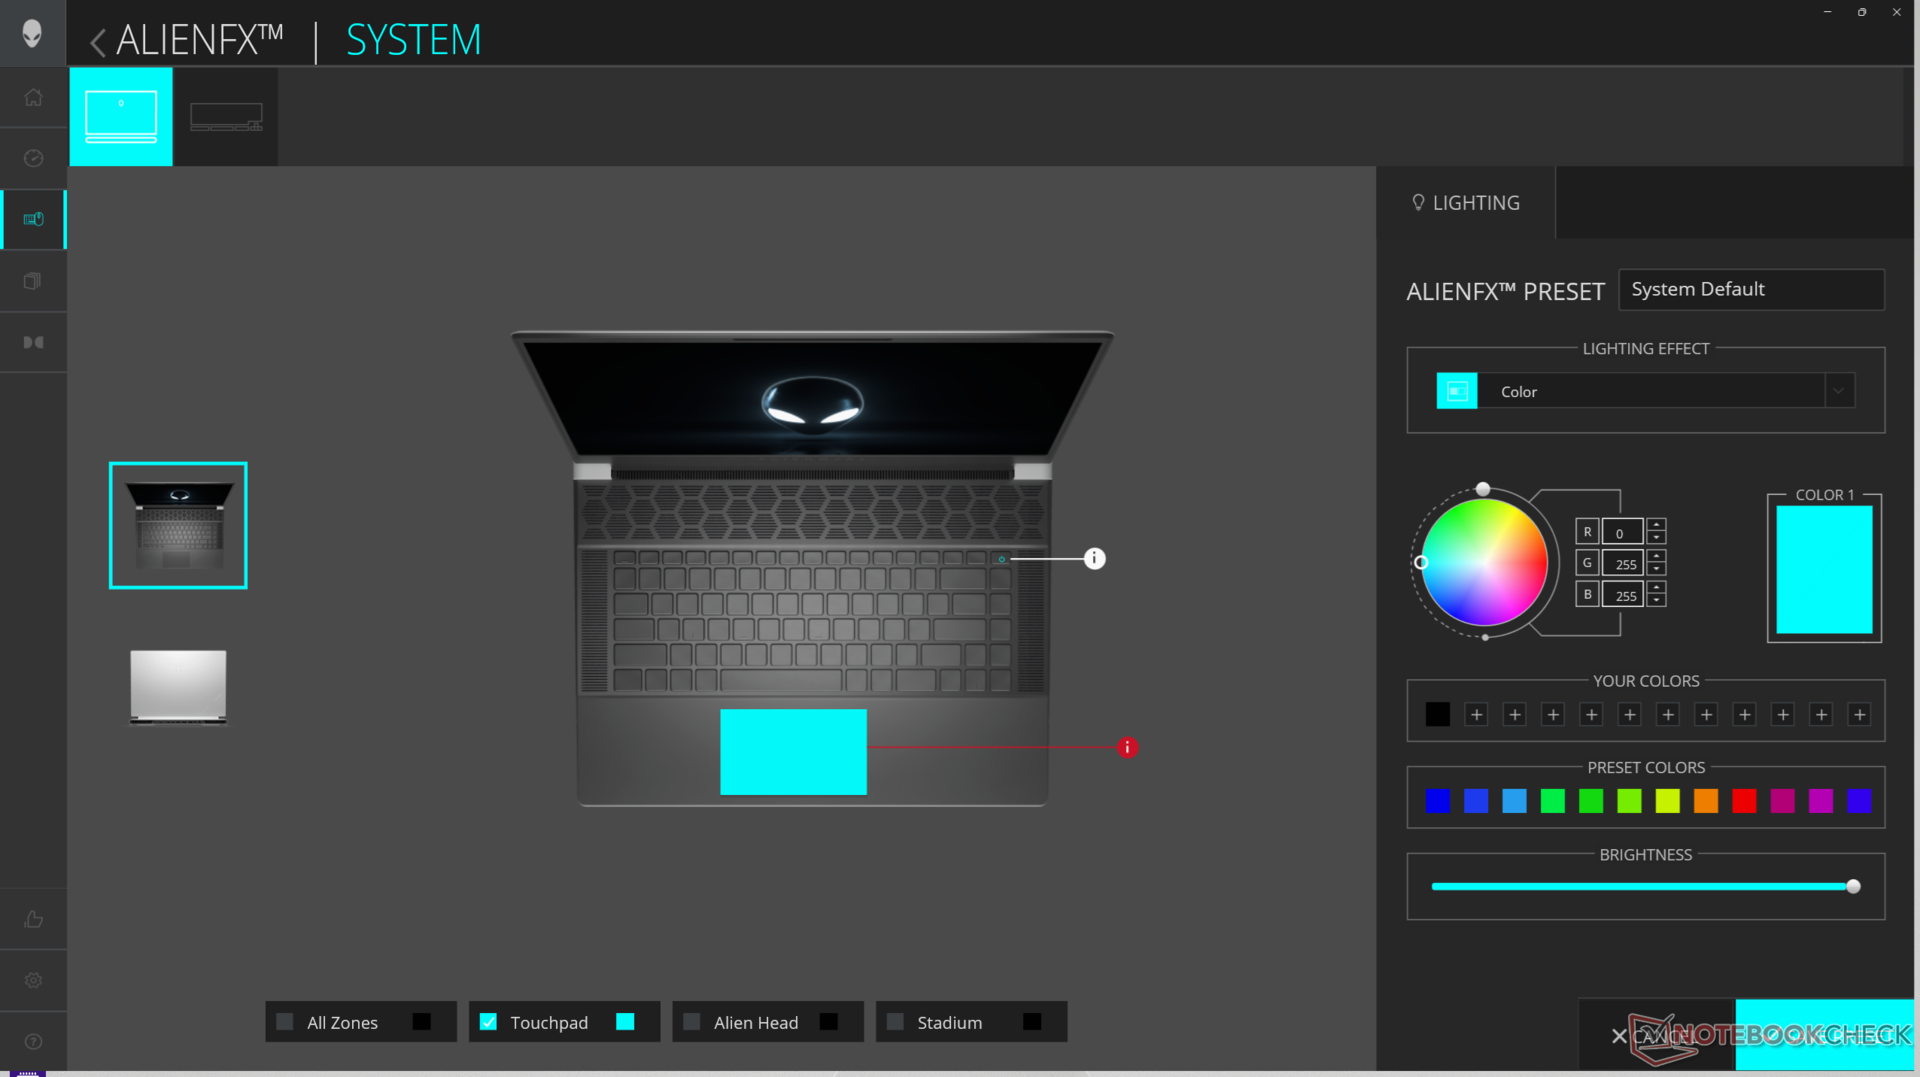
We hebben Alienware Command Center ingesteld op Overdrive-modus en de grafische weergave op dGPU-modus voor de best mogelijke benchmarkresultaten. Eigenaars wordt aangeraden om vertrouwd te raken met Command Center, omdat dit het middelpunt is voor het aanpassen van RGB-verlichtingseffecten en prestatieprofielen.
Het Nvidia Configuratiescherm biedt geen "alleen iGPU"-modus, zoals de schermafbeelding hierboven laat zien.
Processor
De Core Ultra 9 185H is ongeveer 5 tot 10 procent en 15 tot 20 procent langzamer dan de Core i9-13900HK in de x16 R1 van vorig jaar als het gaat om respectievelijk multi-threaded en single-threaded toepassingen. Interessant is dat downgraden naar de Core Ultra 7 155H configuratie naar verwachting geen significante invloed hebben op de prestaties van de Alienware m16 R2 zoals blijkt uit de onderstaande vergelijkingstabel.
Raptor Lake-HX opties zoals de Core i9-14900HX zijn niet beschikbaar op de Alienware x16-serie, waarschijnlijk vanwege thermische beperkingen, aangezien deze processors meer vermogen vereisen dan de Meteor Lake-H-serie. Dergelijke opties zouden aanzienlijk snellere prestaties hebben geboden dan zowel de Core i9-13900HK of Core Ultra 9 185H.
Cinebench R15 Multi Loop
Cinebench R23: Multi Core | Single Core
Cinebench R20: CPU (Multi Core) | CPU (Single Core)
Cinebench R15: CPU Multi 64Bit | CPU Single 64Bit
Blender: v2.79 BMW27 CPU
7-Zip 18.03: 7z b 4 | 7z b 4 -mmt1
Geekbench 6.4: Multi-Core | Single-Core
Geekbench 5.5: Multi-Core | Single-Core
HWBOT x265 Benchmark v2.2: 4k Preset
LibreOffice : 20 Documents To PDF
R Benchmark 2.5: Overall mean
* ... kleiner is beter
AIDA64: FP32 Ray-Trace | FPU Julia | CPU SHA3 | CPU Queen | FPU SinJulia | FPU Mandel | CPU AES | CPU ZLib | FP64 Ray-Trace | CPU PhotoWorxx
| Performance Rating | |
| MSI Vector 16 HX A14V | |
| Lenovo Legion Pro 7 16IRX9H | |
| Asus ROG Strix Scar 16 G634JZR | |
| Alienware x16 R2 P120F | |
| Alienware x16 R1 | |
| Alienware m16 R2 | |
| Gemiddeld Intel Core Ultra 9 185H | |
Stresstest
De kerntemperaturen van de CPU en GPU zijn net zo warm als die van de x16 R1. De CPU in het bijzonder stabiliseert zich nog steeds op bijna 100 C (!) wanneer Prime95 wordt uitgevoerd, terwijl de GPU zich in het midden van de 80 C-zone stabiliseert tijdens het uitvoeren van Witcher 3. Interessant is dat de kloksnelheid van de GPU over de hele linie lager is dan bij de x16 R1. De GPU zou tussen 2100 en 2325 MHz variëren, afhankelijk van het stroomprofiel, vergeleken met 2460 MHz op de originele x16 R1. Het stroomverbruik op het bord zou ook lager zijn op het nieuwere x16 R2-model (150 W vs. 165 W). Deze bevindingen komen overeen met de over het algemeen langzamere grafische prestaties in het gedeelte GPU-prestaties hieronder.
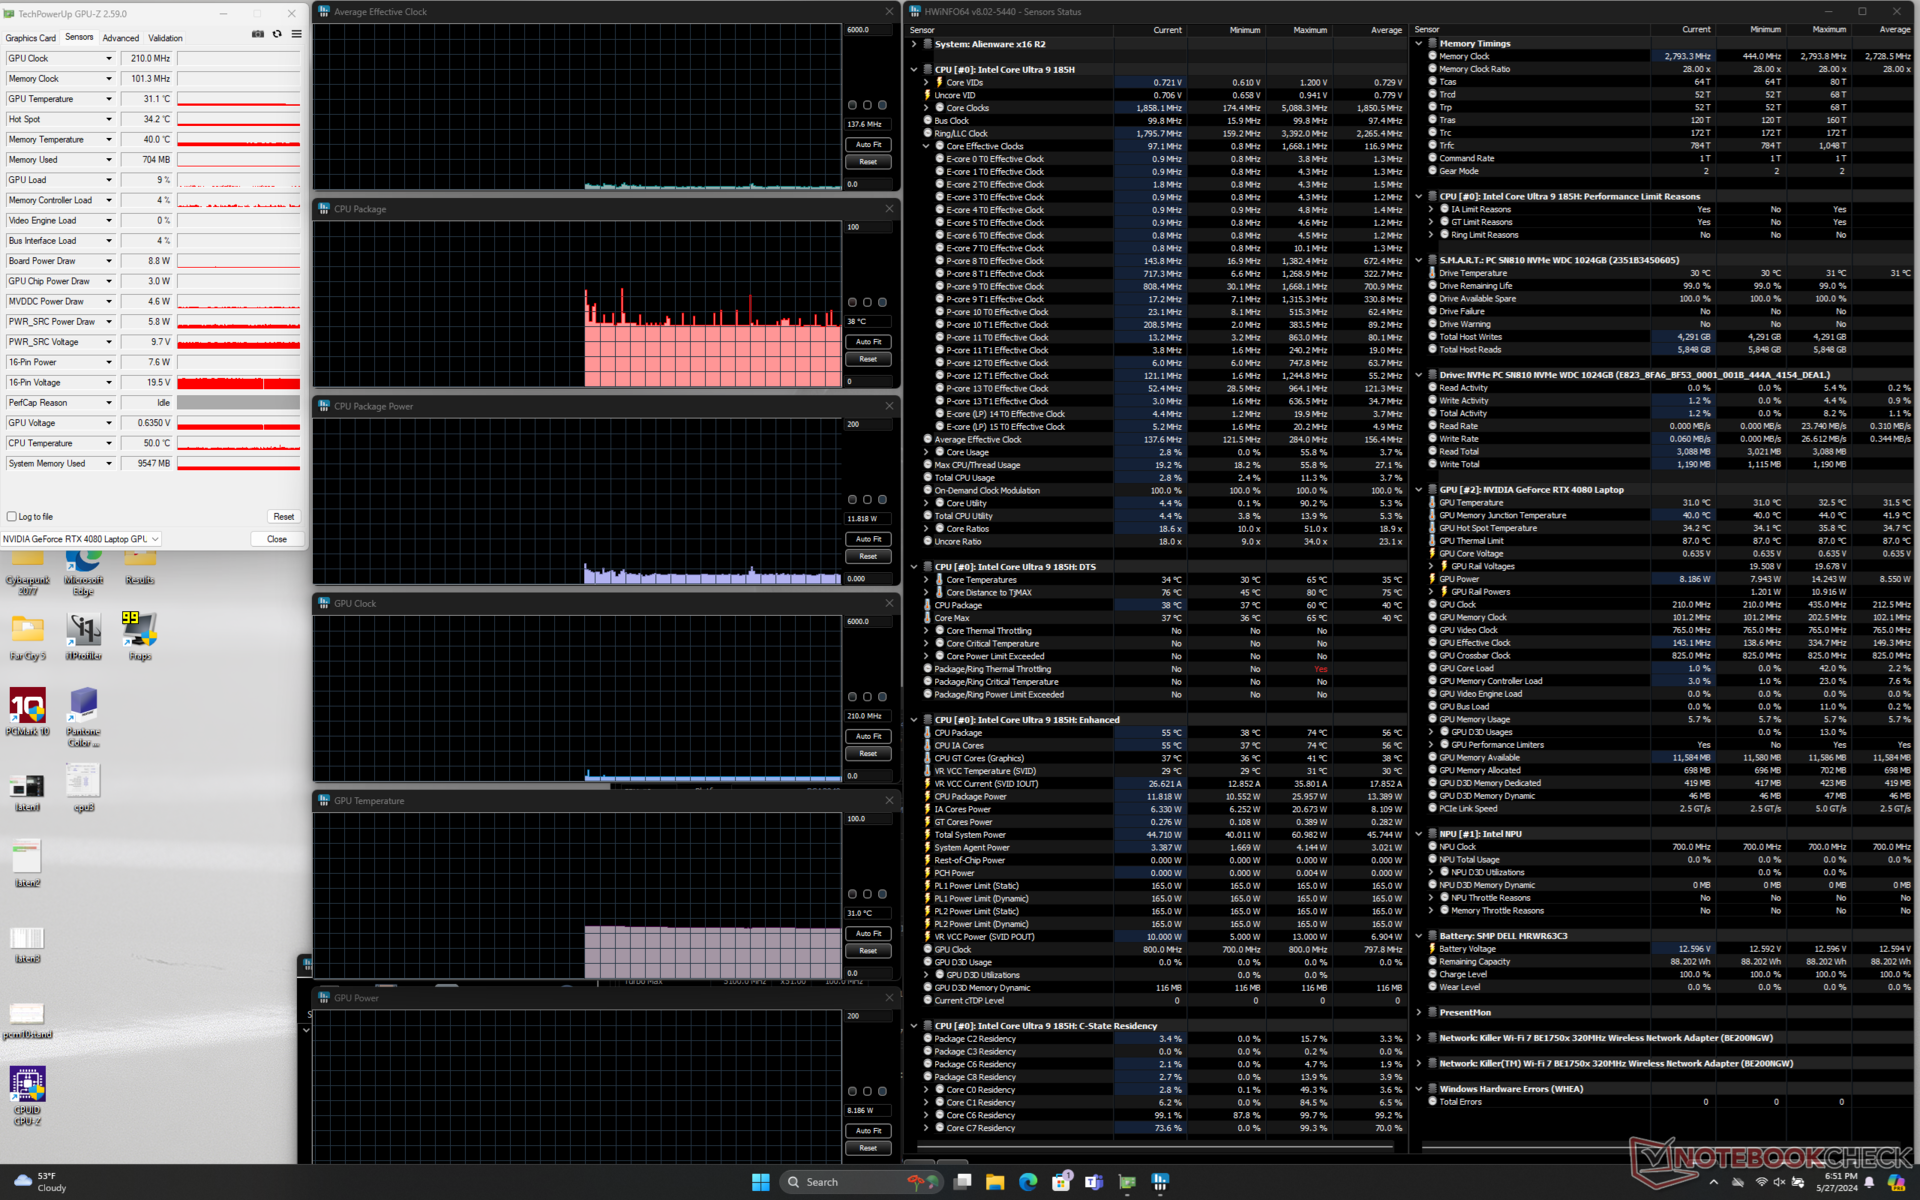
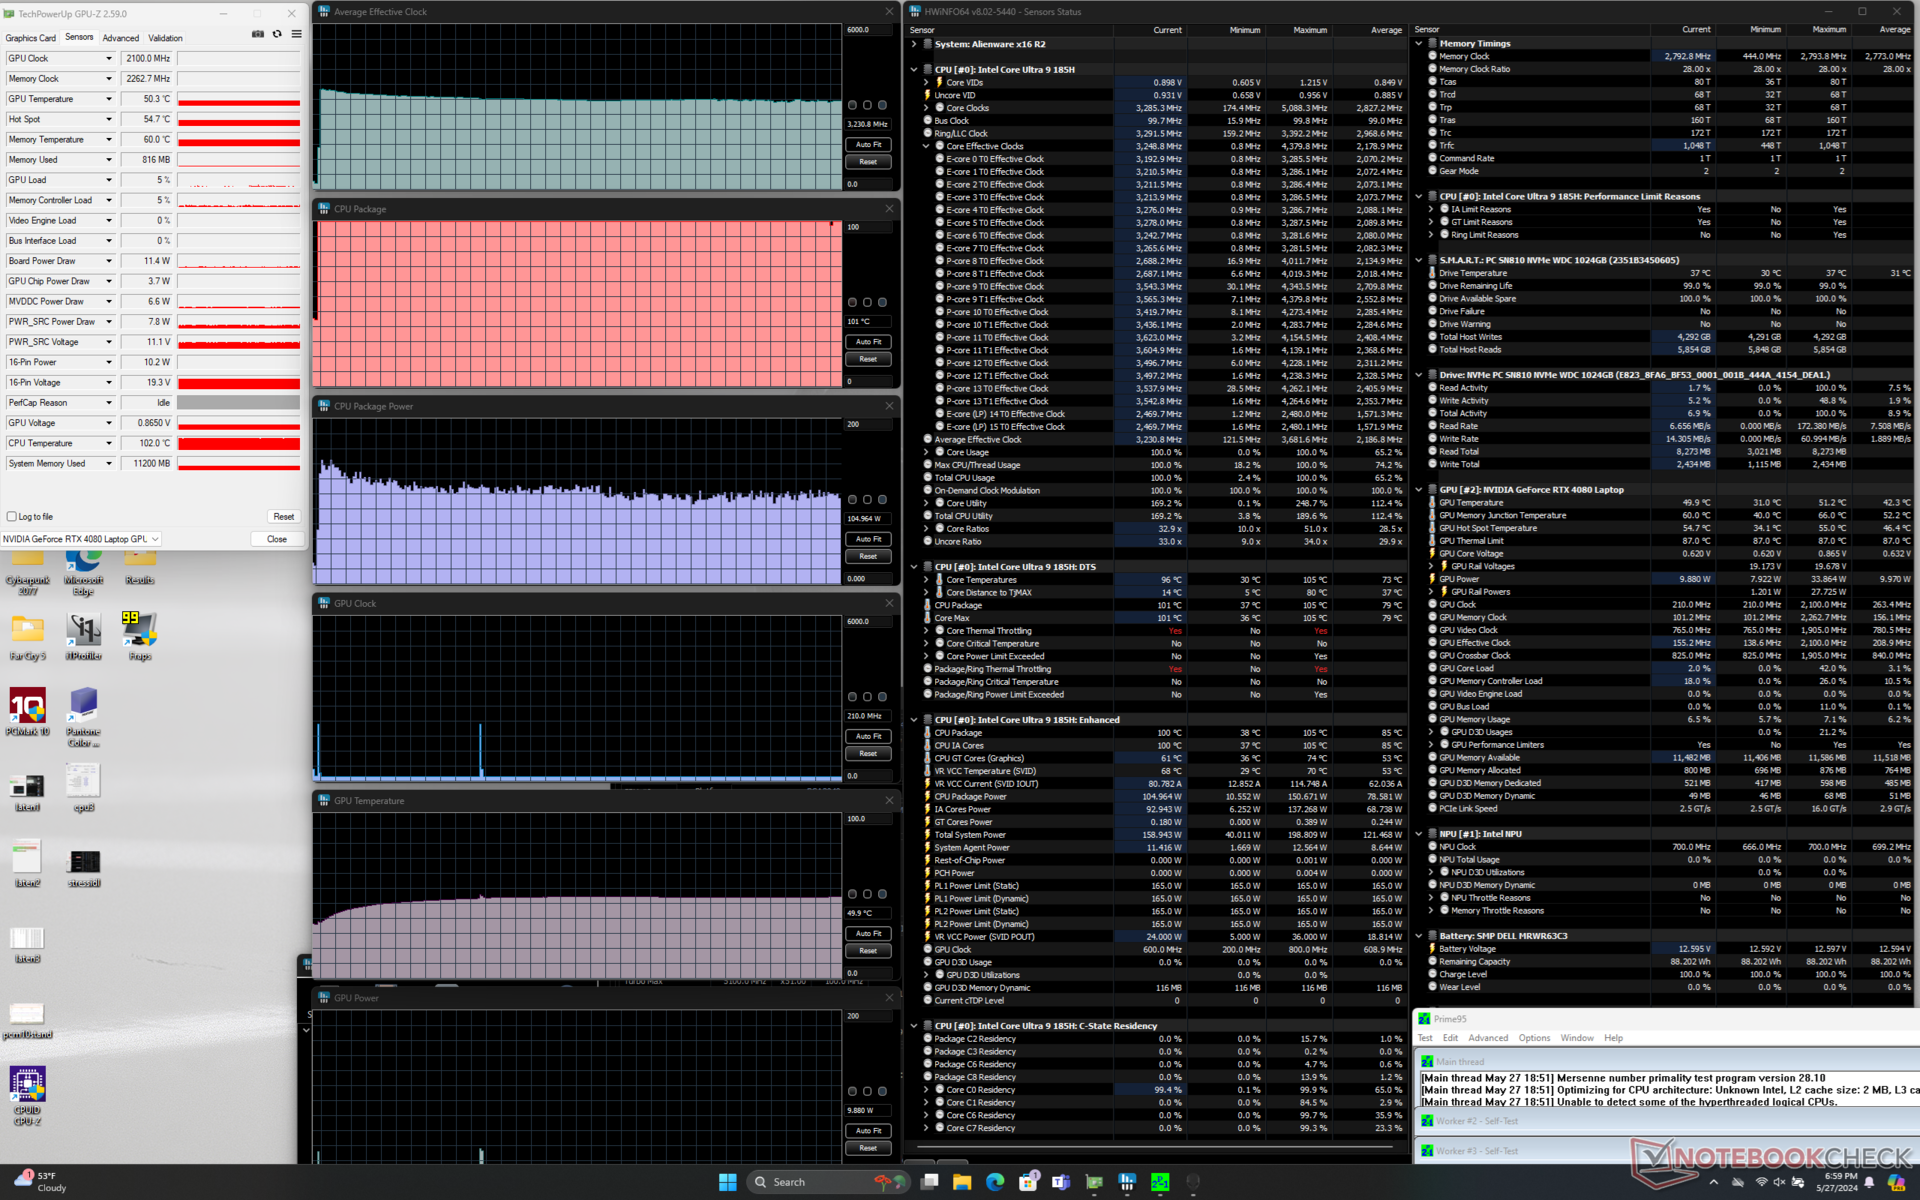
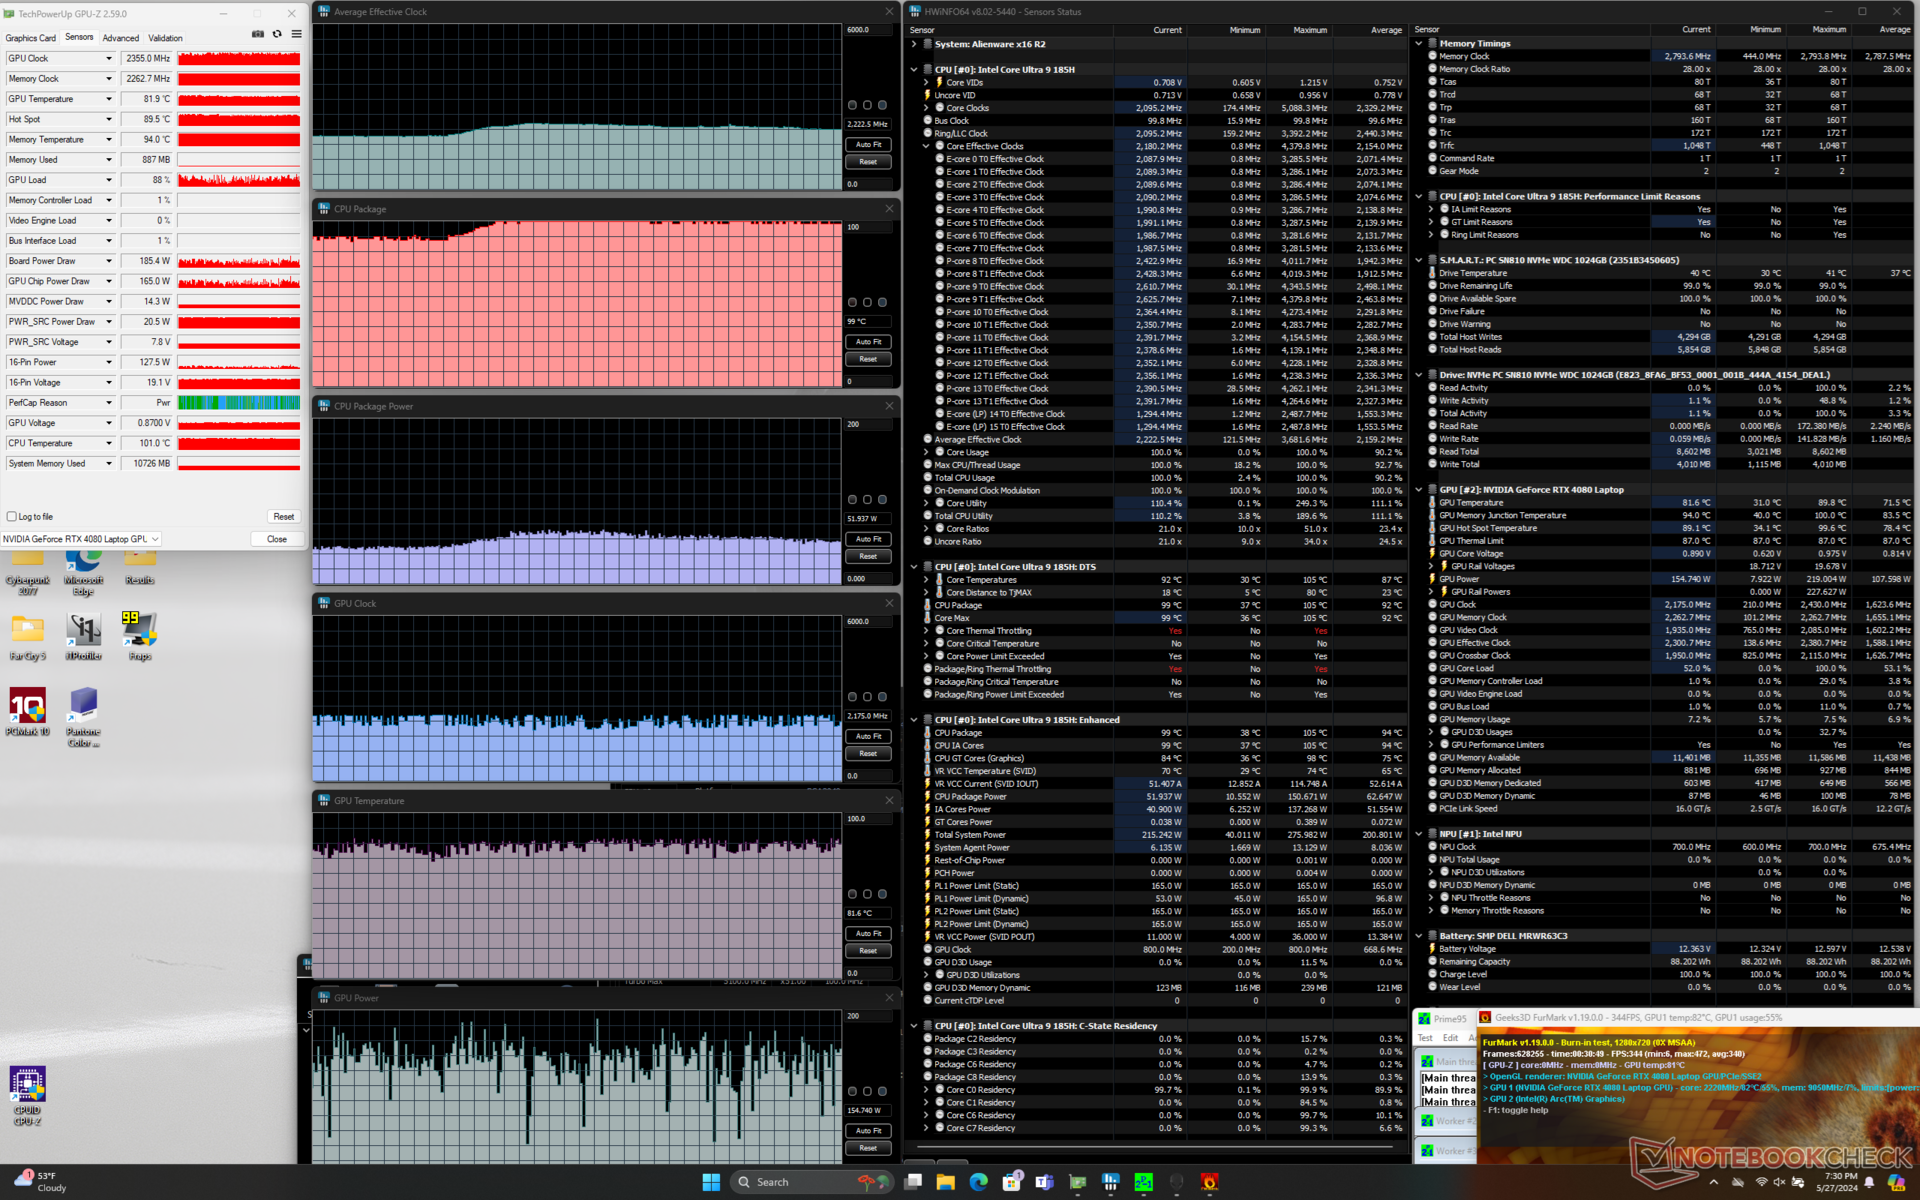
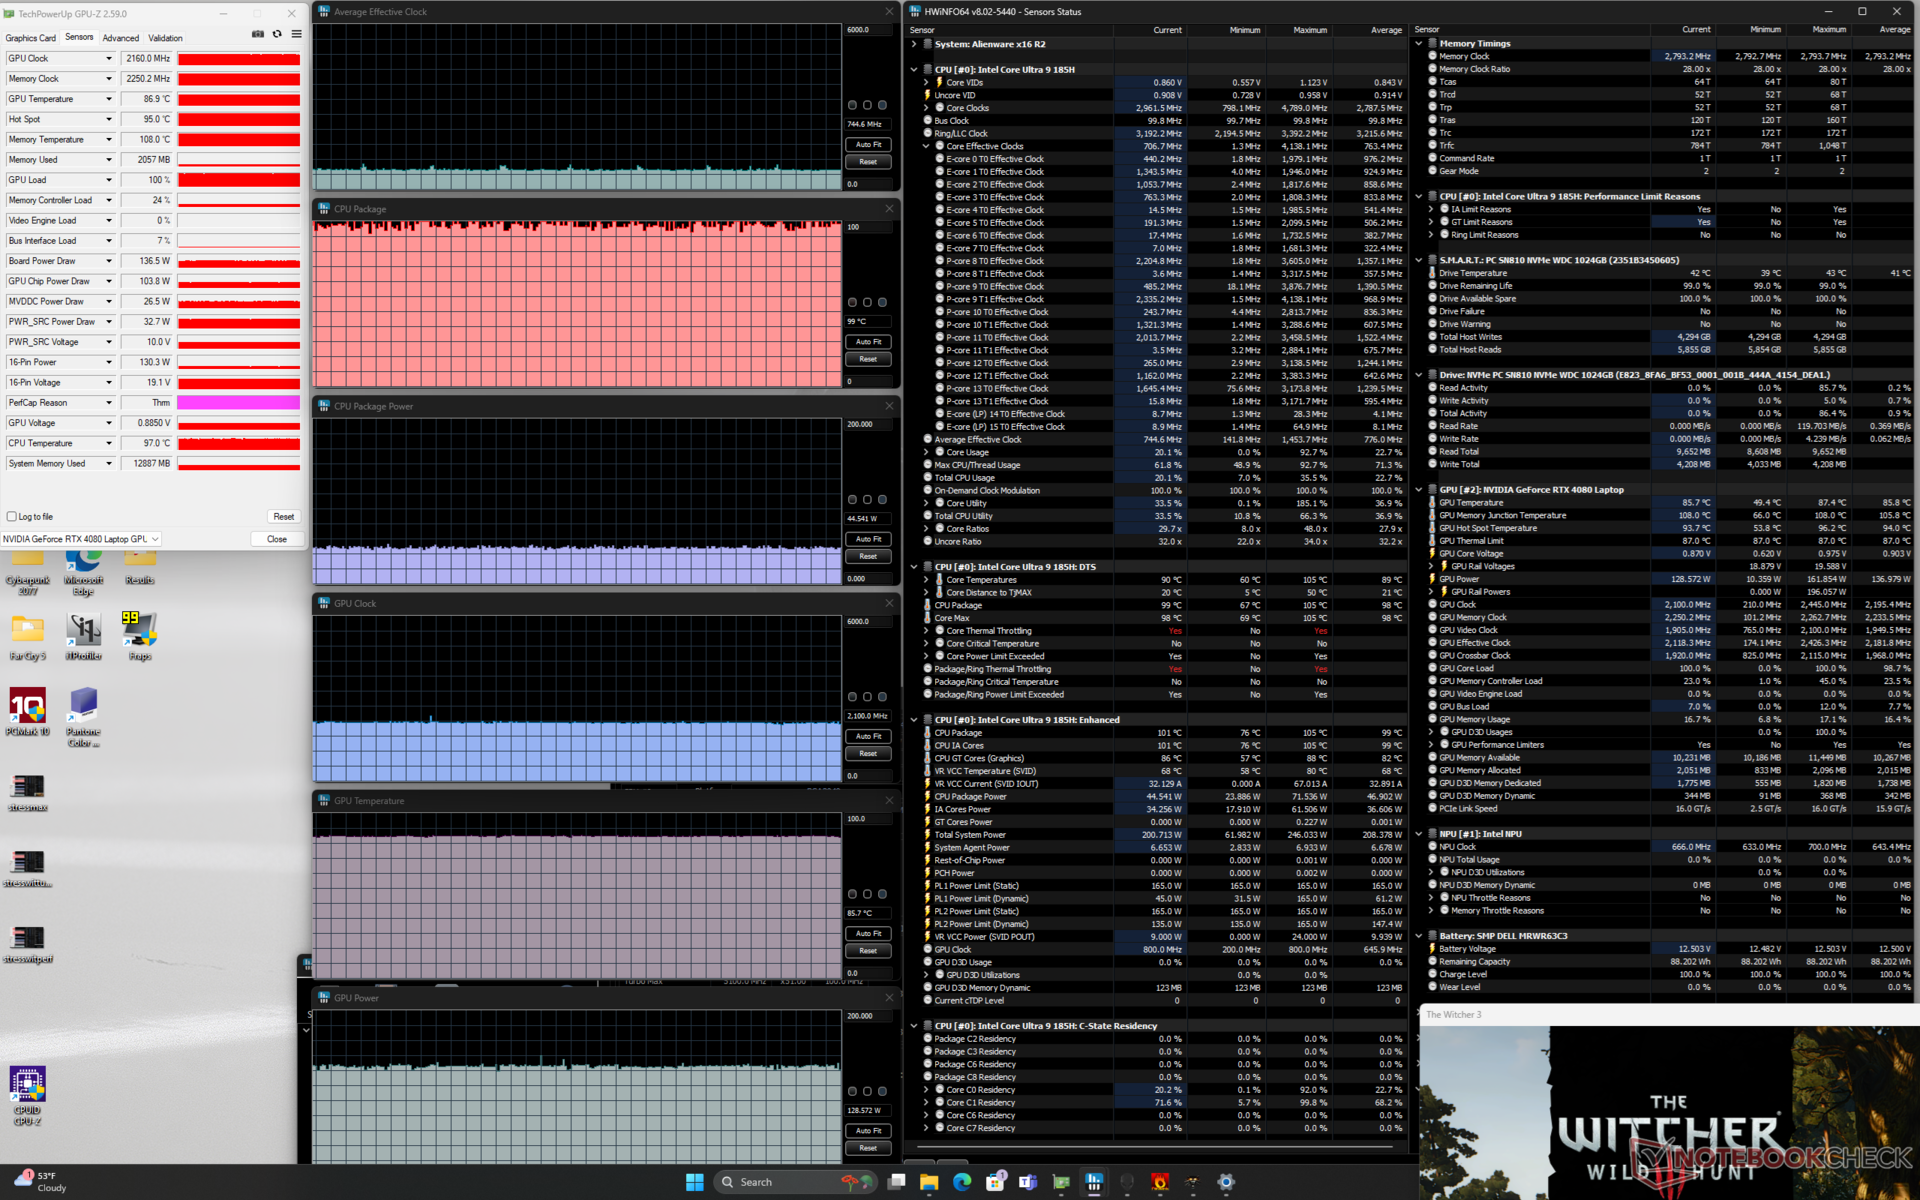
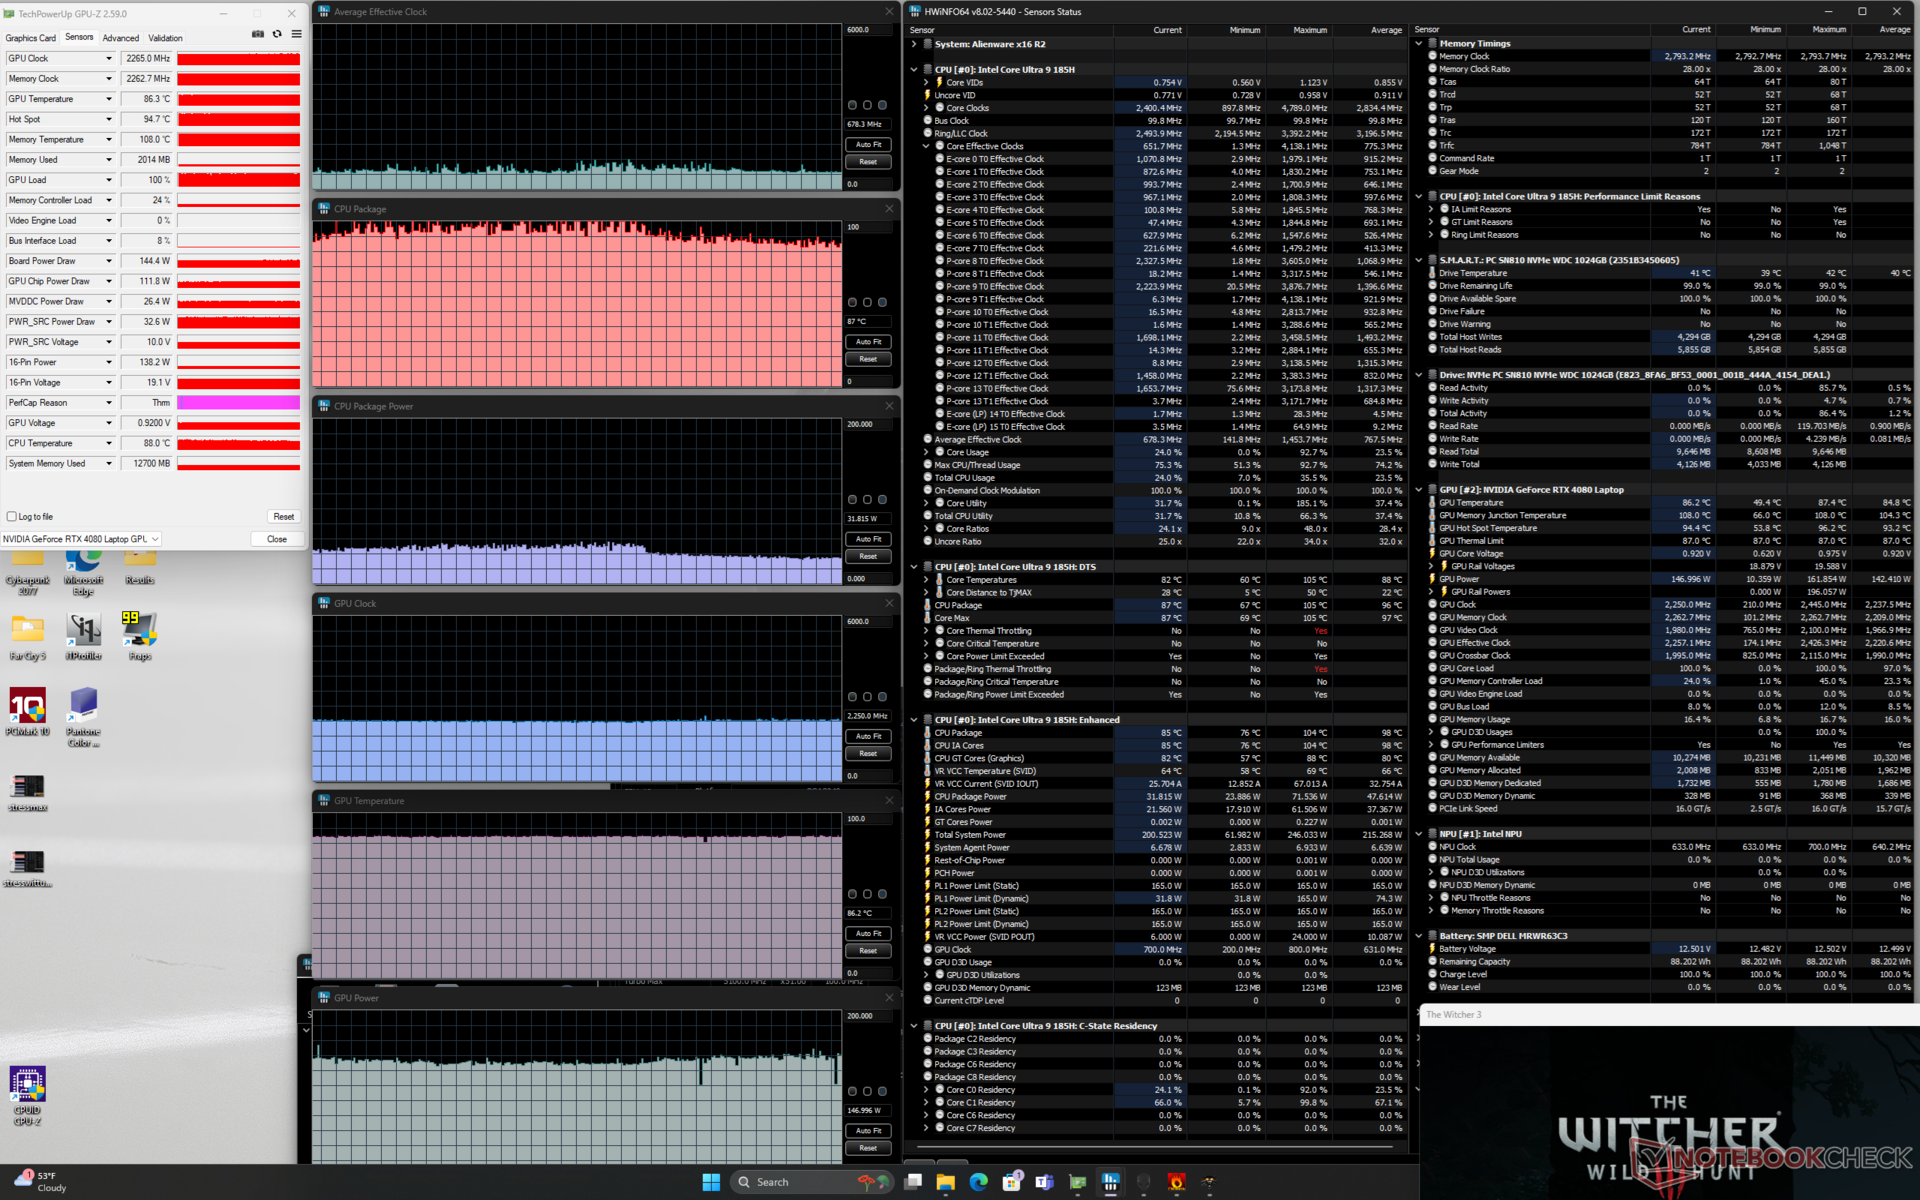
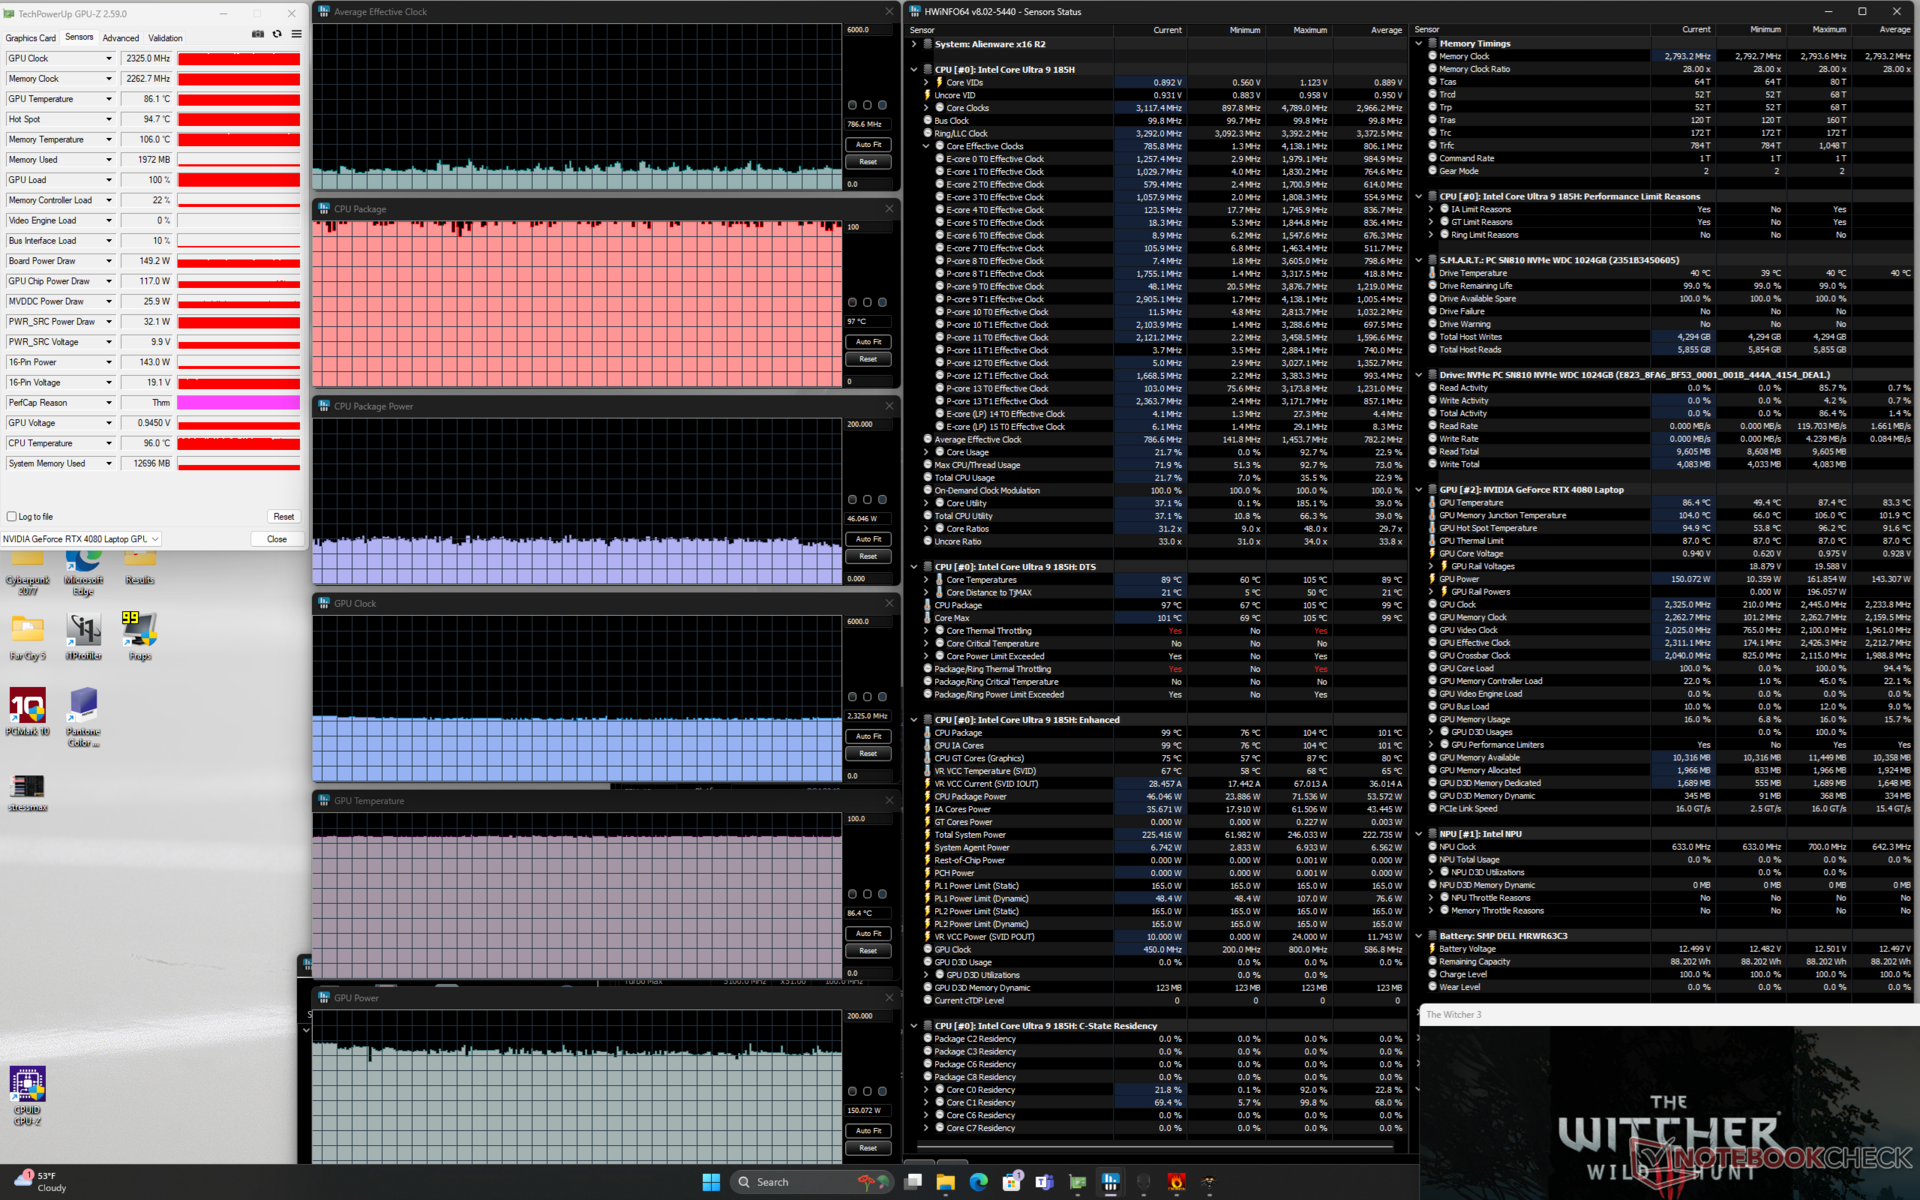
| Gemiddelde CPU-klok (GHz) | GPU-klok (MHz) | Gemiddelde CPU-temperatuur (°C) | Gemiddelde GPU-temperatuur (°C) | |
| Inactief systeem | -- | -- | 38 | 31 |
| Prime95-stress | 3.2 | -- | 101 | 50 |
| Prime95 + FurMark-stress | 2.2 | 2175 | 99 | 82 |
| Witcher 3 Stress (evenwichtige modus) | 0,7 | 2100 | 99 | 86 |
| Witcher 3 Belasting(prestatiemodus) | 0.7 | 2250 | 87 | 86 |
| Witcher 3 Belasting (Overdrive modus) | 0.8 | 2325 | 97 | 86 |
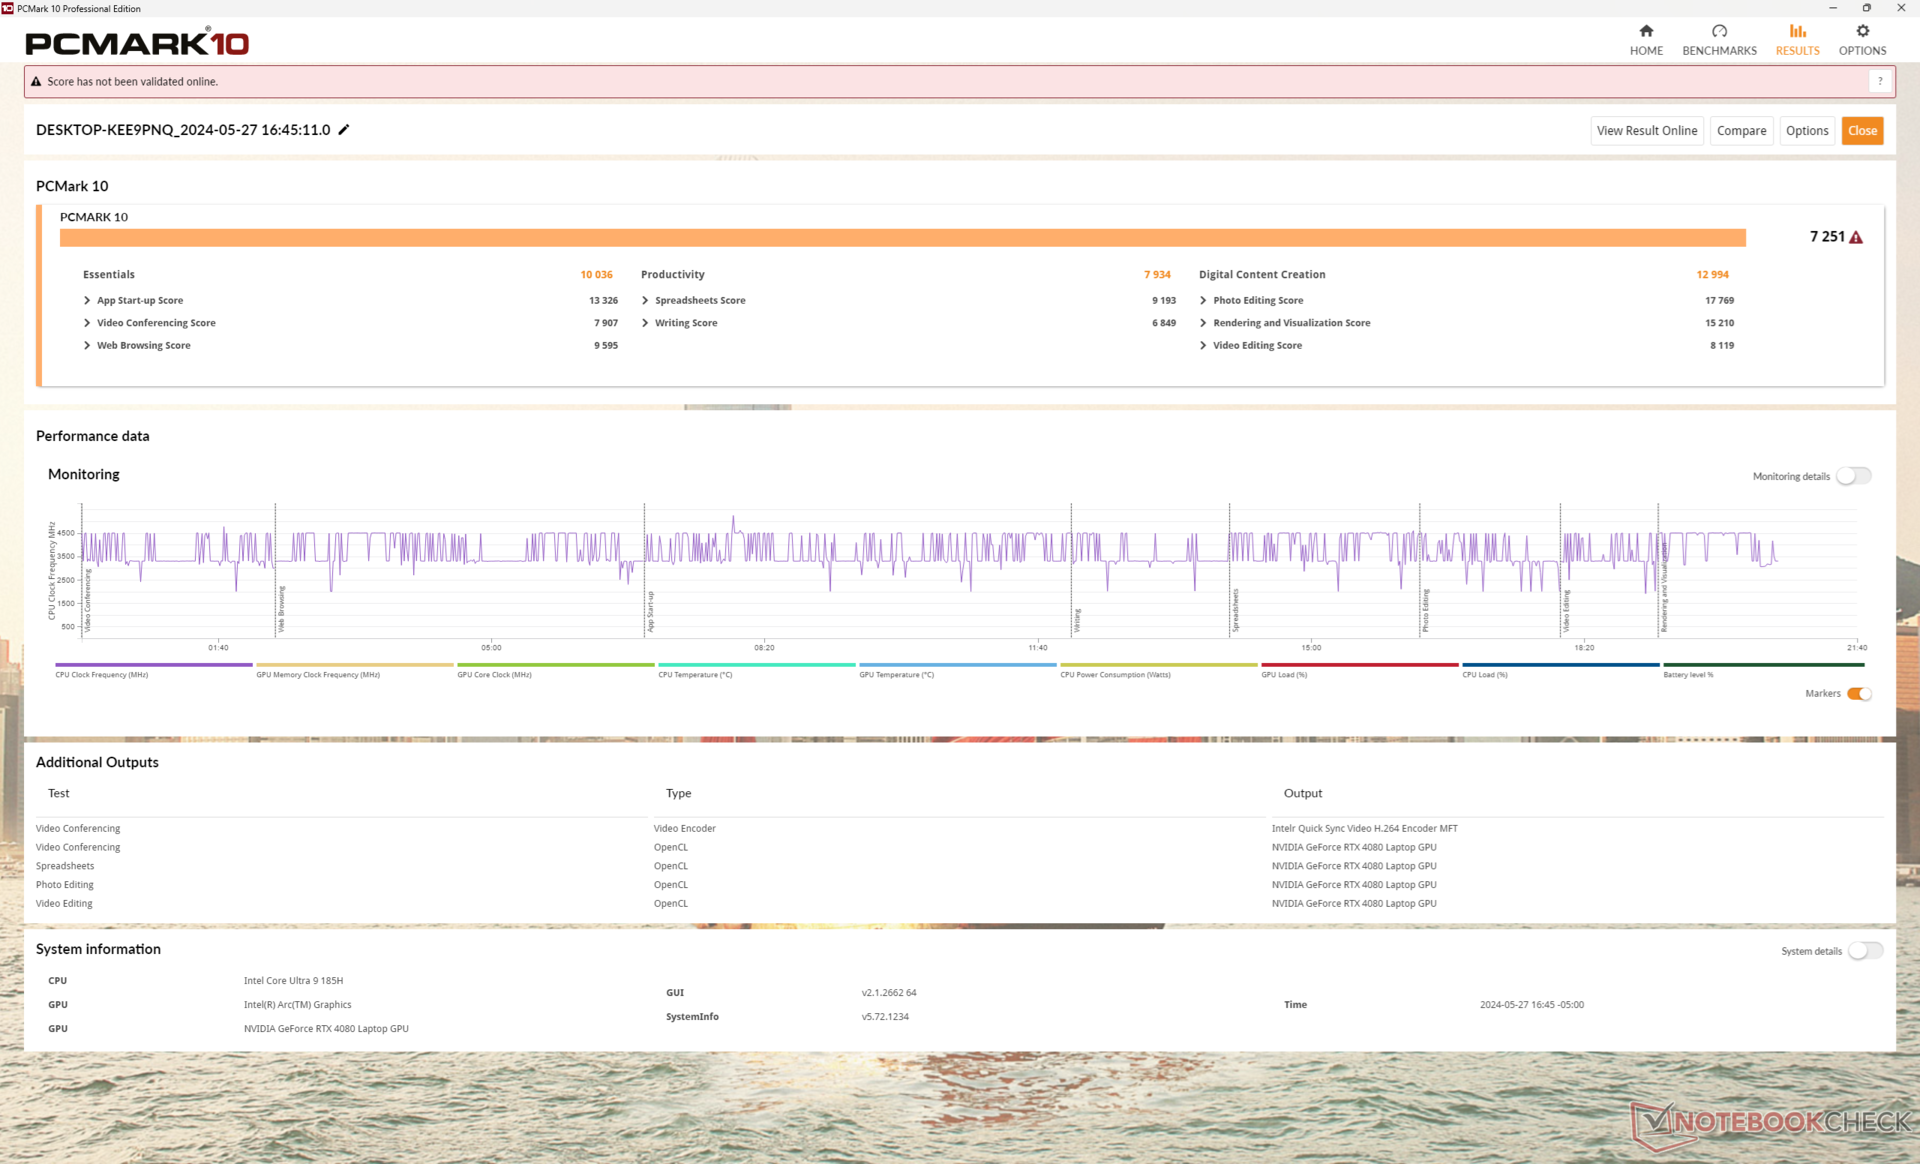
Systeemprestaties
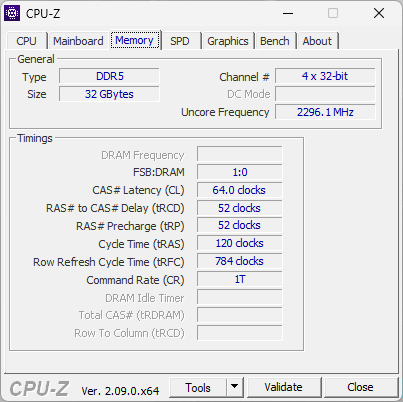
PCMark resultaten zijn ongeveer hetzelfde, zo niet lager dan voorheen. Ondertussen is RAM dit jaar iets sneller (7467 MT/s vs. 6000 MT/s) voor iets hogere AIDA64 kopieer-/leesresultaten, maar langzamere schrijf- en latentieresultaten.
CrossMark: Overall | Productivity | Creativity | Responsiveness
WebXPRT 3: Overall
WebXPRT 4: Overall
Mozilla Kraken 1.1: Total
| PCMark 10 / Score | |
| Lenovo Legion Pro 7 16IRX9H | |
| MSI Vector 16 HX A14V | |
| Alienware x16 R1 | |
| Alienware m16 R2 | |
| Asus ROG Strix Scar 16 G634JZR | |
| Alienware x16 R2 P120F | |
| Gemiddeld Intel Core Ultra 9 185H, NVIDIA GeForce RTX 4080 Laptop GPU (n=1) | |
* ... kleiner is beter
| PCMark 10 Score | 7251 punten | |
Help | ||
| AIDA64 / Memory Copy | |
| Alienware x16 R2 P120F | |
| Gemiddeld Intel Core Ultra 9 185H (69929 - 95718, n=19) | |
| Asus ROG Strix Scar 16 G634JZR | |
| Lenovo Legion Pro 7 16IRX9H | |
| MSI Vector 16 HX A14V | |
| Alienware x16 R1 | |
| Alienware m16 R2 | |
* ... kleiner is beter
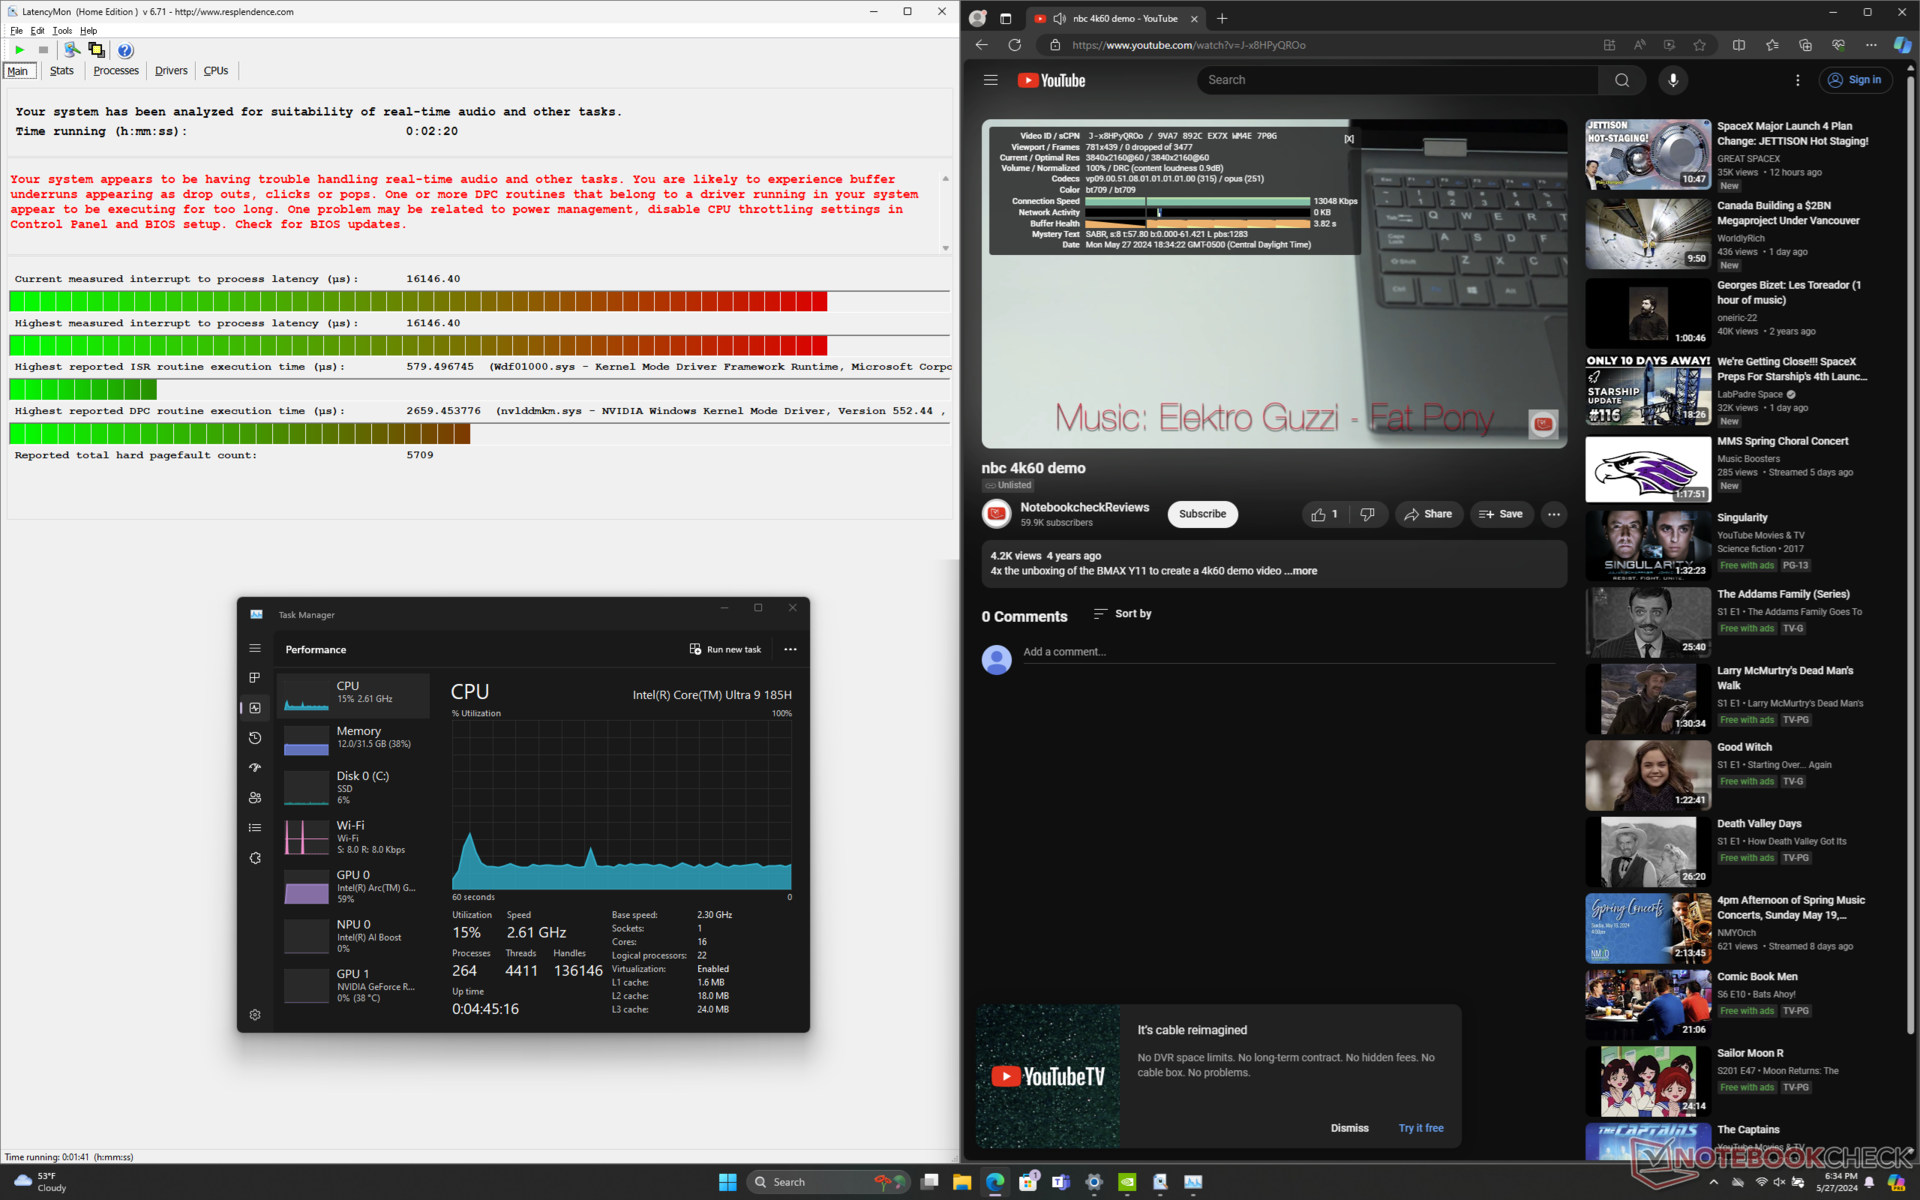
DPC latentie
LatencyMon laat opmerkelijke DPC-problemen zien bij het openen van meerdere browsertabbladen van onze startpagina, zelfs na meerdere pogingen in de Optimus-modus. Dergelijke problemen ondervonden we niet op de originele x16 R1. het afspelen van 4K-video's bij 60 FPS is verder perfect, zonder dropped frames.
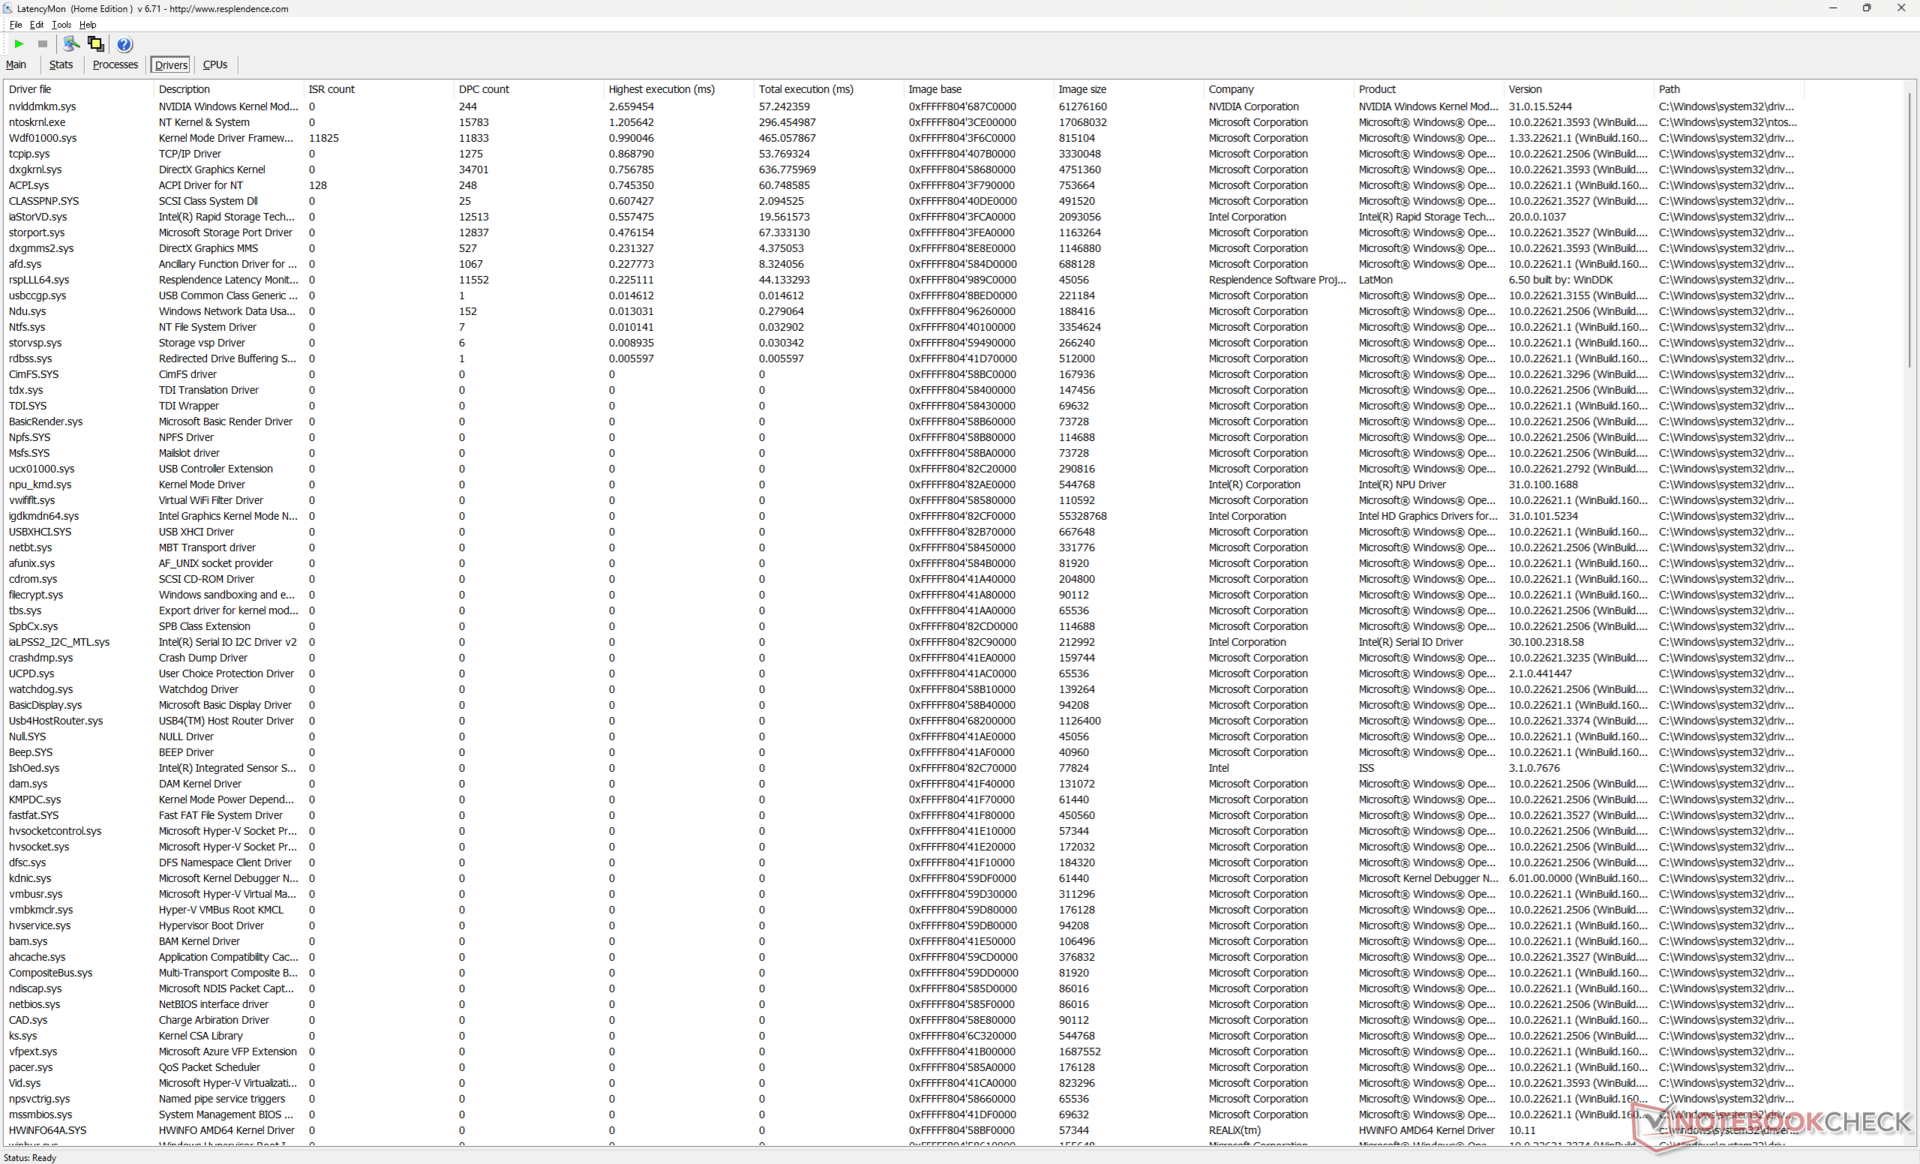
| DPC Latencies / LatencyMon - interrupt to process latency (max), Web, Youtube, Prime95 | |
| Alienware x16 R2 P120F | |
| Asus ROG Strix Scar 16 G634JZR | |
| Alienware m16 R2 | |
| MSI Vector 16 HX A14V | |
| Alienware x16 R1 | |
| Lenovo Legion Pro 7 16IRX9H | |
* ... kleiner is beter
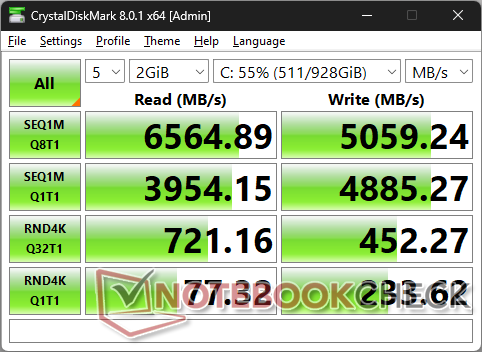
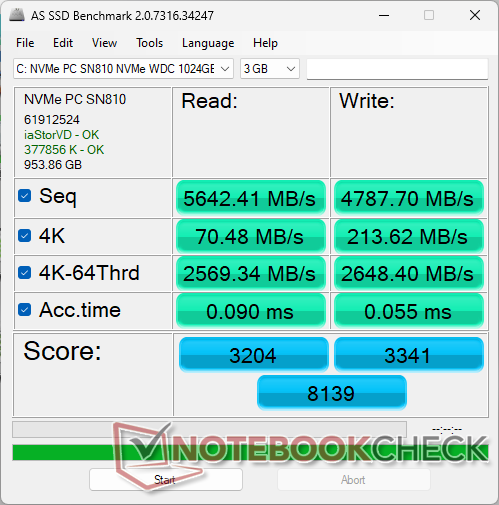
Opslagapparaten
Ons testapparaat wordt geleverd met de WDC PC SN810 in plaats van de SK Hynix PC801 van het model van vorig jaar. De Western Digital schijf kan de maximale overdrachtsnelheden langer volhouden dan de SK Hynix, zoals blijkt uit onze DiskSpd-lusgrafiek hieronder, maar de schrijfsnelheden zijn over het algemeen langzamer.

| Drive Performance Rating - Percent | |
| Lenovo Legion Pro 7 16IRX9H | |
| Alienware x16 R1 | |
| Alienware x16 R2 P120F | |
| Alienware m16 R2 | |
| Asus ROG Strix Scar 16 G634JZR | |
| MSI Vector 16 HX A14V | |
* ... kleiner is beter
Disk Throttling: DiskSpd Read Loop, Queue Depth 8
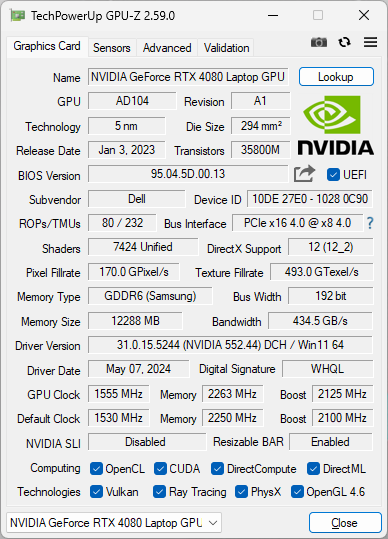
GPU-prestaties
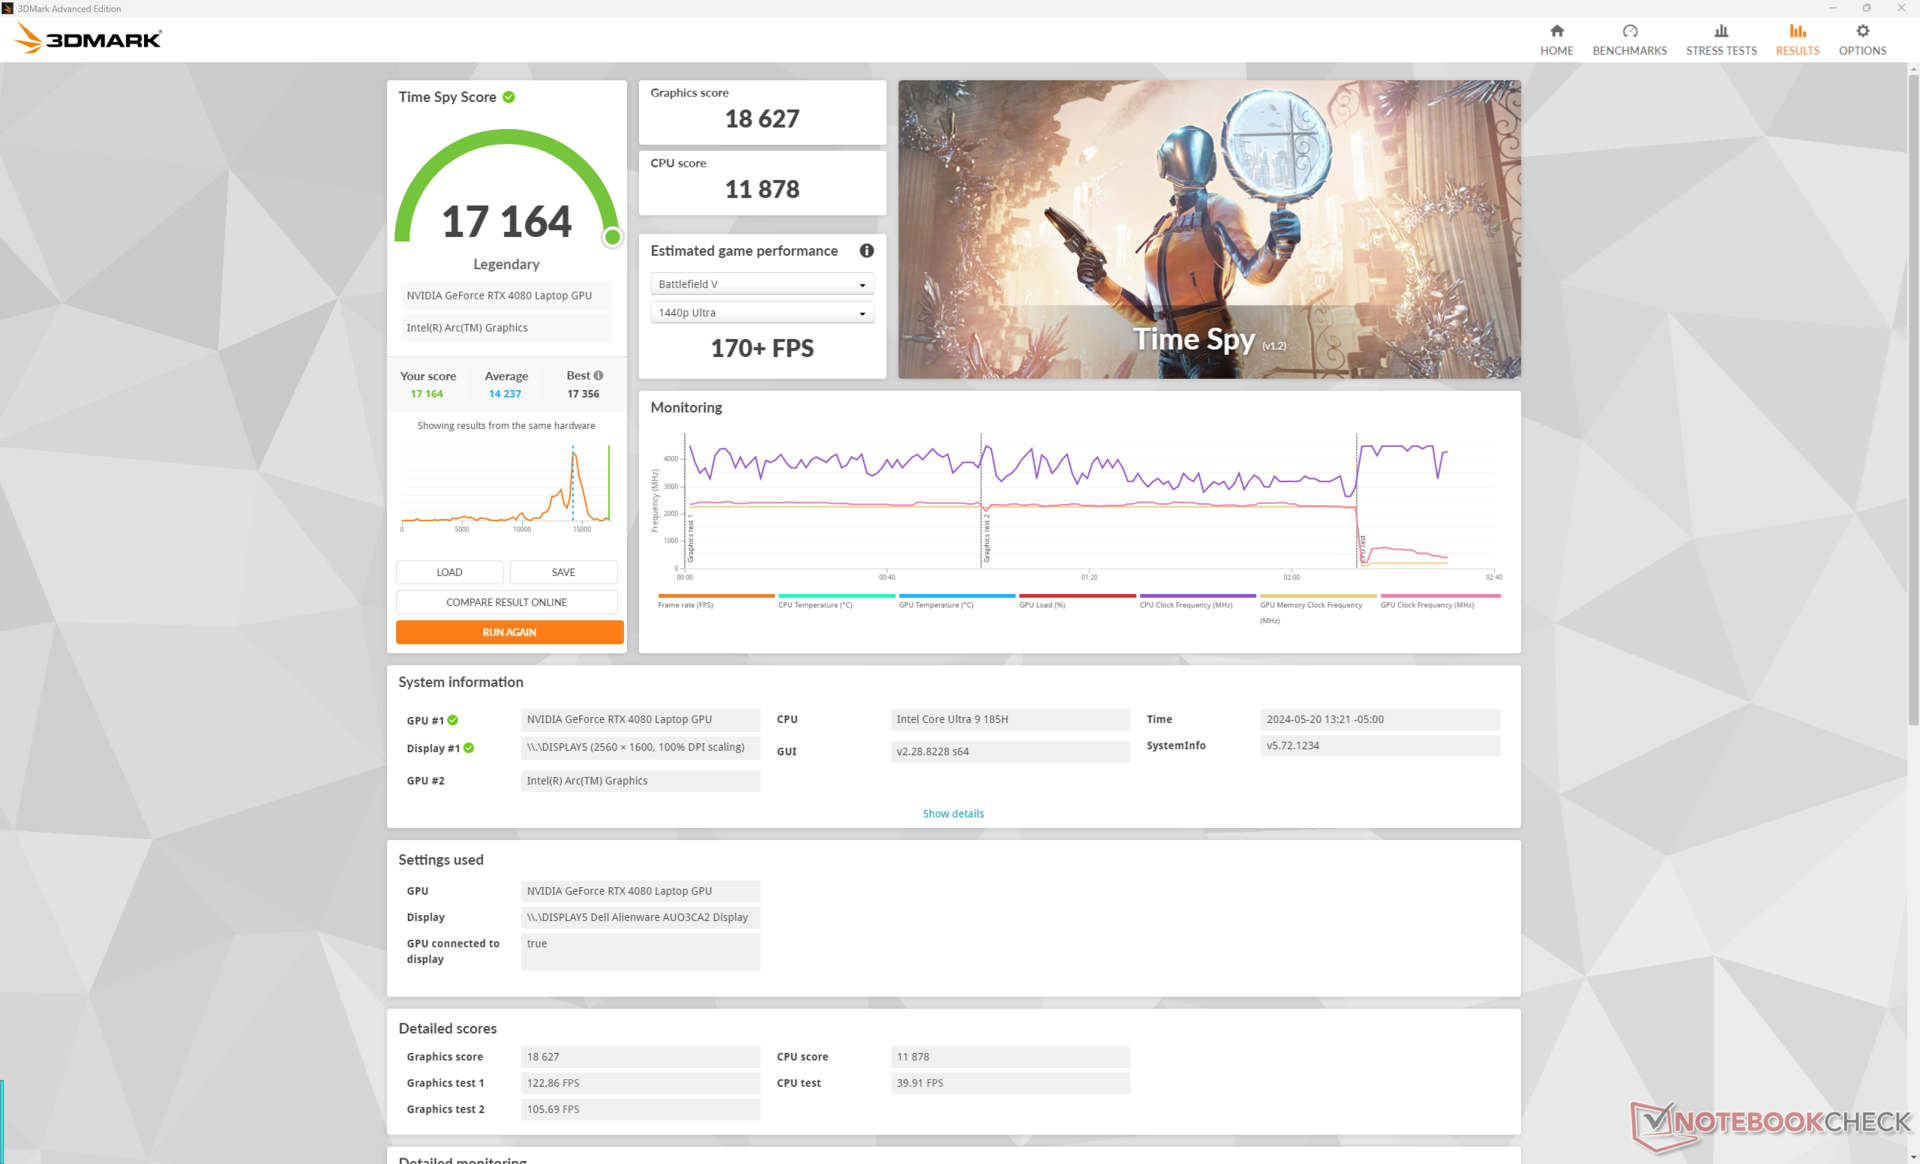
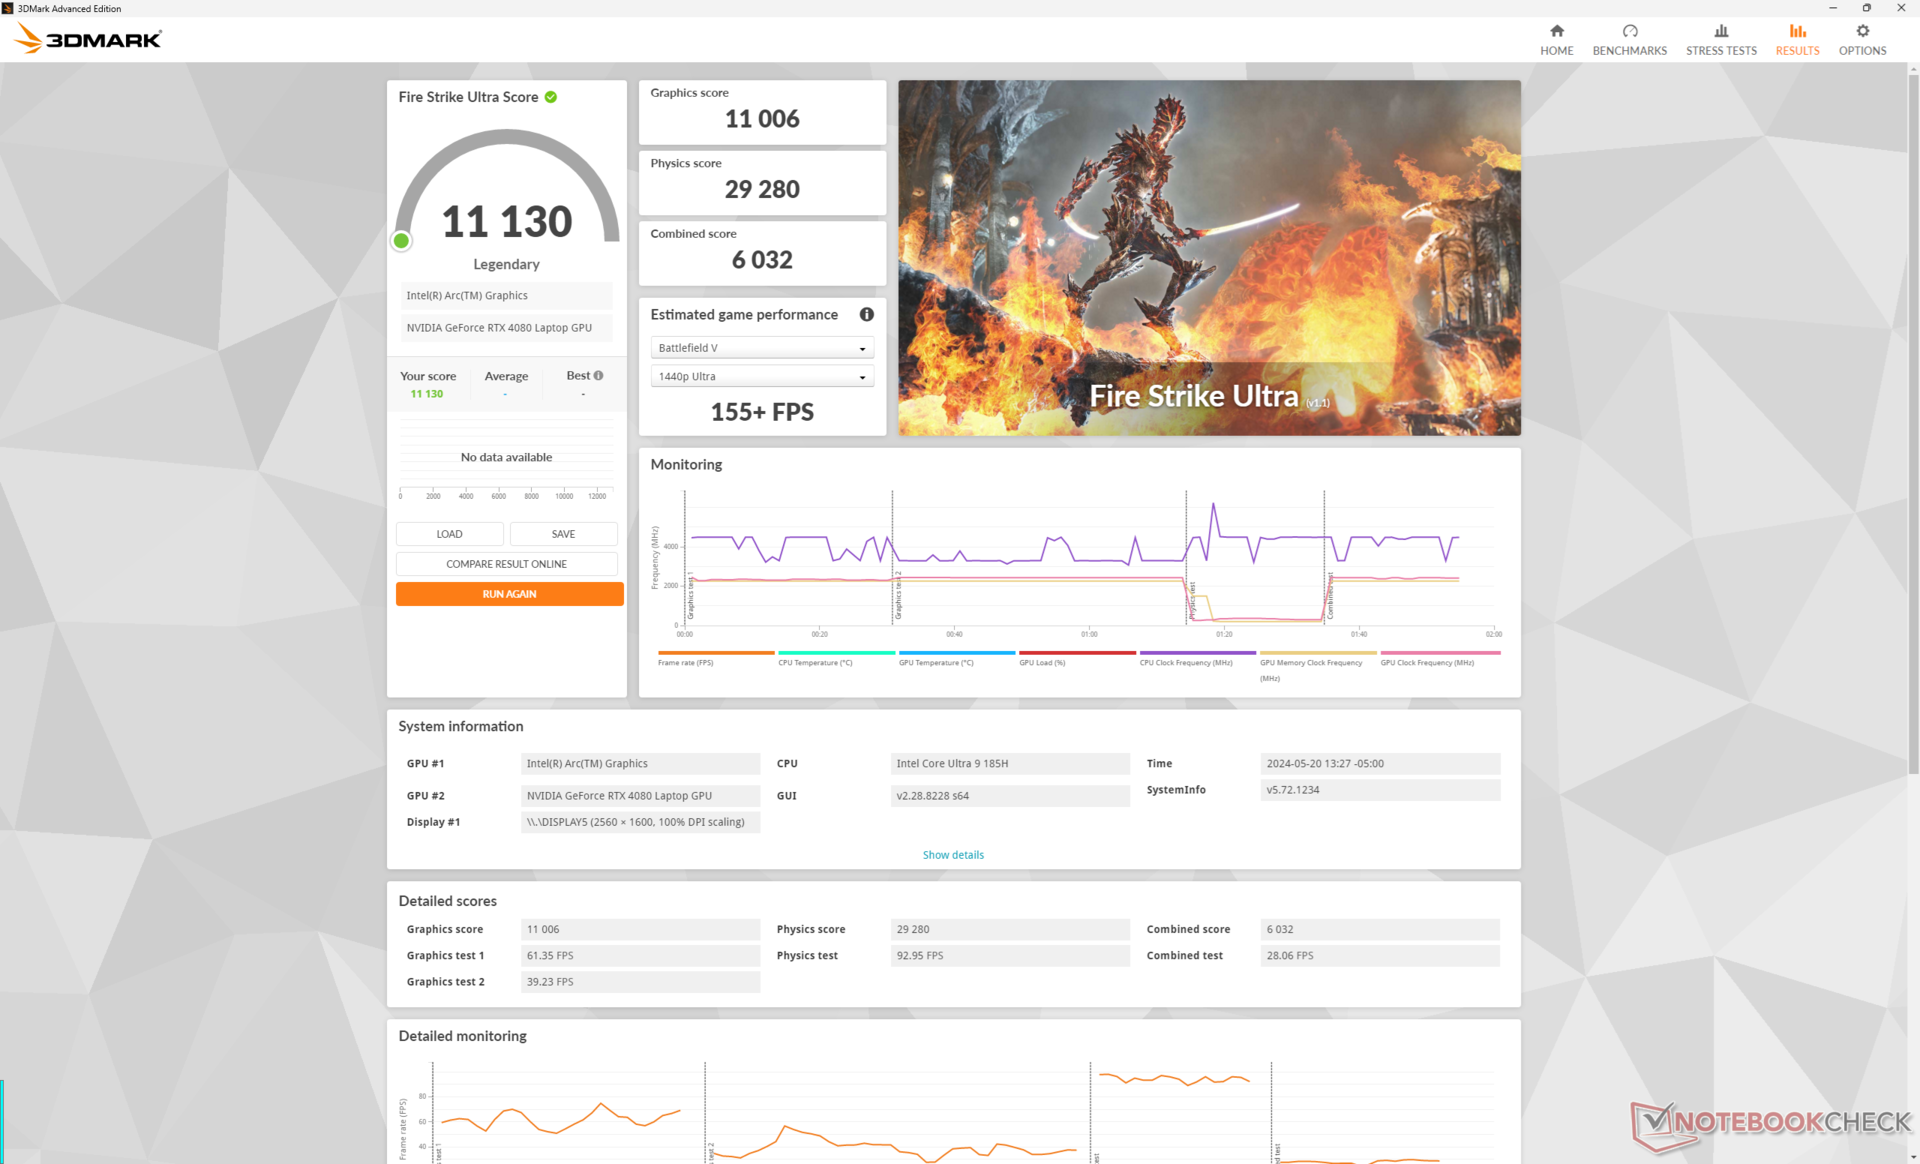
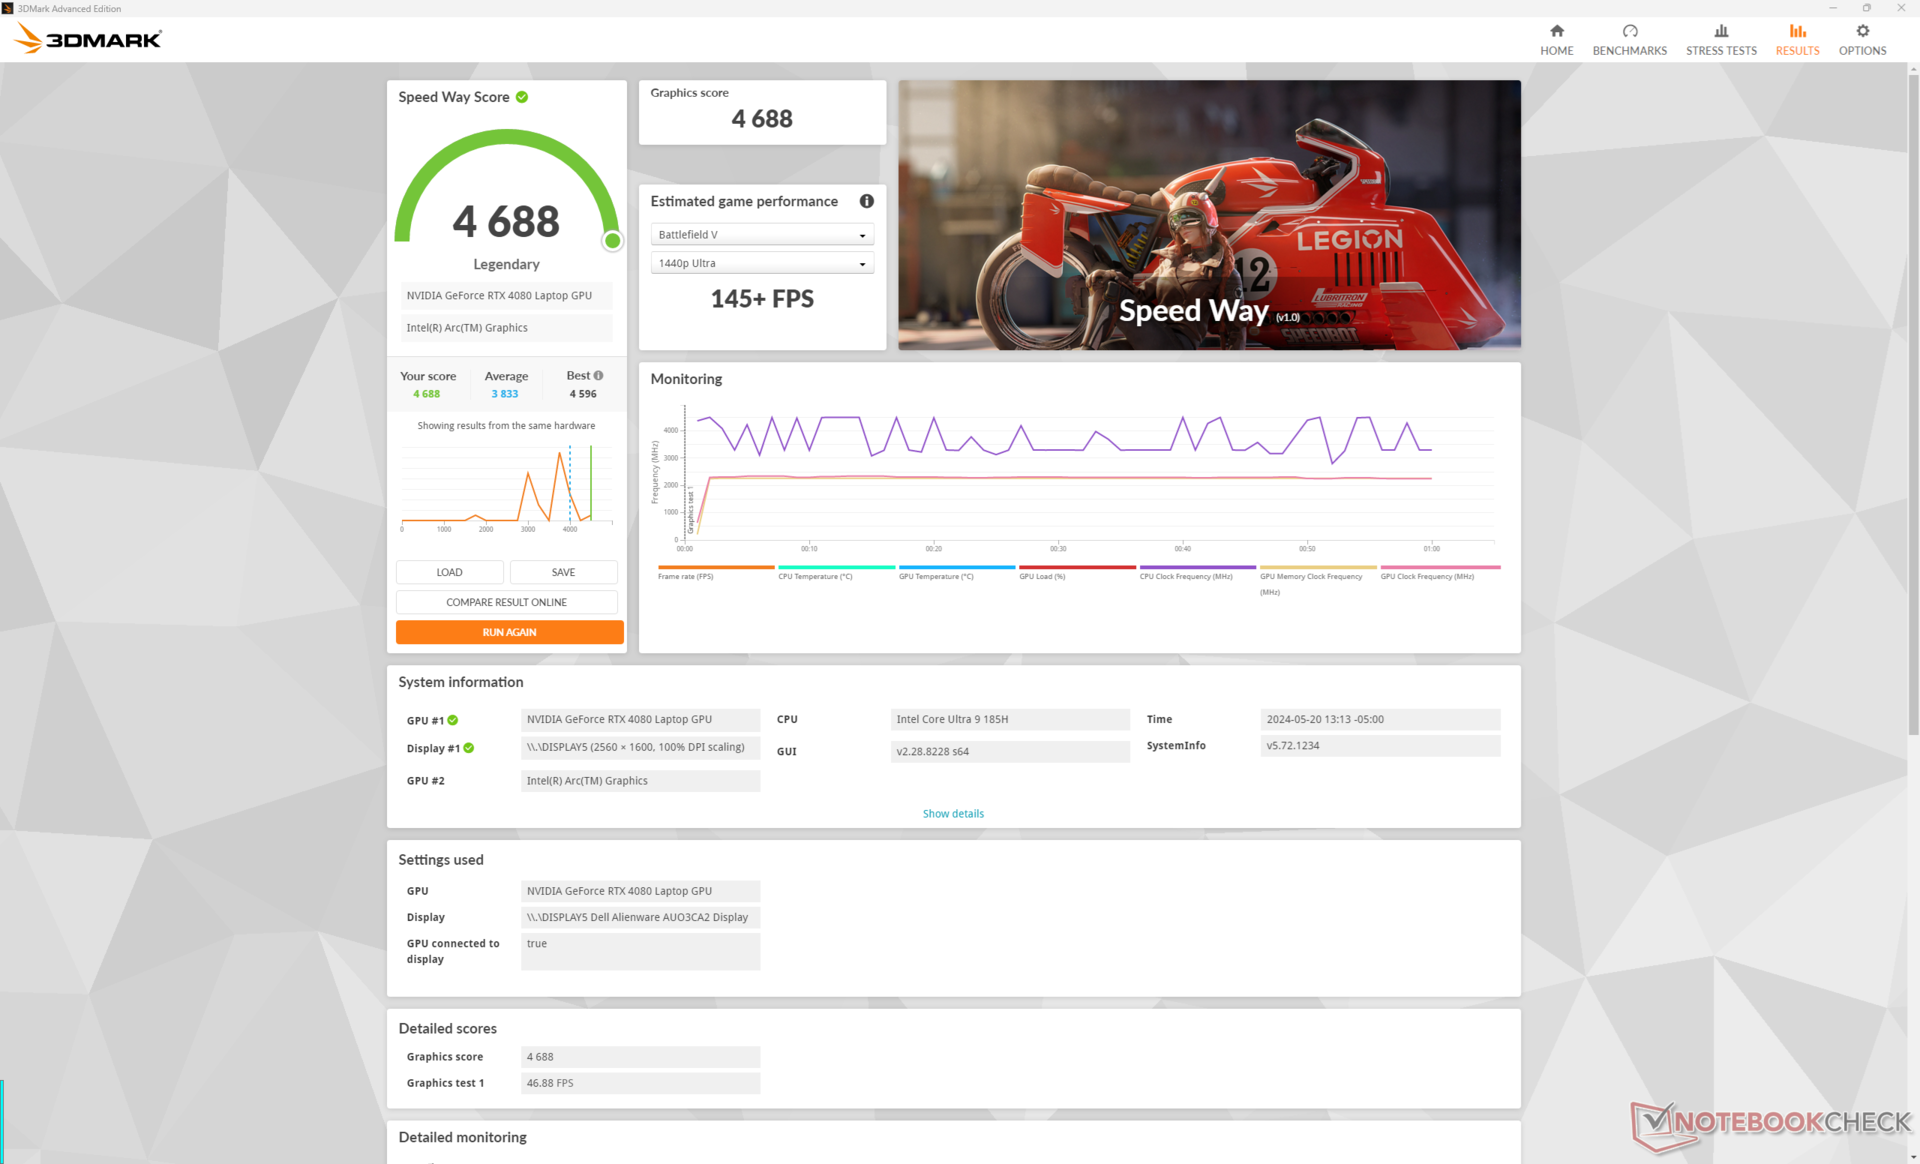
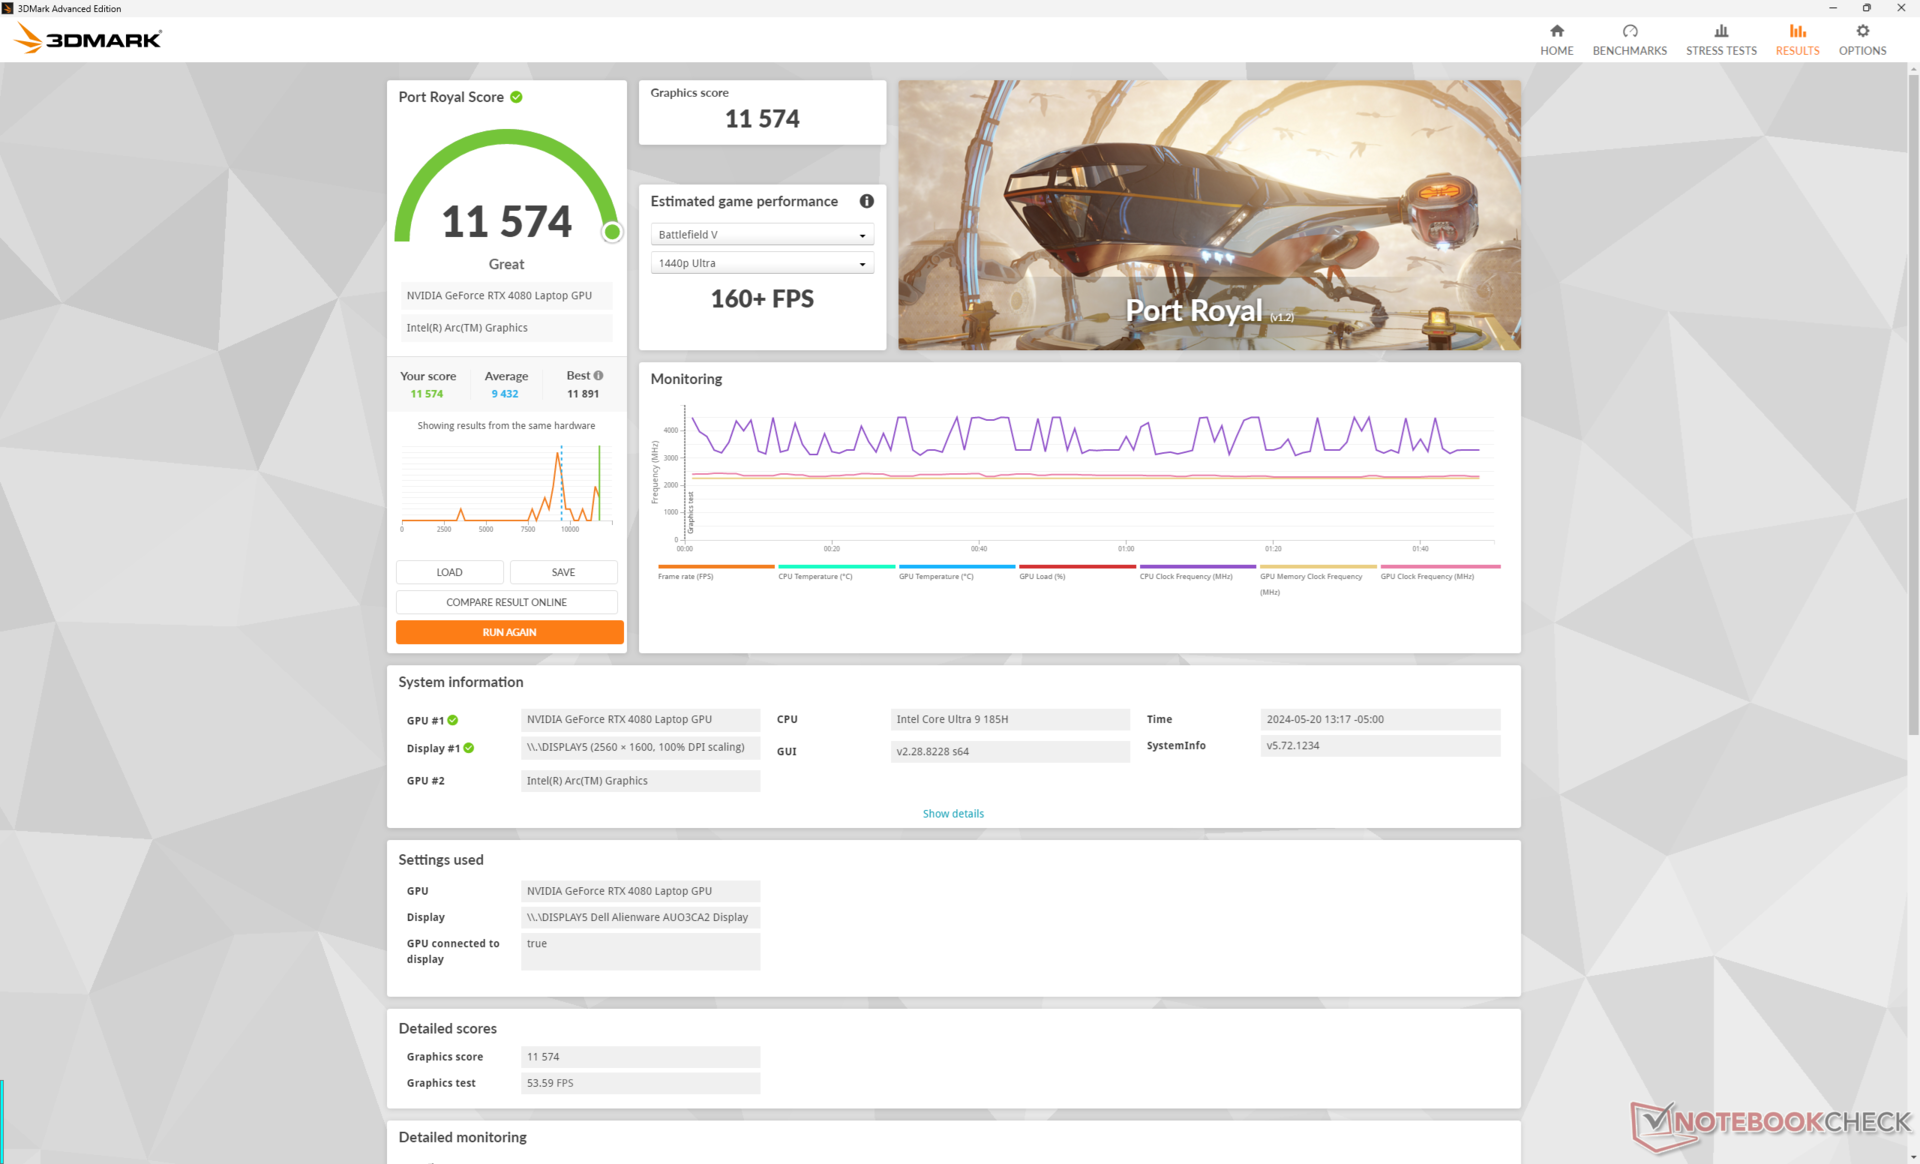
De 175 W mobiele GeForce RTX 4080 GPU blijft hetzelfde, zij het met 3DMark-scores die ongeveer 5 procent langzamer zijn dan wat we registreerden op de x16 R1. Opwaarderen naar de RTX 4090 configuratie zal de prestaties naar verwachting met slechts 5 tot 15 procent verbeteren, terwijl downgraden naar de RTX 4070 of 4060 de prestaties met respectievelijk 30 en 45 procent zal verminderen.
| Vermogen Profiel | Grafische Score | Natuurkunde Score | Gecombineerde Score |
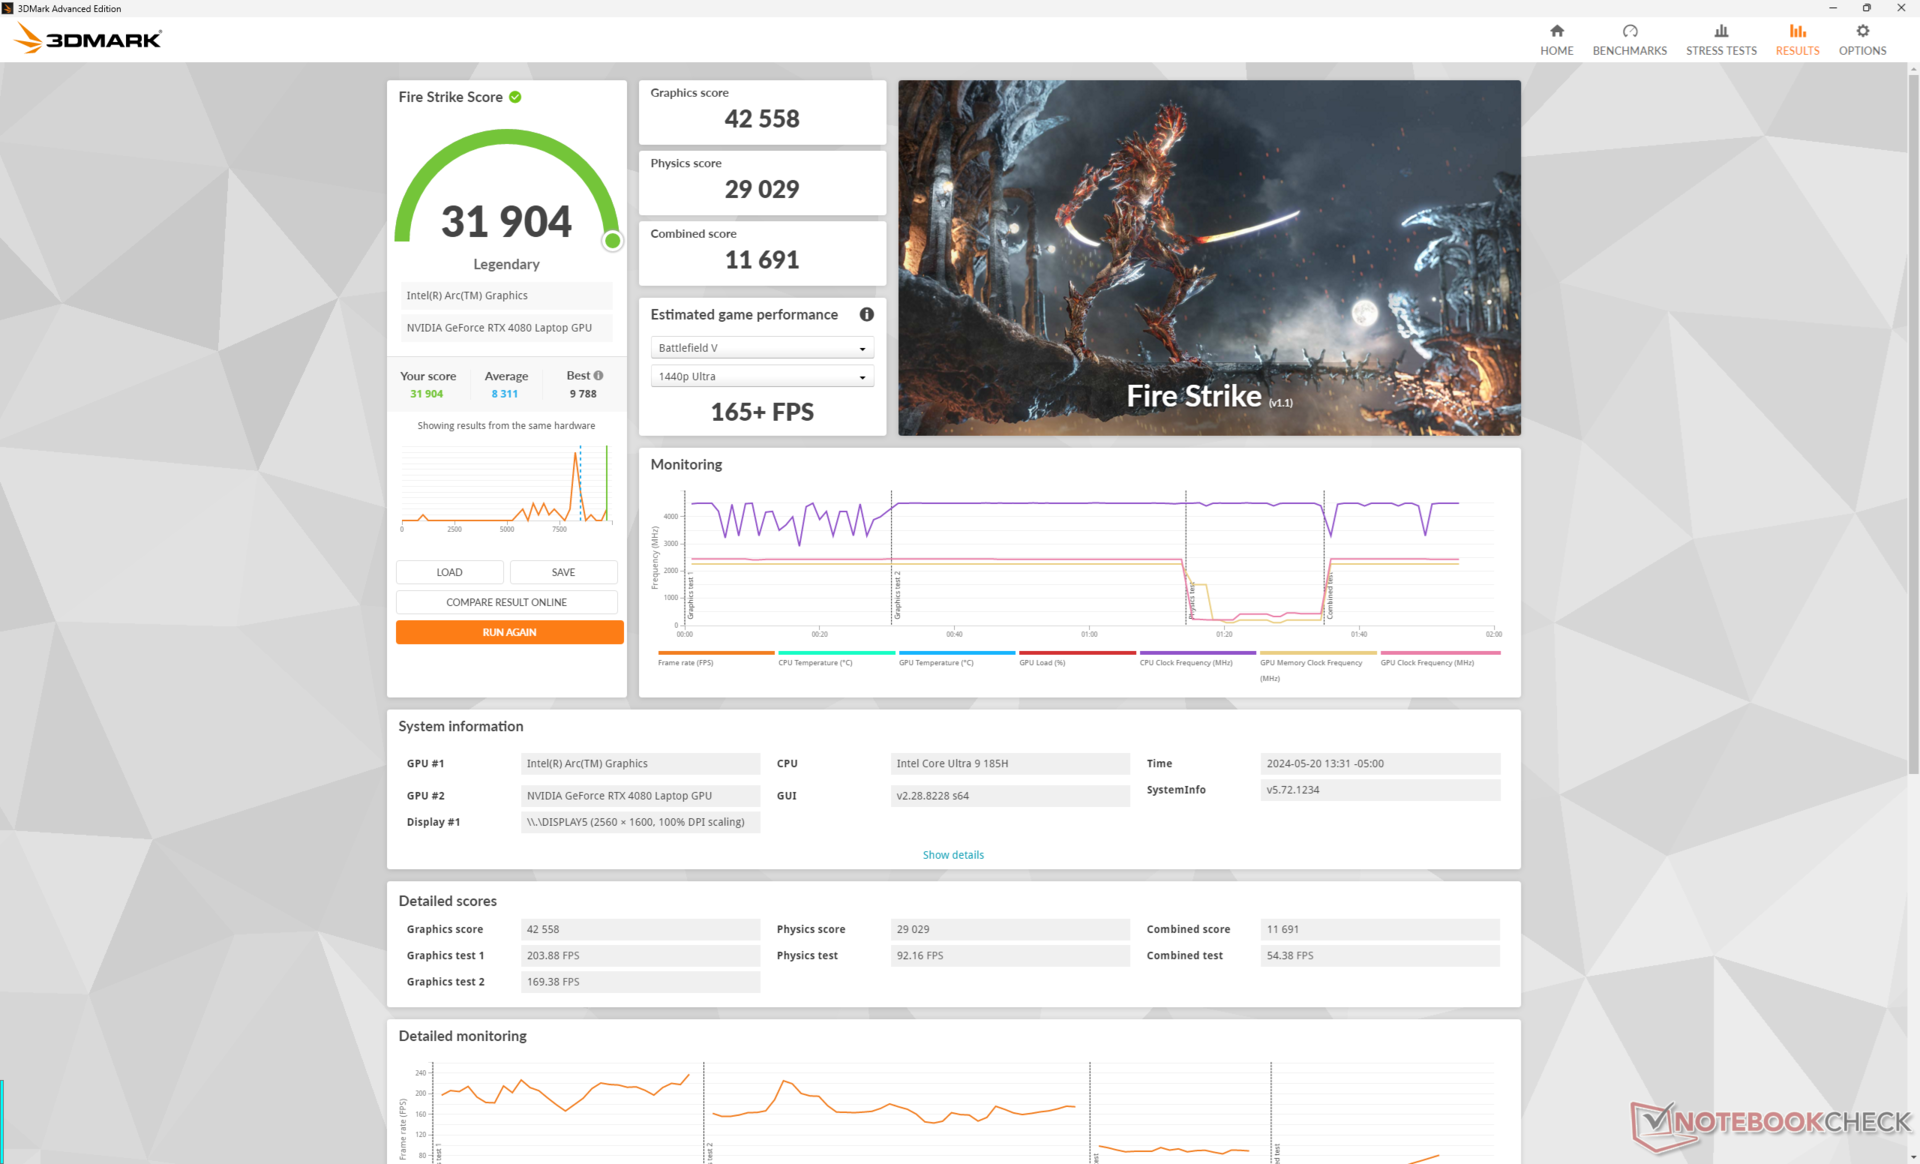
| Overdrive modus | 42558 | 29029 | 11691 |
| Prestatiemodus | 40773 (-4%) | 26070 (-10%) | 12450 (-7%) |
| Gebalanceerde modus | 40593 (-5%) | 26746 (-8%) | 12237 (-5%) |
| Batterijvermogen | 21754 (-49%) | 25880 (-11%) | 9863 (-16%) |
Het draaien van het systeem in de modus Prestaties in plaats van de modus Overdrive heeft een kleine invloed op de algehele prestaties, zoals onze bovenstaande tabel met Fire Strike resultaten laat zien. Interessant is dat het verschil tussen de modi Prestaties en Gebalanceerd in vergelijking veel kleiner is.
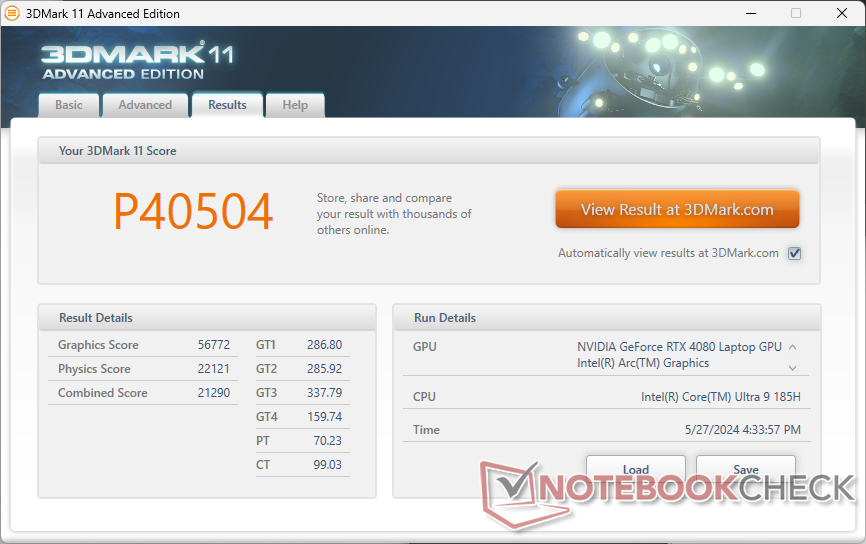
| 3DMark 11 Performance | 40504 punten | |
| 3DMark Fire Strike Score | 31904 punten | |
| 3DMark Time Spy Score | 17164 punten | |
Help | ||
* ... kleiner is beter
Gaming prestaties
Teleurstellend genoeg waren de prestaties in games consistent 5 tot 15 procent langzamer dan wat we op de x16 R1 vastlegden. De grotere delta's treden op bij lagere resoluties, terwijl de kleinere delta's optreden bij hogere resoluties, wat overeenkomt met de langzamere ruwe CPU-prestatieresultaten in vergelijking met de Core i9-14900HK die hierboven is vermeld.
| Baldur's Gate 3 | |
| 1920x1080 Ultra Preset | |
| Alienware x16 R2 P120F | |
| Gemiddeld NVIDIA GeForce RTX 4080 Laptop GPU (111.8 - 181.2, n=6) | |
| Alienware m16 R2 | |
| Framework Laptop 16 | |
| 2560x1440 Ultra Preset | |
| Alienware x16 R2 P120F | |
| Gemiddeld NVIDIA GeForce RTX 4080 Laptop GPU (88.3 - 129.3, n=6) | |
| Alienware m16 R2 | |
| Framework Laptop 16 | |
| 3840x2160 Ultra Preset | |
| Alienware x16 R2 P120F | |
| Gemiddeld NVIDIA GeForce RTX 4080 Laptop GPU (48.8 - 68.4, n=4) | |
| Alienware m16 R2 | |
| Framework Laptop 16 | |
| 3840x2160 Ultra Preset + Quality DLSS | |
| Alienware x16 R2 P120F | |
| Gemiddeld NVIDIA GeForce RTX 4080 Laptop GPU (90.9 - 104.4, n=2) | |
Witcher 3 FPS Chart
| lage | gem. | hoge | ultra | QHD | 4K DLSS | 4K | |
|---|---|---|---|---|---|---|---|
| The Witcher 3 (2015) | 364.4 | 340.7 | 292.1 | 166.3 | 118.5 | ||
| Dota 2 Reborn (2015) | 155.7 | 142 | 139.2 | 133 | 127.9 | ||
| Final Fantasy XV Benchmark (2018) | 188 | 169.3 | 139.8 | 120.8 | 70.2 | ||
| X-Plane 11.11 (2018) | 134 | 117.4 | 89.3 | 78 | |||
| Far Cry 5 (2018) | 137 | 127 | 122 | 114 | 114 | 91 | |
| Strange Brigade (2018) | 427 | 336 | 317 | 293 | 226 | 112.9 | |
| Tiny Tina's Wonderlands (2022) | 220.8 | 199.6 | 166.7 | 144.5 | 99 | 50.1 | |
| F1 22 (2022) | 219 | 211 | 185.7 | 108.5 | 65.6 | 36.6 | |
| Baldur's Gate 3 (2023) | 186.8 | 172.9 | 161.2 | 159.4 | 124.3 | 104.4 | 65 |
| Cyberpunk 2077 2.2 Phantom Liberty (2023) | 121.5 | 118.7 | 109 | 99.7 | 75.4 | 32.5 |
Uitstoot
Systeemgeluid
De ventilatoren in de x16 R2 zijn in staat om langere perioden stiller te blijven voordat ze in snelheid en geluid moeten toenemen. Voor de rest is het geluidsplafond vergelijkbaar met wat we op de x16 R1 vaststelden, namelijk ongeveer 50 dB(A) en 54 dB(A) bij gamen in respectievelijk de modus Prestaties en Overdrive. Merk op dat het ventilatorgeluid bij gamen in de Gebalanceerde modus precies hetzelfde zou zijn als in de modus Prestaties, wat overeenkomt met onze 3DMark-resultaten hierboven.
Geluidsniveau
| Onbelast |
| 23.8 / 28.5 / 28.5 dB (A) |
| Belasting |
| 28.8 / 54.2 dB (A) |
 | ||
30 dB stil 40 dB(A) hoorbaar 50 dB(A) luid |
||
min: | ||
| Alienware x16 R2 P120F NVIDIA GeForce RTX 4080 Laptop GPU, Ultra 9 185H, WDC PC SN810 1TB | Alienware x16 R1 NVIDIA GeForce RTX 4080 Laptop GPU, i9-13900HK, SK hynix PC801 HFS001TEJ9X101N | Alienware m16 R2 NVIDIA GeForce RTX 4070 Laptop GPU, Ultra 7 155H, Samsung PM9A1 MZVL21T0HCLR | Asus ROG Strix Scar 16 G634JZR NVIDIA GeForce RTX 4080 Laptop GPU, i9-14900HX, SK hynix PC801 HFS002TEJ9X101N | Lenovo Legion Pro 7 16IRX9H NVIDIA GeForce RTX 4080 Laptop GPU, i9-14900HX, SK Hynix HFS001TEJ9X115N | MSI Vector 16 HX A14V NVIDIA GeForce RTX 4080 Laptop GPU, i9-14900HX, WD PC SN560 SDDPNQE-1T00 | |
|---|---|---|---|---|---|---|
| Noise | -2% | -3% | -20% | -22% | -28% | |
| uit / omgeving * | 23.4 | 22.7 3% | 24.7 -6% | 21.07 10% | 24 -3% | 23.2 1% |
| Idle Minimum * | 23.8 | 23.1 3% | 25.3 -6% | 29.75 -25% | 25 -5% | 33.5 -41% |
| Idle Average * | 28.5 | 25.8 9% | 25.3 11% | 29.75 -4% | 30 -5% | 33.5 -18% |
| Idle Maximum * | 28.5 | 25.8 9% | 25.3 11% | 29.75 -4% | 45 -58% | 33.5 -18% |
| Load Average * | 28.8 | 39.3 -36% | 31.7 -10% | 54.85 -90% | 50 -74% | 52.1 -81% |
| Witcher 3 ultra * | 49.5 | 49.9 -1% | 53.8 -9% | 57.8 -17% | 54 -9% | 62 -25% |
| Load Maximum * | 54.2 | 54.8 -1% | 62 -14% | 58 -7% | 56 -3% | 62 -14% |
* ... kleiner is beter
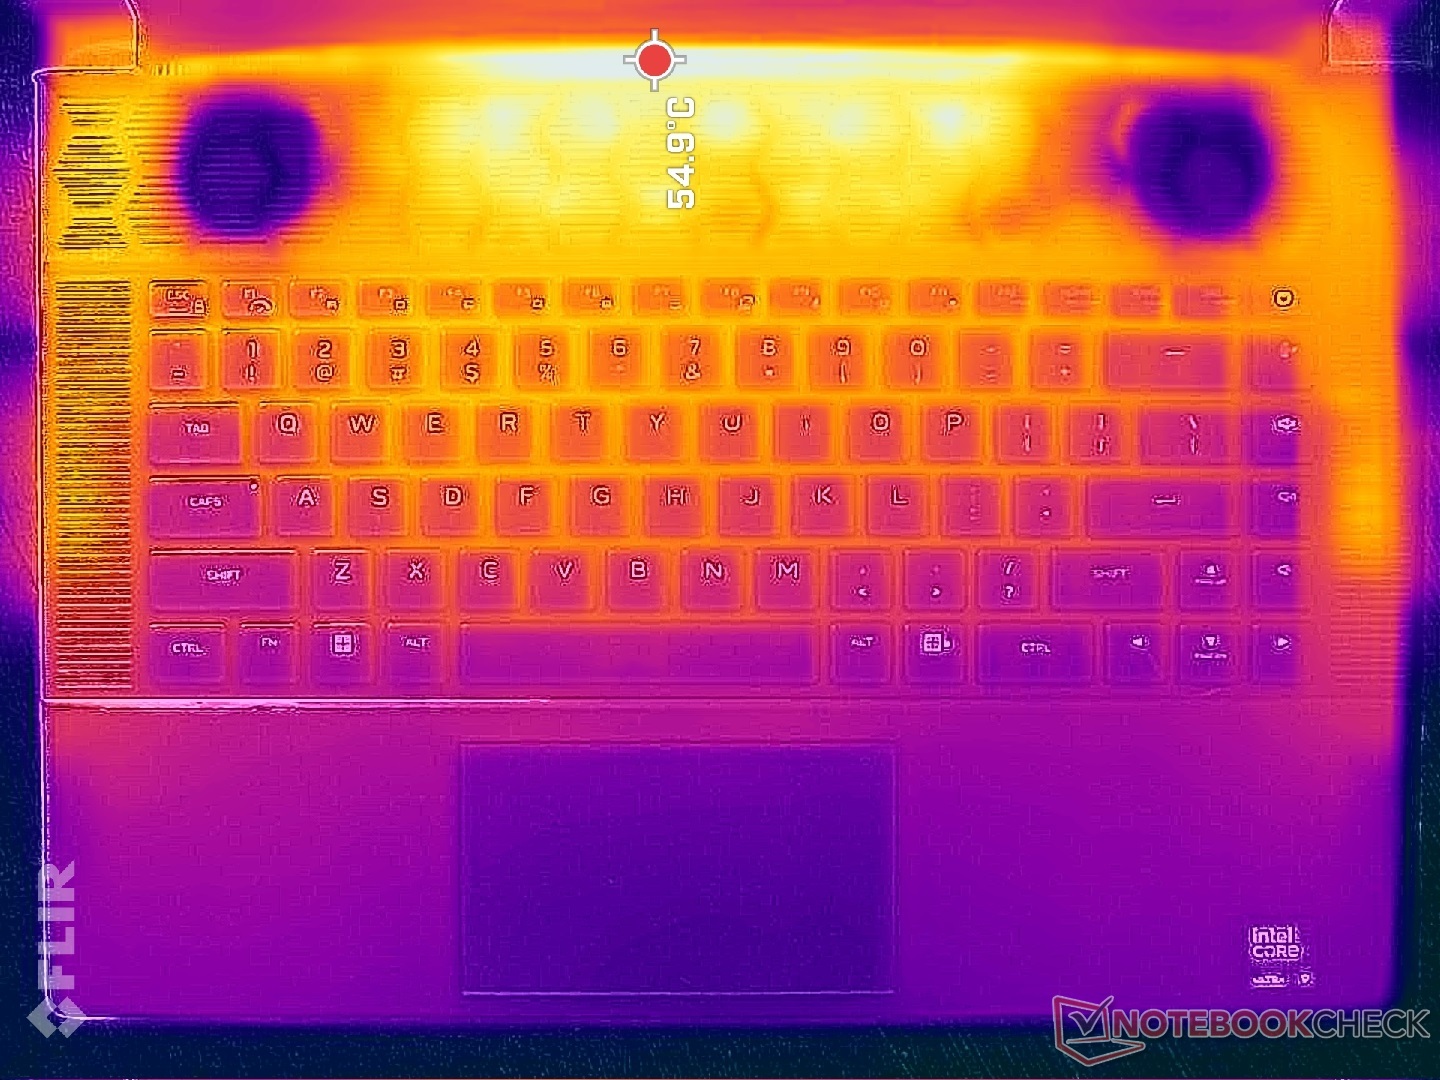
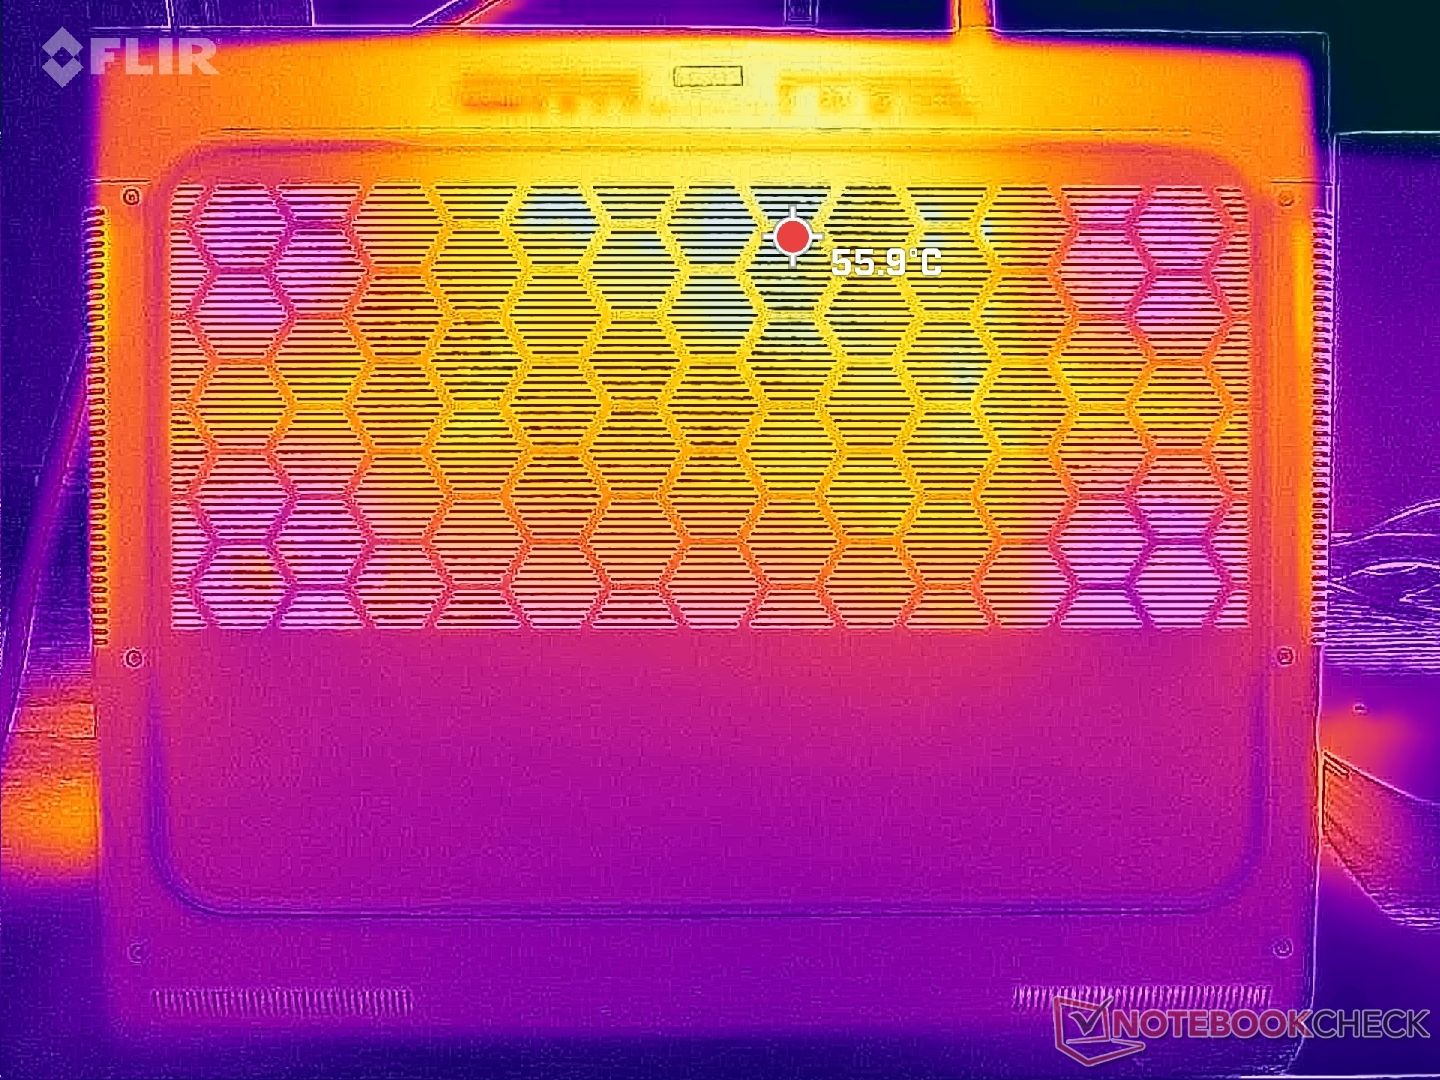
Temperatuur
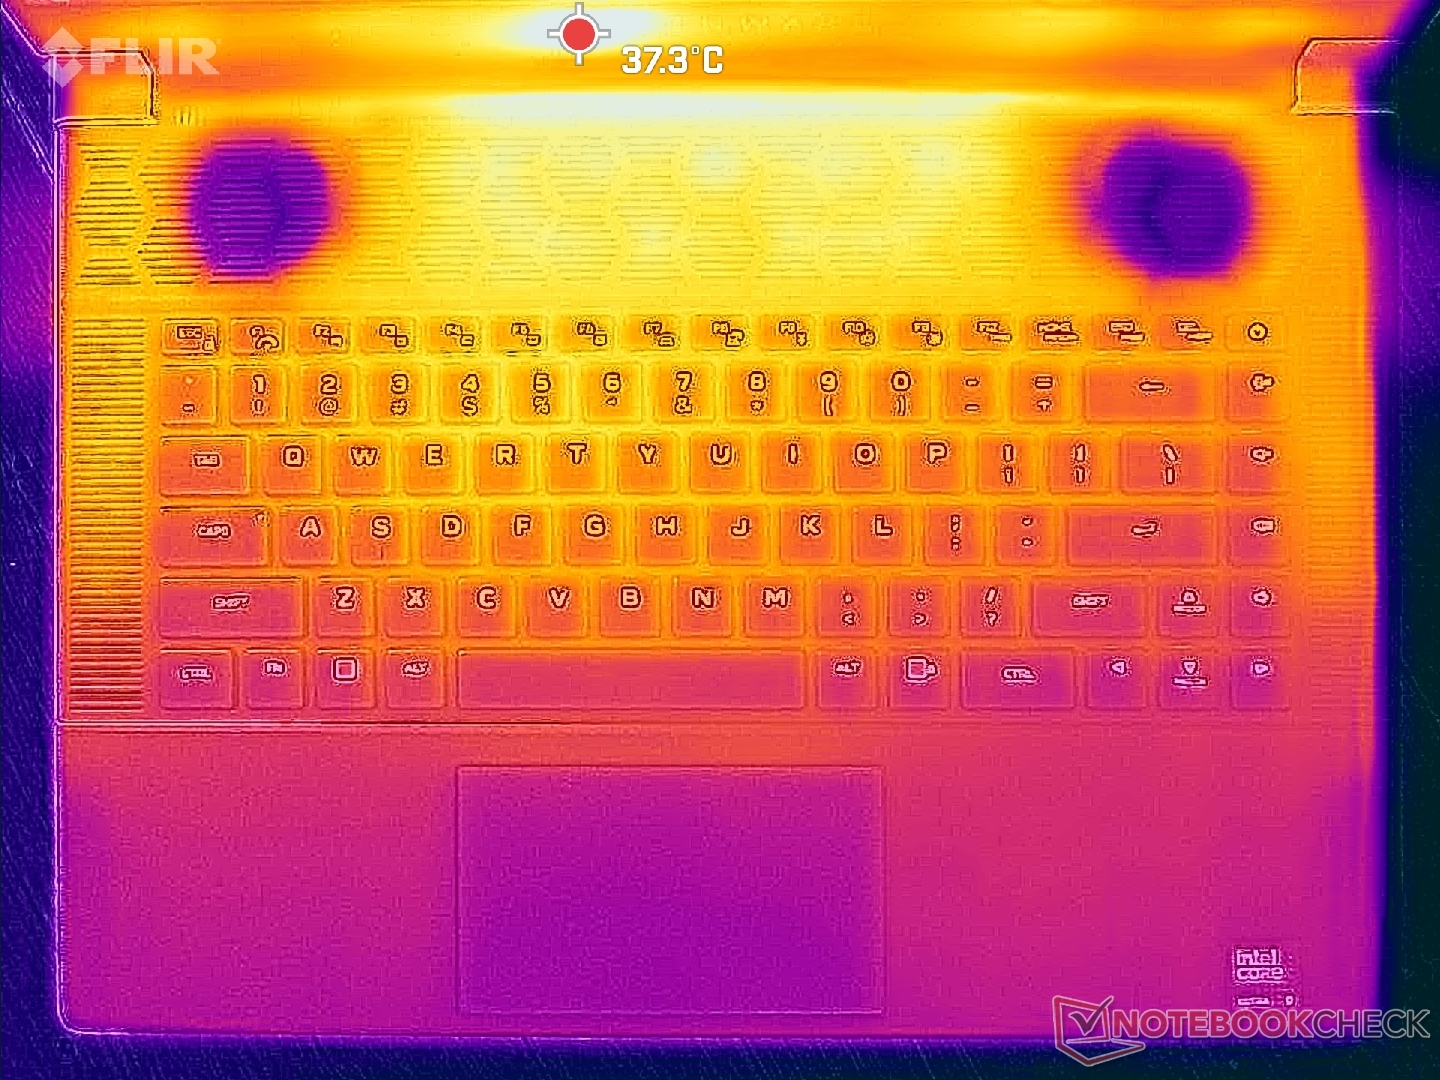
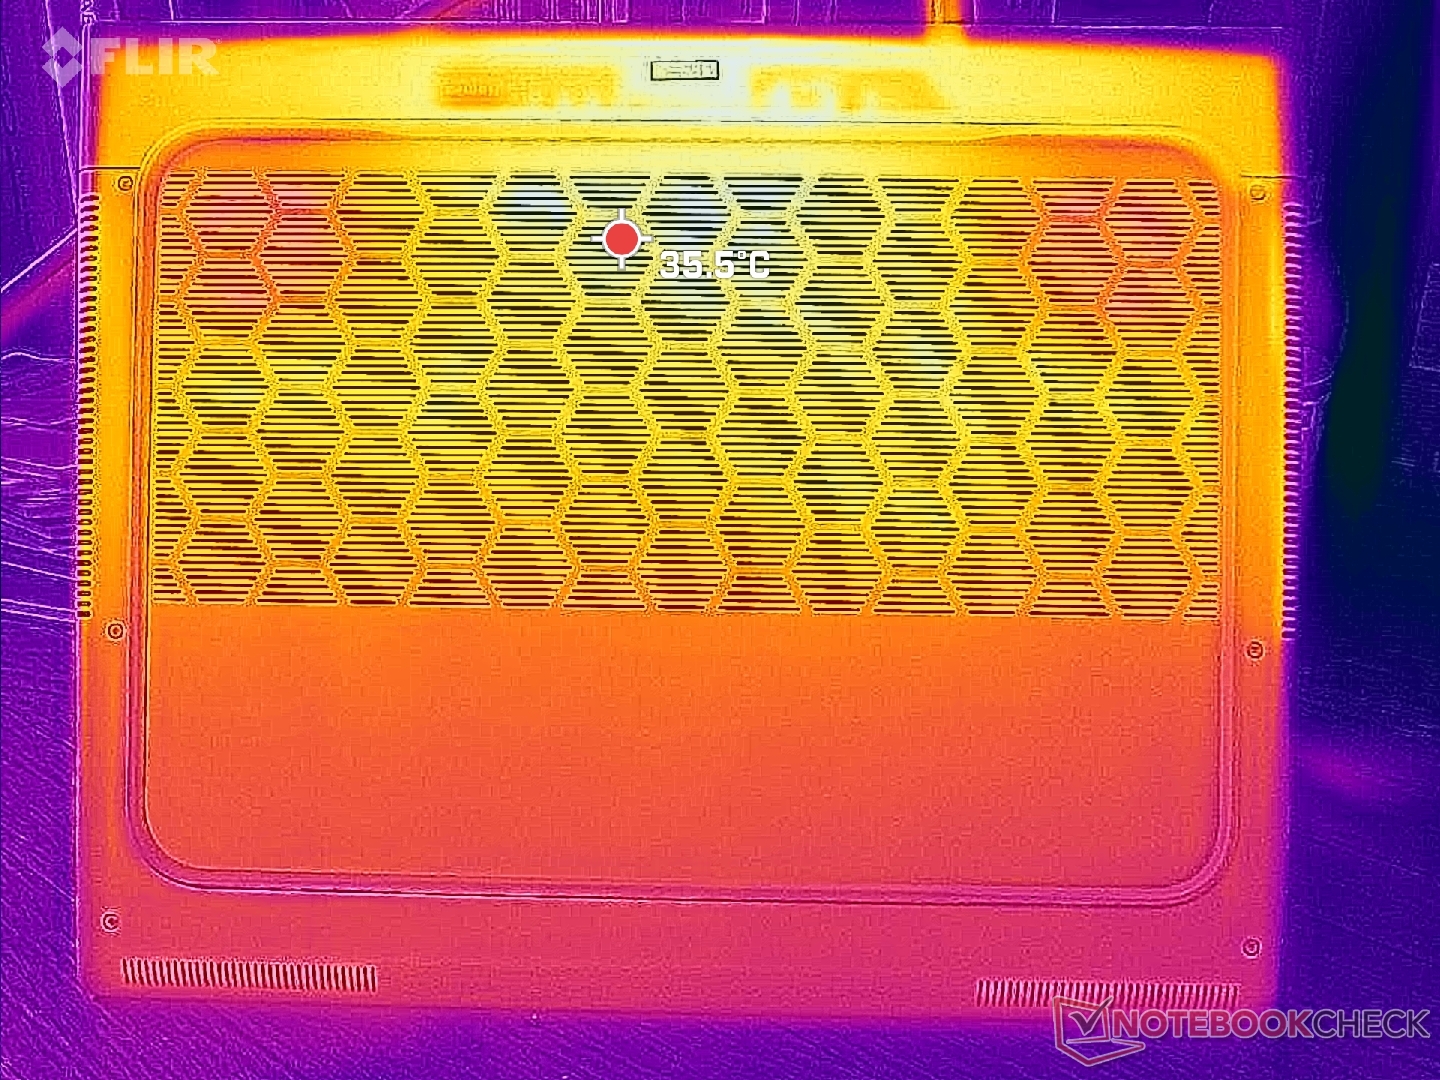
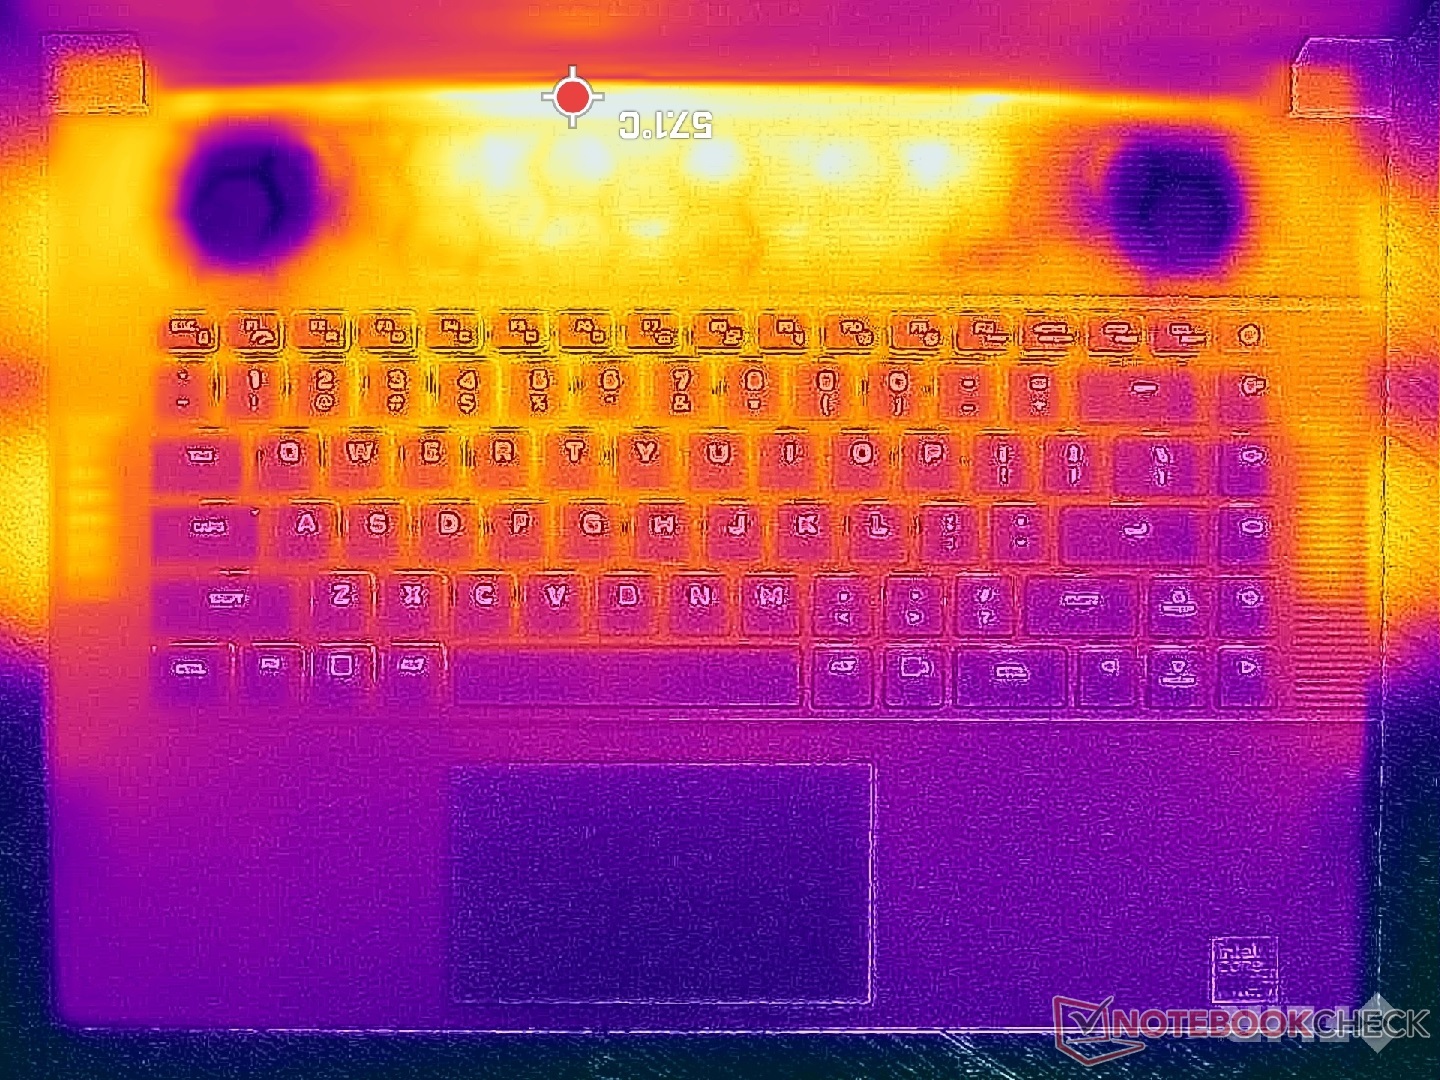
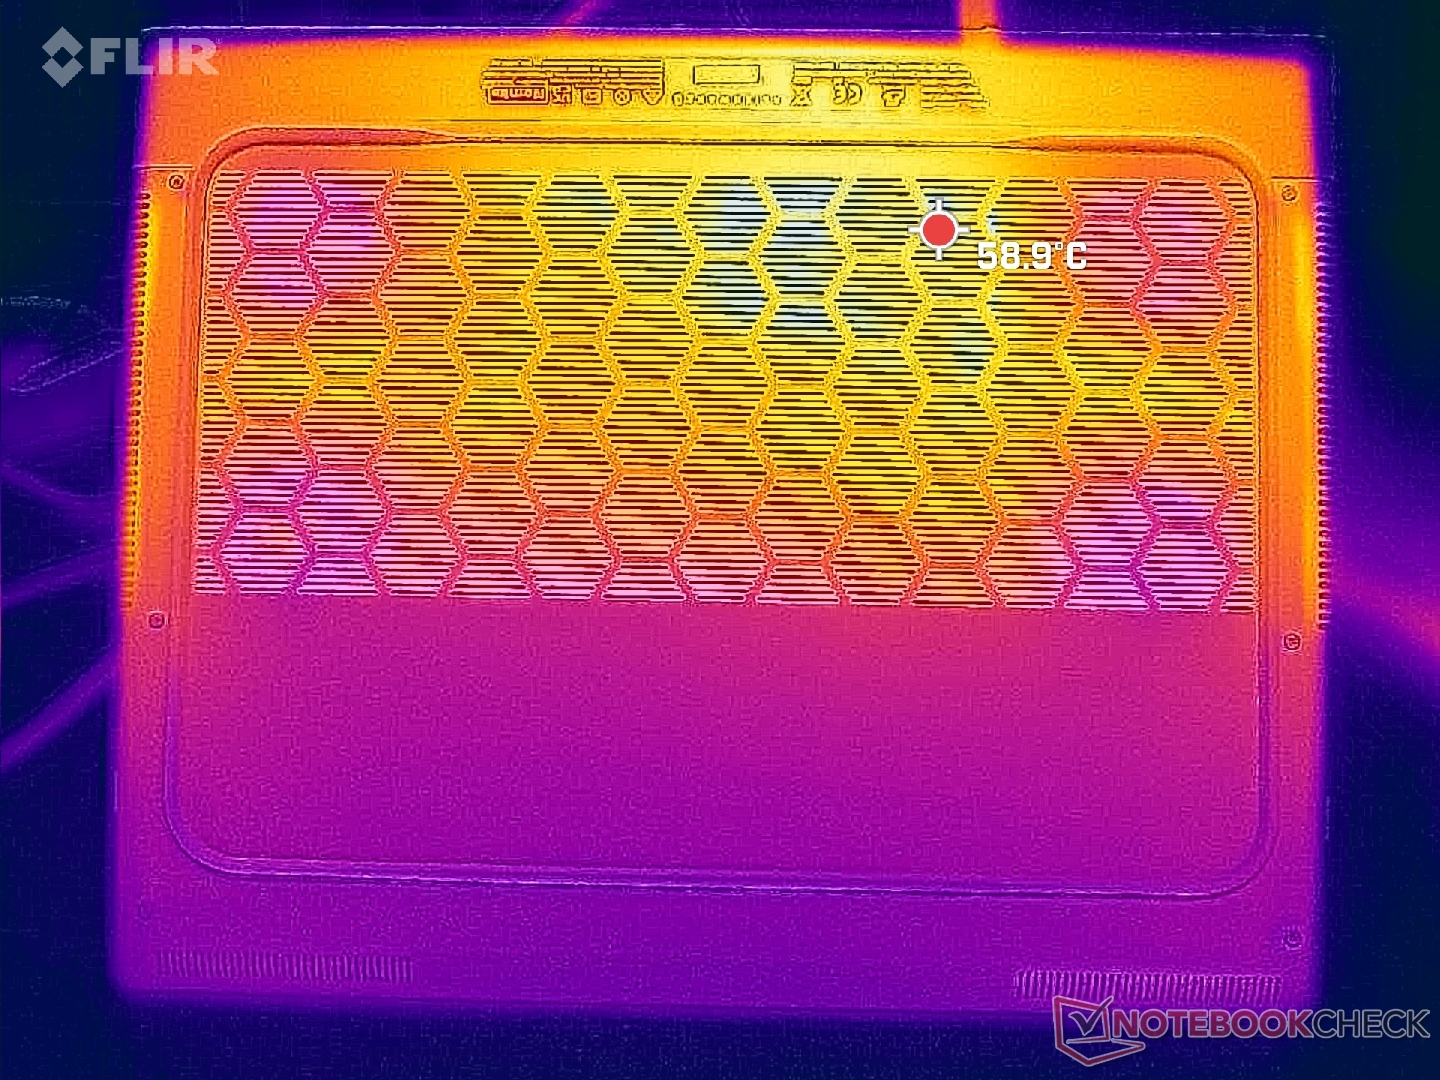
De oppervlaktetemperaturen zijn erg warm in de achterste helft van het chassis, terwijl de voorste helft merkbaar koeler is voor handpalmen en vingers. De Alienware x16-serie maakt noodgedwongen gebruik van meer ventilatieroosters dan de m16-serie, omdat het x16-ontwerp wordt gedefinieerd door zijn dunheid.
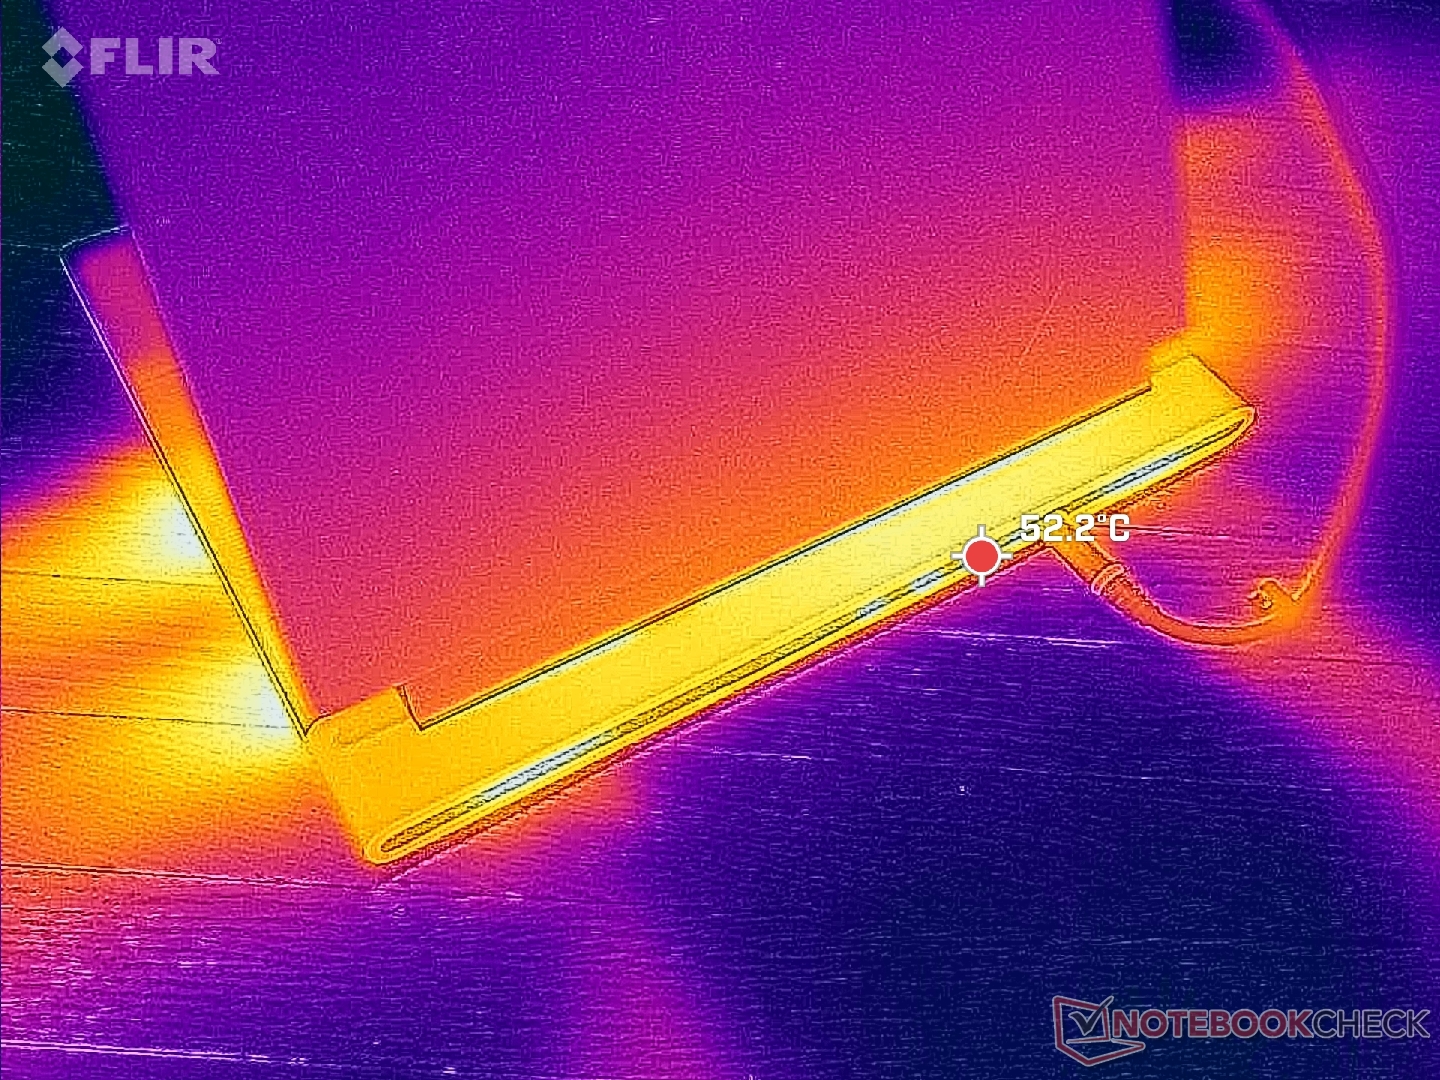
(-) De maximumtemperatuur aan de bovenzijde bedraagt 51 °C / 124 F, vergeleken met het gemiddelde van 40.4 °C / 105 F, variërend van 21.2 tot 68.8 °C voor de klasse Gaming.
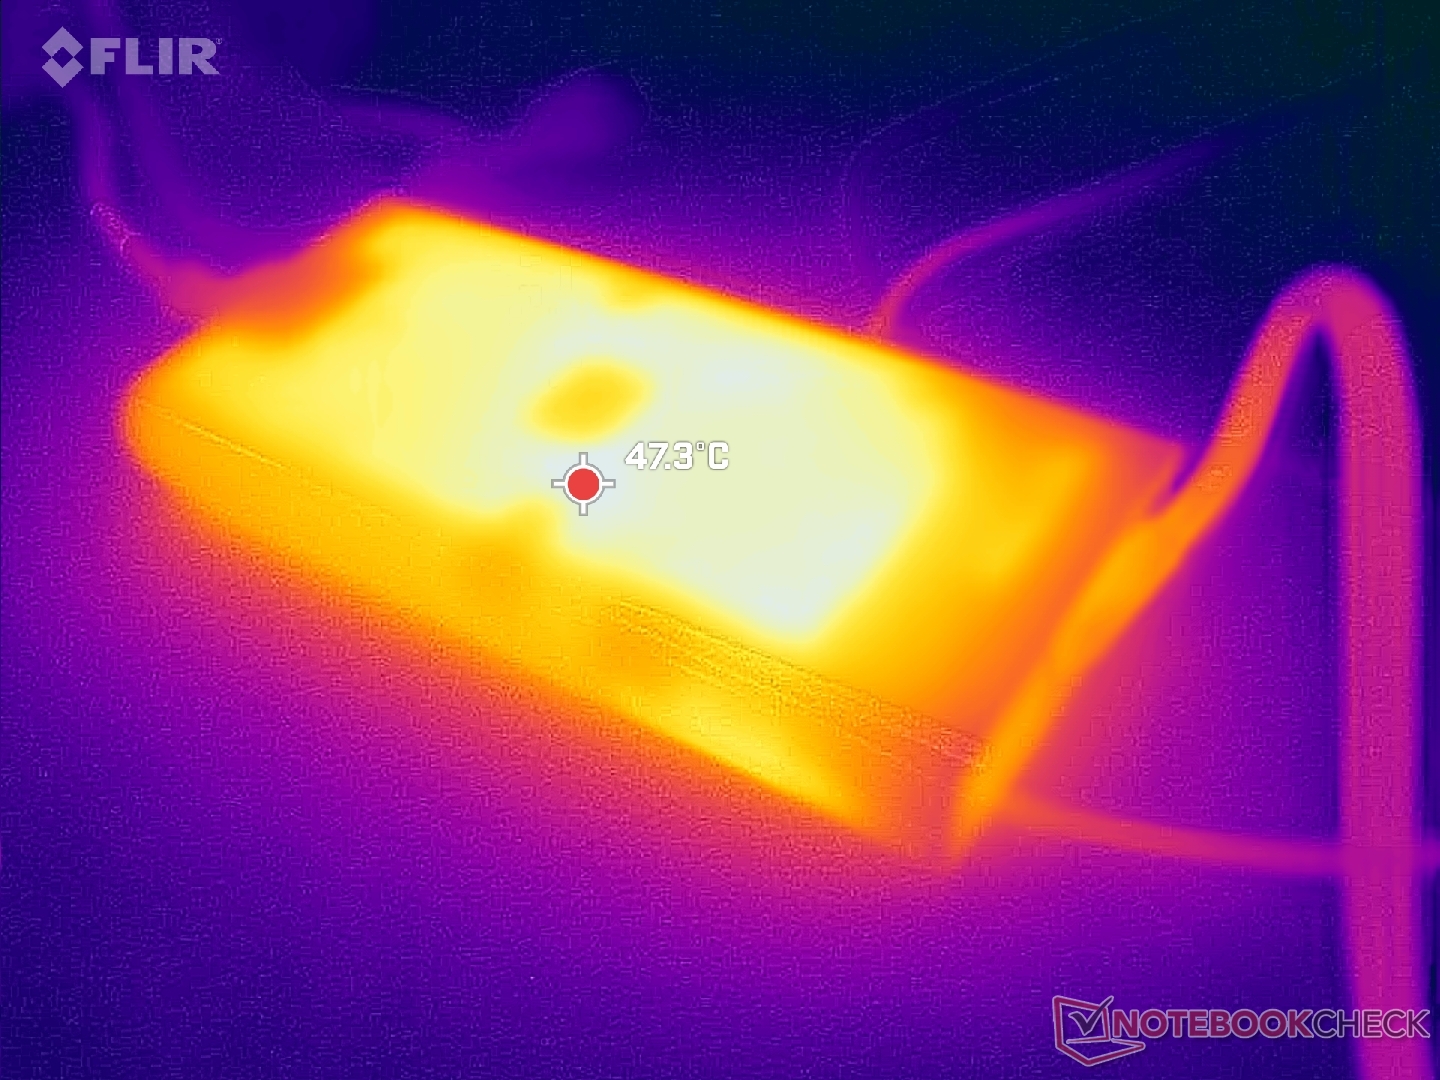
(-) De bodem warmt op tot een maximum van 50.8 °C / 123 F, vergeleken met een gemiddelde van 43.2 °C / 110 F
(+) Bij onbelast gebruik bedraagt de gemiddelde temperatuur voor de bovenzijde 31.3 °C / 88 F, vergeleken met het apparaatgemiddelde van 33.9 °C / 93 F.
(-) Bij het spelen van The Witcher 3 is de gemiddelde temperatuur voor de bovenzijde 42.4 °C / 108 F, vergeleken met het apparaatgemiddelde van 33.9 °C / 93 F.
(+) De handpalmsteunen en het touchpad bereiken maximaal de huidtemperatuur (33.2 °C / 91.8 F) en zijn dus niet heet.
(-) De gemiddelde temperatuur van de handpalmsteun van soortgelijke toestellen bedroeg 28.9 °C / 84 F (-4.3 °C / -7.8 F).
| Alienware x16 R2 P120F Intel Core Ultra 9 185H, NVIDIA GeForce RTX 4080 Laptop GPU | Alienware x16 R1 Intel Core i9-13900HK, NVIDIA GeForce RTX 4080 Laptop GPU | Alienware m16 R2 Intel Core Ultra 7 155H, NVIDIA GeForce RTX 4070 Laptop GPU | Asus ROG Strix Scar 16 G634JZR Intel Core i9-14900HX, NVIDIA GeForce RTX 4080 Laptop GPU | Lenovo Legion Pro 7 16IRX9H Intel Core i9-14900HX, NVIDIA GeForce RTX 4080 Laptop GPU | MSI Vector 16 HX A14V Intel Core i9-14900HX, NVIDIA GeForce RTX 4080 Laptop GPU | |
|---|---|---|---|---|---|---|
| Heat | 3% | -1% | 5% | 1% | 27% | |
| Maximum Upper Side * | 51 | 47.2 7% | 44.8 12% | 47.8 6% | 46 10% | 36.4 29% |
| Maximum Bottom * | 50.8 | 47.8 6% | 48 6% | 52.2 -3% | 49 4% | 35.6 30% |
| Idle Upper Side * | 36.6 | 36.8 -1% | 37.2 -2% | 32.4 11% | 38 -4% | 26.6 27% |
| Idle Bottom * | 35.2 | 35.8 -2% | 42 -19% | 33 6% | 37 -5% | 27 23% |
* ... kleiner is beter
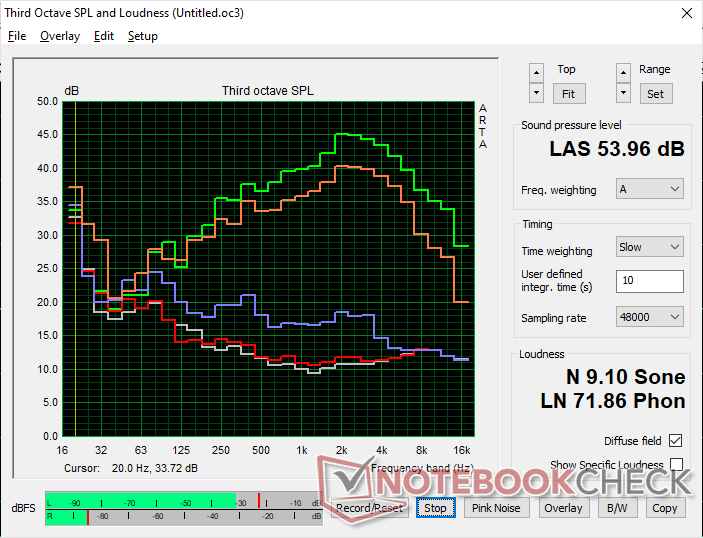
Luidsprekers
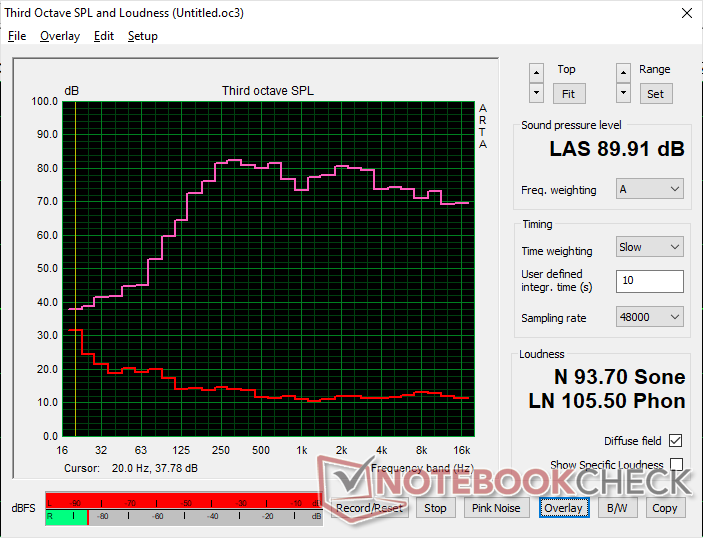
Alienware x16 R2 P120F audioanalyse
(+) | luidsprekers kunnen relatief luid spelen (89.9 dB)
Bas 100 - 315 Hz
(±) | verminderde zeebaars - gemiddeld 7.4% lager dan de mediaan
(±) | lineariteit van de lage tonen is gemiddeld (7.6% delta ten opzichte van de vorige frequentie)
Midden 400 - 2000 Hz
(+) | evenwichtige middens - slechts 2.6% verwijderd van de mediaan
(+) | de middentonen zijn lineair (3.6% delta ten opzichte van de vorige frequentie)
Hoog 2 - 16 kHz
(+) | evenwichtige hoogtepunten - slechts 3.4% verwijderd van de mediaan
(+) | de hoge tonen zijn lineair (2.8% delta naar de vorige frequentie)
Algemeen 100 - 16.000 Hz
(+) | het totale geluid is lineair (8.2% verschil met de mediaan)
Vergeleken met dezelfde klasse
» 1% van alle geteste apparaten in deze klasse waren beter, 1% vergelijkbaar, 98% slechter
» De beste had een delta van 6%, het gemiddelde was 18%, de slechtste was 132%
Vergeleken met alle geteste toestellen
» 1% van alle geteste apparaten waren beter, 1% gelijk, 98% slechter
» De beste had een delta van 4%, het gemiddelde was 24%, de slechtste was 134%
Apple MacBook Pro 16 2021 M1 Pro audioanalyse
(+) | luidsprekers kunnen relatief luid spelen (84.7 dB)
Bas 100 - 315 Hz
(+) | goede baars - slechts 3.8% verwijderd van de mediaan
(+) | de lage tonen zijn lineair (5.2% delta naar de vorige frequentie)
Midden 400 - 2000 Hz
(+) | evenwichtige middens - slechts 1.3% verwijderd van de mediaan
(+) | de middentonen zijn lineair (2.1% delta ten opzichte van de vorige frequentie)
Hoog 2 - 16 kHz
(+) | evenwichtige hoogtepunten - slechts 1.9% verwijderd van de mediaan
(+) | de hoge tonen zijn lineair (2.7% delta naar de vorige frequentie)
Algemeen 100 - 16.000 Hz
(+) | het totale geluid is lineair (4.6% verschil met de mediaan)
Vergeleken met dezelfde klasse
» 0% van alle geteste apparaten in deze klasse waren beter, 0% vergelijkbaar, 100% slechter
» De beste had een delta van 5%, het gemiddelde was 18%, de slechtste was 45%
Vergeleken met alle geteste toestellen
» 0% van alle geteste apparaten waren beter, 0% gelijk, 100% slechter
» De beste had een delta van 4%, het gemiddelde was 24%, de slechtste was 134%
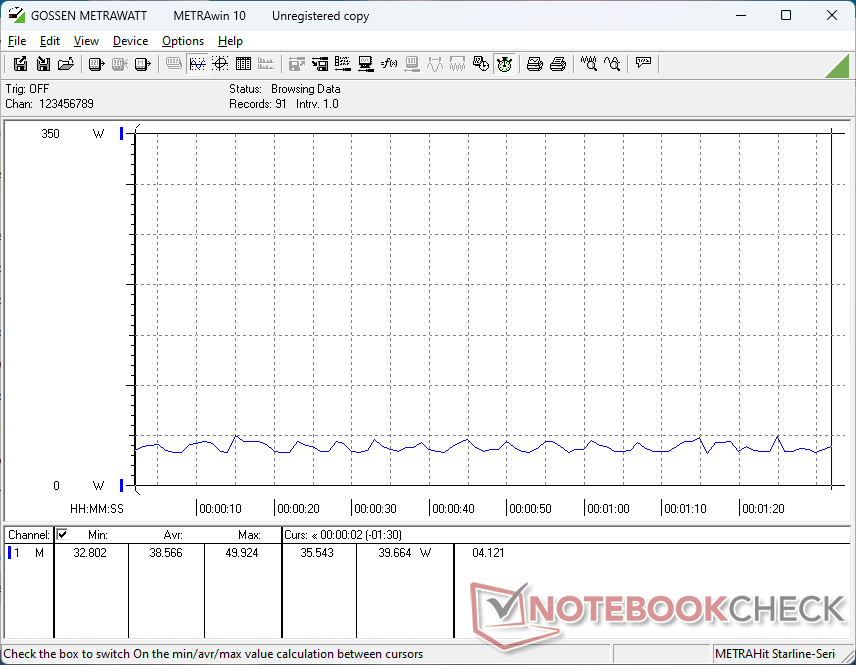
Energiebeheer
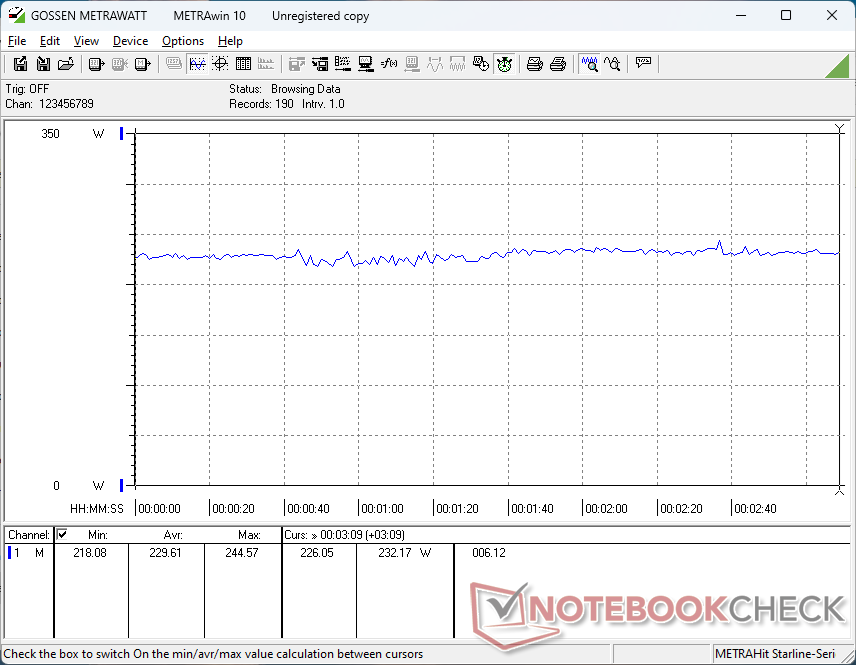
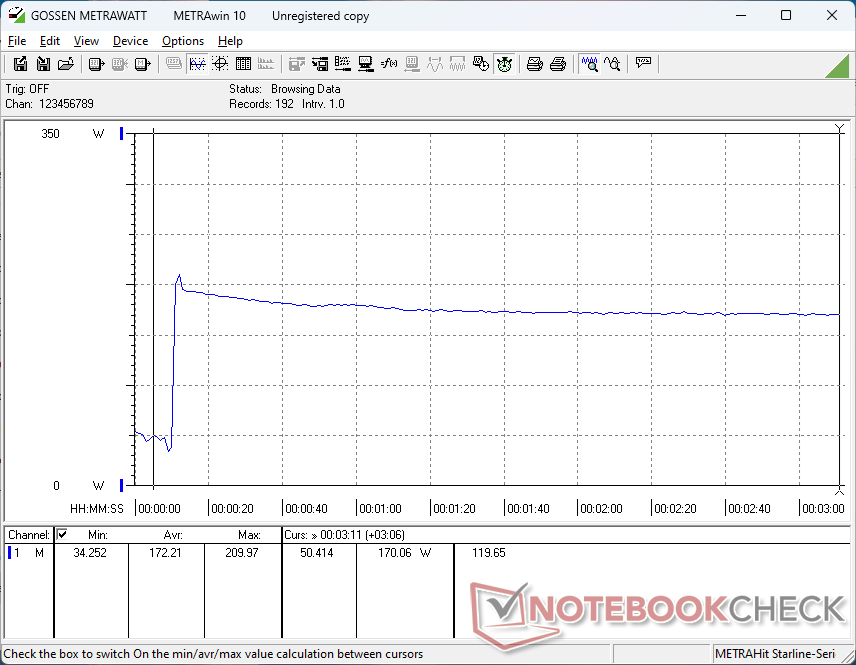
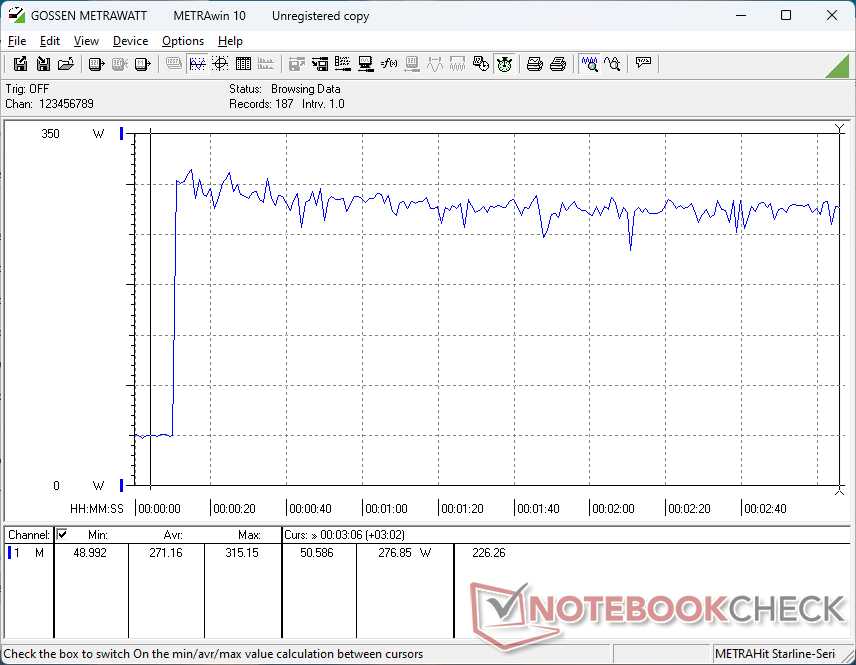
Stroomverbruik
Het totale verbruik is over het algemeen ongeveer 10 tot 15 procent lager dan wat we op de x16 R1 vaststelden bij veeleisende belastingen zoals games of Prime95 stress. Dit tekort gaat echter gepaard met de langzamere CPU- en GPU-resultaten die hierboven zijn vermeld. Prestaties-per-watt zijn dus ongeveer hetzelfde ten opzichte van vorig jaar, ondanks de CPU-verandering.
We zijn een bug tegengekomen in de stand-bymodus. Als deze op Optimus stond, werkte de stand-bymodus normaal met een laag stroomverbruik van <1 watt. Als deze echter op dGPU-modus en Overdrive was ingesteld, verbruikte de stand-bymodus maar liefst 39 W, wat resulteerde in een onnodig warme laptop en een hoog batterijverbruik.
| Uit / Standby | |
| Inactief | |
| Belasting |
|
Key:
min: | |
| Alienware x16 R2 P120F Ultra 9 185H, NVIDIA GeForce RTX 4080 Laptop GPU, WDC PC SN810 1TB, IPS, 2560x1600, 16" | Alienware x16 R1 i9-13900HK, NVIDIA GeForce RTX 4080 Laptop GPU, SK hynix PC801 HFS001TEJ9X101N, IPS, 2560x1600, 16" | Alienware m16 R2 Ultra 7 155H, NVIDIA GeForce RTX 4070 Laptop GPU, Samsung PM9A1 MZVL21T0HCLR, IPS, 2560x1600, 16" | Asus ROG Strix Scar 16 G634JZR i9-14900HX, NVIDIA GeForce RTX 4080 Laptop GPU, SK hynix PC801 HFS002TEJ9X101N, Mini LED, 2560x1600, 16" | Lenovo Legion Pro 7 16IRX9H i9-14900HX, NVIDIA GeForce RTX 4080 Laptop GPU, SK Hynix HFS001TEJ9X115N, IPS, 2560x1600, 16" | MSI Vector 16 HX A14V i9-14900HX, NVIDIA GeForce RTX 4080 Laptop GPU, WD PC SN560 SDDPNQE-1T00, IPS, 2560x1600, 16" | |
|---|---|---|---|---|---|---|
| Power Consumption | -55% | 11% | -10% | -30% | -27% | |
| Idle Minimum * | 9.9 | 25.2 -155% | 8.1 18% | 10.71 -8% | 16 -62% | 15.8 -60% |
| Idle Average * | 14.5 | 29.9 -106% | 13 10% | 14.75 -2% | 21 -45% | 23.3 -61% |
| Idle Maximum * | 33.5 | 49.8 -49% | 40.3 -20% | 30 10% | 36 -7% | 30 10% |
| Load Average * | 97.5 | 105.4 -8% | 79 19% | 135 -38% | 132 -35% | 123.9 -27% |
| Witcher 3 ultra * | 230 | 263 -14% | 188.1 18% | 286 -24% | 267 -16% | 285 -24% |
| Load Maximum * | 315.2 | 313.8 -0% | 254.9 19% | 307 3% | 360 -14% | 306 3% |
* ... kleiner is beter
Power Consumption Witcher 3 / Stresstest
Power Consumption external Monitor
Levensduur batterij
De runtimes zijn dit keer iets langer, waarschijnlijk door het algehele lagere stroomverbruik dat hierboven is vermeld. We zijn in staat om een WLAN-runtime van meer dan 40 minuten langer vast te leggen dan op de x16 R1, maar de meeste andere gaming laptops gaan nog steeds veel langer mee, waaronder Dell's eigen Alienware m16 R2.
| Alienware x16 R2 P120F Ultra 9 185H, NVIDIA GeForce RTX 4080 Laptop GPU, 90 Wh | Alienware x16 R1 i9-13900HK, NVIDIA GeForce RTX 4080 Laptop GPU, 90 Wh | Alienware m16 R2 Ultra 7 155H, NVIDIA GeForce RTX 4070 Laptop GPU, 90 Wh | Asus ROG Strix Scar 16 G634JZR i9-14900HX, NVIDIA GeForce RTX 4080 Laptop GPU, 90 Wh | Lenovo Legion Pro 7 16IRX9H i9-14900HX, NVIDIA GeForce RTX 4080 Laptop GPU, 99.9 Wh | MSI Vector 16 HX A14V i9-14900HX, NVIDIA GeForce RTX 4080 Laptop GPU, 90 Wh | |
|---|---|---|---|---|---|---|
| Batterijduur | -23% | 150% | 125% | 93% | 72% | |
| WiFi v1.3 | 193 | 149 -23% | 483 150% | 434 125% | 373 93% | 332 72% |
| Reader / Idle | 436 | 758 | 641 | |||
| Load | 44 | 60 | 51 | 84 | ||
| H.264 | 451 | |||||
| Witcher 3 ultra | 57 |
Pro
Contra
Conclusie - Alienware x16 R1 is sneller voor puur gamen
Het grote voordeel van de Alienware x16 R2 ten opzichte van de x16 R1 is de geïntegreerde NPU voor het versnellen van Windows AI-taken. Dergelijke functies zullen naar verwachting het komende jaar gemeengoed worden via Microsoft Co-Pilot en andere aankomende AI-gestuurde toepassingen. Voor gamingdoeleinden brengt de NPU echter niets mee om de ervaring vanaf 2024 te verbeteren. Sterker nog, het is aantoonbaar nadelig, omdat de ruwe CPU-prestaties zijn gedaald in vergelijking met de Core i9-13900HK in de x16 R1 van vorig jaar, omdat er kostbare matrijsruimte is gereserveerd voor de nieuwe neurale processor.
De Alienware x16 R2 introduceert nieuwe Meteor Lake-H CPU's met een geïntegreerde NPU voor compatibiliteit met toekomstige Windows AI-functies. Helaas hebben de rauwe gamingprestaties hieronder geleden.
De over het algemeen langzamere prestaties hebben ook geleid tot een lager energieverbruik en langere looptijden dan het oorspronkelijke lanceringsmodel. De gaming-liefhebbers die graag Alienware kopen, zijn echter waarschijnlijk niet erg enthousiast over het inruilen van prestaties voor een langere batterijlevensduur. Zo'n zet zou acceptabeler zijn geweest op de goedkopere Dell G-serie in plaats daarvan.
Wij raden aan om de originele Alienware x16 R1 aangezien de x16 R2 geen nieuwe GPU-opties, schermopties of zelfs chassiskleuren of uiterlijke veranderingen biedt. De CPU-update is alleen wenselijk voor degenen die hun werkruimte "future-proof" willen maken met de geïntegreerde NPU.
Prijs en beschikbaarheid
Dell levert de Alienware x16 R2 nu vanaf $2100 voor de Core Ultra 7, GeForce RTX 4060, standaard toetsenbord en 1600p240 IPS-configuratie of tot $3500 indien geconfigureerd met de Core Ultra 9, RTX 4090 en mechanisch toetsenbord.
Alienware x16 R2 P120F
- 29-05-2024 v7 (old)
Allen Ngo
Transparantie
De selectie van te beoordelen apparaten wordt gemaakt door onze redactie. Het testexemplaar werd ten behoeve van deze beoordeling door de fabrikant of detailhandelaar in bruikleen aan de auteur verstrekt. De kredietverstrekker had geen invloed op deze recensie, noch ontving de fabrikant vóór publicatie een exemplaar van deze recensie. Er bestond geen verplichting om deze recensie te publiceren. Wij accepteren nooit een compensatie of betaling in ruil voor onze beoordelingen. Als onafhankelijk mediabedrijf is Notebookcheck niet onderworpen aan het gezag van fabrikanten, detailhandelaren of uitgevers.
[transparency_disclaimer]Dit is hoe Notebookcheck test
Elk jaar beoordeelt Notebookcheck onafhankelijk honderden laptops en smartphones met behulp van gestandaardiseerde procedures om ervoor te zorgen dat alle resultaten vergelijkbaar zijn. We hebben onze testmethoden al zo'n 20 jaar voortdurend ontwikkeld en daarbij de industriestandaard bepaald. In onze testlaboratoria wordt gebruik gemaakt van hoogwaardige meetapparatuur door ervaren technici en redacteuren. Deze tests omvatten een validatieproces in meerdere fasen. Ons complexe beoordelingssysteem is gebaseerd op honderden goed onderbouwde metingen en benchmarks, waardoor de objectiviteit behouden blijft. Meer informatie over onze testmethoden kunt u hier vinden.
Price comparison

