Notebookcheck Logo

Razer Blade 18 2024 recensie: Eerste laptop op de markt met zowel mini-LED als Thunderbolt 5
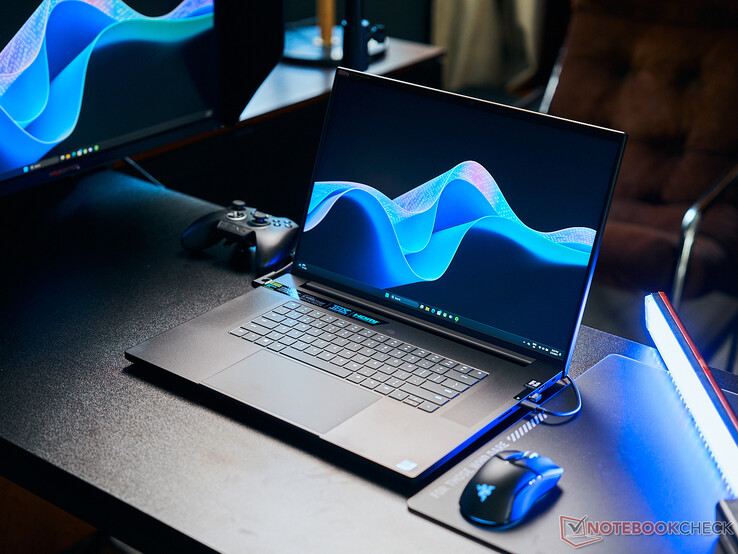
Verreweg de helderste Blade.

Razer heeft de lat dit jaar nog hoger gelegd met 300 Hz 2K mini-LED en 200 Hz 4K IPS beeldschermopties bovenop de al indrukwekkende 175 W GeForce RTX 4090 GPU. Met name het HDR1000 mini-LED paneel maakt van de Blade 18 een multimedia kolos op het gebied van gaming en het afspelen van video's.

De Razer Blade 18 maakte zijn debuut in 2023 met een ontwerp dat sterk geïnspireerd was op de ouder wordende Blade 17. Voor 2024 maakt de nieuwste revisie gebruik van hetzelfde chassisontwerp als het jaar ervoor, maar met extra functies op hoog niveau om prestatiejagers en enthousiastelingen aan te trekken. Deze nieuwe opties omvatten een Core i9-14900HX Raptor Lake CPU, Thunderbolt 5-connectiviteit en een optioneel 4K 16:10 200 Hz IPS-beeldscherm. Vooral de laatste twee zullen eerst op het Razer-systeem verschijnen, voordat ze uiteindelijk ook op andere fabrikanten zullen verschijnen.

Onze configuratie wordt geleverd met de 175 W GeForce RTX 4090 GPU, 2 TB SSD en 2560 x 1600 300 Hz Mini-LED beeldscherm voor ongeveer 4500 USD. Andere SKU's worden geleverd met de GeForce RTX 4070/4080 of het eerder genoemde 4K 200 Hz IPS-scherm, maar alle configuraties worden momenteel geleverd met dezelfde Core i9-14900HX CPU. De alternatieve Mercury White kleur is alleen beschikbaar bij bepaalde configuraties.

Er zijn een handvol concurrenten voor de Blade 18, waaronder de MSI Titan 18, Asus ROG Strix Scar 18, Acer Predator Helios 18of de enorme Alienware m18 R2.

Meer Razer beoordelingen:

Razer Blade 18 2024 RZ09-0509
Processor
Intel Core i9-14900HX 24 x 1.6 - 5.8 GHz, 138 W PL2 / Short Burst, 117 W PL1 / Sustained, Raptor Lake-HX Refresh
Grafische kaart
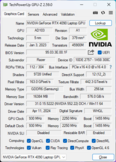
NVIDIA GeForce RTX 4090 Laptop GPU - 16 GB VRAM, Core: 1455 MHz, Geheugen: 2250 MHz, 175 W TDP, GDDR6, 552.22, Optimus
Geheugen
32 GB 
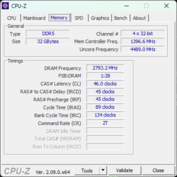
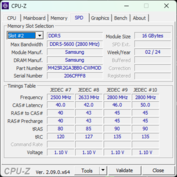
, Samsung DDR5-5600, 46-45-45-89, Dual-Channel
Beeldscherm
18.00 inch 16:10, 2560 x 1600 pixel 168 PPI, BOE NE180QDM-NM1, Mini-LED, glimmend: nee, HDR, 300 Hz
Moederbord
Intel HM770 (Raptor Lake-S PCH)
Geluidskaart
Intel Raptor Lake-S PCH - cAVS
Verbindingen
5 USB 3.1 Gen2, 1 Thunderbolt, USB-C Power Delivery (PD), 1 HDMI, 2 DisplayPort, 1 Kensington Lock, Audio Verbindingen: 3.5 mm headset, Card Reader: SD
Netwerkmogelijkheden
Realtek RTL8125 2.5GBe Family Ethernet Controller (10/100/1000/2500MBit/s), Intel Wi-Fi 7 BE200 320MHz (a/b/g/n = Wi-Fi 4/ac = Wi-Fi 5/ax = Wi-Fi 6/ Wi-Fi 6E 6 GHz be = Wi-Fi 7), Bluetooth 5.4
Afmetingen
hoogte x breedte x diepte (in mm): 21.9 x 399.9 x 275.4
Batterij
91.7 Wh Lithium-Polymer
Besturingssysteem
Microsoft Windows 11 Home
Camera
Webcam: 1080p30
Primaire camera: 5 MPix
Bijkomende functionaliteiten
Luidsprekers: 2x tweeters, 4x subwoofers, Toetsenbord: Chiclet, Toetsenbordverlichting: ja, Razer Synapse, 12 Maanden Garantie
Gewicht
3.134 kg, Voeding: 931 g
Prijs
4500 USD
Amazon
Opmerking: De fabrikant kan onderdelen van verschillende leveranciers gebruiken, waaronder beeldschermen, schijven of geheugensticks met vergelijkbare specificaties.


Potentiële concurrenten in vergelijkings

Evaluatie
Datum
Model
Gewicht
Hoogte
Formaat
Resolutie
Beste prijs
90.5 %
v7 (old)
05-2024
Razer Blade 18 2024 RZ09-0509
i9-14900HX, NVIDIA GeForce RTX 4090 Laptop GPU
3.1 kg21.9 mm18.00"2560x1600
89.5 %
v7 (old)
03-2024
Alienware m18 R2
i9-14900HX, NVIDIA GeForce RTX 4090 Laptop GPU
4 kg26.7 mm18.00"2560x1600
87.2 %
v7 (old)
08-2023
Asus ROG Strix Scar 17 G733PYV-LL053X
R9 7945HX3D, NVIDIA GeForce RTX 4090 Laptop GPU
2.9 kg28.3 mm17.30"2560x1440
88.8 %
v7 (old)
01-2024
MSI Titan 18 HX A14VIG
i9-14900HX, NVIDIA GeForce RTX 4090 Laptop GPU
3.6 kg32.1 mm18.00"3840x2400
88.3 %
v7 (old)
02-2024
Asus ROG Strix Scar 18 G834JYR (2024)
i9-14900HX, NVIDIA GeForce RTX 4090 Laptop GPU
3.1 kg30.8 mm18.00"2560x1600
91.1 %
v7 (old)
02-2024
Razer Blade 16 2024, RTX 4090
i9-14900HX, NVIDIA GeForce RTX 4090 Laptop GPU
2.5 kg22 mm16.00"2560x1600

Vergelijking grootte

410.3 mm 319.9 mm 26.7 mm 4 kg404 mm 307.5 mm 32.1 mm 3.6 kg399 mm 294 mm 30.8 mm 3.1 kg395 mm 282.1 mm 28.3 mm 2.9 kg399.9 mm 275.4 mm 21.9 mm 3.1 kg355 mm 244 mm 22 mm 2.5 kg297 mm 210 mm 1 mm 5.7 g

Connectiviteit - Toekomstbestendigheid met Thunderbolt 5

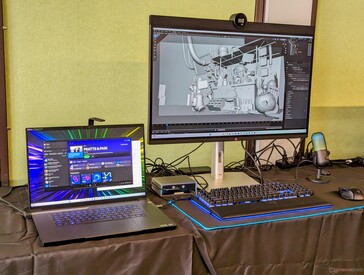
Blade 18-demo op GDC2024 aangesloten op verschillende accessoires, waaronder een extern 5K-scherm met TB 5
De eigen netadapter van 330 W is nog steeds nodig tijdens het gamen, omdat opladen via USB-C beperkt is tot 100 W

De Thunderbolt 4 poort is geüpgraded naar Thunderbolt 5 voor het 2024 model. Merk op dat dit alleen geldt voor de Type-C poort langs de rechterrand en dat de Type-C poort langs de linkerrand dus nog steeds beperkt is tot USB 3.2 Gen. 2 connectiviteit. Vergeleken met Thunderbolt 4 ondersteunt Thunderbolt 5 de dubbele bandbreedte (80 Gbps vs. 40 Gbps) met extra lanes gereserveerd voor meer veeleisende externe apparaten zoals eGPU's.

De Thunderbolt 5 specificatie ondersteunt ook downstream opladen tot 240 W. Op de Blade 18 is het opladen via USB-C echter nog steeds beperkt tot 100 W, of minder dan een derde van de netadapter van 330 W. Eerlijkheidshalve moet ik zeggen dat geen enkele laptop op dit moment USB-C opladen van 240 W ondersteunt, omdat er extra hardwareaanpassingen nodig zijn om de nieuwe specificatie volledig te benutten.

Voorkant: Geen poorten
Rechts: SD-kaartlezer, USB-C 3.2 Gen. 2 w/ Thunderbolt 5 + Power Delivery + DisplayPort 1.4, USB-A 3.2 Gen. 2, HDMI 2.1, Kensington-slot
Achterzijde: Geen poorten
Links: AC-adapter, 2,5 Gbps RJ-45, 2x USB-A 3.2 Gen. 2, USB-C w/ Power Delivery + DisplayPort 1.4, 3,5 mm headset

SD-kaartlezer

SD Card Reader
average JPG Copy Test (av. of 3 runs)
Alienware m18 R2
Intel Core i9-14900HX (Toshiba Exceria Pro SDXC 64 GB UHS-II)
190.3 MB/s +1%
Razer Blade 18 2024 RZ09-0509
Intel Core i9-14900HX (Toshiba Exceria Pro SDXC 64 GB UHS-II)
188.25 MB/s
Razer Blade 16 2024, RTX 4090
Intel Core i9-14900HX
171 (169.48min - 194.55max) MB/s -9%
MSI Titan 18 HX A14VIG
Intel Core i9-14900HX (Toshiba Exceria Pro SDXC 64 GB UHS-II)
83.8 MB/s -55%
maximum AS SSD Seq Read Test (1GB)
Razer Blade 18 2024 RZ09-0509
Intel Core i9-14900HX (Toshiba Exceria Pro SDXC 64 GB UHS-II)
220.56 MB/s
Alienware m18 R2
Intel Core i9-14900HX (Toshiba Exceria Pro SDXC 64 GB UHS-II)
219.7 MB/s 0%
Razer Blade 16 2024, RTX 4090
Intel Core i9-14900HX
181.81 MB/s -18%
MSI Titan 18 HX A14VIG
Intel Core i9-14900HX (Toshiba Exceria Pro SDXC 64 GB UHS-II)
91.5 MB/s -59%

Communicatie

WLAN is geüpgraded naar de Intel BE200 voor zowel Bluetooth 5.4 als Wi-Fi 7 ondersteuning. De overgrote meerderheid van de gebruikers heeft echter nog steeds geen Wi-Fi 7 routers, dus voorlopig zullen slechts een paar gebruikers enige prestatieverbeteringen merken.

Networking
iperf3 transmit AXE11000
Razer Blade 16 2024, RTX 4090
Intel Killer Wi-Fi 7 BE1750W 320 MHz (BE200NGW)
1577 (796min - 1617max) MBit/s +38%
Razer Blade 18 2024 RZ09-0509
Intel Wi-Fi 7 BE200 320MHz
1143 (813min - 1407max) MBit/s
MSI Titan 18 HX A14VIG
Intel Killer Wi-Fi 7 BE1750x BE200NGW
1011 (514min - 1160max) MBit/s -12%
Asus ROG Strix Scar 18 G834JYR (2024)
Intel Wi-Fi 6E AX211
968 (656min - 1200max) MBit/s -15%
Alienware m18 R2
Intel Killer Wi-Fi 7 BE1750x BE200NGW
791 (736min - 894max) MBit/s -31%
iperf3 receive AXE11000
Asus ROG Strix Scar 18 G834JYR (2024)
Intel Wi-Fi 6E AX211
1681 (1662min - 1704max) MBit/s +15%
Razer Blade 16 2024, RTX 4090
Intel Killer Wi-Fi 7 BE1750W 320 MHz (BE200NGW)
1604 (1554min - 1623max) MBit/s +10%
Razer Blade 18 2024 RZ09-0509
Intel Wi-Fi 7 BE200 320MHz
1459 (1375min - 1525max) MBit/s
Alienware m18 R2
Intel Killer Wi-Fi 7 BE1750x BE200NGW
1381 (1277min - 1427max) MBit/s -5%
MSI Titan 18 HX A14VIG
Intel Killer Wi-Fi 7 BE1750x BE200NGW
1116 (932min - 1352max) MBit/s -24%
iperf3 transmit AXE11000 6GHz
Razer Blade 16 2024, RTX 4090
Intel Killer Wi-Fi 7 BE1750W 320 MHz (BE200NGW)
1538 (784min - 1597max) MBit/s +28%
Razer Blade 18 2024 RZ09-0509
Intel Wi-Fi 7 BE200 320MHz
1199 (1057min - 1319max) MBit/s
MSI Titan 18 HX A14VIG
Intel Killer Wi-Fi 7 BE1750x BE200NGW
1096 (900min - 1242max) MBit/s -9%
Alienware m18 R2
Intel Killer Wi-Fi 7 BE1750x BE200NGW
648 (595min - 759max) MBit/s -46%
iperf3 receive AXE11000 6GHz
Razer Blade 16 2024, RTX 4090
Intel Killer Wi-Fi 7 BE1750W 320 MHz (BE200NGW)
1518 (762min - 1536max) MBit/s +15%
MSI Titan 18 HX A14VIG
Intel Killer Wi-Fi 7 BE1750x BE200NGW
1379 (709min - 1426max) MBit/s +5%
Razer Blade 18 2024 RZ09-0509
Intel Wi-Fi 7 BE200 320MHz
1315 (1269min - 1369max) MBit/s
Alienware m18 R2
Intel Killer Wi-Fi 7 BE1750x BE200NGW
1292 (1215min - 1327max) MBit/s -2%
05010015020025030035040045050055060065070075080085090095010001050110011501200125013001350Tooltip
Razer Blade 18 2024 RZ09-0509; iperf3 transmit AXE11000 6GHz; iperf 3.1.3: Ø1199 (1057-1319)
Razer Blade 18 2024 RZ09-0509; iperf3 receive AXE11000 6GHz; iperf 3.1.3: Ø1315 (1269-1369)

Webcam

De 5 MP + IR webcam is niet veranderd, afgezien van de nieuwe sluiterschuif voor privacy. Interessant genoeg is dit de enige 18-inch gaming laptop met een 5 MP webcam, net als de concurrerende Titan HX, Alienware m18 R2en ROG Strix Scar 18 in vergelijking slechts 1 MP tot 2 MP camera's hebben.
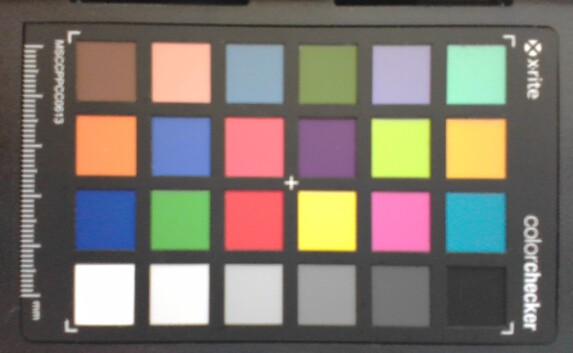
ColorChecker
13.5 ∆E
13.4 ∆E
18.4 ∆E
20 ∆E
17 ∆E
14.1 ∆E
11.9 ∆E
17.5 ∆E
16.7 ∆E
15 ∆E
15.5 ∆E
15.2 ∆E
9.4 ∆E
15.3 ∆E
21.9 ∆E
14.1 ∆E
17.5 ∆E
14.8 ∆E
2.3 ∆E
11.8 ∆E
14.4 ∆E
14.3 ∆E
11.9 ∆E
1.4 ∆E
ColorChecker Razer Blade 18 2024 RZ09-0509: 14.07 ∆E min: 1.43 - max: 21.9 ∆E

Onderhoud

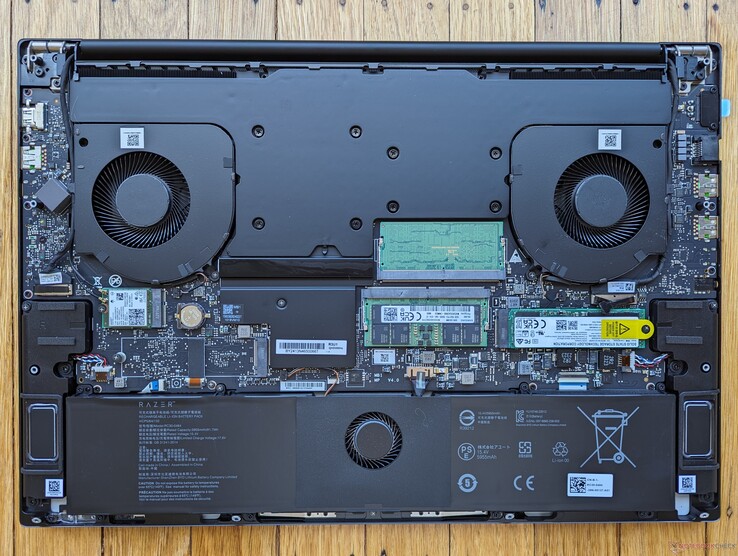
Het 2024-model heeft iets grotere luidsprekers bij de hoeken aan de voorkant. Verder zijn er geen noemenswaardige verschillen met de 2023 versie.

Blad 18 2024
Blad 18 2024
Blade 18 2023 ter vergelijking

Beeldscherm - QHD+ 300 Hz Mini-LED

Matte RGB subpixel array. Display is iets korreliger dan de meeste glanzende alternatieven

Het QHD+ 240 Hz paneel op de 2023 Blade 18 is dit jaar vervangen door twee nieuwe opties:

  • QHD+ (2560 x 1600), 300 Hz, Mini-LED, HDR1000
  • 4K UHD+ (3840 x 2400), 200 Hz, IPS, HDR400

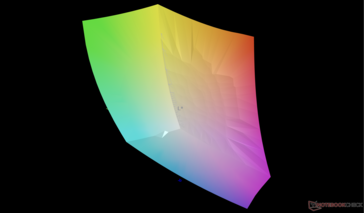
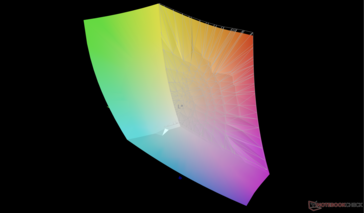
Beide panelen bieden G-Sync, fabriekskalibratie, volledige DCI-P3-kleuren en snelle reactietijden van <3 ms om geschikt te zijn voor zowel hardcore gaming als de meeste bewerkingstaken. Onze specifieke testunit is geconfigureerd met de vetgedrukte optie. Merk op dat dit exacte BOE NE180QDM-NM1 paneel ook te vinden is op de ROG Strix Scar 18, wat betekent dat de Razer en Asus laptops vergelijkbare kijkervaringen kunnen bieden.

In vergelijking met IPS en OLED biedt mini-LED diepere zwartniveaus dan IPS en helderdere witniveaus dan OLED om beter aan de HDR-vereisten te voldoen. Laptops met high-end IPS- of OLED-panelen voldoen bijvoorbeeld meestal aan HDR400 of HDR500, terwijl mini-LED vaak voldoet aan HDR1000 voor een levendigere weergave van multimedia. De maximale helderheid op onze Blade 18 kan 1227 nits bereiken wanneer zowel HDR als lokaal dimmen zijn ingeschakeld, vergeleken met slechts 712 nits wanneer HDR is ingeschakeld maar lokaal dimmen is uitgeschakeld. De helderheid is verder beperkt tot ~600 nits in SDR-modus, wat nog steeds veel helderder is dan de meeste andere gaming laptops.

BeeldscherminstellingSDR-modus met lokaal dimmen uitSDR-modus met lokaal dimmen aanHDR-modus met lokaal dimmen uitHDR-stand met lokaal dimmen aan
Maximale helderheid (nits)6056027121227


Volledig zwart scherm in SDR-modus met lokaal dimmen uitgeschakeld. Bleeding aanwezig, zij het relatief gelijkmatig
Volledig zwart scherm in HDR-modus met lokaal dimmen ingeschakeld. Het scherm wordt pikzwart voor OLED-achtige contrastverhoudingen

Zwartniveaus en dus contrast worden ook beïnvloed door lokaal dimmen. We kunnen een zwartniveau van 0,62 nits meten met lokale verduistering uit versus 0,22 nits met lokale verduistering aan voor veel hogere contrastniveaus, vooral wanneer HDR is ingeschakeld. Lokaal dimmen is misschien niet nodig of zelfs niet aan te raden voor browsing- of bewerkingsdoeleinden vanwege het inherente "halo"-effect, maar het is de moeite waard om het in te schakelen voor HDR-video's en games, waar het nadeel minder merkbaar is.

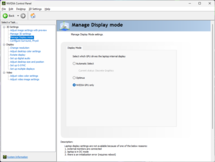
Houd er rekening mee dat de verversingssnelheid van het paneel alleen in de dGPU-modus tot 300 Hz ondersteunt, omdat deze anders beperkt is tot 240 Hz in de Optimus-modus. Een dynamische vernieuwingsfrequentie tot 60 Hz wordt alleen ondersteund in de Optimus-modus.

600.6
cd/m²
605.5
cd/m²
602.3
cd/m²
601.8
cd/m²
605.4
cd/m²
588
cd/m²
605
cd/m²
603.5
cd/m²
586.6
cd/m²
Helderheidsverdeling
BOE NE180QDM-NM1 tested with X-Rite i1Pro 2
Maximum: 605.5 cd/m² (Nits) Gemiddelde: 599.9 cd/m² Minimum: 0.62 cd/m²
Helderheidsverdeling: 97 %
Helderheid in Batterij-modus: 605.4 cd/m²
Contrast: 976:1 (Zwart: 0.62 cd/m²)
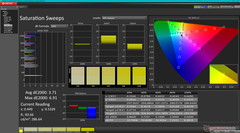
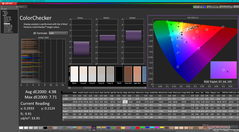
ΔE Color 1.53 | 0.5-29.43 Ø4.92
ΔE Greyscale 2.6 | 0.5-98 Ø5.2
86.9% AdobeRGB 1998 (Argyll 2.2.0 3D)
100% sRGB (Argyll 2.2.0 3D)
99% Display P3 (Argyll 2.2.0 3D)
Gamma: 2.22
Razer Blade 18 2024 RZ09-0509
BOE NE180QDM-NM1, Mini-LED, 2560x1600, 18"
Razer Blade 18 RTX 4070
AU Optronics B180QAN01.0, IPS, 2560x1600, 18"
Alienware m18 R2
BOE NE18NZ1, IPS, 2560x1600, 18"
MSI Titan 18 HX A14VIG
AU Optronics B180ZAN01.0, Mini-LED, 3840x2400, 18"
Asus ROG Strix Scar 18 G834JYR (2024)
BOE NE180QDM-NM1, Mini LED, 2560x1600, 18"
Display
-1%
0%
-1%
2%
Display P3 Coverage
99
96.9
-2%
97.8
-1%
98.1
-1%
99.9
1%
sRGB Coverage
100
99.8
0%
99.5
0%
99.8
0%
100
0%
AdobeRGB 1998 Coverage
86.9
85.3
-2%
88.9
2%
86.2
-1%
90
4%
Response Times
44%
28%
-196%
-37%
Response Time Grey 50% / Grey 80% *
7.6 ?(3.6, 4)
4.2 ?(2.1, 2.1)
45%
5.3 ?(2.2, 3.1)
30%
8.6 ?(4.2, 4.4)
-13%
12 ?(8, 4)
-58%
Response Time Black / White *
14 ?(6.6, 7.4)
8 ?(3.8, 4.2)
43%
10.4 ?(4.8, 5.6)
26%
81.8 ?(76, 5.8)
-484%
10.7 ?(7.6, 3.1)
24%
PWM Frequency
26444 ?(100)
2592 ?(100)
-90%
5733 ?(94)
-78%
Screen
-20%
-26%
-45%
202%
Brightness middle
605.4
549.6
-9%
271.8
-55%
467.5
-23%
937
55%
Brightness
600
524
-13%
275
-54%
459
-23%
934
56%
Brightness Distribution
97
89
-8%
78
-20%
90
-7%
89
-8%
Black Level *
0.62
0.53
15%
0.27
56%
0.066
89%
Contrast
976
1037
6%
1007
3%
14197
1355%
Colorchecker dE 2000 *
1.53
3.32
-117%
2.48
-62%
3.77
-146%
1.52
1%
Colorchecker dE 2000 max. *
4.15
6.63
-60%
5.59
-35%
6.12
-47%
2.82
32%
Greyscale dE 2000 *
2.6
2
23%
3.7
-42%
3.2
-23%
1.7
35%
Gamma
2.22 99%
2.29 96%
2.2 100%
2.43 91%
2.042 108%
CCT
6843 95%
6319 103%
6355 102%
6478 100%
6578 99%
Colorchecker dE 2000 calibrated *
2.7
0.56
2.94
1.21
Totaal Gemiddelde (Programma / Instellingen)
8% / -6%
1% / -12%
-81% / -72%
56% / 108%

* ... kleiner is beter

vs. sRGB
vs. sRGB
vs. P3
vs. P3

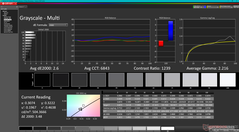
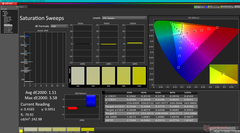
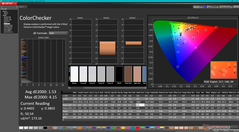
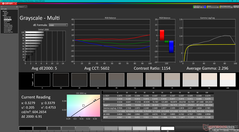
De P3-standaard wordt volledig weergegeven zoals geadverteerd. Kleuren verschuiven echter hinderlijk wanneer er tussen de Optimus- en dGPU-modi wordt gewisseld. sRGB-kleuren zijn nauwkeurig met gemiddelde DeltaE-grijstinten en ColorChecker-waarden van respectievelijk slechts 2,6 en 1,53, maar P3-kleuren zijn onnauwkeuriger, zelfs wanneer deze op de P3-modus zijn ingesteld. De kleurtemperatuur wordt bijvoorbeeld automatisch warmer bij 5600K wanneer deze is ingesteld op P3. Er is mogelijk een bug in de manier waarop P3-kleuren worden weergegeven bij het wisselen tussen verschillende GPU-modi.

Grijswaarden (vs. sRGB)
Verzadigingsvegen (t.o.v. sRGB)
ColorChecker (vs. sRGB)
Grijstinten (vs. P3)
Verzadigingsvegen (vs. P3)
ColorChecker (vs. P3)

Responstijd Scherm

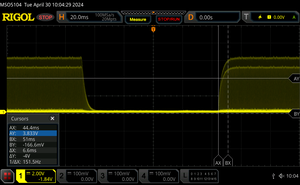
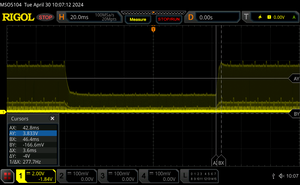
De responstijden van het scherm tonen hoe snel het scherm in staat is om van één kleur naar de andere te veranderen. Trage responstijden kunnen aanleiding geven tot 'nabeelden' rond bewegende objecten of het scherm wazig maken (blur). Vooral spelers van snelle 3D-games hebben baat bij een scherm met snelle responstijden.
       Responstijd Zwart naar Wit
14 ms ... stijging ↗ en daling ↘ gecombineerd↗ 6.6 ms stijging
↘ 7.4 ms daling
Het scherm vertoonde prima responstijden in onze tests maar is misschien wat te traag voor competitieve games.
Ter vergelijking: alle testtoestellen variëren van 0.1 (minimum) tot 240 (maximum) ms. » 31 % van alle toestellen zijn beter.
Dit betekent dat de gemeten responstijd beter is dan het gemiddelde (21 ms) van alle geteste toestellen.
       Responstijd 50% Grijs naar 80% Grijs
7.6 ms ... stijging ↗ en daling ↘ gecombineerd↗ 3.6 ms stijging
↘ 4 ms daling
Het scherm vertoonde erg snelle responstijden in onze tests en zou zeer geschikt moeten zijn voor snelle games.
Ter vergelijking: alle testtoestellen variëren van 0.165 (minimum) tot 636 (maximum) ms. » 17 % van alle toestellen zijn beter.
Dit betekent dat de gemeten responstijd beter is dan het gemiddelde (32.9 ms) van alle geteste toestellen.

Screen Flickering / PWM (Pulse-Width Modulation)

Om de schermhelderheid te verlagen schakelen sommige laptops het backlight erg snel aan en uit. Dit gebeurt aan een dergelijk hoge frequentie dat het niet zichtbaar is voor het menselijk oog. Als de frequentie te laag is kunnen personen met gevoelige ogen geïrriteerd geraken, hoofdpijn krijgen en zelfs flickering waarnemen.
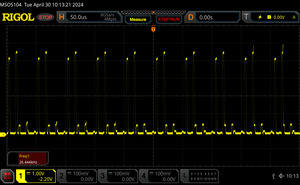
Screen flickering / PWM waargenomen 26444 Hz ≤ 100 % helderheid instelling

Het backlight van het scherm flikkert aan 26444 Hz (hoogstwaarschijnlijk met PWM - Pulse-Width Modulation) aan een helderheid van 100 % en lager. Boven deze helderheid zou er geen flickering / PWM mogen optreden.

De frequentie van 26444 Hz is redelijk hoog en de meeste mensen die gevoelig zijn aan flickering zouden dit dus niet mogen waarnemen of geïrriteerde ogen krijgen.

Ter vergelijking: 53 % van alle geteste toestellen maakten geen gebruik van PWM om de schermhelderheid te verlagen. Als het wel werd gebruikt, werd een gemiddelde van 8750 (minimum: 5 - maximum: 343500) Hz waargenomen.

Net als bij andere laptops met mini-LED-opties is er sprake van flikkering. De frequentie is echter extreem hoog en daarom is het minder waarschijnlijk dat het vermoeide ogen veroorzaakt bij gevoelige gebruikers. De intensiteit van het flikkeren lijkt ook aanzienlijk af te nemen zodra de helderheid wordt verlaagd tot <50%, dus lagere helderheidsniveaus zijn misschien geen slecht idee.

0 procent helderheid
25 procent helderheid
50 procent helderheid
75 procent helderheid
100 procent helderheid

De zichtbaarheid buiten is redelijk in de schaduw, vooral omdat de matte overlay schittering minimaliseert. Direct zonlicht moet echter nog steeds vermeden worden voor een optimale kijkervaring.

Buiten onder zonlicht
Buiten in de schaduw
Buiten onder zonlicht
Brede mini-LED kijkhoeken vertonen niet de contrastdegradatie van IPS of het regenboogeffect van OLED voor stabielere kleuren

Prestaties - Net als vroeger


Testomstandigheden

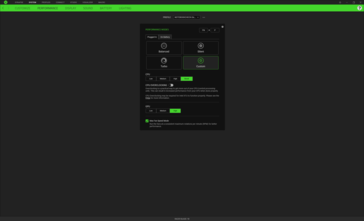
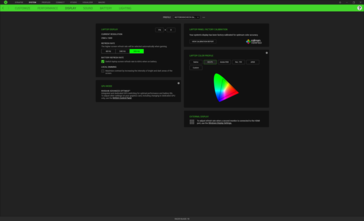
Razer blijft Synapse updaten met extra functies en aankruisvakjes voor verbeterde aanpassing. Nieuw dit jaar zijn de Turbo-modus, de Max Fan-modus en geïntegreerde displayfuncties zoals kleurprofielen en sneltoetsen om de vernieuwingsfrequentie aan te passen. Merk op dat de nieuwe Turbomodus in wezen gelijkwaardig is aan de Aangepaste modus, zoals onze tests hieronder zullen laten zien. Razer zegt dat ze de Turbomodus hebben toegevoegd om het makkelijker te maken voor gebruikers om de "beste" modus voor gaming te selecteren, maar wij denken dat dit het tegenovergestelde effect kan hebben omdat er nu te veel verwarrende modi zijn om uit te kiezen. Al onze tests hieronder werden uitgevoerd in de Aangepaste modus met de CPU en GPU respectievelijk ingesteld op Boost en Hoog, tenzij anders vermeld.

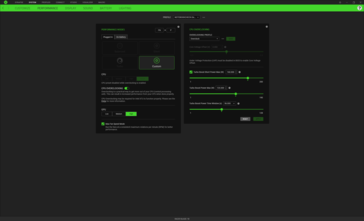
Misschien wel de belangrijkste functie om in gedachten te houden is de lokale dimmer onder het tabblad Beeldscherm. Interessant genoeg heeft Razer dit standaard uitgeschakeld, ook al is lokaal dimmen een van de belangrijkste verkoopargumenten van mini-LED. Het schakelen van deze functie kan een grote invloed hebben op de helderheidsniveaus in de HDR-modus, zoals hierboven vermeld.

Scherm Power Profile met aangepaste modus, maximale ventilatormodus, turbomodus en meer
Submenu CPU overklokken
Tabblad Beeldscherm met kleurprofielen, vernieuwingsfrequenties en lokale dimfuncties
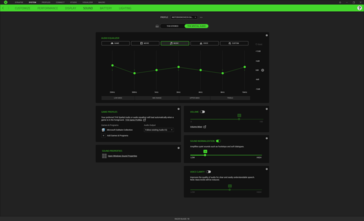
Audio-aanpassingen
Audio-aanpassingen

Processor

Overwegende dat de sprong van de 12e generatie Core i9-12900HX naar 13e generatie Core i9-13900HX een prestatieboost van 25 tot 30 procent zou betekenen, is de sprong van de 13e generatie Core i9-13900HX naar de 14e generatie Core i9-14900HX in wezen een vlakke lijn. Benchmarkresultaten tussen onze 2023 en 2024 Blade 18 modellen zouden binnen 5 procentpunten van elkaar liggen in zowel single- als multi-threaded workloads. De i9-14900HX wordt informeel beschreven als een rebranding van de i9-13900HX en onze cijfers weerspiegelen dit.

VermogensprofielCineBench R23 xT Score (Punten)Aanhoudend CPU Vermogensniveau (W)Cyberpunk 2077 QHD Ultra (FPS)
Gebalanceerd1426955 -> 4565.13
Turbo27029135 -> 12584.69
Custom met max ventilator aan27167135 -> 12585.46

Interessant is dat de CPU-resultaten van ons Razer-systeem iets maar consequent langzamer zijn dan de meeste andere gaminglaptops met dezelfde CPU, zoals de Alienware m18 R2 of de MSI Titan 18 HX. We vermoeden dat dit met opzet is gedaan om meer overklokruimte te creëren via de Synapse-software. CPU Turbo Boost-prestaties en TDP-niveaus zijn gekoppeld aan de verschillende energieprofielen, zoals weergegeven in de bovenstaande tabel.

Cinebench R15 Multi Loop

02805608401120140016801960224025202800308033603640392042004480476050405320Tooltip
Razer Blade 18 2024 RZ09-0509 Intel Core i9-14900HX: Ø4163 (3956.09-4227.88)
Alienware m18 R2 Intel Core i9-14900HX: Ø4743 (4458.81-4807.11)
Asus ROG Strix Scar 17 G733PYV-LL053X AMD Ryzen 9 7945HX3D: Ø5282 (5177.32-5599.89)
MSI Titan 18 HX A14VIG Intel Core i9-14900HX: Ø4753 (4700.35-4782.4)
Asus ROG Strix Scar 18 G834JYR (2024) Intel Core i9-14900HX: Ø4024 (3961.18-4098.11)
Razer Blade 16 2024, RTX 4090 Intel Core i9-14900HX: Ø4396 (4349.72-4455.83)
CPU Performance Rating: Percent
Cinebench R23: Multi Core | Single Core
Cinebench R20: CPU (Multi Core) | CPU (Single Core)
Cinebench R15: CPU Multi 64Bit | CPU Single 64Bit
Blender: v2.79 BMW27 CPU
7-Zip 18.03: 7z b 4 | 7z b 4 -mmt1
Geekbench 6.3: Multi-Core | Single-Core
Geekbench 5.5: Multi-Core | Single-Core
HWBOT x265 Benchmark v2.2: 4k Preset
LibreOffice : 20 Documents To PDF
R Benchmark 2.5: Overall mean
CPU Performance Rating
Alienware m18 R1 AMD
AMD Ryzen 9 7945HX
84.3 pt
Asus ROG Strix Scar 17 G733PYV-LL053X
AMD Ryzen 9 7945HX3D
84.2 pt
Alienware m18 R2
Intel Core i9-14900HX
83.4 pt
Alienware m18 R1 -2!
Intel Core i9-13980HX
80.7 pt
MSI Titan 18 HX A14VIG
Intel Core i9-14900HX
79.9 pt
Razer Blade 16 2024, RTX 4090
Intel Core i9-14900HX
79 pt
Gemiddeld Intel Core i9-14900HX
 
79 pt
Asus ROG Strix Scar 18 G834JYR (2024)
Intel Core i9-14900HX
78.8 pt
Razer Blade 18 RTX 4070 -2!
Intel Core i9-13950HX
76.1 pt
Razer Blade 18 2024 RZ09-0509
Intel Core i9-14900HX
75.9 pt
MSI Titan GT77 12UHS -2!
Intel Core i9-12900HX
65.4 pt
Asus TUF Gaming A17 FA707XI-NS94
AMD Ryzen 9 7940HS
60 pt
MSI Pulse 17 B13VGK
Intel Core i7-13700H
55.2 pt
Acer Nitro 17 AN17-41-R9LN
AMD Ryzen 7 7735HS
46.8 pt
Cinebench R23 / Multi Core
Alienware m18 R1 AMD
AMD Ryzen 9 7945HX
34613 (33896.2min - 34613.2max) Points +25%
Asus ROG Strix Scar 17 G733PYV-LL053X
AMD Ryzen 9 7945HX3D
32782 Points +19%
Alienware m18 R1
Intel Core i9-13980HX
32601 (28888.6min - 32601.4max) Points +18%
MSI Titan 18 HX A14VIG
Intel Core i9-14900HX
32428 (29693.8min - 32428.3max) Points +17%
Alienware m18 R2
Intel Core i9-14900HX
31391 (28656min - 31390.7max) Points +14%
Gemiddeld Intel Core i9-14900HX
  (17078 - 36249, n=34)
29130 Points +5%
Razer Blade 16 2024, RTX 4090
Intel Core i9-14900HX
28867 Points +4%
Razer Blade 18 RTX 4070
Intel Core i9-13950HX
28681 (25585.5min - 28680.9max) Points +4%
Asus ROG Strix Scar 18 G834JYR (2024)
Intel Core i9-14900HX
28516 Points +3%
Razer Blade 18 2024 RZ09-0509
Intel Core i9-14900HX
27657 (23328.1min - 27657.5max) Points
MSI Titan GT77 12UHS
Intel Core i9-12900HX
22982 Points -17%
MSI Pulse 17 B13VGK
Intel Core i7-13700H
18304 Points -34%
Asus TUF Gaming A17 FA707XI-NS94
AMD Ryzen 9 7940HS
17623 (17398.8min - 17622.8max) Points -36%
Acer Nitro 17 AN17-41-R9LN
AMD Ryzen 7 7735HS
14087 Points -49%
Cinebench R23 / Single Core
Alienware m18 R2
Intel Core i9-14900HX
2235 Points +7%
Asus ROG Strix Scar 18 G834JYR (2024)
Intel Core i9-14900HX
2177 Points +4%
Gemiddeld Intel Core i9-14900HX
  (1720 - 2245, n=34)
2157 Points +3%
MSI Titan 18 HX A14VIG
Intel Core i9-14900HX
2143 Points +3%
Razer Blade 16 2024, RTX 4090
Intel Core i9-14900HX
2117 Points +1%
Alienware m18 R1
Intel Core i9-13980HX
2106 Points +1%
Razer Blade 18 2024 RZ09-0509
Intel Core i9-14900HX
2088 Points
Razer Blade 18 RTX 4070
Intel Core i9-13950HX
2076 Points -1%
Alienware m18 R1 AMD
AMD Ryzen 9 7945HX
1948 Points -7%
Asus ROG Strix Scar 17 G733PYV-LL053X
AMD Ryzen 9 7945HX3D
1935 Points -7%
MSI Titan GT77 12UHS
Intel Core i9-12900HX
1913 Points -8%
Asus TUF Gaming A17 FA707XI-NS94
AMD Ryzen 9 7940HS
1832 Points -12%
MSI Pulse 17 B13VGK
Intel Core i7-13700H
1694 Points -19%
Acer Nitro 17 AN17-41-R9LN
AMD Ryzen 7 7735HS
1569 Points -25%
Cinebench R20 / CPU (Multi Core)
Alienware m18 R1 AMD
AMD Ryzen 9 7945HX
13308 Points +22%
Asus ROG Strix Scar 17 G733PYV-LL053X
AMD Ryzen 9 7945HX3D
13033 Points +20%
Alienware m18 R1
Intel Core i9-13980HX
12423 Points +14%
MSI Titan 18 HX A14VIG
Intel Core i9-14900HX
12103 Points +11%
Alienware m18 R2
Intel Core i9-14900HX
11816 Points +9%
Gemiddeld Intel Core i9-14900HX
  (6579 - 13832, n=34)
11084 Points +2%
Razer Blade 16 2024, RTX 4090
Intel Core i9-14900HX
10968 Points +1%
Razer Blade 18 RTX 4070
Intel Core i9-13950HX
10919 Points 0%
Razer Blade 18 2024 RZ09-0509
Intel Core i9-14900HX
10871 Points
Asus ROG Strix Scar 18 G834JYR (2024)
Intel Core i9-14900HX
10787 Points -1%
MSI Titan GT77 12UHS
Intel Core i9-12900HX
8667 Points -20%
MSI Pulse 17 B13VGK
Intel Core i7-13700H
7190 Points -34%
Asus TUF Gaming A17 FA707XI-NS94
AMD Ryzen 9 7940HS
6894 Points -37%
Acer Nitro 17 AN17-41-R9LN
AMD Ryzen 7 7735HS
5408 Points -50%
Cinebench R20 / CPU (Single Core)
Alienware m18 R2
Intel Core i9-14900HX
853 Points +5%
Asus ROG Strix Scar 18 G834JYR (2024)
Intel Core i9-14900HX
833 Points +2%
Gemiddeld Intel Core i9-14900HX
  (657 - 859, n=34)
826 Points +1%
MSI Titan 18 HX A14VIG
Intel Core i9-14900HX
823 Points +1%
Razer Blade 18 2024 RZ09-0509
Intel Core i9-14900HX
814 Points
Razer Blade 16 2024, RTX 4090
Intel Core i9-14900HX
810 Points 0%
Alienware m18 R1
Intel Core i9-13980HX
807 Points -1%
Razer Blade 18 RTX 4070
Intel Core i9-13950HX
797 Points -2%
Asus ROG Strix Scar 17 G733PYV-LL053X
AMD Ryzen 9 7945HX3D
755 Points -7%
Alienware m18 R1 AMD
AMD Ryzen 9 7945HX
747 Points -8%
MSI Titan GT77 12UHS
Intel Core i9-12900HX
738 Points -9%
Asus TUF Gaming A17 FA707XI-NS94
AMD Ryzen 9 7940HS
714 Points -12%
MSI Pulse 17 B13VGK
Intel Core i7-13700H
663 Points -19%
Acer Nitro 17 AN17-41-R9LN
AMD Ryzen 7 7735HS
611 Points -25%
Cinebench R15 / CPU Multi 64Bit
Asus ROG Strix Scar 17 G733PYV-LL053X
AMD Ryzen 9 7945HX3D
5600 (5177.32min - 5599.89max) Points +32%
Alienware m18 R1 AMD
AMD Ryzen 9 7945HX
5541 (5377.07min - 5540.93max) Points +31%
Alienware m18 R1
Intel Core i9-13980HX
4989 (4579.8min - 4989.4max) Points +18%
Alienware m18 R2
Intel Core i9-14900HX
4807 (4458.81min - 4807.11max) Points +14%
MSI Titan 18 HX A14VIG
Intel Core i9-14900HX
4782 (4700.35min - 4782.4max) Points +13%
Razer Blade 18 RTX 4070
Intel Core i9-13950HX
4481 Points +6%
Gemiddeld Intel Core i9-14900HX
  (3263 - 5589, n=35)
4462 Points +6%
Razer Blade 16 2024, RTX 4090
Intel Core i9-14900HX
4456 (4349.72min - 4455.83max) Points +5%
Razer Blade 18 2024 RZ09-0509
Intel Core i9-14900HX
4228 (3956.09min - 4227.88max) Points
Asus ROG Strix Scar 18 G834JYR (2024)
Intel Core i9-14900HX
4098 Points -3%
MSI Titan GT77 12UHS
Intel Core i9-12900HX
3570 (3259.45min - 3569.52max) Points -16%
MSI Pulse 17 B13VGK
Intel Core i7-13700H
2869 (2748.57min - 2868.62max) Points -32%
Asus TUF Gaming A17 FA707XI-NS94
AMD Ryzen 9 7940HS
2817 (2741.98min - 2817.3max) Points -33%
Acer Nitro 17 AN17-41-R9LN
AMD Ryzen 7 7735HS
2296 (2231.27min - 2296.34max) Points -46%
Cinebench R15 / CPU Single 64Bit
Alienware m18 R2
Intel Core i9-14900HX
318 Points +5%
Asus ROG Strix Scar 17 G733PYV-LL053X
AMD Ryzen 9 7945HX3D
311 Points +2%
Razer Blade 16 2024, RTX 4090
Intel Core i9-14900HX
311 Points +2%
Alienware m18 R1 AMD
AMD Ryzen 9 7945HX
309 Points +2%
Gemiddeld Intel Core i9-14900HX
  (247 - 323, n=34)
306 Points +1%
Razer Blade 18 2024 RZ09-0509
Intel Core i9-14900HX
304 Points
Alienware m18 R1
Intel Core i9-13980HX
303 Points 0%
Asus ROG Strix Scar 18 G834JYR (2024)
Intel Core i9-14900HX
302 Points -1%
MSI Titan 18 HX A14VIG
Intel Core i9-14900HX
300 Points -1%
Razer Blade 18 RTX 4070
Intel Core i9-13950HX
297 Points -2%
Asus TUF Gaming A17 FA707XI-NS94
AMD Ryzen 9 7940HS
287 Points -6%
MSI Titan GT77 12UHS
Intel Core i9-12900HX
278 Points -9%
Acer Nitro 17 AN17-41-R9LN
AMD Ryzen 7 7735HS
251 Points -17%
MSI Pulse 17 B13VGK
Intel Core i7-13700H
250 Points -18%
Blender / v2.79 BMW27 CPU
Acer Nitro 17 AN17-41-R9LN
AMD Ryzen 7 7735HS
222 Seconds * -90%
Asus TUF Gaming A17 FA707XI-NS94
AMD Ryzen 9 7940HS
183 Seconds * -56%
MSI Pulse 17 B13VGK
Intel Core i7-13700H
173 Seconds * -48%
MSI Titan GT77 12UHS
Intel Core i9-12900HX
147 Seconds * -26%
Gemiddeld Intel Core i9-14900HX
  (91 - 206, n=34)
119.5 Seconds * -2%
Asus ROG Strix Scar 18 G834JYR (2024)
Intel Core i9-14900HX
118 Seconds * -1%
Razer Blade 18 2024 RZ09-0509
Intel Core i9-14900HX
117 Seconds *
Razer Blade 16 2024, RTX 4090
Intel Core i9-14900HX
113 Seconds * +3%
Razer Blade 18 RTX 4070
Intel Core i9-13950HX
111 Seconds * +5%
MSI Titan 18 HX A14VIG
Intel Core i9-14900HX
104 Seconds * +11%
Alienware m18 R2
Intel Core i9-14900HX
102 Seconds * +13%
Alienware m18 R1
Intel Core i9-13980HX
97 Seconds * +17%
Asus ROG Strix Scar 17 G733PYV-LL053X
AMD Ryzen 9 7945HX3D
95 Seconds * +19%
Alienware m18 R1 AMD
AMD Ryzen 9 7945HX
87 Seconds * +26%
7-Zip 18.03 / 7z b 4
Alienware m18 R1 AMD
AMD Ryzen 9 7945HX
140493 MIPS +31%
Asus ROG Strix Scar 17 G733PYV-LL053X
AMD Ryzen 9 7945HX3D
136201 MIPS +27%
Alienware m18 R1
Intel Core i9-13980HX
129804 MIPS +21%
Alienware m18 R2
Intel Core i9-14900HX
122772 MIPS +14%
MSI Titan 18 HX A14VIG
Intel Core i9-14900HX
121266 MIPS +13%
Razer Blade 18 RTX 4070
Intel Core i9-13950HX
116665 MIPS +8%
Razer Blade 16 2024, RTX 4090
Intel Core i9-14900HX
115695 MIPS +8%
Asus ROG Strix Scar 18 G834JYR (2024)
Intel Core i9-14900HX
114546 MIPS +7%
Gemiddeld Intel Core i9-14900HX
  (66769 - 136645, n=34)
112494 MIPS +5%
Razer Blade 18 2024 RZ09-0509
Intel Core i9-14900HX
107527 MIPS
MSI Titan GT77 12UHS
Intel Core i9-12900HX
86234 MIPS -20%
MSI Pulse 17 B13VGK
Intel Core i7-13700H
74965 MIPS -30%
Asus TUF Gaming A17 FA707XI-NS94
AMD Ryzen 9 7940HS
72749 MIPS -32%
Acer Nitro 17 AN17-41-R9LN
AMD Ryzen 7 7735HS
61495 MIPS -43%
7-Zip 18.03 / 7z b 4 -mmt1
Asus ROG Strix Scar 17 G733PYV-LL053X
AMD Ryzen 9 7945HX3D
7573 MIPS +17%
Alienware m18 R1 AMD
AMD Ryzen 9 7945HX
7381 MIPS +14%
Asus ROG Strix Scar 18 G834JYR (2024)
Intel Core i9-14900HX
7172 MIPS +10%
Alienware m18 R2
Intel Core i9-14900HX
7103 MIPS +9%
Razer Blade 16 2024, RTX 4090
Intel Core i9-14900HX
7018 MIPS +8%
Gemiddeld Intel Core i9-14900HX
  (5452 - 7545, n=34)
7017 MIPS +8%
Alienware m18 R1
Intel Core i9-13980HX
6889 MIPS +6%
Razer Blade 18 RTX 4070
Intel Core i9-13950HX
6880 MIPS +6%
Asus TUF Gaming A17 FA707XI-NS94
AMD Ryzen 9 7940HS
6642 MIPS +2%
MSI Titan 18 HX A14VIG
Intel Core i9-14900HX
6504 MIPS 0%
Razer Blade 18 2024 RZ09-0509
Intel Core i9-14900HX
6497 MIPS
MSI Titan GT77 12UHS
Intel Core i9-12900HX
6256 MIPS -4%
Acer Nitro 17 AN17-41-R9LN
AMD Ryzen 7 7735HS
5797 MIPS -11%
MSI Pulse 17 B13VGK
Intel Core i7-13700H
5461 MIPS -16%
Geekbench 6.3 / Multi-Core
Alienware m18 R2
Intel Core i9-14900HX
18233 Points +6%
Asus ROG Strix Scar 18 G834JYR (2024)
Intel Core i9-14900HX
17695 Points +3%
Razer Blade 16 2024, RTX 4090
Intel Core i9-14900HX
17559 Points +2%
Gemiddeld Intel Core i9-14900HX
  (13158 - 19665, n=34)
17369 Points +1%
Razer Blade 18 2024 RZ09-0509
Intel Core i9-14900HX
17231 Points
Asus ROG Strix Scar 17 G733PYV-LL053X
AMD Ryzen 9 7945HX3D
16957 Points -2%
MSI Titan 18 HX A14VIG
Intel Core i9-14900HX
16652 Points -3%
Alienware m18 R1 AMD
AMD Ryzen 9 7945HX
16316 Points -5%
MSI Pulse 17 B13VGK
Intel Core i7-13700H
12989 Points -25%
Asus TUF Gaming A17 FA707XI-NS94
AMD Ryzen 9 7940HS
12447 Points -28%
Acer Nitro 17 AN17-41-R9LN
AMD Ryzen 7 7735HS
10348 Points -40%
Geekbench 6.3 / Single-Core
Alienware m18 R2
Intel Core i9-14900HX
3057 Points +8%
Asus ROG Strix Scar 18 G834JYR (2024)
Intel Core i9-14900HX
2999 Points +6%
Gemiddeld Intel Core i9-14900HX
  (2419 - 3129, n=34)
2973 Points +5%
Razer Blade 16 2024, RTX 4090
Intel Core i9-14900HX
2964 Points +4%
Asus ROG Strix Scar 17 G733PYV-LL053X
AMD Ryzen 9 7945HX3D
2916 Points +3%
Alienware m18 R1 AMD
AMD Ryzen 9 7945HX
2876 Points +1%
MSI Titan 18 HX A14VIG
Intel Core i9-14900HX
2843 Points 0%
Razer Blade 18 2024 RZ09-0509
Intel Core i9-14900HX
2842 Points
Asus TUF Gaming A17 FA707XI-NS94
AMD Ryzen 9 7940HS
2730 Points -4%
MSI Pulse 17 B13VGK
Intel Core i7-13700H
2316 Points -19%
Acer Nitro 17 AN17-41-R9LN
AMD Ryzen 7 7735HS
2115 Points -26%
Geekbench 5.5 / Multi-Core
Alienware m18 R1
Intel Core i9-13980HX
22200 Points +15%
Alienware m18 R2
Intel Core i9-14900HX
21284 Points +10%
Razer Blade 18 RTX 4070
Intel Core i9-13950HX
20036 Points +4%
Asus ROG Strix Scar 18 G834JYR (2024)
Intel Core i9-14900HX
19975 Points +3%
Asus ROG Strix Scar 17 G733PYV-LL053X
AMD Ryzen 9 7945HX3D
19875 Points +3%
Alienware m18 R1 AMD
AMD Ryzen 9 7945HX
19802 Points +3%
Gemiddeld Intel Core i9-14900HX
  (8618 - 23194, n=34)
19540 Points +1%
Razer Blade 16 2024, RTX 4090
Intel Core i9-14900HX
19372 Points 0%
Razer Blade 18 2024 RZ09-0509
Intel Core i9-14900HX
19310 Points
MSI Titan 18 HX A14VIG
Intel Core i9-14900HX
19137 Points -1%
MSI Titan GT77 12UHS
Intel Core i9-12900HX
16250 Points -16%
MSI Pulse 17 B13VGK
Intel Core i7-13700H
13257 Points -31%
Asus TUF Gaming A17 FA707XI-NS94
AMD Ryzen 9 7940HS
11399 Points -41%
Acer Nitro 17 AN17-41-R9LN
AMD Ryzen 7 7735HS
9694 Points -50%
Geekbench 5.5 / Single-Core
Alienware m18 R2
Intel Core i9-14900HX
2193 Points +9%
Asus ROG Strix Scar 17 G733PYV-LL053X
AMD Ryzen 9 7945HX3D
2133 Points +6%
Razer Blade 16 2024, RTX 4090
Intel Core i9-14900HX
2131 Points +6%
Alienware m18 R1 AMD
AMD Ryzen 9 7945HX
2124 Points +5%
Asus ROG Strix Scar 18 G834JYR (2024)
Intel Core i9-14900HX
2118 Points +5%
MSI Titan 18 HX A14VIG
Intel Core i9-14900HX
2098 Points +4%
Gemiddeld Intel Core i9-14900HX
  (1669 - 2210, n=34)
2092 Points +4%
Alienware m18 R1
Intel Core i9-13980HX
2062 Points +2%
Razer Blade 18 RTX 4070
Intel Core i9-13950HX
2035 Points +1%
Razer Blade 18 2024 RZ09-0509
Intel Core i9-14900HX
2015 Points
Asus TUF Gaming A17 FA707XI-NS94
AMD Ryzen 9 7940HS
2014 Points 0%
MSI Titan GT77 12UHS
Intel Core i9-12900HX
1923 Points -5%
MSI Pulse 17 B13VGK
Intel Core i7-13700H
1704 Points -15%
Acer Nitro 17 AN17-41-R9LN
AMD Ryzen 7 7735HS
1554 Points -23%
HWBOT x265 Benchmark v2.2 / 4k Preset
Alienware m18 R1 AMD
AMD Ryzen 9 7945HX
37.5 fps +35%
Asus ROG Strix Scar 17 G733PYV-LL053X
AMD Ryzen 9 7945HX3D
36.4 fps +31%
Alienware m18 R1
Intel Core i9-13980HX
33.1 fps +19%
Alienware m18 R2
Intel Core i9-14900HX
32.1 fps +16%
Razer Blade 18 RTX 4070
Intel Core i9-13950HX
31 fps +12%
MSI Titan 18 HX A14VIG
Intel Core i9-14900HX
30.9 fps +12%
Razer Blade 16 2024, RTX 4090
Intel Core i9-14900HX
30.1 fps +9%
Gemiddeld Intel Core i9-14900HX
  (16.8 - 38.9, n=34)
29.7 fps +7%
Asus ROG Strix Scar 18 G834JYR (2024)
Intel Core i9-14900HX
29.2 fps +5%
Razer Blade 18 2024 RZ09-0509
Intel Core i9-14900HX
27.7 fps
MSI Titan GT77 12UHS
Intel Core i9-12900HX
25.6 fps -8%
Asus TUF Gaming A17 FA707XI-NS94
AMD Ryzen 9 7940HS
21.8 fps -21%
MSI Pulse 17 B13VGK
Intel Core i7-13700H
21.2 fps -23%
Acer Nitro 17 AN17-41-R9LN
AMD Ryzen 7 7735HS
17 fps -39%
LibreOffice / 20 Documents To PDF
Acer Nitro 17 AN17-41-R9LN
AMD Ryzen 7 7735HS
63.8 s * -32%
MSI Pulse 17 B13VGK
Intel Core i7-13700H
62.4 s * -29%
Asus TUF Gaming A17 FA707XI-NS94
AMD Ryzen 9 7940HS
49.4 s * -2%
Razer Blade 18 2024 RZ09-0509
Intel Core i9-14900HX
48.5 s *
Razer Blade 16 2024, RTX 4090
Intel Core i9-14900HX
47.5 s * +2%
Alienware m18 R1
Intel Core i9-13980HX
46.7 s * +4%
MSI Titan 18 HX A14VIG
Intel Core i9-14900HX
46.2 s * +5%
Alienware m18 R2
Intel Core i9-14900HX
44.8 s * +8%
Asus ROG Strix Scar 18 G834JYR (2024)
Intel Core i9-14900HX
43.8 s * +10%
Razer Blade 18 RTX 4070
Intel Core i9-13950HX
43.4 s * +11%
Gemiddeld Intel Core i9-14900HX
  (31.4 - 85.1, n=34)
43.4 s * +11%
Alienware m18 R1 AMD
AMD Ryzen 9 7945HX
41.8 s * +14%
MSI Titan GT77 12UHS
Intel Core i9-12900HX
39 s * +20%
Asus ROG Strix Scar 17 G733PYV-LL053X
AMD Ryzen 9 7945HX3D
39 s * +20%
R Benchmark 2.5 / Overall mean
Acer Nitro 17 AN17-41-R9LN
AMD Ryzen 7 7735HS
0.4911 sec * -25%
MSI Pulse 17 B13VGK
Intel Core i7-13700H
0.4809 sec * -22%
Asus TUF Gaming A17 FA707XI-NS94
AMD Ryzen 9 7940HS
0.4278 sec * -9%
MSI Titan GT77 12UHS
Intel Core i9-12900HX
0.4194 sec * -7%
Alienware m18 R1 AMD
AMD Ryzen 9 7945HX
0.4145 sec * -5%
Asus ROG Strix Scar 17 G733PYV-LL053X
AMD Ryzen 9 7945HX3D
0.4127 sec * -5%
Razer Blade 18 RTX 4070
Intel Core i9-13950HX
0.3955 sec * -0%
Asus ROG Strix Scar 18 G834JYR (2024)
Intel Core i9-14900HX
0.3944 sec * -0%
Razer Blade 18 2024 RZ09-0509
Intel Core i9-14900HX
0.3937 sec *
Alienware m18 R1
Intel Core i9-13980HX
0.3931 sec * -0%
MSI Titan 18 HX A14VIG
Intel Core i9-14900HX
0.3919 sec * -0%
Gemiddeld Intel Core i9-14900HX
  (0.3604 - 0.4859, n=34)
0.3845 sec * +2%
Razer Blade 16 2024, RTX 4090
Intel Core i9-14900HX
0.3789 sec * +4%
Alienware m18 R2
Intel Core i9-14900HX
0.3767 sec * +4%
CPU Performance Rating: Percent
Cinebench R23: Multi Core | Single Core
Cinebench R20: CPU (Multi Core) | CPU (Single Core)
Cinebench R15: CPU Multi 64Bit | CPU Single 64Bit
Blender: v2.79 BMW27 CPU
7-Zip 18.03: 7z b 4 | 7z b 4 -mmt1
Geekbench 6.3: Multi-Core | Single-Core
Geekbench 5.5: Multi-Core | Single-Core
HWBOT x265 Benchmark v2.2: 4k Preset
LibreOffice : 20 Documents To PDF
R Benchmark 2.5: Overall mean

* ... kleiner is beter

Cinebench R15 CPU Multi 64Bit
4228 Points
Cinebench R15 OpenGL 64Bit
271 fps
Cinebench R15 Ref. Match 64Bit
99.6 %
Cinebench R15 CPU Single 64Bit
304 Points
Cinebench R20 CPU (Multi Core)
10871 Points
Cinebench R20 CPU (Single Core)
814 Points
Cinebench R23 Single Core
2088 Points
Cinebench R23 Multi Core
27657 Points
Help
Performance Rating
Asus ROG Strix Scar 17 G733PYV-LL053X
AMD Ryzen 9 7945HX3D, NVIDIA GeForce RTX 4090 Laptop GPU
96.8 pt
Alienware m18 R2
Intel Core i9-14900HX, NVIDIA GeForce RTX 4090 Laptop GPU
67.8 pt
MSI Titan 18 HX A14VIG
Intel Core i9-14900HX, NVIDIA GeForce RTX 4090 Laptop GPU
66.8 pt
Razer Blade 16 2024, RTX 4090
Intel Core i9-14900HX, NVIDIA GeForce RTX 4090 Laptop GPU
62.6 pt
Asus ROG Strix Scar 18 G834JYR (2024)
Intel Core i9-14900HX, NVIDIA GeForce RTX 4090 Laptop GPU
62.4 pt
Gemiddeld Intel Core i9-14900HX
 
61.5 pt
Razer Blade 18 2024 RZ09-0509
Intel Core i9-14900HX, NVIDIA GeForce RTX 4090 Laptop GPU
61.1 pt
Gemiddelde van klas Gaming
 
50.9 pt
AIDA64 / FP32 Ray-Trace
Asus ROG Strix Scar 17 G733PYV-LL053X
AMD Ryzen 9 7945HX3D, NVIDIA GeForce RTX 4090 Laptop GPU
53908 KRay/s +115%
MSI Titan 18 HX A14VIG
Intel Core i9-14900HX, NVIDIA GeForce RTX 4090 Laptop GPU
29351 KRay/s +17%
Alienware m18 R2
Intel Core i9-14900HX, NVIDIA GeForce RTX 4090 Laptop GPU
29280 KRay/s +17%
Razer Blade 16 2024, RTX 4090
Intel Core i9-14900HX, NVIDIA GeForce RTX 4090 Laptop GPU
25682 KRay/s +2%
Asus ROG Strix Scar 18 G834JYR (2024)
Intel Core i9-14900HX, NVIDIA GeForce RTX 4090 Laptop GPU
25444 KRay/s +1%
Razer Blade 18 2024 RZ09-0509
Intel Core i9-14900HX, NVIDIA GeForce RTX 4090 Laptop GPU
25098 KRay/s
Gemiddeld Intel Core i9-14900HX
  (13098 - 33474, n=33)
25096 KRay/s 0%
Gemiddelde van klas Gaming
  (4986 - 60169, n=187, laatste 2 jaar)
21640 KRay/s -14%
AIDA64 / FPU Julia
Asus ROG Strix Scar 17 G733PYV-LL053X
AMD Ryzen 9 7945HX3D, NVIDIA GeForce RTX 4090 Laptop GPU
222115 Points +73%
MSI Titan 18 HX A14VIG
Intel Core i9-14900HX, NVIDIA GeForce RTX 4090 Laptop GPU
148888 Points +16%
Alienware m18 R2
Intel Core i9-14900HX, NVIDIA GeForce RTX 4090 Laptop GPU
142791 Points +11%
Asus ROG Strix Scar 18 G834JYR (2024)
Intel Core i9-14900HX, NVIDIA GeForce RTX 4090 Laptop GPU
128826 Points 0%
Razer Blade 18 2024 RZ09-0509
Intel Core i9-14900HX, NVIDIA GeForce RTX 4090 Laptop GPU
128369 Points
Razer Blade 16 2024, RTX 4090
Intel Core i9-14900HX, NVIDIA GeForce RTX 4090 Laptop GPU
127908 Points 0%
Gemiddeld Intel Core i9-14900HX
  (67573 - 166040, n=33)
125765 Points -2%
Gemiddelde van klas Gaming
  (25360 - 252486, n=187, laatste 2 jaar)
106090 Points -17%
AIDA64 / CPU SHA3
Asus ROG Strix Scar 17 G733PYV-LL053X
AMD Ryzen 9 7945HX3D, NVIDIA GeForce RTX 4090 Laptop GPU
9582 MB/s +56%
MSI Titan 18 HX A14VIG
Intel Core i9-14900HX, NVIDIA GeForce RTX 4090 Laptop GPU
7229 MB/s +17%
Alienware m18 R2
Intel Core i9-14900HX, NVIDIA GeForce RTX 4090 Laptop GPU
7095 MB/s +15%
Gemiddeld Intel Core i9-14900HX
  (3589 - 7979, n=33)
6212 MB/s +1%
Asus ROG Strix Scar 18 G834JYR (2024)
Intel Core i9-14900HX, NVIDIA GeForce RTX 4090 Laptop GPU
6204 MB/s +1%
Razer Blade 16 2024, RTX 4090
Intel Core i9-14900HX, NVIDIA GeForce RTX 4090 Laptop GPU
6188 MB/s 0%
Razer Blade 18 2024 RZ09-0509
Intel Core i9-14900HX, NVIDIA GeForce RTX 4090 Laptop GPU
6159 MB/s
Gemiddelde van klas Gaming
  (1339 - 10389, n=187, laatste 2 jaar)
4852 MB/s -21%
AIDA64 / CPU Queen
Asus ROG Strix Scar 17 G733PYV-LL053X
AMD Ryzen 9 7945HX3D, NVIDIA GeForce RTX 4090 Laptop GPU
181270 Points +33%
MSI Titan 18 HX A14VIG
Intel Core i9-14900HX, NVIDIA GeForce RTX 4090 Laptop GPU
148773 Points +9%
Asus ROG Strix Scar 18 G834JYR (2024)
Intel Core i9-14900HX, NVIDIA GeForce RTX 4090 Laptop GPU
141681 Points +4%
Alienware m18 R2
Intel Core i9-14900HX, NVIDIA GeForce RTX 4090 Laptop GPU
139323 Points +2%
Gemiddeld Intel Core i9-14900HX
  (118405 - 148966, n=33)
138709 Points +2%
Razer Blade 16 2024, RTX 4090
Intel Core i9-14900HX, NVIDIA GeForce RTX 4090 Laptop GPU
138473 Points +1%
Razer Blade 18 2024 RZ09-0509
Intel Core i9-14900HX, NVIDIA GeForce RTX 4090 Laptop GPU
136621 Points
Gemiddelde van klas Gaming
  (50699 - 200651, n=187, laatste 2 jaar)
116237 Points -15%
AIDA64 / FPU SinJulia
Asus ROG Strix Scar 17 G733PYV-LL053X
AMD Ryzen 9 7945HX3D, NVIDIA GeForce RTX 4090 Laptop GPU
29487 Points +90%
MSI Titan 18 HX A14VIG
Intel Core i9-14900HX, NVIDIA GeForce RTX 4090 Laptop GPU
18256 Points +18%
Alienware m18 R2
Intel Core i9-14900HX, NVIDIA GeForce RTX 4090 Laptop GPU
16279 Points +5%
Asus ROG Strix Scar 18 G834JYR (2024)
Intel Core i9-14900HX, NVIDIA GeForce RTX 4090 Laptop GPU
16121 Points +4%
Razer Blade 16 2024, RTX 4090
Intel Core i9-14900HX, NVIDIA GeForce RTX 4090 Laptop GPU
15857 Points +2%
Razer Blade 18 2024 RZ09-0509
Intel Core i9-14900HX, NVIDIA GeForce RTX 4090 Laptop GPU
15500 Points
Gemiddeld Intel Core i9-14900HX
  (10475 - 18517, n=33)
15369 Points -1%
Gemiddelde van klas Gaming
  (4800 - 32988, n=187, laatste 2 jaar)
13175 Points -15%
AIDA64 / FPU Mandel
Asus ROG Strix Scar 17 G733PYV-LL053X
AMD Ryzen 9 7945HX3D, NVIDIA GeForce RTX 4090 Laptop GPU
118813 Points +89%
Alienware m18 R2
Intel Core i9-14900HX, NVIDIA GeForce RTX 4090 Laptop GPU
72594 Points +15%
MSI Titan 18 HX A14VIG
Intel Core i9-14900HX, NVIDIA GeForce RTX 4090 Laptop GPU
72355 Points +15%
Razer Blade 16 2024, RTX 4090
Intel Core i9-14900HX, NVIDIA GeForce RTX 4090 Laptop GPU
64134 Points +2%
Asus ROG Strix Scar 18 G834JYR (2024)
Intel Core i9-14900HX, NVIDIA GeForce RTX 4090 Laptop GPU
63748 Points +1%
Razer Blade 18 2024 RZ09-0509
Intel Core i9-14900HX, NVIDIA GeForce RTX 4090 Laptop GPU
62867 Points
Gemiddeld Intel Core i9-14900HX
  (32543 - 83662, n=33)
61872 Points -2%
Gemiddelde van klas Gaming
  (12321 - 134044, n=187, laatste 2 jaar)
53471 Points -15%
AIDA64 / CPU AES
Asus ROG Strix Scar 17 G733PYV-LL053X
AMD Ryzen 9 7945HX3D, NVIDIA GeForce RTX 4090 Laptop GPU
328679 MB/s +179%
MSI Titan 18 HX A14VIG
Intel Core i9-14900HX, NVIDIA GeForce RTX 4090 Laptop GPU
138830 MB/s +18%
Gemiddeld Intel Core i9-14900HX
  (86964 - 241777, n=33)
137399 MB/s +17%
Alienware m18 R2
Intel Core i9-14900HX, NVIDIA GeForce RTX 4090 Laptop GPU
134675 MB/s +14%
Razer Blade 16 2024, RTX 4090
Intel Core i9-14900HX, NVIDIA GeForce RTX 4090 Laptop GPU
122937 MB/s +4%
Asus ROG Strix Scar 18 G834JYR (2024)
Intel Core i9-14900HX, NVIDIA GeForce RTX 4090 Laptop GPU
122250 MB/s +4%
Razer Blade 18 2024 RZ09-0509
Intel Core i9-14900HX, NVIDIA GeForce RTX 4090 Laptop GPU
117887 MB/s
Gemiddelde van klas Gaming
  (19065 - 328679, n=187, laatste 2 jaar)
109176 MB/s -7%
AIDA64 / CPU ZLib
MSI Titan 18 HX A14VIG
Intel Core i9-14900HX, NVIDIA GeForce RTX 4090 Laptop GPU
2149 MB/s +20%
Alienware m18 R2
Intel Core i9-14900HX, NVIDIA GeForce RTX 4090 Laptop GPU
2053 MB/s +14%
Asus ROG Strix Scar 17 G733PYV-LL053X
AMD Ryzen 9 7945HX3D, NVIDIA GeForce RTX 4090 Laptop GPU
2043 MB/s +14%
Razer Blade 16 2024, RTX 4090
Intel Core i9-14900HX, NVIDIA GeForce RTX 4090 Laptop GPU
1863 MB/s +4%
Gemiddeld Intel Core i9-14900HX
  (1054 - 2292, n=33)
1815 MB/s +1%
Razer Blade 18 2024 RZ09-0509
Intel Core i9-14900HX, NVIDIA GeForce RTX 4090 Laptop GPU
1794 MB/s
Asus ROG Strix Scar 18 G834JYR (2024)
Intel Core i9-14900HX, NVIDIA GeForce RTX 4090 Laptop GPU
1789 MB/s 0%
Gemiddelde van klas Gaming
  (373 - 2409, n=187, laatste 2 jaar)
1349 MB/s -25%
AIDA64 / FP64 Ray-Trace
Asus ROG Strix Scar 17 G733PYV-LL053X
AMD Ryzen 9 7945HX3D, NVIDIA GeForce RTX 4090 Laptop GPU
29140 KRay/s +113%
Alienware m18 R2
Intel Core i9-14900HX, NVIDIA GeForce RTX 4090 Laptop GPU
16128 KRay/s +18%
MSI Titan 18 HX A14VIG
Intel Core i9-14900HX, NVIDIA GeForce RTX 4090 Laptop GPU
16104 KRay/s +18%
Razer Blade 16 2024, RTX 4090
Intel Core i9-14900HX, NVIDIA GeForce RTX 4090 Laptop GPU
13993 KRay/s +2%
Razer Blade 18 2024 RZ09-0509
Intel Core i9-14900HX, NVIDIA GeForce RTX 4090 Laptop GPU
13680 KRay/s
Asus ROG Strix Scar 18 G834JYR (2024)
Intel Core i9-14900HX, NVIDIA GeForce RTX 4090 Laptop GPU
13608 KRay/s -1%
Gemiddeld Intel Core i9-14900HX
  (6809 - 18349, n=33)
13525 KRay/s -1%
Gemiddelde van klas Gaming
  (2540 - 31796, n=187, laatste 2 jaar)
11654 KRay/s -15%
AIDA64 / CPU PhotoWorxx
Alienware m18 R2
Intel Core i9-14900HX, NVIDIA GeForce RTX 4090 Laptop GPU
49716 MPixel/s +5%
Asus ROG Strix Scar 18 G834JYR (2024)
Intel Core i9-14900HX, NVIDIA GeForce RTX 4090 Laptop GPU
49710 MPixel/s +5%
Razer Blade 16 2024, RTX 4090
Intel Core i9-14900HX, NVIDIA GeForce RTX 4090 Laptop GPU
49616 MPixel/s +5%
Razer Blade 18 2024 RZ09-0509
Intel Core i9-14900HX, NVIDIA GeForce RTX 4090 Laptop GPU
47472 MPixel/s
Gemiddeld Intel Core i9-14900HX
  (23903 - 54702, n=33)
46637 MPixel/s -2%
Gemiddelde van klas Gaming
  (10805 - 60161, n=188, laatste 2 jaar)
39919 MPixel/s -16%
Asus ROG Strix Scar 17 G733PYV-LL053X
AMD Ryzen 9 7945HX3D, NVIDIA GeForce RTX 4090 Laptop GPU
36406 MPixel/s -23%
MSI Titan 18 HX A14VIG
Intel Core i9-14900HX, NVIDIA GeForce RTX 4090 Laptop GPU
33960 MPixel/s -28%

Stresstest

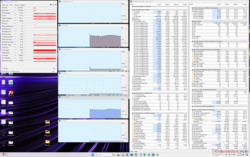
Systeem inactief
Systeem inactief

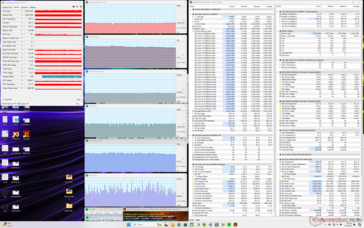
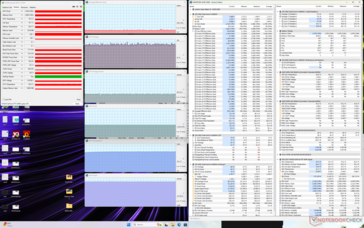
Het CPU-vermogen dat wordt opgenomen tijdens het uitvoeren van Prime95 zou zich stabiliseren rond 117 W en zeer dicht in de buurt komen van wat we registreerden op de Blade 18 van vorig jaar, 114 W. In combinatie met hun bijna identieke prestatienummers zoals vermeld in de sectie hierboven, bevestigt dit nog eens het feit dat de nieuwere Raptor Lake-HX refresh serie weinig tot geen voordelen biedt ten opzichte van de oudere Core i9-13950HX.

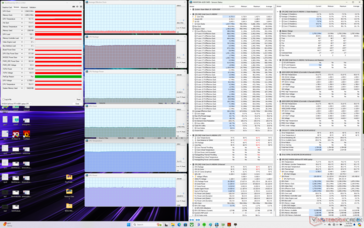
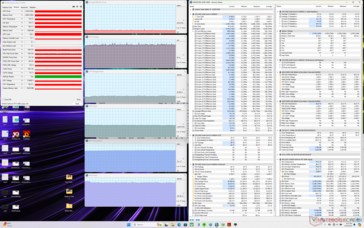
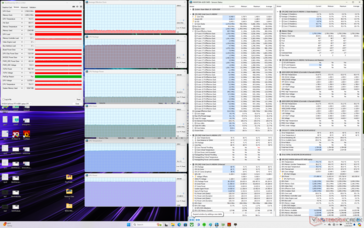
Het uitvoeren van Witcher 3 om typische gamingbelastingen weer te geven, laat geen grote prestatieverschillen zien tussen Max ventilator aan of Max ventilator uit, aangezien de stroomopname van de GPU-kaart bijna gelijk zou blijven op een constante 172 W. Overschakelen naar de Turbo-modus verlaagt de stroomopname van de GPU met slechts een paar watt, zodat dit in de praktijk niet te onderscheiden is. CPU- en GPU-temperaturen stabiliseren zich op respectievelijk 80 C en 74 C, vergeleken met 87 C en 64 C op de veel zwaardere en iets snellere Alienware m18 R2.

Prime95 stress (aangepast profiel, CPU Boost, GPU hoog, max ventilator aan)
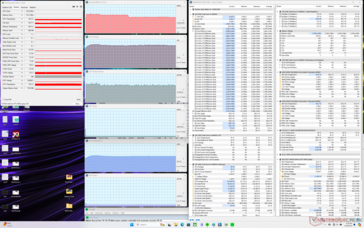
Prime95+FurMark stress (aangepast profiel, CPU Boost, GPU hoog, Max ventilator aan)
Witcher 3 stress (Gebalanceerd profiel)
Witcher 3 stress (Turbo profiel)
Witcher 3 stress (aangepast profiel, CPU Boost, GPU High, max ventilator uit)
Witcher 3 stress (aangepast profiel, CPU Boost, GPU High, max ventilator aan)
Gemiddelde effectieve CPU-klok (GHz) GPU-klok (MHz) Gemiddelde CPU-temperatuur (°C) Gemiddelde GPU-temperatuur (°C) Stroomverbruik GPU-board
Systeem inactief -- -- 54 44 --
Prime95 Stress 2.8 -- 78 54 --
Prime95 + FurMark Stress 1.8 1515 - 2340 70 62 42 - 181
Witcher 3 Belasting (aangepaste modus met maximaal ventilator aan) ~0.6 2145 81 70 172
Witcher 3 Belasting (aangepaste modus met max. ventilator uit) ~0.5 2160 80 74 172
Witcher 3 Belasting (Turbomodus) ~0.5 2100 80 74 165
Witcher 3 Stress (evenwichtige modus) ~0.4 1740 79 71 127

Systeemprestaties

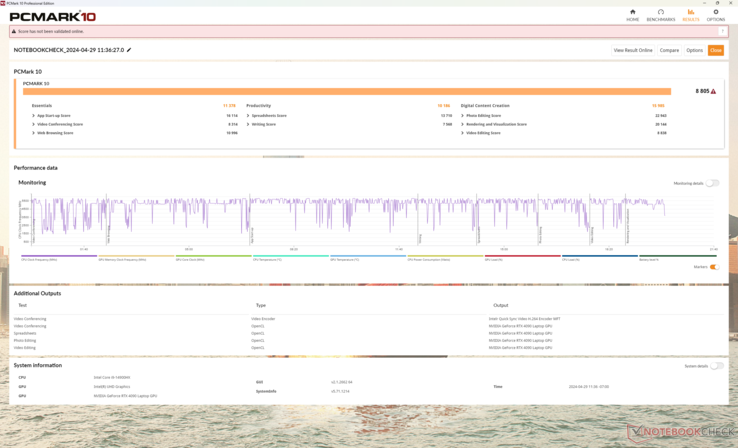
PCMark-scores zijn vergelijkbaar met andere gaming laptops met vergelijkbare Raptor Lake-HX CPU's en GeForce RTX 4090 GPU's, inclusief systemen met de oudere Core i9-13900HX. De RAM-snelheid is niet veranderd ten opzichte van het model 2023.

We kwamen een paar bugs tegen toen we het systeem in de slaapstand zetten. Het systeem bleef erg warm lopen in de slaapstand als het op de dGPU-modus was ingesteld. Als het systeem in de Optimus-modus stond, leek het alsof het systeem normaal in slaapstand ging. Het scherm bevroor soms ook gedurende enkele seconden bij het ontwaken uit de slaapstand.

Ondertussen zijn de G-Sync problemen die we ondervonden op het 2023 model niet aanwezig op onze 2024.

PCMark 10 Standaard
PCMark 10 Standaard
PCMark 10 / Score
Alienware m18 R2
NVIDIA GeForce RTX 4090 Laptop GPU, i9-14900HX, SK Hynix PC811 HFS002TEM9X152N
9234 Points +5%
Asus ROG Strix Scar 17 G733PYV-LL053X
NVIDIA GeForce RTX 4090 Laptop GPU, R9 7945HX3D, SK hynix PC801 HFS001TEJ9X101N
9117 Points +4%
MSI Titan 18 HX A14VIG
NVIDIA GeForce RTX 4090 Laptop GPU, i9-14900HX, 2x Samsung PM9A1a MZVL22T0HDLB (RAID 0)
8968 Points +2%
Razer Blade 18 2024 RZ09-0509
NVIDIA GeForce RTX 4090 Laptop GPU, i9-14900HX
8805 Points
Asus ROG Strix Scar 18 G834JYR (2024)
NVIDIA GeForce RTX 4090 Laptop GPU, i9-14900HX, Samsung PM9A1a MZVL22T0HDLB
8801 Points 0%
Gemiddeld Intel Core i9-14900HX, NVIDIA GeForce RTX 4090 Laptop GPU
  (8230 - 9234, n=13)
8674 Points -1%
Razer Blade 16 2024, RTX 4090
NVIDIA GeForce RTX 4090 Laptop GPU, i9-14900HX, Samsung PM9A1 MZVL22T0HBLB
8401 Points -5%
PCMark 10 / Essentials
MSI Titan 18 HX A14VIG
NVIDIA GeForce RTX 4090 Laptop GPU, i9-14900HX, 2x Samsung PM9A1a MZVL22T0HDLB (RAID 0)
11628 Points +2%
Asus ROG Strix Scar 17 G733PYV-LL053X
NVIDIA GeForce RTX 4090 Laptop GPU, R9 7945HX3D, SK hynix PC801 HFS001TEJ9X101N
11561 Points +2%
Alienware m18 R2
NVIDIA GeForce RTX 4090 Laptop GPU, i9-14900HX, SK Hynix PC811 HFS002TEM9X152N
11415 Points 0%
Asus ROG Strix Scar 18 G834JYR (2024)
NVIDIA GeForce RTX 4090 Laptop GPU, i9-14900HX, Samsung PM9A1a MZVL22T0HDLB
11394 Points 0%
Razer Blade 18 2024 RZ09-0509
NVIDIA GeForce RTX 4090 Laptop GPU, i9-14900HX
11378 Points
Gemiddeld Intel Core i9-14900HX, NVIDIA GeForce RTX 4090 Laptop GPU
  (10778 - 11628, n=13)
11125 Points -2%
Razer Blade 16 2024, RTX 4090
NVIDIA GeForce RTX 4090 Laptop GPU, i9-14900HX, Samsung PM9A1 MZVL22T0HBLB
10915 Points -4%
PCMark 10 / Productivity
Alienware m18 R2
NVIDIA GeForce RTX 4090 Laptop GPU, i9-14900HX, SK Hynix PC811 HFS002TEM9X152N
11415 Points +12%
Razer Blade 16 2024, RTX 4090
NVIDIA GeForce RTX 4090 Laptop GPU, i9-14900HX, Samsung PM9A1 MZVL22T0HBLB
11150 Points +9%
Asus ROG Strix Scar 17 G733PYV-LL053X
NVIDIA GeForce RTX 4090 Laptop GPU, R9 7945HX3D, SK hynix PC801 HFS001TEJ9X101N
10881 Points +7%
Gemiddeld Intel Core i9-14900HX, NVIDIA GeForce RTX 4090 Laptop GPU
  (9458 - 11759, n=13)
10610 Points +4%
Asus ROG Strix Scar 18 G834JYR (2024)
NVIDIA GeForce RTX 4090 Laptop GPU, i9-14900HX, Samsung PM9A1a MZVL22T0HDLB
10528 Points +3%
MSI Titan 18 HX A14VIG
NVIDIA GeForce RTX 4090 Laptop GPU, i9-14900HX, 2x Samsung PM9A1a MZVL22T0HDLB (RAID 0)
10225 Points 0%
Razer Blade 18 2024 RZ09-0509
NVIDIA GeForce RTX 4090 Laptop GPU, i9-14900HX
10186 Points
PCMark 10 / Digital Content Creation
MSI Titan 18 HX A14VIG
NVIDIA GeForce RTX 4090 Laptop GPU, i9-14900HX, 2x Samsung PM9A1a MZVL22T0HDLB (RAID 0)
16462 Points +3%
Alienware m18 R2
NVIDIA GeForce RTX 4090 Laptop GPU, i9-14900HX, SK Hynix PC811 HFS002TEM9X152N
16398 Points +3%
Asus ROG Strix Scar 17 G733PYV-LL053X
NVIDIA GeForce RTX 4090 Laptop GPU, R9 7945HX3D, SK hynix PC801 HFS001TEJ9X101N
16348 Points +2%
Razer Blade 18 2024 RZ09-0509
NVIDIA GeForce RTX 4090 Laptop GPU, i9-14900HX
15985 Points
Asus ROG Strix Scar 18 G834JYR (2024)
NVIDIA GeForce RTX 4090 Laptop GPU, i9-14900HX, Samsung PM9A1a MZVL22T0HDLB
15421 Points -4%
Gemiddeld Intel Core i9-14900HX, NVIDIA GeForce RTX 4090 Laptop GPU
  (13219 - 16462, n=13)
15042 Points -6%
Razer Blade 16 2024, RTX 4090
NVIDIA GeForce RTX 4090 Laptop GPU, i9-14900HX, Samsung PM9A1 MZVL22T0HBLB
13219 Points -17%
CrossMark / Overall
Asus ROG Strix Scar 18 G834JYR (2024)
NVIDIA GeForce RTX 4090 Laptop GPU, i9-14900HX, Samsung PM9A1a MZVL22T0HDLB
2208 Points +8%
Razer Blade 16 2024, RTX 4090
NVIDIA GeForce RTX 4090 Laptop GPU, i9-14900HX, Samsung PM9A1 MZVL22T0HBLB
2149 Points +5%
Gemiddeld Intel Core i9-14900HX, NVIDIA GeForce RTX 4090 Laptop GPU
  (1877 - 2344, n=10)
2119 Points +3%
Asus ROG Strix Scar 17 G733PYV-LL053X
NVIDIA GeForce RTX 4090 Laptop GPU, R9 7945HX3D, SK hynix PC801 HFS001TEJ9X101N
2086 Points +2%
Alienware m18 R2
NVIDIA GeForce RTX 4090 Laptop GPU, i9-14900HX, SK Hynix PC811 HFS002TEM9X152N
2073 Points +1%
Razer Blade 18 2024 RZ09-0509
NVIDIA GeForce RTX 4090 Laptop GPU, i9-14900HX
2048 Points
MSI Titan 18 HX A14VIG
NVIDIA GeForce RTX 4090 Laptop GPU, i9-14900HX, 2x Samsung PM9A1a MZVL22T0HDLB (RAID 0)
1877 Points -8%
CrossMark / Productivity
Asus ROG Strix Scar 18 G834JYR (2024)
NVIDIA GeForce RTX 4090 Laptop GPU, i9-14900HX, Samsung PM9A1a MZVL22T0HDLB
2055 Points +8%
Razer Blade 16 2024, RTX 4090
NVIDIA GeForce RTX 4090 Laptop GPU, i9-14900HX, Samsung PM9A1 MZVL22T0HBLB
2007 Points +6%
Gemiddeld Intel Core i9-14900HX, NVIDIA GeForce RTX 4090 Laptop GPU
  (1738 - 2162, n=10)
1968 Points +3%
Asus ROG Strix Scar 17 G733PYV-LL053X
NVIDIA GeForce RTX 4090 Laptop GPU, R9 7945HX3D, SK hynix PC801 HFS001TEJ9X101N
1948 Points +2%
Razer Blade 18 2024 RZ09-0509
NVIDIA GeForce RTX 4090 Laptop GPU, i9-14900HX
1902 Points
Alienware m18 R2
NVIDIA GeForce RTX 4090 Laptop GPU, i9-14900HX, SK Hynix PC811 HFS002TEM9X152N
1881 Points -1%
MSI Titan 18 HX A14VIG
NVIDIA GeForce RTX 4090 Laptop GPU, i9-14900HX, 2x Samsung PM9A1a MZVL22T0HDLB (RAID 0)
1738 Points -9%
CrossMark / Creativity
Asus ROG Strix Scar 18 G834JYR (2024)
NVIDIA GeForce RTX 4090 Laptop GPU, i9-14900HX, Samsung PM9A1a MZVL22T0HDLB
2478 Points +7%
Razer Blade 16 2024, RTX 4090
NVIDIA GeForce RTX 4090 Laptop GPU, i9-14900HX, Samsung PM9A1 MZVL22T0HBLB
2418 Points +4%
Asus ROG Strix Scar 17 G733PYV-LL053X
NVIDIA GeForce RTX 4090 Laptop GPU, R9 7945HX3D, SK hynix PC801 HFS001TEJ9X101N
2415 Points +4%
Alienware m18 R2
NVIDIA GeForce RTX 4090 Laptop GPU, i9-14900HX, SK Hynix PC811 HFS002TEM9X152N
2393 Points +3%
Gemiddeld Intel Core i9-14900HX, NVIDIA GeForce RTX 4090 Laptop GPU
  (2195 - 2660, n=10)
2387 Points +3%
Razer Blade 18 2024 RZ09-0509
NVIDIA GeForce RTX 4090 Laptop GPU, i9-14900HX
2316 Points
MSI Titan 18 HX A14VIG
NVIDIA GeForce RTX 4090 Laptop GPU, i9-14900HX, 2x Samsung PM9A1a MZVL22T0HDLB (RAID 0)
2195 Points -5%
CrossMark / Responsiveness
Asus ROG Strix Scar 18 G834JYR (2024)
NVIDIA GeForce RTX 4090 Laptop GPU, i9-14900HX, Samsung PM9A1a MZVL22T0HDLB
1944 Points +10%
Gemiddeld Intel Core i9-14900HX, NVIDIA GeForce RTX 4090 Laptop GPU
  (1478 - 2327, n=10)
1862 Points +5%
Razer Blade 16 2024, RTX 4090
NVIDIA GeForce RTX 4090 Laptop GPU, i9-14900HX, Samsung PM9A1 MZVL22T0HBLB
1851 Points +5%
Alienware m18 R2
NVIDIA GeForce RTX 4090 Laptop GPU, i9-14900HX, SK Hynix PC811 HFS002TEM9X152N
1806 Points +2%
Razer Blade 18 2024 RZ09-0509
NVIDIA GeForce RTX 4090 Laptop GPU, i9-14900HX
1765 Points
Asus ROG Strix Scar 17 G733PYV-LL053X
NVIDIA GeForce RTX 4090 Laptop GPU, R9 7945HX3D, SK hynix PC801 HFS001TEJ9X101N
1649 Points -7%
MSI Titan 18 HX A14VIG
NVIDIA GeForce RTX 4090 Laptop GPU, i9-14900HX, 2x Samsung PM9A1a MZVL22T0HDLB (RAID 0)
1478 Points -16%
WebXPRT 3 / Overall
Asus ROG Strix Scar 17 G733PYV-LL053X
NVIDIA GeForce RTX 4090 Laptop GPU, R9 7945HX3D, SK hynix PC801 HFS001TEJ9X101N
480 Points +42%
Razer Blade 18 2024 RZ09-0509
NVIDIA GeForce RTX 4090 Laptop GPU, i9-14900HX
339 Points
Razer Blade 16 2024, RTX 4090
NVIDIA GeForce RTX 4090 Laptop GPU, i9-14900HX, Samsung PM9A1 MZVL22T0HBLB
330 Points -3%
MSI Titan 18 HX A14VIG
NVIDIA GeForce RTX 4090 Laptop GPU, i9-14900HX, 2x Samsung PM9A1a MZVL22T0HDLB (RAID 0)
327 Points -4%
Alienware m18 R2
NVIDIA GeForce RTX 4090 Laptop GPU, i9-14900HX, SK Hynix PC811 HFS002TEM9X152N
326 Points -4%
Gemiddeld Intel Core i9-14900HX, NVIDIA GeForce RTX 4090 Laptop GPU
  (279 - 339, n=10)
323 Points -5%
Asus ROG Strix Scar 18 G834JYR (2024)
NVIDIA GeForce RTX 4090 Laptop GPU, i9-14900HX, Samsung PM9A1a MZVL22T0HDLB
322 Points -5%
WebXPRT 4 / Overall
Asus ROG Strix Scar 17 G733PYV-LL053X
NVIDIA GeForce RTX 4090 Laptop GPU, R9 7945HX3D, SK hynix PC801 HFS001TEJ9X101N
328 Points
Alienware m18 R2
NVIDIA GeForce RTX 4090 Laptop GPU, i9-14900HX, SK Hynix PC811 HFS002TEM9X152N
309 Points
Asus ROG Strix Scar 18 G834JYR (2024)
NVIDIA GeForce RTX 4090 Laptop GPU, i9-14900HX, Samsung PM9A1a MZVL22T0HDLB
304 Points
Gemiddeld Intel Core i9-14900HX, NVIDIA GeForce RTX 4090 Laptop GPU
  (246 - 309, n=8)
291 Points
MSI Titan 18 HX A14VIG
NVIDIA GeForce RTX 4090 Laptop GPU, i9-14900HX, 2x Samsung PM9A1a MZVL22T0HDLB (RAID 0)
287 Points
Mozilla Kraken 1.1 / Total
Gemiddeld Intel Core i9-14900HX, NVIDIA GeForce RTX 4090 Laptop GPU
  (428 - 535, n=11)
456 ms * -2%
MSI Titan 18 HX A14VIG
NVIDIA GeForce RTX 4090 Laptop GPU, i9-14900HX, 2x Samsung PM9A1a MZVL22T0HDLB (RAID 0)
452 ms * -1%
Razer Blade 16 2024, RTX 4090
NVIDIA GeForce RTX 4090 Laptop GPU, i9-14900HX, Samsung PM9A1 MZVL22T0HBLB
450 ms * -0%
Asus ROG Strix Scar 18 G834JYR (2024)
NVIDIA GeForce RTX 4090 Laptop GPU, i9-14900HX, Samsung PM9A1a MZVL22T0HDLB
449 ms * -0%
Razer Blade 18 2024 RZ09-0509
NVIDIA GeForce RTX 4090 Laptop GPU, i9-14900HX
449 ms *
Alienware m18 R2
NVIDIA GeForce RTX 4090 Laptop GPU, i9-14900HX, SK Hynix PC811 HFS002TEM9X152N
430 ms * +4%
Asus ROG Strix Scar 17 G733PYV-LL053X
NVIDIA GeForce RTX 4090 Laptop GPU, R9 7945HX3D, SK hynix PC801 HFS001TEJ9X101N
421.3 ms * +6%

* ... kleiner is beter

PCMark 10 Score
8805 punten
Help
AIDA64 / Memory Copy
Asus ROG Strix Scar 18 G834JYR (2024)
Intel Core i9-14900HX, NVIDIA GeForce RTX 4090 Laptop GPU
83392 MB/s +9%
Alienware m18 R2
Intel Core i9-14900HX, NVIDIA GeForce RTX 4090 Laptop GPU
79243 MB/s +4%
Razer Blade 16 2024, RTX 4090
Intel Core i9-14900HX, NVIDIA GeForce RTX 4090 Laptop GPU
78799 MB/s +3%
Razer Blade 18 RTX 4070
Intel Core i9-13950HX, NVIDIA GeForce RTX 4070 Laptop GPU
77096 MB/s +1%
Razer Blade 18 2024 RZ09-0509
Intel Core i9-14900HX, NVIDIA GeForce RTX 4090 Laptop GPU
76268 MB/s
Gemiddeld Intel Core i9-14900HX
  (38028 - 83392, n=33)
74739 MB/s -2%
MSI Titan 18 HX A14VIG
Intel Core i9-14900HX, NVIDIA GeForce RTX 4090 Laptop GPU
56992 MB/s -25%
Asus ROG Strix Scar 17 G733PYV-LL053X
AMD Ryzen 9 7945HX3D, NVIDIA GeForce RTX 4090 Laptop GPU
50335 MB/s -34%
AIDA64 / Memory Read
Asus ROG Strix Scar 18 G834JYR (2024)
Intel Core i9-14900HX, NVIDIA GeForce RTX 4090 Laptop GPU
86788 MB/s +5%
Razer Blade 16 2024, RTX 4090
Intel Core i9-14900HX, NVIDIA GeForce RTX 4090 Laptop GPU
86387 MB/s +4%
Razer Blade 18 RTX 4070
Intel Core i9-13950HX, NVIDIA GeForce RTX 4070 Laptop GPU
86207 MB/s +4%
Alienware m18 R2
Intel Core i9-14900HX, NVIDIA GeForce RTX 4090 Laptop GPU
85791 MB/s +3%
Razer Blade 18 2024 RZ09-0509
Intel Core i9-14900HX, NVIDIA GeForce RTX 4090 Laptop GPU
82992 MB/s
Gemiddeld Intel Core i9-14900HX
  (43306 - 87568, n=33)
80919 MB/s -2%
Asus ROG Strix Scar 17 G733PYV-LL053X
AMD Ryzen 9 7945HX3D, NVIDIA GeForce RTX 4090 Laptop GPU
59921 MB/s -28%
MSI Titan 18 HX A14VIG
Intel Core i9-14900HX, NVIDIA GeForce RTX 4090 Laptop GPU
54443 MB/s -34%
AIDA64 / Memory Write
Asus ROG Strix Scar 18 G834JYR (2024)
Intel Core i9-14900HX, NVIDIA GeForce RTX 4090 Laptop GPU
77534 MB/s +14%
Alienware m18 R2
Intel Core i9-14900HX, NVIDIA GeForce RTX 4090 Laptop GPU
77089 MB/s +14%
Razer Blade 18 RTX 4070
Intel Core i9-13950HX, NVIDIA GeForce RTX 4070 Laptop GPU
75814 MB/s +12%
Razer Blade 16 2024, RTX 4090
Intel Core i9-14900HX, NVIDIA GeForce RTX 4090 Laptop GPU
75421 MB/s +11%
Gemiddeld Intel Core i9-14900HX
  (37146 - 80589, n=33)
71949 MB/s +6%
Razer Blade 18 2024 RZ09-0509
Intel Core i9-14900HX, NVIDIA GeForce RTX 4090 Laptop GPU
67801 MB/s
Asus ROG Strix Scar 17 G733PYV-LL053X
AMD Ryzen 9 7945HX3D, NVIDIA GeForce RTX 4090 Laptop GPU
58774 MB/s -13%
MSI Titan 18 HX A14VIG
Intel Core i9-14900HX, NVIDIA GeForce RTX 4090 Laptop GPU
51387 MB/s -24%
AIDA64 / Memory Latency
MSI Titan 18 HX A14VIG
Intel Core i9-14900HX, NVIDIA GeForce RTX 4090 Laptop GPU
105 ns * -20%
Asus ROG Strix Scar 17 G733PYV-LL053X
AMD Ryzen 9 7945HX3D, NVIDIA GeForce RTX 4090 Laptop GPU
88.6 ns * -1%
Razer Blade 18 2024 RZ09-0509
Intel Core i9-14900HX, NVIDIA GeForce RTX 4090 Laptop GPU
87.6 ns *
Alienware m18 R2
Intel Core i9-14900HX, NVIDIA GeForce RTX 4090 Laptop GPU
86.4 ns * +1%
Gemiddeld Intel Core i9-14900HX
  (76.1 - 105, n=33)
84.8 ns * +3%
Razer Blade 18 RTX 4070
Intel Core i9-13950HX, NVIDIA GeForce RTX 4070 Laptop GPU
84.5 ns * +4%
Razer Blade 16 2024, RTX 4090
Intel Core i9-14900HX, NVIDIA GeForce RTX 4090 Laptop GPU
83.4 ns * +5%
Asus ROG Strix Scar 18 G834JYR (2024)
Intel Core i9-14900HX, NVIDIA GeForce RTX 4090 Laptop GPU
82.8 ns * +5%

* ... kleiner is beter

DPC latentie

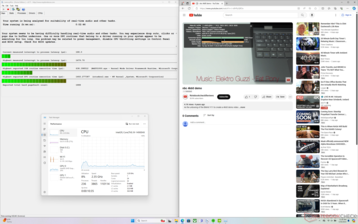
LatencyMon laat slechts kleine DPC-problemen zien bij het openen van meerdere browsertabbladen van onze startpagina. het afspelen van 4K60 video is ook perfect, zonder dropped frames behalve het enkele frame tijdens het maken van de schermafbeelding.

LatencyMon
LatencyMon
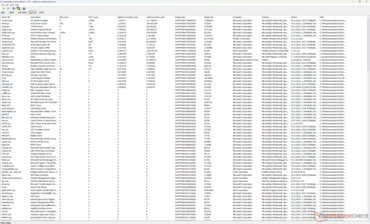
Drivers lijst
Drivers lijst
DPC Latencies / LatencyMon - interrupt to process latency (max), Web, Youtube, Prime95
Alienware m18 R2
NVIDIA GeForce RTX 4090 Laptop GPU, i9-14900HX, SK Hynix PC811 HFS002TEM9X152N
2815.1 μs * -90%
MSI Titan 18 HX A14VIG
NVIDIA GeForce RTX 4090 Laptop GPU, i9-14900HX, 2x Samsung PM9A1a MZVL22T0HDLB (RAID 0)
2384.5 μs * -61%
Razer Blade 18 2024 RZ09-0509
NVIDIA GeForce RTX 4090 Laptop GPU, i9-14900HX
1479.7 μs *
Razer Blade 16 2024, RTX 4090
NVIDIA GeForce RTX 4090 Laptop GPU, i9-14900HX, Samsung PM9A1 MZVL22T0HBLB
1389.7 μs * +6%
Asus ROG Strix Scar 18 G834JYR (2024)
NVIDIA GeForce RTX 4090 Laptop GPU, i9-14900HX, Samsung PM9A1a MZVL22T0HDLB
1117.4 μs * +24%
Asus ROG Strix Scar 17 G733PYV-LL053X
NVIDIA GeForce RTX 4090 Laptop GPU, R9 7945HX3D, SK hynix PC801 HFS001TEJ9X101N
1100.8 μs * +26%

* ... kleiner is beter

Opslagapparaten

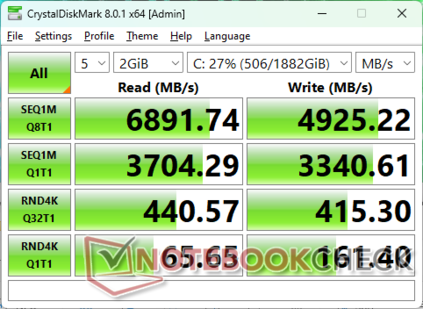
Zowel onze 2023 als 2024 Blade 18 eenheden worden geleverd met Micron CA6 NVMe SSD's, terwijl de meeste andere Blade modellen geleverd worden met Samsung schijven. Lees- en schrijfsnelheden van kleinere 4K blokken kunnen aan de trage kant zijn, maar verder zijn er geen problemen met prestatiebeperking.

PCIe5 SSD-opties zijn waarschijnlijk niet beschikbaar vanwege de kosten en de beperkte voorraad.

AS SSD
AS SSD
CDM 8
CDM 8
CDM 5/6 Read Seq Q32T1: 6905 MB/s
CDM 5/6 Write Seq Q32T1: 4883 MB/s
CDM 5/6 Read 4K Q32T1: 438 MB/s
CDM 5/6 Write 4K Q32T1: 405.9 MB/s
CDM 5 Read Seq: 3709 MB/s
CDM 5 Write Seq: 3438 MB/s
CDM 5/6 Read 4K: 65.54 MB/s
CDM 5/6 Write 4K: 157.3 MB/s
Drive Performance Rating - Percent
Alienware m18 R2
SK Hynix PC811 HFS002TEM9X152N
83.6 pt
Asus ROG Strix Scar 18 G834JYR (2024)
Samsung PM9A1a MZVL22T0HDLB
69.7 pt
Razer Blade 18 RTX 4070
SSSTC CA6-8D1024
66 pt
Razer Blade 16 2024, RTX 4090
Samsung PM9A1 MZVL22T0HBLB
63.2 pt
MSI Titan 18 HX A14VIG
2x Samsung PM9A1a MZVL22T0HDLB (RAID 0)
62.7 pt
Asus ROG Strix Scar 17 G733PYV-LL053X
SK hynix PC801 HFS001TEJ9X101N
50.3 pt
Razer Blade 18 2024 RZ09-0509
 
50.2 pt
DiskSpd
seq read
Alienware m18 R2
SK Hynix PC811 HFS002TEM9X152N
5588 (5540.05min - 5587.65max) MB/s +57%
MSI Titan 18 HX A14VIG
2x Samsung PM9A1a MZVL22T0HDLB (RAID 0)
5424 (5395.57min - 5423.86max) MB/s +52%
Asus ROG Strix Scar 18 G834JYR (2024)
Samsung PM9A1a MZVL22T0HDLB
3908 (3887.48min - 3908.2max) MB/s +10%
Razer Blade 18 RTX 4070
SSSTC CA6-8D1024
3889 (3873.65min - 3888.73max) MB/s +9%
Razer Blade 16 2024, RTX 4090
Samsung PM9A1 MZVL22T0HBLB
3795 (3693.04min - 3794.8max) MB/s +7%
Razer Blade 18 2024 RZ09-0509
 
3560 (3002.28min - 3559.93max) MB/s
Asus ROG Strix Scar 17 G733PYV-LL053X
SK hynix PC801 HFS001TEJ9X101N
2570 (2552.37min - 2570.06max) MB/s -28%
seq write
MSI Titan 18 HX A14VIG
2x Samsung PM9A1a MZVL22T0HDLB (RAID 0)
7291 (7191.64min - 7291.38max) MB/s +117%
Alienware m18 R2
SK Hynix PC811 HFS002TEM9X152N
5153 (5139.7min - 5152.91max) MB/s +53%
Asus ROG Strix Scar 18 G834JYR (2024)
Samsung PM9A1a MZVL22T0HDLB
4335 (4306.29min - 4335.44max) MB/s +29%
Razer Blade 18 RTX 4070
SSSTC CA6-8D1024
3798 (3750.39min - 3798.15max) MB/s +13%
Razer Blade 16 2024, RTX 4090
Samsung PM9A1 MZVL22T0HBLB
3794 (3745.51min - 3793.5max) MB/s +13%
Razer Blade 18 2024 RZ09-0509
 
3367 (3255.82min - 3366.95max) MB/s
Asus ROG Strix Scar 17 G733PYV-LL053X
SK hynix PC801 HFS001TEJ9X101N
1690 (1454.82min - 1690.3max) MB/s -50%
seq q8 t1 read
MSI Titan 18 HX A14VIG
2x Samsung PM9A1a MZVL22T0HDLB (RAID 0)
13588 (10727.3min - 13588.3max) MB/s +100%
Alienware m18 R2
SK Hynix PC811 HFS002TEM9X152N
7110 (6256.85min - 7110.18max) MB/s +5%
Asus ROG Strix Scar 18 G834JYR (2024)
Samsung PM9A1a MZVL22T0HDLB
7084 (6413.06min - 7083.97max) MB/s +4%
Asus ROG Strix Scar 17 G733PYV-LL053X
SK hynix PC801 HFS001TEJ9X101N
6971 (6127.67min - 6971.35max) MB/s +3%
Razer Blade 18 RTX 4070
SSSTC CA6-8D1024
6810 (6260.27min - 6809.87max) MB/s 0%
Razer Blade 18 2024 RZ09-0509
 
6797 (5573.18min - 6797.33max) MB/s
Razer Blade 16 2024, RTX 4090
Samsung PM9A1 MZVL22T0HBLB
6673 (5801.28min - 6672.72max) MB/s -2%
seq q8 t1 write
MSI Titan 18 HX A14VIG
2x Samsung PM9A1a MZVL22T0HDLB (RAID 0)
10571 (10519.3min - 10571.3max) MB/s +116%
Alienware m18 R2
SK Hynix PC811 HFS002TEM9X152N
6779 (6710.47min - 6778.83max) MB/s +38%
Asus ROG Strix Scar 18 G834JYR (2024)
Samsung PM9A1a MZVL22T0HDLB
5255 (5183.65min - 5254.62max) MB/s +7%
Razer Blade 16 2024, RTX 4090
Samsung PM9A1 MZVL22T0HBLB
4936 (4909.47min - 4936.28max) MB/s +1%
Razer Blade 18 2024 RZ09-0509
 
4902 (4309.42min - 4901.73max) MB/s
Razer Blade 18 RTX 4070
SSSTC CA6-8D1024
4426 (4263.58min - 4426.04max) MB/s -10%
Asus ROG Strix Scar 17 G733PYV-LL053X
SK hynix PC801 HFS001TEJ9X101N
2382 (920.86min - 2382.42max) MB/s -51%
4k q1 t1 read
Asus ROG Strix Scar 18 G834JYR (2024)
Samsung PM9A1a MZVL22T0HDLB
80.7 (80.11min - 80.66max) MB/s +31%
Alienware m18 R2
SK Hynix PC811 HFS002TEM9X152N
75.4 (73.49min - 75.43max) MB/s +22%
Razer Blade 18 RTX 4070
SSSTC CA6-8D1024
74.5 (73.46min - 74.52max) MB/s +21%
Razer Blade 16 2024, RTX 4090
Samsung PM9A1 MZVL22T0HBLB
71.4 (66.19min - 71.35max) MB/s +16%
MSI Titan 18 HX A14VIG
2x Samsung PM9A1a MZVL22T0HDLB (RAID 0)
69.6 (68.6min - 69.57max) MB/s +13%
Razer Blade 18 2024 RZ09-0509
 
61.8 (61.2min - 61.81max) MB/s
Asus ROG Strix Scar 17 G733PYV-LL053X
SK hynix PC801 HFS001TEJ9X101N
54.3 (54.23min - 54.34max) MB/s -12%
4k q1 t1 write
Alienware m18 R2
SK Hynix PC811 HFS002TEM9X152N
300 (297.27min - 299.6max) MB/s +83%
Razer Blade 18 RTX 4070
SSSTC CA6-8D1024
280 (267.82min - 279.79max) MB/s +71%
Asus ROG Strix Scar 18 G834JYR (2024)
Samsung PM9A1a MZVL22T0HDLB
230 (219.52min - 229.87max) MB/s +40%
Razer Blade 16 2024, RTX 4090
Samsung PM9A1 MZVL22T0HBLB
205 (202.97min - 204.75max) MB/s +25%
Asus ROG Strix Scar 17 G733PYV-LL053X
SK hynix PC801 HFS001TEJ9X101N
183.8 (182.06min - 183.78max) MB/s +12%
Razer Blade 18 2024 RZ09-0509
 
164 (110.95min - 164max) MB/s
MSI Titan 18 HX A14VIG
2x Samsung PM9A1a MZVL22T0HDLB (RAID 0)
152.1 (149.74min - 152.09max) MB/s -7%
4k q32 t16 read
Alienware m18 R2
SK Hynix PC811 HFS002TEM9X152N
6067 (5596.15min - 6066.73max) MB/s +504%
Asus ROG Strix Scar 18 G834JYR (2024)
Samsung PM9A1a MZVL22T0HDLB
3732 (3273.44min - 3732.1max) MB/s +271%
Razer Blade 16 2024, RTX 4090
Samsung PM9A1 MZVL22T0HBLB
3726 (3704.12min - 3725.6max) MB/s +271%
Razer Blade 18 RTX 4070
SSSTC CA6-8D1024
3203 (3180.36min - 3203.41max) MB/s +219%
MSI Titan 18 HX A14VIG
2x Samsung PM9A1a MZVL22T0HDLB (RAID 0)
1623 (1464.8min - 1623.24max) MB/s +61%
Asus ROG Strix Scar 17 G733PYV-LL053X
SK hynix PC801 HFS001TEJ9X101N
1331 (1250.04min - 1330.81max) MB/s +32%
Razer Blade 18 2024 RZ09-0509
 
1005 (964.75min - 1004.59max) MB/s
4k q32 t16 write
Alienware m18 R2
SK Hynix PC811 HFS002TEM9X152N
4176 (3805.57min - 4175.9max) MB/s +845%
Razer Blade 16 2024, RTX 4090
Samsung PM9A1 MZVL22T0HBLB
3548 (3533.85min - 3548.33max) MB/s +703%
Asus ROG Strix Scar 18 G834JYR (2024)
Samsung PM9A1a MZVL22T0HDLB
2900 MB/s +556%
Razer Blade 18 RTX 4070
SSSTC CA6-8D1024
2209 (1041.25min - 2208.74max) MB/s +400%
MSI Titan 18 HX A14VIG
2x Samsung PM9A1a MZVL22T0HDLB (RAID 0)
1377 (1306.51min - 1377.05max) MB/s +212%
Asus ROG Strix Scar 17 G733PYV-LL053X
SK hynix PC801 HFS001TEJ9X101N
730 (694.74min - 729.67max) MB/s +65%
Razer Blade 18 2024 RZ09-0509
 
442 (336.87min - 441.83max) MB/s
AS SSD
Score Total
Alienware m18 R2
SK Hynix PC811 HFS002TEM9X152N
10655 Points +116%
Asus ROG Strix Scar 18 G834JYR (2024)
Samsung PM9A1a MZVL22T0HDLB
8367 Points +70%
Razer Blade 18 RTX 4070
SSSTC CA6-8D1024
7745 Points +57%
Razer Blade 16 2024, RTX 4090
Samsung PM9A1 MZVL22T0HBLB
7040 Points +43%
Asus ROG Strix Scar 17 G733PYV-LL053X
SK hynix PC801 HFS001TEJ9X101N
6546 Points +33%
MSI Titan 18 HX A14VIG
2x Samsung PM9A1a MZVL22T0HDLB (RAID 0)
5369 Points +9%
Razer Blade 18 2024 RZ09-0509
 
4927 Points
Score Read
Alienware m18 R2
SK Hynix PC811 HFS002TEM9X152N
3753 Points +125%
Razer Blade 18 RTX 4070
SSSTC CA6-8D1024
3490 Points +109%
Asus ROG Strix Scar 18 G834JYR (2024)
Samsung PM9A1a MZVL22T0HDLB
3272 Points +96%
Razer Blade 16 2024, RTX 4090
Samsung PM9A1 MZVL22T0HBLB
2848 Points +71%
MSI Titan 18 HX A14VIG
2x Samsung PM9A1a MZVL22T0HDLB (RAID 0)
2194 Points +32%
Asus ROG Strix Scar 17 G733PYV-LL053X
SK hynix PC801 HFS001TEJ9X101N
1689 Points +1%
Razer Blade 18 2024 RZ09-0509
 
1667 Points
Score Write
Alienware m18 R2
SK Hynix PC811 HFS002TEM9X152N
4993 Points +98%
Asus ROG Strix Scar 17 G733PYV-LL053X
SK hynix PC801 HFS001TEJ9X101N
4073 Points +62%
Asus ROG Strix Scar 18 G834JYR (2024)
Samsung PM9A1a MZVL22T0HDLB
3490 Points +39%
Razer Blade 16 2024, RTX 4090
Samsung PM9A1 MZVL22T0HBLB
2766 Points +10%
Razer Blade 18 RTX 4070
SSSTC CA6-8D1024
2566 Points +2%
Razer Blade 18 2024 RZ09-0509
 
2518 Points
MSI Titan 18 HX A14VIG
2x Samsung PM9A1a MZVL22T0HDLB (RAID 0)
2092 Points -17%
Seq Read
MSI Titan 18 HX A14VIG
2x Samsung PM9A1a MZVL22T0HDLB (RAID 0)
9576.8 MB/s +75%
Alienware m18 R2
SK Hynix PC811 HFS002TEM9X152N
5916.27 MB/s +8%
Razer Blade 18 RTX 4070
SSSTC CA6-8D1024
5770.79 MB/s +5%
Asus ROG Strix Scar 17 G733PYV-LL053X
SK hynix PC801 HFS001TEJ9X101N
5739 MB/s +5%
Asus ROG Strix Scar 18 G834JYR (2024)
Samsung PM9A1a MZVL22T0HDLB
5636.54 MB/s +3%
Razer Blade 18 2024 RZ09-0509
 
5476.6 MB/s
Razer Blade 16 2024, RTX 4090
Samsung PM9A1 MZVL22T0HBLB
4371 MB/s -20%
Seq Write
MSI Titan 18 HX A14VIG
2x Samsung PM9A1a MZVL22T0HDLB (RAID 0)
8685.54 MB/s +190%
Alienware m18 R2
SK Hynix PC811 HFS002TEM9X152N
5929.42 MB/s +98%
Asus ROG Strix Scar 18 G834JYR (2024)
Samsung PM9A1a MZVL22T0HDLB
4294.95 MB/s +43%
Asus ROG Strix Scar 17 G733PYV-LL053X
SK hynix PC801 HFS001TEJ9X101N
3972 MB/s +33%
Razer Blade 18 RTX 4070
SSSTC CA6-8D1024
3951.34 MB/s +32%
Razer Blade 16 2024, RTX 4090
Samsung PM9A1 MZVL22T0HBLB
3791 MB/s +27%
Razer Blade 18 2024 RZ09-0509
 
2995.22 MB/s
4K Read
Asus ROG Strix Scar 18 G834JYR (2024)
Samsung PM9A1a MZVL22T0HDLB
75.56 MB/s +15%
Razer Blade 18 RTX 4070
SSSTC CA6-8D1024
69.72 MB/s +6%
Razer Blade 18 2024 RZ09-0509
 
65.49 MB/s
Alienware m18 R2
SK Hynix PC811 HFS002TEM9X152N
64.97 MB/s -1%
MSI Titan 18 HX A14VIG
2x Samsung PM9A1a MZVL22T0HDLB (RAID 0)
63.69 MB/s -3%
Razer Blade 16 2024, RTX 4090
Samsung PM9A1 MZVL22T0HBLB
61.1 MB/s -7%
Asus ROG Strix Scar 17 G733PYV-LL053X
SK hynix PC801 HFS001TEJ9X101N
56 MB/s -14%
4K Write
Razer Blade 18 RTX 4070
SSSTC CA6-8D1024
241.69 MB/s +10%
Alienware m18 R2
SK Hynix PC811 HFS002TEM9X152N
238.28 MB/s +9%
Razer Blade 18 2024 RZ09-0509
 
219.58 MB/s
Asus ROG Strix Scar 18 G834JYR (2024)
Samsung PM9A1a MZVL22T0HDLB
207.25 MB/s -6%
Asus ROG Strix Scar 17 G733PYV-LL053X
SK hynix PC801 HFS001TEJ9X101N
192.1 MB/s -13%
Razer Blade 16 2024, RTX 4090
Samsung PM9A1 MZVL22T0HBLB
160.6 MB/s -27%
MSI Titan 18 HX A14VIG
2x Samsung PM9A1a MZVL22T0HDLB (RAID 0)
134.66 MB/s -39%
4K-64 Read
Alienware m18 R2
SK Hynix PC811 HFS002TEM9X152N
3096 MB/s +194%
Razer Blade 18 RTX 4070
SSSTC CA6-8D1024
2843.31 MB/s +170%
Asus ROG Strix Scar 18 G834JYR (2024)
Samsung PM9A1a MZVL22T0HDLB
2636.61 MB/s +150%
Razer Blade 16 2024, RTX 4090
Samsung PM9A1 MZVL22T0HBLB
2350 MB/s +123%
MSI Titan 18 HX A14VIG
2x Samsung PM9A1a MZVL22T0HDLB (RAID 0)
1172.14 MB/s +11%
Asus ROG Strix Scar 17 G733PYV-LL053X
SK hynix PC801 HFS001TEJ9X101N
1059 MB/s 0%
Razer Blade 18 2024 RZ09-0509
 
1053.83 MB/s
4K-64 Write
Alienware m18 R2
SK Hynix PC811 HFS002TEM9X152N
4161.9 MB/s +108%
Asus ROG Strix Scar 17 G733PYV-LL053X
SK hynix PC801 HFS001TEJ9X101N
3484 MB/s +74%
Asus ROG Strix Scar 18 G834JYR (2024)
Samsung PM9A1a MZVL22T0HDLB
2866.57 MB/s +43%
Razer Blade 16 2024, RTX 4090
Samsung PM9A1 MZVL22T0HBLB
2226 MB/s +11%
Razer Blade 18 2024 RZ09-0509
 
1998.53 MB/s
Razer Blade 18 RTX 4070
SSSTC CA6-8D1024
1929.02 MB/s -3%
MSI Titan 18 HX A14VIG
2x Samsung PM9A1a MZVL22T0HDLB (RAID 0)
1088.59 MB/s -46%
Access Time Read
Asus ROG Strix Scar 17 G733PYV-LL053X
SK hynix PC801 HFS001TEJ9X101N
0.062 ms * -148%
Asus ROG Strix Scar 18 G834JYR (2024)
Samsung PM9A1a MZVL22T0HDLB
0.046 ms * -84%
MSI Titan 18 HX A14VIG
2x Samsung PM9A1a MZVL22T0HDLB (RAID 0)
0.036 ms * -44%
Razer Blade 16 2024, RTX 4090
Samsung PM9A1 MZVL22T0HBLB
0.033 ms * -32%
Alienware m18 R2
SK Hynix PC811 HFS002TEM9X152N
0.029 ms * -16%
Razer Blade 18 RTX 4070
SSSTC CA6-8D1024
0.026 ms * -4%
Razer Blade 18 2024 RZ09-0509
 
0.025 ms *
Access Time Write
MSI Titan 18 HX A14VIG
2x Samsung PM9A1a MZVL22T0HDLB (RAID 0)
0.091 ms * -60%
Razer Blade 18 2024 RZ09-0509
 
0.057 ms *
Razer Blade 18 RTX 4070
SSSTC CA6-8D1024
0.056 ms * +2%
Alienware m18 R2
SK Hynix PC811 HFS002TEM9X152N
0.055 ms * +4%
Razer Blade 16 2024, RTX 4090
Samsung PM9A1 MZVL22T0HBLB
0.025 ms * +56%
Asus ROG Strix Scar 18 G834JYR (2024)
Samsung PM9A1a MZVL22T0HDLB
0.022 ms * +61%
Asus ROG Strix Scar 17 G733PYV-LL053X
SK hynix PC801 HFS001TEJ9X101N
0.019 ms * +67%

* ... kleiner is beter

Disk Throttling: DiskSpd Read Loop, Queue Depth 8

035070010501400175021002450280031503500385042004550490052505600595063006650Tooltip
Razer Blade 18 2024 RZ09-0509  ; diskspd 2.0.17 f: Ø6880 (5682.4-6917.67)
Razer Blade 18 RTX 4070 SSSTC CA6-8D1024: Ø6845 (5855.67-6875.3)

Gamingprestaties - RTX 4090 voor het tweede jaar op rij

Ruwe grafische prestaties van de mobiele GeForce RTX 4090 is in wezen identiek aan de Blade 16 die ook 175 W TGP graphics heeft. De Blade 18 zal games dus niet merkbaar sneller uitvoeren dan zijn kleinere tegenhanger. Downgraden naar de RTX 4080 of 4070 configuratie zal naar verwachting de prestaties met respectievelijk ongeveer 10 procent en 35 tot 40 procent beïnvloeden. De MSI Titan 18 HX kan dezelfde GPU iets sneller uitvoeren dan de Razer, maar hij is ook aanzienlijk groter en zwaarder.

Houd er rekening mee dat de Max ventilatorstand weinig tot geen invloed heeft op de systeemprestaties, zoals blijkt uit onze onderstaande tabel met Fire Strike resultaten. Het inschakelen van de Max ventilatormodus is dus niet nodig om het maximale uit de GPU te halen. Zelfs de Turbo modus lijkt geen significante invloed te hebben op de prestaties tijdens het gamen.

EnergieprofielGrafische ScoreFysica ScoreGecombineerde Score
Aangepast profiel met maximale ventilator aan447023888712094
Aangepast profiel met maximaal ventilator uit44397 (-1%)35809 (-8%)12595 (-0%)
Turbomodus44111 (-1%)33180 (-15%)13065 (-0%)
Gebalanceerde modus36832 (-18%)25159 (-35%)6109 (-49%)
Batterijvermogen18581 (-58%)23066 (-41%)5093 (-58%)

Advanced Optimus wordt ondersteund voor het schakelen tussen dGPU- en Optimus-modi. Er is echter geen modus voor alleen iGPU voor extra energiebesparing, in tegenstelling tot recente Alienware laptops.

Fire Strike (Aangepaste modus met Max ventilator uit)
Fire Strike (Turbomodus)
Fire Strike Ultra
Fire Strike Ultra
Snelheid Way
Snelheid Way
Time Spy
Time Spy
 
3DMark Performance Rating - Percent
AMD Ryzen 7 7800X3D
NVIDIA GeForce RTX 4090, AMD Ryzen 7 7800X3D
100 pt
Alienware m18 R1
NVIDIA GeForce RTX 4090 Laptop GPU, Intel Core i9-13980HX
59.6 pt
MSI Titan 18 HX A14VIG
NVIDIA GeForce RTX 4090 Laptop GPU, Intel Core i9-14900HX
59 pt
Alienware m18 R2
NVIDIA GeForce RTX 4090 Laptop GPU, Intel Core i9-14900HX
58.3 pt
Asus ROG Strix Scar 17 G733PYV-LL053X
NVIDIA GeForce RTX 4090 Laptop GPU, AMD Ryzen 9 7945HX3D
58.1 pt
Razer Blade 18 2024 RZ09-0509
NVIDIA GeForce RTX 4090 Laptop GPU, Intel Core i9-14900HX
56.9 pt
Gemiddeld NVIDIA GeForce RTX 4090 Laptop GPU
 
56.2 pt
Razer Blade 16 2024, RTX 4090 -1!
NVIDIA GeForce RTX 4090 Laptop GPU, Intel Core i9-14900HX
56.1 pt
Asus ROG Strix Scar 18 G834JYR (2024)
NVIDIA GeForce RTX 4090 Laptop GPU, Intel Core i9-14900HX
53.6 pt
Alienware m18 R1 AMD -1!
AMD Radeon RX 7900M, AMD Ryzen 9 7945HX
53.5 pt
Razer Blade 16 Early 2023
NVIDIA GeForce RTX 4080 Laptop GPU, Intel Core i9-13950HX
48.5 pt
Razer Blade 18 RTX 4070
NVIDIA GeForce RTX 4070 Laptop GPU, Intel Core i9-13950HX
31.9 pt
3DMark 11 - 1280x720 Performance GPU
AMD Ryzen 7 7800X3D
NVIDIA GeForce RTX 4090, AMD Ryzen 7 7800X3D
114641 Points +77%
Alienware m18 R1
NVIDIA GeForce RTX 4090 Laptop GPU, Intel Core i9-13980HX
71383 Points +10%
Alienware m18 R2
NVIDIA GeForce RTX 4090 Laptop GPU, Intel Core i9-14900HX
69254 Points +7%
Razer Blade 16 2024, RTX 4090
NVIDIA GeForce RTX 4090 Laptop GPU, Intel Core i9-14900HX
65956 Points +2%
Gemiddeld NVIDIA GeForce RTX 4090 Laptop GPU
  (54073 - 73027, n=42)
65041 Points 0%
Razer Blade 18 2024 RZ09-0509
NVIDIA GeForce RTX 4090 Laptop GPU, Intel Core i9-14900HX
64952 Points
Asus ROG Strix Scar 17 G733PYV-LL053X
NVIDIA GeForce RTX 4090 Laptop GPU, AMD Ryzen 9 7945HX3D
64166 Points -1%
MSI Titan 18 HX A14VIG
NVIDIA GeForce RTX 4090 Laptop GPU, Intel Core i9-14900HX
63978 Points -1%
Asus ROG Strix Scar 18 G834JYR (2024)
NVIDIA GeForce RTX 4090 Laptop GPU, Intel Core i9-14900HX
61833 Points -5%
Alienware m18 R1 AMD
AMD Radeon RX 7900M, AMD Ryzen 9 7945HX
59943 Points -8%
Razer Blade 16 Early 2023
NVIDIA GeForce RTX 4080 Laptop GPU, Intel Core i9-13950HX
56565 Points -13%
Razer Blade 18 RTX 4070
NVIDIA GeForce RTX 4070 Laptop GPU, Intel Core i9-13950HX
39733 Points -39%
3DMark
1920x1080 Fire Strike Graphics
AMD Ryzen 7 7800X3D
NVIDIA GeForce RTX 4090, AMD Ryzen 7 7800X3D
73447 Points +64%
MSI Titan 18 HX A14VIG
NVIDIA GeForce RTX 4090 Laptop GPU, Intel Core i9-14900HX
50532 Points +13%
Alienware m18 R1 AMD
AMD Radeon RX 7900M, AMD Ryzen 9 7945HX
50241 Points +12%
Asus ROG Strix Scar 17 G733PYV-LL053X
NVIDIA GeForce RTX 4090 Laptop GPU, AMD Ryzen 9 7945HX3D
49422 Points +11%
Alienware m18 R1
NVIDIA GeForce RTX 4090 Laptop GPU, Intel Core i9-13980HX
46998 Points +5%
Razer Blade 16 2024, RTX 4090
NVIDIA GeForce RTX 4090 Laptop GPU, Intel Core i9-14900HX
46527 Points +4%
Gemiddeld NVIDIA GeForce RTX 4090 Laptop GPU
  (40259 - 53059, n=41)
46365 Points +4%
Razer Blade 18 2024 RZ09-0509
NVIDIA GeForce RTX 4090 Laptop GPU, Intel Core i9-14900HX
44702 Points
Alienware m18 R2
NVIDIA GeForce RTX 4090 Laptop GPU, Intel Core i9-14900HX
44492 Points 0%
Asus ROG Strix Scar 18 G834JYR (2024)
NVIDIA GeForce RTX 4090 Laptop GPU, Intel Core i9-14900HX
43477 Points -3%
Razer Blade 16 Early 2023
NVIDIA GeForce RTX 4080 Laptop GPU, Intel Core i9-13950HX
40570 Points -9%
Razer Blade 18 RTX 4070
NVIDIA GeForce RTX 4070 Laptop GPU, Intel Core i9-13950HX
28743 Points -36%
2560x1440 Time Spy Graphics
AMD Ryzen 7 7800X3D
NVIDIA GeForce RTX 4090, AMD Ryzen 7 7800X3D
37664 Points +77%
Alienware m18 R1
NVIDIA GeForce RTX 4090 Laptop GPU, Intel Core i9-13980HX
22547 Points +6%
Alienware m18 R2
NVIDIA GeForce RTX 4090 Laptop GPU, Intel Core i9-14900HX
22290 Points +5%
MSI Titan 18 HX A14VIG
NVIDIA GeForce RTX 4090 Laptop GPU, Intel Core i9-14900HX
22256 Points +5%
Asus ROG Strix Scar 17 G733PYV-LL053X
NVIDIA GeForce RTX 4090 Laptop GPU, AMD Ryzen 9 7945HX3D
21353 Points +1%
Razer Blade 18 2024 RZ09-0509
NVIDIA GeForce RTX 4090 Laptop GPU, Intel Core i9-14900HX
21246 Points
Gemiddeld NVIDIA GeForce RTX 4090 Laptop GPU
  (16950 - 23292, n=43)
20950 Points -1%
Asus ROG Strix Scar 18 G834JYR (2024)
NVIDIA GeForce RTX 4090 Laptop GPU, Intel Core i9-14900HX
20070 Points -6%
Razer Blade 16 2024, RTX 4090
NVIDIA GeForce RTX 4090 Laptop GPU, Intel Core i9-14900HX
19878 Points -6%
Alienware m18 R1 AMD
AMD Radeon RX 7900M, AMD Ryzen 9 7945HX
19434 Points -9%
Razer Blade 16 Early 2023
NVIDIA GeForce RTX 4080 Laptop GPU, Intel Core i9-13950HX
18441 Points -13%
Razer Blade 18 RTX 4070
NVIDIA GeForce RTX 4070 Laptop GPU, Intel Core i9-13950HX
11683 Points -45%
2560x1440 Speed Way Score
AMD Ryzen 7 7800X3D
NVIDIA GeForce RTX 4090, AMD Ryzen 7 7800X3D
10133 Points +77%
Alienware m18 R1
NVIDIA GeForce RTX 4090 Laptop GPU, Intel Core i9-13980HX
5794 Points +1%
Alienware m18 R2
NVIDIA GeForce RTX 4090 Laptop GPU, Intel Core i9-14900HX
5784 Points +1%
Razer Blade 18 2024 RZ09-0509
NVIDIA GeForce RTX 4090 Laptop GPU, Intel Core i9-14900HX
5736 Points
MSI Titan 18 HX A14VIG
NVIDIA GeForce RTX 4090 Laptop GPU, Intel Core i9-14900HX
5726 Points 0%
Asus ROG Strix Scar 17 G733PYV-LL053X
NVIDIA GeForce RTX 4090 Laptop GPU, AMD Ryzen 9 7945HX3D
5712 Points 0%
Gemiddeld NVIDIA GeForce RTX 4090 Laptop GPU
  (4401 - 5940, n=27)
5459 Points -5%
Asus ROG Strix Scar 18 G834JYR (2024)
NVIDIA GeForce RTX 4090 Laptop GPU, Intel Core i9-14900HX
5319 Points -7%
Razer Blade 16 Early 2023
NVIDIA GeForce RTX 4080 Laptop GPU, Intel Core i9-13950HX
4642 Points -19%
Razer Blade 18 RTX 4070
NVIDIA GeForce RTX 4070 Laptop GPU, Intel Core i9-13950HX
2789 Points -51%
2560x1440 Port Royal Graphics
AMD Ryzen 7 7800X3D
NVIDIA GeForce RTX 4090, AMD Ryzen 7 7800X3D
25924 Points +86%
Alienware m18 R1
NVIDIA GeForce RTX 4090 Laptop GPU, Intel Core i9-13980HX
14225 Points +2%
MSI Titan 18 HX A14VIG
NVIDIA GeForce RTX 4090 Laptop GPU, Intel Core i9-14900HX
14201 Points +2%
Alienware m18 R2
NVIDIA GeForce RTX 4090 Laptop GPU, Intel Core i9-14900HX
14069 Points +1%
Asus ROG Strix Scar 17 G733PYV-LL053X
NVIDIA GeForce RTX 4090 Laptop GPU, AMD Ryzen 9 7945HX3D
14057 Points +1%
Razer Blade 18 2024 RZ09-0509
NVIDIA GeForce RTX 4090 Laptop GPU, Intel Core i9-14900HX
13936 Points
Gemiddeld NVIDIA GeForce RTX 4090 Laptop GPU
  (10798 - 14592, n=31)
13397 Points -4%
Razer Blade 16 2024, RTX 4090
NVIDIA GeForce RTX 4090 Laptop GPU, Intel Core i9-14900HX
13182 Points -5%
Asus ROG Strix Scar 18 G834JYR (2024)
NVIDIA GeForce RTX 4090 Laptop GPU, Intel Core i9-14900HX
12677 Points -9%
Razer Blade 16 Early 2023
NVIDIA GeForce RTX 4080 Laptop GPU, Intel Core i9-13950HX
11665 Points -16%
Razer Blade 16 Early 2023
NVIDIA GeForce RTX 4080 Laptop GPU, Intel Core i9-13950HX
10705 Points -23%
Alienware m18 R1 AMD
AMD Radeon RX 7900M, AMD Ryzen 9 7945HX
10814 Points -22%
Razer Blade 18 RTX 4070
NVIDIA GeForce RTX 4070 Laptop GPU, Intel Core i9-13950HX
7078 Points -49%
3DMark 11 Performance
45938 punten
3DMark Fire Strike Score
34597 punten
3DMark Time Spy Score
20561 punten
Help
Blender
v3.3 Classroom OPTIX/RTX
Razer Blade 18 2024 RZ09-0509
NVIDIA GeForce RTX 4090 Laptop GPU, Intel Core i9-14900HX
14 Seconds *
Gemiddeld NVIDIA GeForce RTX 4090 Laptop GPU
  (9 - 19, n=39)
12.1 Seconds * +14%
Asus ROG Strix Scar 18 G834JYR (2024)
NVIDIA GeForce RTX 4090 Laptop GPU, Intel Core i9-14900HX
12 Seconds * +14%
Razer Blade 16 2024, RTX 4090
NVIDIA GeForce RTX 4090 Laptop GPU, Intel Core i9-14900HX
12 Seconds * +14%
Alienware m18 R2
NVIDIA GeForce RTX 4090 Laptop GPU, Intel Core i9-14900HX
12 Seconds * +14%
Asus ROG Strix Scar 17 G733PYV-LL053X
NVIDIA GeForce RTX 4090 Laptop GPU, AMD Ryzen 9 7945HX3D
11 Seconds * +21%
MSI Titan 18 HX A14VIG
NVIDIA GeForce RTX 4090 Laptop GPU, Intel Core i9-14900HX
10 Seconds * +29%
v3.3 Classroom CUDA
Razer Blade 18 2024 RZ09-0509
NVIDIA GeForce RTX 4090 Laptop GPU, Intel Core i9-14900HX
19 Seconds *
Gemiddeld NVIDIA GeForce RTX 4090 Laptop GPU
  (16 - 24, n=39)
18.3 Seconds * +4%
Asus ROG Strix Scar 17 G733PYV-LL053X
NVIDIA GeForce RTX 4090 Laptop GPU, AMD Ryzen 9 7945HX3D
18 Seconds * +5%
MSI Titan 18 HX A14VIG
NVIDIA GeForce RTX 4090 Laptop GPU, Intel Core i9-14900HX
18 Seconds * +5%
Razer Blade 16 2024, RTX 4090
NVIDIA GeForce RTX 4090 Laptop GPU, Intel Core i9-14900HX
18 Seconds * +5%
Alienware m18 R2
NVIDIA GeForce RTX 4090 Laptop GPU, Intel Core i9-14900HX
18 Seconds * +5%
Asus ROG Strix Scar 18 G834JYR (2024)
NVIDIA GeForce RTX 4090 Laptop GPU, Intel Core i9-14900HX
17 Seconds * +11%
v3.3 Classroom CPU
Asus ROG Strix Scar 18 G834JYR (2024)
NVIDIA GeForce RTX 4090 Laptop GPU, Intel Core i9-14900HX
209 Seconds * -1%
Razer Blade 18 2024 RZ09-0509
NVIDIA GeForce RTX 4090 Laptop GPU, Intel Core i9-14900HX
207 Seconds *
Razer Blade 16 2024, RTX 4090
NVIDIA GeForce RTX 4090 Laptop GPU, Intel Core i9-14900HX
202 Seconds * +2%
Gemiddeld NVIDIA GeForce RTX 4090 Laptop GPU
  (144 - 305, n=39)
199.1 Seconds * +4%
Alienware m18 R2
NVIDIA GeForce RTX 4090 Laptop GPU, Intel Core i9-14900HX
180 Seconds * +13%
MSI Titan 18 HX A14VIG
NVIDIA GeForce RTX 4090 Laptop GPU, Intel Core i9-14900HX
179 Seconds * +14%
Asus ROG Strix Scar 17 G733PYV-LL053X
NVIDIA GeForce RTX 4090 Laptop GPU, AMD Ryzen 9 7945HX3D
150 Seconds * +28%

* ... kleiner is beter

Performance Rating - Percent
Asus ROG Strix Scar 17 G733PYV-LL053X
AMD Ryzen 9 7945HX3D, NVIDIA GeForce RTX 4090 Laptop GPU
98.5 pt
Alienware m18 R2
Intel Core i9-14900HX, NVIDIA GeForce RTX 4090 Laptop GPU
88.3 pt
MSI Titan 18 HX A14VIG
Intel Core i9-14900HX, NVIDIA GeForce RTX 4090 Laptop GPU
87.5 pt
Razer Blade 16 2024, RTX 4090
Intel Core i9-14900HX, NVIDIA GeForce RTX 4090 Laptop GPU
84.6 pt
Asus ROG Strix Scar 18 G834JYR (2024)
Intel Core i9-14900HX, NVIDIA GeForce RTX 4090 Laptop GPU
81.9 pt
Razer Blade 18 2024 RZ09-0509
Intel Core i9-14900HX, NVIDIA GeForce RTX 4090 Laptop GPU
79.7 pt
Gemiddelde van klas Gaming
 
62.6 pt
The Witcher 3 - 1920x1080 Ultra Graphics & Postprocessing (HBAO+)
MSI Titan 18 HX A14VIG
Intel Core i9-14900HX, NVIDIA GeForce RTX 4090 Laptop GPU
211.2 (165min) fps +9%
Asus ROG Strix Scar 17 G733PYV-LL053X
AMD Ryzen 9 7945HX3D, NVIDIA GeForce RTX 4090 Laptop GPU
207 fps +7%
Alienware m18 R2
Intel Core i9-14900HX, NVIDIA GeForce RTX 4090 Laptop GPU
205.7 (193min) fps +7%
Razer Blade 16 2024, RTX 4090
Intel Core i9-14900HX, NVIDIA GeForce RTX 4090 Laptop GPU
200 fps +4%
Razer Blade 18 2024 RZ09-0509
Intel Core i9-14900HX, NVIDIA GeForce RTX 4090 Laptop GPU
193 (53.6P0.1, 119.7P1) fps
Asus ROG Strix Scar 18 G834JYR (2024)
Intel Core i9-14900HX, NVIDIA GeForce RTX 4090 Laptop GPU
189.4 (165min) fps -2%
Gemiddelde van klas Gaming
  (18.4 - 216, n=168, laatste 2 jaar)
126.9 fps -34%
GTA V - 1920x1080 Highest Settings possible AA:4xMSAA + FX AF:16x
Asus ROG Strix Scar 17 G733PYV-LL053X
AMD Ryzen 9 7945HX3D, NVIDIA GeForce RTX 4090 Laptop GPU
167.7 (1.87min, 111.1P1) fps +29%
MSI Titan 18 HX A14VIG
Intel Core i9-14900HX, NVIDIA GeForce RTX 4090 Laptop GPU
139.2 (3.73min, 90.9P1) fps +7%
Razer Blade 16 2024, RTX 4090
Intel Core i9-14900HX, NVIDIA GeForce RTX 4090 Laptop GPU
138.1 (4.19min, 83.3P1) fps +6%
Alienware m18 R2
Intel Core i9-14900HX, NVIDIA GeForce RTX 4090 Laptop GPU
137 (7.81min, 83.3P1) fps +6%
Asus ROG Strix Scar 18 G834JYR (2024)
Intel Core i9-14900HX, NVIDIA GeForce RTX 4090 Laptop GPU
136 (8.67min, 100P1) fps +5%
Razer Blade 18 2024 RZ09-0509
Intel Core i9-14900HX, NVIDIA GeForce RTX 4090 Laptop GPU
129.8 (16.1min, 90.9P1) fps
Gemiddelde van klas Gaming
  (12.1 - 167.7, n=171, laatste 2 jaar)
113 fps -13%
Final Fantasy XV Benchmark - 1920x1080 High Quality
Alienware m18 R2
Intel Core i9-14900HX, NVIDIA GeForce RTX 4090 Laptop GPU
193.2 fps +23%
MSI Titan 18 HX A14VIG
Intel Core i9-14900HX, NVIDIA GeForce RTX 4090 Laptop GPU
184 fps +17%
Asus ROG Strix Scar 17 G733PYV-LL053X
AMD Ryzen 9 7945HX3D, NVIDIA GeForce RTX 4090 Laptop GPU
180 fps +15%
Asus ROG Strix Scar 18 G834JYR (2024)
Intel Core i9-14900HX, NVIDIA GeForce RTX 4090 Laptop GPU
166.1 fps +6%
Razer Blade 18 2024 RZ09-0509
Intel Core i9-14900HX, NVIDIA GeForce RTX 4090 Laptop GPU
156.9 fps
Razer Blade 16 2024, RTX 4090
Intel Core i9-14900HX, NVIDIA GeForce RTX 4090 Laptop GPU
137.5 fps -12%
Gemiddelde van klas Gaming
  (19.2 - 201, n=184, laatste 2 jaar)
119 fps -24%
Strange Brigade - 1920x1080 ultra AA:ultra AF:16
Asus ROG Strix Scar 17 G733PYV-LL053X
AMD Ryzen 9 7945HX3D, NVIDIA GeForce RTX 4090 Laptop GPU
420 (64.7min, 302P1) fps +29%
MSI Titan 18 HX A14VIG
Intel Core i9-14900HX, NVIDIA GeForce RTX 4090 Laptop GPU
385 (27.2min, 274P1) fps +18%
Alienware m18 R2
Intel Core i9-14900HX, NVIDIA GeForce RTX 4090 Laptop GPU
369 (31.4min, 266P1) fps +14%
Razer Blade 16 2024, RTX 4090
Intel Core i9-14900HX, NVIDIA GeForce RTX 4090 Laptop GPU
359.8 (30.2min, 253P1) fps +11%
Asus ROG Strix Scar 18 G834JYR (2024)
Intel Core i9-14900HX, NVIDIA GeForce RTX 4090 Laptop GPU
331 (34.1min, 238P1) fps +2%
Razer Blade 18 2024 RZ09-0509
Intel Core i9-14900HX, NVIDIA GeForce RTX 4090 Laptop GPU
325 (49.1min, 213P1) fps
Gemiddelde van klas Gaming
  (38.9 - 421, n=182, laatste 2 jaar)
227 fps -30%
Dota 2 Reborn - 1920x1080 ultra (3/3) best looking
Asus ROG Strix Scar 17 G733PYV-LL053X
AMD Ryzen 9 7945HX3D, NVIDIA GeForce RTX 4090 Laptop GPU
220 (175min) fps +34%
Razer Blade 16 2024, RTX 4090
Intel Core i9-14900HX, NVIDIA GeForce RTX 4090 Laptop GPU
188.1 (155.2min) fps +15%
MSI Titan 18 HX A14VIG
Intel Core i9-14900HX, NVIDIA GeForce RTX 4090 Laptop GPU
174.5 (151.1min) fps +6%
Alienware m18 R2
Intel Core i9-14900HX, NVIDIA GeForce RTX 4090 Laptop GPU
171.8 (143.6min) fps +5%
Razer Blade 18 2024 RZ09-0509
Intel Core i9-14900HX, NVIDIA GeForce RTX 4090 Laptop GPU
164 (140min) fps
Asus ROG Strix Scar 18 G834JYR (2024)
Intel Core i9-14900HX, NVIDIA GeForce RTX 4090 Laptop GPU
161.3 (135.6min) fps -2%
Gemiddelde van klas Gaming
  (30.8 - 220, n=190, laatste 2 jaar)
149.3 fps -9%
X-Plane 11.11 - 1920x1080 high (fps_test=3)
Asus ROG Strix Scar 17 G733PYV-LL053X
AMD Ryzen 9 7945HX3D, NVIDIA GeForce RTX 4090 Laptop GPU
166.2 fps +31%
Razer Blade 16 2024, RTX 4090
Intel Core i9-14900HX, NVIDIA GeForce RTX 4090 Laptop GPU
146.2 fps +15%
Alienware m18 R2
Intel Core i9-14900HX, NVIDIA GeForce RTX 4090 Laptop GPU
140.6 fps +11%
Asus ROG Strix Scar 18 G834JYR (2024)
Intel Core i9-14900HX, NVIDIA GeForce RTX 4090 Laptop GPU
136.8 fps +8%
Razer Blade 18 2024 RZ09-0509
Intel Core i9-14900HX, NVIDIA GeForce RTX 4090 Laptop GPU
127.2 fps
MSI Titan 18 HX A14VIG
Intel Core i9-14900HX, NVIDIA GeForce RTX 4090 Laptop GPU
126.1 fps -1%
Gemiddelde van klas Gaming
  (31.5 - 166.2, n=196, laatste 2 jaar)
107.2 fps -16%
Call of Duty Modern Warfare 3 2023
3840x2160 Extreme Preset
Alienware m18 R2
Intel Core i9-14900HX, NVIDIA GeForce RTX 4090 Laptop GPU
106 fps +22%
Razer Blade 16 2024, RTX 4090
Intel Core i9-14900HX, NVIDIA GeForce RTX 4090 Laptop GPU
91 fps +5%
Gemiddeld NVIDIA GeForce RTX 4090 Laptop GPU
  (73 - 106, n=5)
90 fps +3%
Razer Blade 18 2024 RZ09-0509
Intel Core i9-14900HX, NVIDIA GeForce RTX 4090 Laptop GPU
87 fps
Gemiddelde van klas Gaming
  (27 - 106, n=6, laatste 2 jaar)
72.3 fps -17%
2560x1440 Extreme Preset
Asus ROG Strix Scar 18 G834JYR (2024)
Intel Core i9-14900HX, NVIDIA GeForce RTX 4090 Laptop GPU
162 (119min) fps +23%
Alienware m18 R2
Intel Core i9-14900HX, NVIDIA GeForce RTX 4090 Laptop GPU
160 fps +21%
Gemiddeld NVIDIA GeForce RTX 4090 Laptop GPU
  (113 - 162, n=7)
138.6 fps +5%
Razer Blade 16 2024, RTX 4090
Intel Core i9-14900HX, NVIDIA GeForce RTX 4090 Laptop GPU
138 fps +5%
Razer Blade 18 2024 RZ09-0509
Intel Core i9-14900HX, NVIDIA GeForce RTX 4090 Laptop GPU
132 fps
Gemiddelde van klas Gaming
  (48 - 162, n=15, laatste 2 jaar)
95.9 fps -27%
1920x1080 Extreme Preset
Alienware m18 R2
Intel Core i9-14900HX, NVIDIA GeForce RTX 4090 Laptop GPU
205 fps +18%
Razer Blade 16 2024, RTX 4090
Intel Core i9-14900HX, NVIDIA GeForce RTX 4090 Laptop GPU
179 fps +3%
Gemiddeld NVIDIA GeForce RTX 4090 Laptop GPU
  (148 - 205, n=7)
175.1 fps +1%
Razer Blade 18 2024 RZ09-0509
Intel Core i9-14900HX, NVIDIA GeForce RTX 4090 Laptop GPU
174 fps
Asus ROG Strix Scar 18 G834JYR (2024)
Intel Core i9-14900HX, NVIDIA GeForce RTX 4090 Laptop GPU
162 (119min) fps -7%
Gemiddelde van klas Gaming
  (27 - 205, n=18, laatste 2 jaar)
112.5 fps -35%
Cyberpunk 2077 2.1 Phantom Liberty
3840x2160 Ultra Preset (FSR off)
MSI Titan 18 HX A14VIG
Intel Core i9-14900HX, NVIDIA GeForce RTX 4090 Laptop GPU
43.9 (27.1min) fps +17%
Alienware m18 R2
Intel Core i9-14900HX, NVIDIA GeForce RTX 4090 Laptop GPU
43.4 (30.4min) fps +16%
Gemiddeld NVIDIA GeForce RTX 4090 Laptop GPU
  (32.9 - 50.6, n=9)
42 fps +12%
Razer Blade 16 2024, RTX 4090
Intel Core i9-14900HX, NVIDIA GeForce RTX 4090 Laptop GPU
39.61 fps +6%
Razer Blade 18 2024 RZ09-0509
Intel Core i9-14900HX, NVIDIA GeForce RTX 4090 Laptop GPU
37.38 (31.36min) fps
Gemiddelde van klas Gaming
  (13.8 - 50.6, n=19, laatste 2 jaar)
31.8 fps -15%
2560x1440 Ultra Preset (FSR off)
MSI Titan 18 HX A14VIG
Intel Core i9-14900HX, NVIDIA GeForce RTX 4090 Laptop GPU
94.5 (50.3min) fps +13%
Alienware m18 R2
Intel Core i9-14900HX, NVIDIA GeForce RTX 4090 Laptop GPU
94.1 (57.3min) fps +13%
Gemiddeld NVIDIA GeForce RTX 4090 Laptop GPU
  (68.1 - 103.9, n=19)
89.9 fps +8%
Asus ROG Strix Scar 18 G834JYR (2024)
Intel Core i9-14900HX, NVIDIA GeForce RTX 4090 Laptop GPU
83.8 (35.1min) fps +1%
Razer Blade 16 2024, RTX 4090
Intel Core i9-14900HX, NVIDIA GeForce RTX 4090 Laptop GPU
83.39 (67.14min) fps 0%
Razer Blade 18 2024 RZ09-0509
Intel Core i9-14900HX, NVIDIA GeForce RTX 4090 Laptop GPU
83.38 (67.53min) fps
Gemiddelde van klas Gaming
  (24.8 - 110, n=69, laatste 2 jaar)
64.9 fps -22%
1920x1080 Ultra Preset (FSR off)
Alienware m18 R2
Intel Core i9-14900HX, NVIDIA GeForce RTX 4090 Laptop GPU
133.9 (67.5min) fps +32%
MSI Titan 18 HX A14VIG
Intel Core i9-14900HX, NVIDIA GeForce RTX 4090 Laptop GPU
129.8 (26.2min) fps +28%
Gemiddeld NVIDIA GeForce RTX 4090 Laptop GPU
  (93.1 - 144.7, n=19)
120.8 fps +19%
Asus ROG Strix Scar 18 G834JYR (2024)
Intel Core i9-14900HX, NVIDIA GeForce RTX 4090 Laptop GPU
112.1 (42.7min) fps +11%
Razer Blade 18 2024 RZ09-0509
Intel Core i9-14900HX, NVIDIA GeForce RTX 4090 Laptop GPU
101.25 (77.2min) fps
Razer Blade 16 2024, RTX 4090
Intel Core i9-14900HX, NVIDIA GeForce RTX 4090 Laptop GPU
95.35 (70.51min) fps -6%
Gemiddelde van klas Gaming
  (6.76 - 144.7, n=79, laatste 2 jaar)
85.9 fps -15%
Baldur's Gate 3
3840x2160 Ultra Preset
Alienware m18 R2
Intel Core i9-14900HX, NVIDIA GeForce RTX 4090 Laptop GPU
81.7 fps +16%
MSI Titan 18 HX A14VIG
Intel Core i9-14900HX, NVIDIA GeForce RTX 4090 Laptop GPU
80.8 fps +15%
Gemiddeld NVIDIA GeForce RTX 4090 Laptop GPU
  (57 - 81.7, n=7)
71.2 fps +1%
Razer Blade 18 2024 RZ09-0509
Intel Core i9-14900HX, NVIDIA GeForce RTX 4090 Laptop GPU
70.5 (39.1P0.1, 55.6P1) fps
Gemiddelde van klas Gaming
  (22.9 - 81.7, n=15, laatste 2 jaar)
54.7 fps -22%
2560x1440 Ultra Preset
MSI Titan 18 HX A14VIG
Intel Core i9-14900HX, NVIDIA GeForce RTX 4090 Laptop GPU
155.2 fps +30%
Alienware m18 R2
Intel Core i9-14900HX, NVIDIA GeForce RTX 4090 Laptop GPU
151.6 fps +27%
Gemiddeld NVIDIA GeForce RTX 4090 Laptop GPU
  (99 - 155.2, n=7)
133.2 fps +12%
Razer Blade 18 2024 RZ09-0509
Intel Core i9-14900HX, NVIDIA GeForce RTX 4090 Laptop GPU
119.2 (40.8P0.1, 73.2P1) fps
Gemiddelde van klas Gaming
  (44 - 155.2, n=34, laatste 2 jaar)
82.2 fps -31%
1920x1080 Ultra Preset
MSI Titan 18 HX A14VIG
Intel Core i9-14900HX, NVIDIA GeForce RTX 4090 Laptop GPU
207.7 fps +29%
Alienware m18 R2
Intel Core i9-14900HX, NVIDIA GeForce RTX 4090 Laptop GPU
202 fps +26%
Gemiddeld NVIDIA GeForce RTX 4090 Laptop GPU
  (118 - 208, n=7)
177.5 fps +11%
Razer Blade 18 2024 RZ09-0509
Intel Core i9-14900HX, NVIDIA GeForce RTX 4090 Laptop GPU
160.5 (65P0.1, 99.5P1) fps
Gemiddelde van klas Gaming
  (21.2 - 208, n=44, laatste 2 jaar)
102.1 fps -36%
Alan Wake 2
3840x2160 High Preset
Alienware m18 R2
Intel Core i9-14900HX, NVIDIA GeForce RTX 4090 Laptop GPU
45.2 fps +7%
Gemiddeld NVIDIA GeForce RTX 4090 Laptop GPU
  (41.6 - 46.9, n=4)
44 fps +4%
Razer Blade 18 2024 RZ09-0509
Intel Core i9-14900HX, NVIDIA GeForce RTX 4090 Laptop GPU
42.3 (21.9P0.1, 33.4P1) fps
Razer Blade 16 2024, RTX 4090
Intel Core i9-14900HX, NVIDIA GeForce RTX 4090 Laptop GPU
41.6 (20P0.1, 31.8P1) fps -2%
Gemiddelde van klas Gaming
  (12.3 - 45.2, n=6, laatste 2 jaar)
35.6 fps -16%
2560x1440 High Preset
Alienware m18 R2
Intel Core i9-14900HX, NVIDIA GeForce RTX 4090 Laptop GPU
83.1 fps +5%
Gemiddeld NVIDIA GeForce RTX 4090 Laptop GPU
  (78.4 - 87.1, n=6)
82.9 fps +4%
Razer Blade 18 2024 RZ09-0509
Intel Core i9-14900HX, NVIDIA GeForce RTX 4090 Laptop GPU
79.4 (33.5P0.1, 57.9P1) fps
Razer Blade 16 2024, RTX 4090
Intel Core i9-14900HX, NVIDIA GeForce RTX 4090 Laptop GPU
78.4 (17P0.1, 52.8P1) fps -1%
Gemiddelde van klas Gaming
  (22.5 - 87.1, n=13, laatste 2 jaar)
62 fps -22%
1920x1080 High Preset
Gemiddeld NVIDIA GeForce RTX 4090 Laptop GPU
  (108.6 - 124.7, n=6)
118.1 fps +4%
Alienware m18 R2
Intel Core i9-14900HX, NVIDIA GeForce RTX 4090 Laptop GPU
116.9 fps +2%
Razer Blade 18 2024 RZ09-0509
Intel Core i9-14900HX, NVIDIA GeForce RTX 4090 Laptop GPU
114.1 (56.8P0.1, 81.7P1) fps
Razer Blade 16 2024, RTX 4090
Intel Core i9-14900HX, NVIDIA GeForce RTX 4090 Laptop GPU
108.6 (26.3P0.1, 67P1) fps -5%
Gemiddelde van klas Gaming
  (17.1 - 123.3, n=18, laatste 2 jaar)
70.8 fps -38%

Witcher 3 FPS Chart

0153045607590105120135150165180195Tooltip
Razer Blade 18 2024 RZ09-0509 i9-14900HX, NVIDIA GeForce RTX 4090 Laptop GPU: Ø191.2 (168-206)
lagegem.hogeultraQHD4K DLSS4K
GTA V (2015) 129.8 126.6 165.4
The Witcher 3 (2015) 193 154.6 149.8
Dota 2 Reborn (2015) 213 191.8 180.5 164 147
Final Fantasy XV Benchmark (2018) 156.9 139.1 87.3
X-Plane 11.11 (2018) 183.8 158.2 127.2 107.2
Strange Brigade (2018) 325 268 149.2
F1 23 (2023) 110.9 73.1 37.1
Baldur's Gate 3 (2023) 160.5 119.2 94.4 70.5
Cyberpunk 2077 2.1 Phantom Liberty (2023) 101.25 83.38 54.59 37.38
Assassin's Creed Mirage (2023) 124 114 98 73
Alan Wake 2 (2023) 114.1 79.4 60.8 42.3
Call of Duty Modern Warfare 3 2023 (2023) 174 132 92 87

Uitstoot - Alleen luid als het nodig is

Systeemgeluid

Het ventilatorgeluid is over het algemeen luider dan wat we registreerden op onze 2023 Blade 18, grotendeels door verschillen in onze GPU-configuratie. De ventilatoren pulseerden vaker tussen de 24 en 29 dB(A), zelfs wanneer ze in Balanced en Optimus modus stonden. Dit is luid genoeg om merkbaar te zijn, maar nooit hinderlijk.

Misschien wel het belangrijkst voor gamers is dat het ventilatorgeluid erg kan verschillen, afhankelijk van de instelling van het energieprofiel. Wanneer u Witcher 3 met de Max Fan-modus actief, is het ventilatorgeluid bijvoorbeeld maar liefst 61 dB(A) in vergelijking met slechts 54 dB(A) met de Max Fan-modus uit. Aangezien er geen prestatieverschillen zijn tussen Max Fan aan en uit onder standaardinstellingen, raden wij aan om te gamen met Max Fan uit om het geluidsniveau laag te houden. Het ventilatorgeluid in de Turbo-modus zou identiek zijn aan Max Fan uit, wat overeenkomt met onze bovenstaande prestatieresultaten.

In vergelijking met concurrenten is de Blade 18 vergelijkbaar, zo niet iets luider dan de Alienware m18 R2 of ROG Strix Scar 18 die draaien op dezelfde GeForce RTX 4090 GPU. Een hoofdtelefoon wordt aanbevolen wanneer de ventilatorniveaus >50 dB(A) bereiken, vooral voor games waar voetstappen en andere kleine audiocues van vitaal belang zijn voor de gameplay.

Geluidsprofiel ventilator (Wit: Achtergrond, Rood: Systeem inactief, Blauw: 3DMark 06, Oranje: Witcher 3 groen: Prime95+FurMark stress)

Geluidsniveau

Onbelast
23.9 / 28.2 / 29 dB (A)
Belasting
36.8 / 61.1 dB (A)
  red to green bar
 
 
30 dB
stil
40 dB(A)
hoorbaar
50 dB(A)
luid
 
min: dark, med: mid, max: light   Earthworks M23R, Arta (15 cm afstand)   omgevingslawaai: 23.4 dB(A)
dB(A) 0102030405060708090Deep BassMiddle BassHigh BassLower RangeMidsHigher MidsLower HighsMid HighsUpper HighsSuper Highs2036.237.639.835.432.836.2252827.52827.323.1283127.626.728.123.723.627.64028.525.92522.62328.55029.927.729.628.327.229.96329.529.224.223.625.129.58032.32923.923.52332.310032.728.921.222.721.532.712532.328.218.917.91732.316035.630.421.918.118.235.620035.429.926.822.716.935.425036.831.621.222.41536.831538.533.121.517.515.538.540040.434.721.917.813.140.450042.837.72618.412.442.863042.437.623.918.411.642.480044.739.525.820.912.344.7100045.840.426.219.210.245.8125047.441.226.618.79.947.4160050.344.129.520.19.550.3200050.444.428.416.89.950.4250051.144.725.514.810.251.1315051.744.722.713.810.651.740005144.420.312.610.951500050.339.716.712.311.650.3630049.238.815.212.111.549.2800046.636.71311.911.546.61000044.73412.71211.644.71250041.33012.511.811.541.31600037.82611.911.210.837.8SPL61.154.136.82923.461.1N14.492.31.10.514.4median 44.7median 37.6median 21.9median 17.8median 11.6median 44.7Delta6.35.753.92.46.3hearing rangehide median Fan NoiseRazer Blade 18 2024 RZ09-0509
Razer Blade 18 2024 RZ09-0509
NVIDIA GeForce RTX 4090 Laptop GPU, i9-14900HX
Razer Blade 18 RTX 4070
NVIDIA GeForce RTX 4070 Laptop GPU, i9-13950HX, SSSTC CA6-8D1024
Alienware m18 R2
NVIDIA GeForce RTX 4090 Laptop GPU, i9-14900HX, SK Hynix PC811 HFS002TEM9X152N
MSI Titan 18 HX A14VIG
NVIDIA GeForce RTX 4090 Laptop GPU, i9-14900HX, 2x Samsung PM9A1a MZVL22T0HDLB (RAID 0)
Asus ROG Strix Scar 18 G834JYR (2024)
NVIDIA GeForce RTX 4090 Laptop GPU, i9-14900HX, Samsung PM9A1a MZVL22T0HDLB
Razer Blade 16 2024, RTX 4090
NVIDIA GeForce RTX 4090 Laptop GPU, i9-14900HX, Samsung PM9A1 MZVL22T0HBLB
Noise
7%
3%
1%
-5%
6%
uit / omgeving *
23.4
23.5
-0%
23.6
-1%
22.8
3%
24
-3%
23
2%
Idle Minimum *
23.9
23.8
-0%
23.8
-0%
23.8
-0%
27
-13%
23
4%
Idle Average *
28.2
23.8
16%
26.1
7%
23.8
16%
28
1%
23
18%
Idle Maximum *
29
26.8
8%
31.5
-9%
28
3%
32
-10%
27.66
5%
Load Average *
36.8
37.3
-1%
31.5
14%
38
-3%
50
-36%
43.76
-19%
Witcher 3 ultra *
54.1
48
11%
52.1
4%
57.3
-6%
50
8%
46.81
13%
Load Maximum *
61.1
53.5
12%
56.6
7%
62.8
-3%
52
15%
50.37
18%

* ... kleiner is beter

Temperatuur

De oppervlaktetemperaturen tijdens het gamen zijn merkbaar warmer dan wat we op onze 2023 hebben gemeten, maar dit is wederom voornamelijk te wijten aan GPU-verschillen in onze configuraties. Razer heeft geen wijzigingen aangebracht in de onderliggende koeloplossing.

Razer power bricks behoren nog steeds tot de kleinste en toch warmste op de markt. Onze adapter bereikte bijvoorbeeld meer dan 63 C tijdens het gamen, vergeleken met slechts 54 C op de Alienware m18 R2 adapter. Warmere temperaturen zijn het gevolg van het ontwerp van GaN-laders.

Achteruitlaat
Achteruitlaat
AC-adapter kan meer dan 63 C bereiken bij veeleisende belastingen zoals games
Max. Belasting
 38.2 °C43.2 °C37.2 °C 
 34.8 °C41.2 °C33.4 °C 
 35.4 °C36.2 °C33.2 °C 
Maximum: 43.2 °C
Gemiddelde: 37 °C
33.6 °C42.6 °C35.6 °C
36.4 °C38.8 °C37 °C
33.6 °C34.8 °C35.4 °C
Maximum: 42.6 °C
Gemiddelde: 36.4 °C
Stroomadapter (max.)  51.4 °C | Kamertemperatuur 20 °C | Fluke 62 Mini IR Thermometer
(±) De gemiddelde temperatuur voor de bovenzijde bij maximale belasting bedraagt 37 °C / 99 F, vergeleken met het gemiddelde van 33.9 °C / ###class_avg_f## F voor de apparaten van de klasse Gaming.
(±) De maximumtemperatuur aan de bovenzijde bedraagt 43.2 °C / 110 F, vergeleken met het gemiddelde van 40.5 °C / 105 F, variërend van 21.2 tot 68.8 °C voor de klasse Gaming.
(±) De bodem warmt op tot een maximum van 42.6 °C / 109 F, vergeleken met een gemiddelde van 43.2 °C / 110 F
(+) Bij onbelast gebruik bedraagt de gemiddelde temperatuur voor de bovenzijde 31.3 °C / 88 F, vergeleken met het apparaatgemiddelde van 33.9 °C / 93 F.
(±) Bij het spelen van The Witcher 3 is de gemiddelde temperatuur voor de bovenzijde 34.9 °C / 95 F, vergeleken met het apparaatgemiddelde van 33.9 °C / 93 F.
(±) De palmsteunen en het touchpad kunnen zeer heet aanvoelen met een maximum van ###max## °C / 97.2 F.
(-) De gemiddelde temperatuur van de handpalmsteun van soortgelijke toestellen bedroeg 28.9 °C / 84 F (-7.3 °C / -13.2 F).
Systeem inactief (boven)
Systeem inactief (onder)
Witcher 3 stress (boven)
Witcher 3 stress (onder)
Prime95+FurMark stress (boven)
Prime95+FurMark stress (onder)
Razer Blade 18 2024 RZ09-0509
Intel Core i9-14900HX, NVIDIA GeForce RTX 4090 Laptop GPU
Razer Blade 18 RTX 4070
Intel Core i9-13950HX, NVIDIA GeForce RTX 4070 Laptop GPU
Alienware m18 R2
Intel Core i9-14900HX, NVIDIA GeForce RTX 4090 Laptop GPU
MSI Titan 18 HX A14VIG
Intel Core i9-14900HX, NVIDIA GeForce RTX 4090 Laptop GPU
Asus ROG Strix Scar 18 G834JYR (2024)
Intel Core i9-14900HX, NVIDIA GeForce RTX 4090 Laptop GPU
Razer Blade 16 2024, RTX 4090
Intel Core i9-14900HX, NVIDIA GeForce RTX 4090 Laptop GPU
Heat
12%
-4%
7%
3%
7%
Maximum Upper Side *
43.2
39.2
9%
41.2
5%
37.8
12%
49
-13%
45
-4%
Maximum Bottom *
42.6
35.6
16%
34.6
19%
37.6
12%
47
-10%
45
-6%
Idle Upper Side *
36
31.8
12%
42.8
-19%
34.8
3%
29
19%
29
19%
Idle Bottom *
36.4
33.2
9%
43.6
-20%
36
1%
31
15%
30
18%

* ... kleiner is beter

Luidsprekers

Het maximale volume bedraagt iets meer dan 85 dB(A) en is daarmee vrijwel identiek aan wat we opnamen op het 2023-model, ondanks de hierboven genoemde fysieke wijzigingen aan de luidsprekers
dB(A) 0102030405060708090Deep BassMiddle BassHigh BassLower RangeMidsHigher MidsLower HighsMid HighsUpper HighsSuper Highs2033.935.433.92526.127.326.1312523.725402622.6265036.128.336.1634623.6468055.223.555.210058.222.758.212561.917.961.916070.218.170.22007122.77125075.322.475.33157617.57640075.517.875.550076.818.476.863074.918.474.980074.520.974.510006319.263125072.118.772.1160076.220.176.2200074.916.874.925007614.876315070.813.870.8400070.512.670.550007112.371630069.912.169.9800065.611.965.61000063.21263.21250062.911.862.91600057.911.257.9SPL85.22985.2N70.21.170.2median 71median 17.8median 71Delta4.53.94.526.325.821.422.12624.925.127.622.532.523.448.72655.818.860.922.167.2267019.372.317.674.217.774.319.575.31571.711.871.311.27410.574.21072.710.17210.67210.97511.374.811.671.71269.71269.612.371.112.669.61270.111.269.824.784.70.666.6median 12median 71.73.42.2hearing rangehide median Pink NoiseRazer Blade 18 2024 RZ09-0509Apple MacBook Pro 16 2021 M1 Pro
Frequentiediagram (selectievakjes kunnen worden aan- en uitgezet om toestellen te vergelijken)
Razer Blade 18 2024 RZ09-0509 audioanalyse

(+) | luidsprekers kunnen relatief luid spelen (85.2 dB)
Bas 100 - 315 Hz
(±) | verminderde zeebaars - gemiddeld 5.3% lager dan de mediaan
(+) | de lage tonen zijn lineair (6.5% delta naar de vorige frequentie)
Mids 400 - 2000 Hz
(+) | evenwichtige middens - slechts 4.5% verwijderd van de mediaan
(±) | lineariteit van de middentonen is gemiddeld (7.1% delta ten opzichte van de vorige frequentie)
Hoog 2 - 16 kHz
(+) | evenwichtige hoogtepunten - slechts 2.9% verwijderd van de mediaan
(+) | de hoge tonen zijn lineair (4% delta naar de vorige frequentie)
Algemeen 100 - 16.000 Hz
(+) | het totale geluid is lineair (9.3% verschil met de mediaan)
Vergeleken met dezelfde klasse
» 3% van alle geteste apparaten in deze klasse waren beter, 2% vergelijkbaar, 96% slechter
» De beste had een delta van 6%, het gemiddelde was 18%, de slechtste was 132%
Vergeleken met alle geteste toestellen
» 3% van alle geteste apparaten waren beter, 1% gelijk, 97% slechter
» De beste had een delta van 4%, het gemiddelde was 25%, de slechtste was 134%

Apple MacBook Pro 16 2021 M1 Pro audioanalyse

(+) | luidsprekers kunnen relatief luid spelen (84.7 dB)
Bas 100 - 315 Hz
(+) | goede baars - slechts 3.8% verwijderd van de mediaan
(+) | de lage tonen zijn lineair (5.2% delta naar de vorige frequentie)
Mids 400 - 2000 Hz
(+) | evenwichtige middens - slechts 1.3% verwijderd van de mediaan
(+) | de middentonen zijn lineair (2.1% delta ten opzichte van de vorige frequentie)
Hoog 2 - 16 kHz
(+) | evenwichtige hoogtepunten - slechts 1.9% verwijderd van de mediaan
(+) | de hoge tonen zijn lineair (2.7% delta naar de vorige frequentie)
Algemeen 100 - 16.000 Hz
(+) | het totale geluid is lineair (4.6% verschil met de mediaan)
Vergeleken met dezelfde klasse
» 0% van alle geteste apparaten in deze klasse waren beter, 0% vergelijkbaar, 100% slechter
» De beste had een delta van 5%, het gemiddelde was 18%, de slechtste was 45%
Vergeleken met alle geteste toestellen
» 0% van alle geteste apparaten waren beter, 0% gelijk, 100% slechter
» De beste had een delta van 4%, het gemiddelde was 25%, de slechtste was 134%

Energiebeheer

Stroomverbruik

Het verbruik is over de hele linie hoger, zoals te verwachten was door de verschillen in beeldscherm en GPU tussen onze 2023 en 2024 testeenheden. Stationair draaien op het bureaublad in de Optimus-modus, het minimale helderheidsniveau en een verversingssnelheid van 60 Hz vergt ongeveer 25 W, terwijl stationair draaien in de dGPU-modus, het maximale helderheidsniveau en een verversingssnelheid van 300 Hz meer dan 2x zoveel verbruikt.
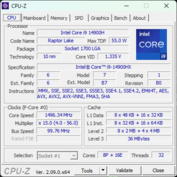
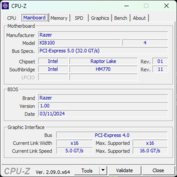
Het draaien van Witcher 3 vraagt ongeveer 70 W meer van onze RTX 4090 aangedreven 2024 testunit dan onze RTX 4070 aangedreven 2023 unit onder vergelijkbare omstandigheden. Als gevolg hiervan worden goedkopere RTX 4070-configuraties geleverd met een kleinere 280 W GaN-adapter, terwijl RTX 4080/4090-configuraties geleverd worden met de iets grotere 330 W GaN-adapter (~18 x 7,5 x 2,5 cm vs. ~16,3 x 7 x 2,5 cm)

Stroomgebruik
Uit / Standbydarklight 0.08 / 0.1 Watt
Inactiefdarkmidlight 25.4 / 37.7 / 57.9 Watt
Belasting midlight 128.4 / 297.9 Watt
 color bar
Key: min: dark, med: mid, max: light        Metrahit Energy
Razer Blade 18 2024 RZ09-0509
i9-14900HX, NVIDIA GeForce RTX 4090 Laptop GPU, , Mini-LED, 2560x1600, 18"
Razer Blade 18 RTX 4070
i9-13950HX, NVIDIA GeForce RTX 4070 Laptop GPU, SSSTC CA6-8D1024, IPS, 2560x1600, 18"
Alienware m18 R2
i9-14900HX, NVIDIA GeForce RTX 4090 Laptop GPU, SK Hynix PC811 HFS002TEM9X152N, IPS, 2560x1600, 18"
MSI Titan 18 HX A14VIG
i9-14900HX, NVIDIA GeForce RTX 4090 Laptop GPU, 2x Samsung PM9A1a MZVL22T0HDLB (RAID 0), Mini-LED, 3840x2400, 18"
Asus ROG Strix Scar 18 G834JYR (2024)
i9-14900HX, NVIDIA GeForce RTX 4090 Laptop GPU, Samsung PM9A1a MZVL22T0HDLB, Mini LED, 2560x1600, 18"
Power Consumption
10%
3%
3%
26%
Idle Minimum *
25.4
24.5
4%
10.6
58%
13.2
48%
14
45%
Idle Average *
37.7
34.1
10%
20.9
45%
25.4
33%
17
55%
Idle Maximum *
57.9
47.7
18%
40
31%
53.5
8%
24
59%
Load Average *
128.4
140
-9%
201.1
-57%
151.4
-18%
143
-11%
Witcher 3 ultra *
273.1
202
26%
358
-31%
336
-23%
251
8%
Load Maximum *
297.9
261
12%
378.9
-27%
395.2
-33%
302
-1%

* ... kleiner is beter

Levensduur batterij

De looptijden zijn ongeveer hetzelfde als voorheen, zo niet iets langer, namelijk slechts 20 minuten of zo. Merk op dat onze WLAN-test al rekening houdt met de Optimus-modus en de langzamere verversingssnelheid van 60 Hz, wat betekent dat de batterijlevensduur nog korter zou zijn in de dGPU-modus met zowel lokale verduistering als hoge verversingssnelheden actief.

Het is onrealistisch om lange looptijden te verwachten van een 18-inch gaming krachtpatser, maar concurrenten zoals de ROG Strix Scar 18 of Alienware m18 R2 hebben de Razer op dit gebied nog steeds verslagen.

Batterijduur
Inactief (zonder WLAN, minimale helderheid)
6h 35min
WiFi Websurfing
4h 23min
Belast (maximale helderheid)
0h 58min
Razer Blade 18 2024 RZ09-0509
i9-14900HX, NVIDIA GeForce RTX 4090 Laptop GPU, 91.7 Wh
Razer Blade 18 RTX 4070
i9-13950HX, NVIDIA GeForce RTX 4070 Laptop GPU, 91.7 Wh
Alienware m18 R2
i9-14900HX, NVIDIA GeForce RTX 4090 Laptop GPU, 97 Wh
MSI Titan 18 HX A14VIG
i9-14900HX, NVIDIA GeForce RTX 4090 Laptop GPU, 99.9 Wh
Asus ROG Strix Scar 18 G834JYR (2024)
i9-14900HX, NVIDIA GeForce RTX 4090 Laptop GPU, 90 Wh
Razer Blade 16 2024, RTX 4090
i9-14900HX, NVIDIA GeForce RTX 4090 Laptop GPU, 95.2 Wh
Batterijduur
12%
10%
3%
54%
31%
Reader / Idle
395
420
6%
353
-11%
612
55%
WiFi v1.3
263
240
-9%
290
10%
252
-4%
461
75%
329
25%
Load
58
80
38%
72
24%
77
33%
79
36%
H.264
447
456

Pro

+ eindelijk een privacy shutter voor de webcam
+ levendig mini-LED HDR1000-beeldscherm
+ tGP grafische processor van 175 W op vol vermogen
+ Thunderbolt 5 ondersteuning
+ Wi-Fi 7 ondersteuning

Contra

- vrijwel identieke prestaties als de 2023 Blade 18
- geen grote verbeteringen aan de batterijlevensduur
- de nieuwe "Turbo"-modus voelt overbodig aan
- geen OLED of 4K mini-LED
- geen iGPU-only modus

Verdict - Alles over die nieuwe weergaveopties

In review: Razer Blade 18 2024

Met geen nieuwe Nvidia GPU's om dit jaar te integreren en geen echte voordelen van de nieuwe Raptor Lake-HX vernieuwingsreeks, moest Razer elders kijken om de 2024 Blade 18 aantrekkelijker te maken dan zijn visueel identieke 2023 voorganger. In dit geval bevat het nieuwste model nieuwe schermopties naast Thunderbolt 5-ondersteuning om een van de eerste gaming laptops op de markt te zijn met zowel mini-LED als de volgende generatie Thunderbolt. Andere kleinere updates zoals Wi-Fi 7 en een sluiter voor de webcam zijn welkom, maar desalniettemin slechts kleine upgrades. Gamers die niet gecharmeerd zijn van deze specifieke functies kunnen beter de 2023 Blade 18 die dezelfde gamingprestaties en gebruikerservaring biedt voor honderden dollars minder.

Thunderbolt 5, mini-LED en Wi-Fi 7 helpen om de 2024 Blade 18 van vroeger te onderscheiden. Prestatiejagers zullen echter geen grote verschillen vinden tussen de 2023 en 2024 modellen.

Wat mini-LED op laptops betreft, is het paneel op zijn best met zowel HDR als lokaal dimmen actief voor ondersteunde games en video. Anders moet u de lokale dimfunctie continu in- en uitschakelen, afhankelijk van uw werkbelasting, om het halo-effect te voorkomen. Als u van plan bent om de Blade 18 voornamelijk voor games en multimedia te gebruiken, dan is het 2K mini-LED scherm wellicht de optimale optie. Gebruikers die HDR zelden inschakelen en de Blade 18 voornamelijk willen gebruiken voor professionele doeleinden, zoals het maken van content, bewerkingen of CAD-werk, zouden daarentegen de 4K IPS-configuratie met hogere resolutie moeten overwegen, die goed past bij het grote 18-inch schermformaat. Razer heeft in dit opzicht beide kanten van de medaille gedekt.

Tot slot is het de moeite waard om te vermelden dat 4K mini-LED beschikbaar is op de MSI Titan 18 terwijl dit ontbreekt op de Razer. Het nadeel is dat het MSI-systeem geen G-Sync ondersteunt en er dus voorlopig geen "ultiem" 18-inch mini-LED-paneel is.

Prijs en beschikbaarheid

Amazon verzendt onze mini-LED configuratie nu voor $4500 USD. Gebruikers kunnen ook rechtstreeks bij Razer kopen met meer configuratieopties tussen de 2023 en 2024 modellen.

Razer Blade 18 2024 RZ09-0509 - 05-05-2024 v7 (old)
Allen Ngo

Behuizing
91 / 98 → 92%
Toetsenbord
83%
Aanwijsapparaat
89%
Aansluitmogelijkheden
0 / 80 → 0%
Gewicht
56 / 10-66 → 81%
Batterij
60 / 95 → 63%
Beeldscherm
93%
Gaming-performance
100%
Applicatie-performance
97%
Temperatuur
87 / 95 → 92%
Luidheid
73 / 90 → 81%
Audio
89%
Camera
48 / 85 → 56%
Gemiddelde
80%
91%
Gaming - Gewogen Gemiddelde

Transparency

The selection of devices to be reviewed is made by our editorial team. The test sample was provided to the author as a loan by the manufacturer or retailer for the purpose of this review. The lender had no influence on this review, nor did the manufacturer receive a copy of this review before publication. There was no obligation to publish this review. We never accept compensation or payment in return for our reviews. As an independent media company, Notebookcheck is not subjected to the authority of manufacturers, retailers or publishers.

This is how Notebookcheck is testing

Every year, Notebookcheck independently reviews hundreds of laptops and smartphones using standardized procedures to ensure that all results are comparable. We have continuously developed our test methods for around 20 years and set industry standards in the process. In our test labs, high-quality measuring equipment is utilized by experienced technicians and editors. These tests involve a multi-stage validation process. Our complex rating system is based on hundreds of well-founded measurements and benchmarks, which maintains objectivity. Further information on our test methods can be found here.

Price comparison

Please share our article, every link counts!
> Overzichten en testrapporten over laptops en mobieltjes > Testrapporten > Razer Blade 18 2024 recensie: Eerste laptop op de markt met zowel mini-LED als Thunderbolt 5
Allen Ngo, 2024-05- 7 (Update: 2024-08-15)