

MSI Raider 18 HX A14V test: Titan prestaties zonder de Titan prijs
")
Grotere 18-inch gaming laptops maken een soort comeback nu de line-up gestaag blijft uitbreiden. MSI biedt al de "ultieme" 18-inch gamingervaring met de Titan 18 HXmaar dit nieuwste Raider 18 HX-model is een niveau lager qua functies om de instapdrempel te verlagen.
Onze testunit is een middelste configuratie met de Raptor Lake-R Core i9-14900HX CPU, 175 W GeForce RTX 4080 GPU en 3840 x 2400 120 Hz Mini-LED scherm voor ongeveer $3200 retail. Andere SKU's zijn de Zen 4 Ryzen 9 7945HX, RTX 4070, RTX 4090 of QHD+ 2560 x 1600 240 Hz IPS-beeldscherm.
Concurrenten voor de Raider 18 HX zijn andere 18-inch gaming laptops zoals de Razer Blade 18, Alienware m18 R2of Asus ROG Strix G18.
Meer MSI beoordelingen:
Potentiële concurrenten in vergelijkings
Evaluatie | Versie | Datum | Model | Gewicht | Hoogte | Formaat | Resolutie | Beste prijs |
|---|---|---|---|---|---|---|---|---|
| 84.7 % | v8 | 09-2024 | MSI Raider 18 HX A14V i9-14900HX, NVIDIA GeForce RTX 4080 Laptop GPU | 3.6 kg | 32 mm | 18.00" | 3840x2400 | |
| 90.5 % v7 (old) | v7 (old) | 05-2024 | Razer Blade 18 2024 RZ09-0509 i9-14900HX, NVIDIA GeForce RTX 4090 Laptop GPU | 3.1 kg | 21.9 mm | 18.00" | 2560x1600 | |
| 89.5 % v7 (old) | v7 (old) | 03-2024 | Alienware m18 R2 i9-14900HX, NVIDIA GeForce RTX 4090 Laptop GPU | 4 kg | 26.7 mm | 18.00" | 2560x1600 | |
| 88.8 % v7 (old) | v7 (old) | 01-2024 | MSI Titan 18 HX A14VIG i9-14900HX, NVIDIA GeForce RTX 4090 Laptop GPU | 3.6 kg | 32.1 mm | 18.00" | 3840x2400 | |
| 87.4 % v7 (old) | v7 (old) | 03-2023 | Asus ROG Strix G18 G814JI i7-13650HX, NVIDIA GeForce RTX 4070 Laptop GPU | 3 kg | 31 mm | 18.00" | 2560x1600 | |
| 87.1 % v7 (old) | v7 (old) | 03-2024 | Acer Predator Helios 18 PH18-72-98MW i9-14900HX, NVIDIA GeForce RTX 4090 Laptop GPU | 3.3 kg | 29.5 mm | 18.00" | 2560x1600 |
Opmerking: We hebben ons beoordelingssysteem onlangs bijgewerkt en de resultaten van versie 8 zijn niet vergelijkbaar met de resultaten van versie 7. Meer informatie is beschikbaar hier .
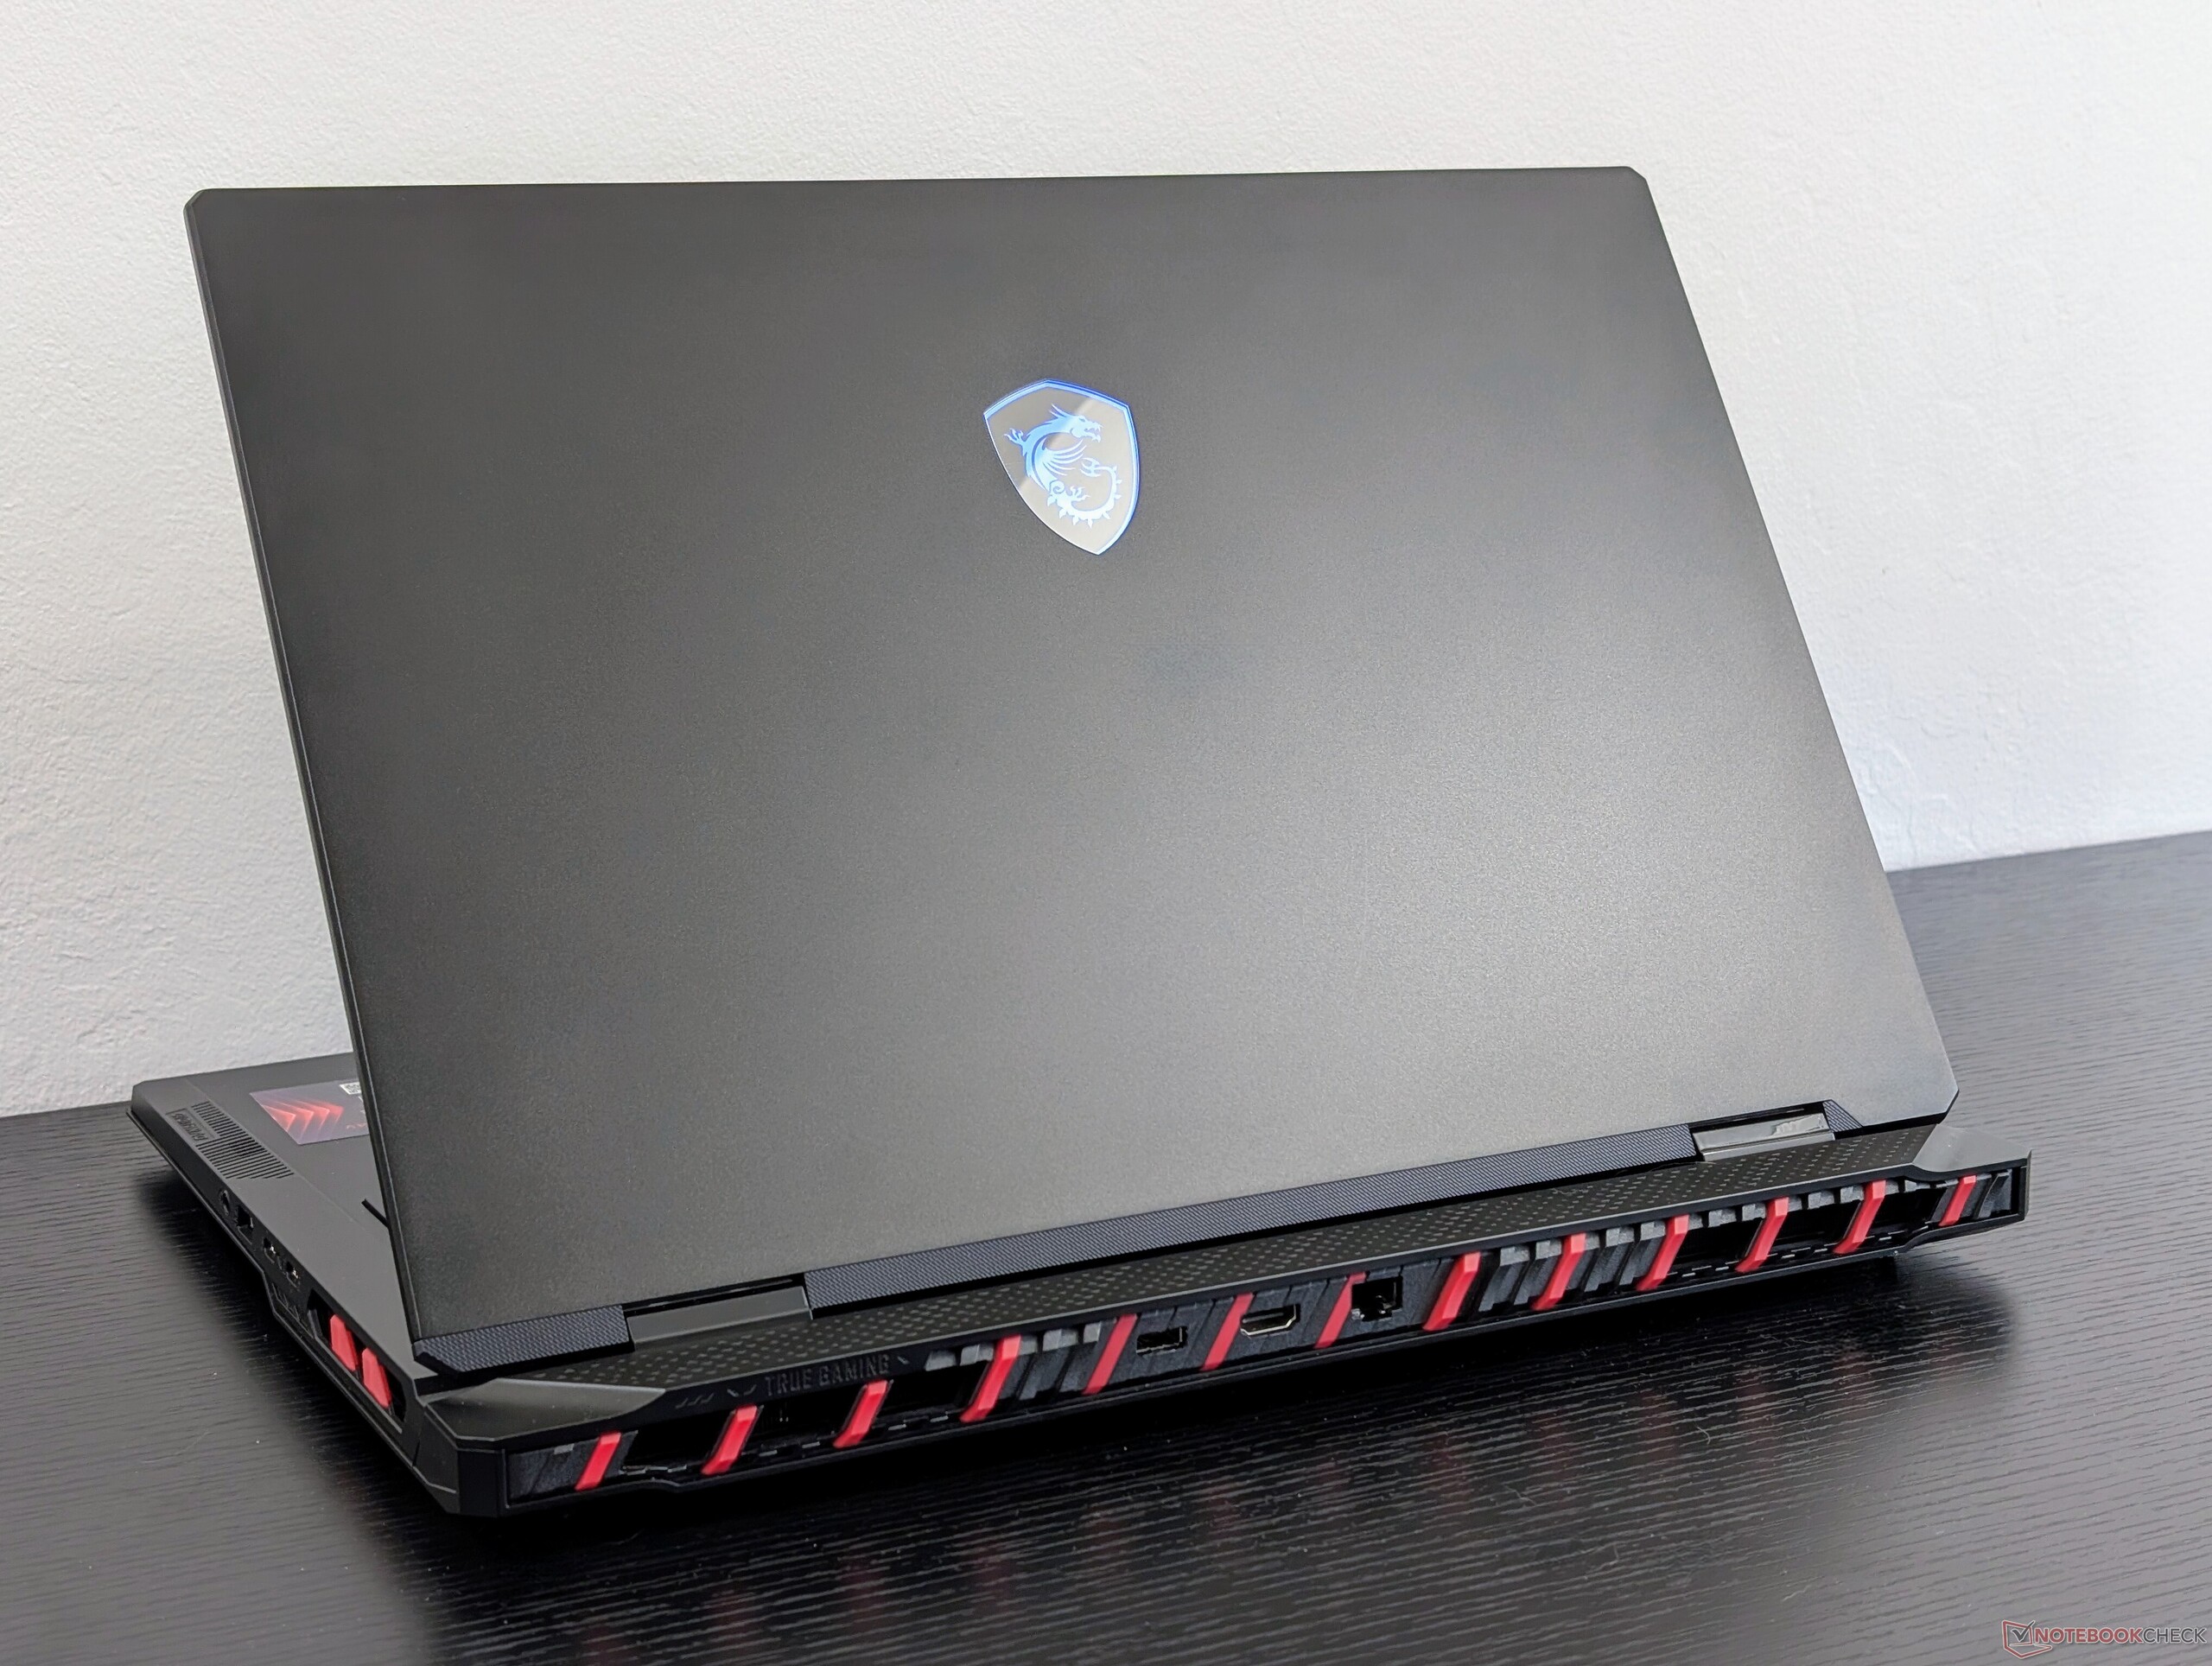
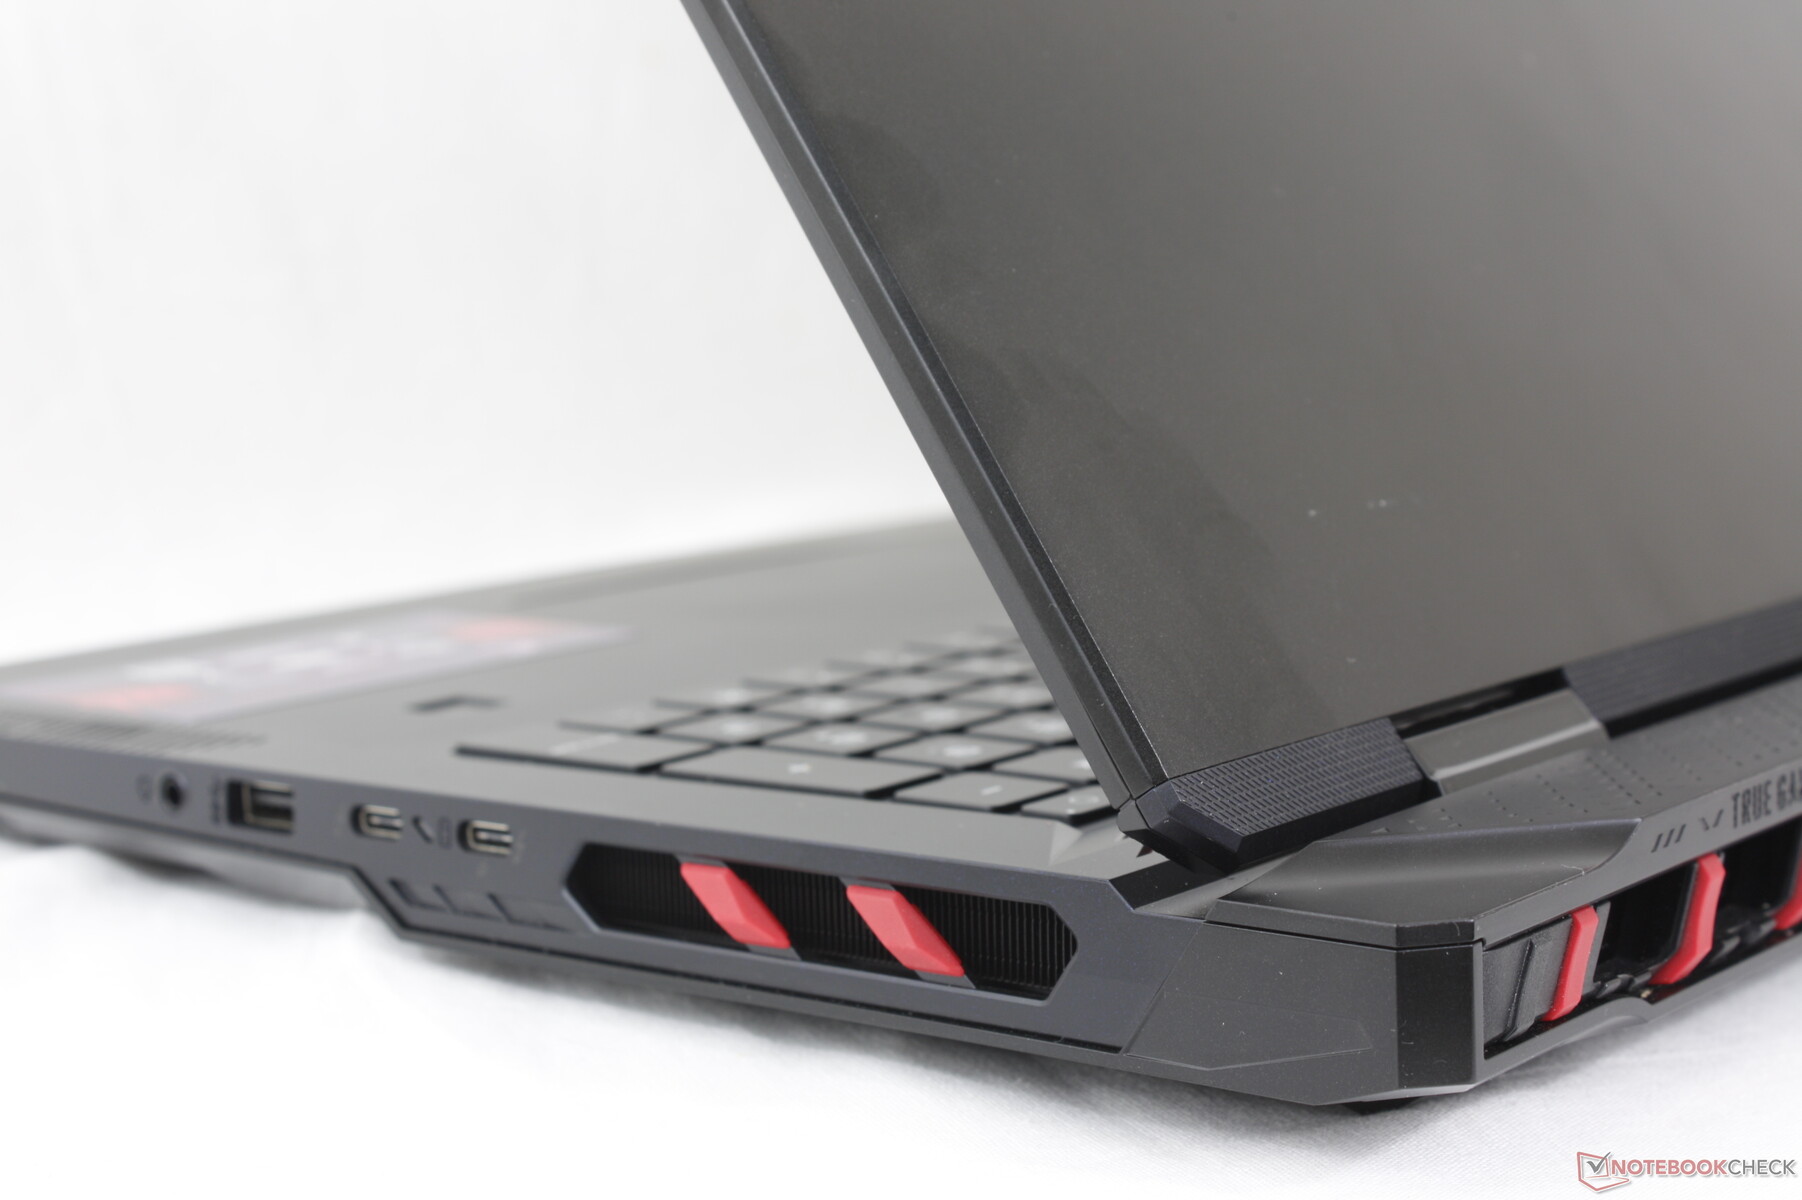
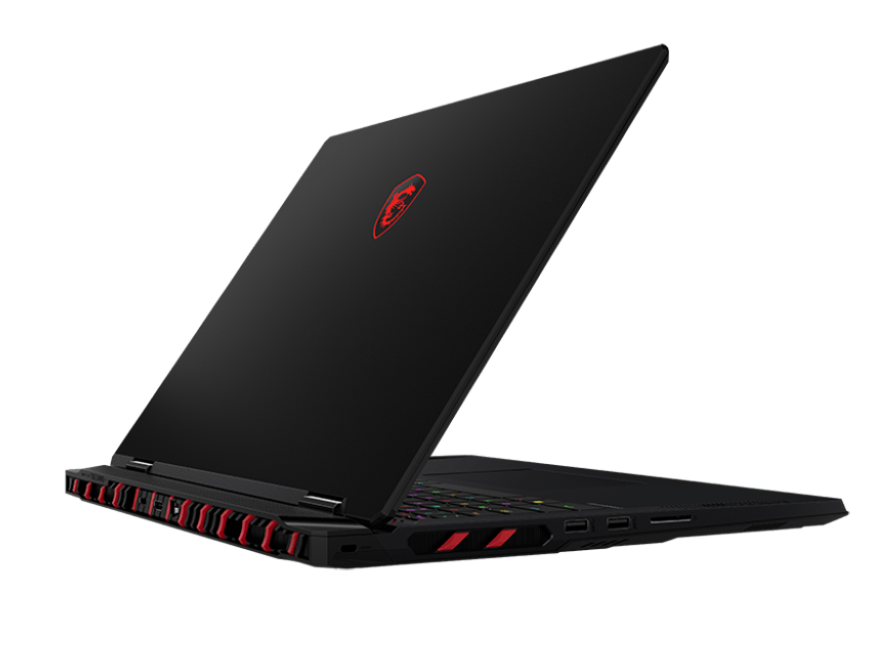
Case - Van blauwe draak tot rode draak
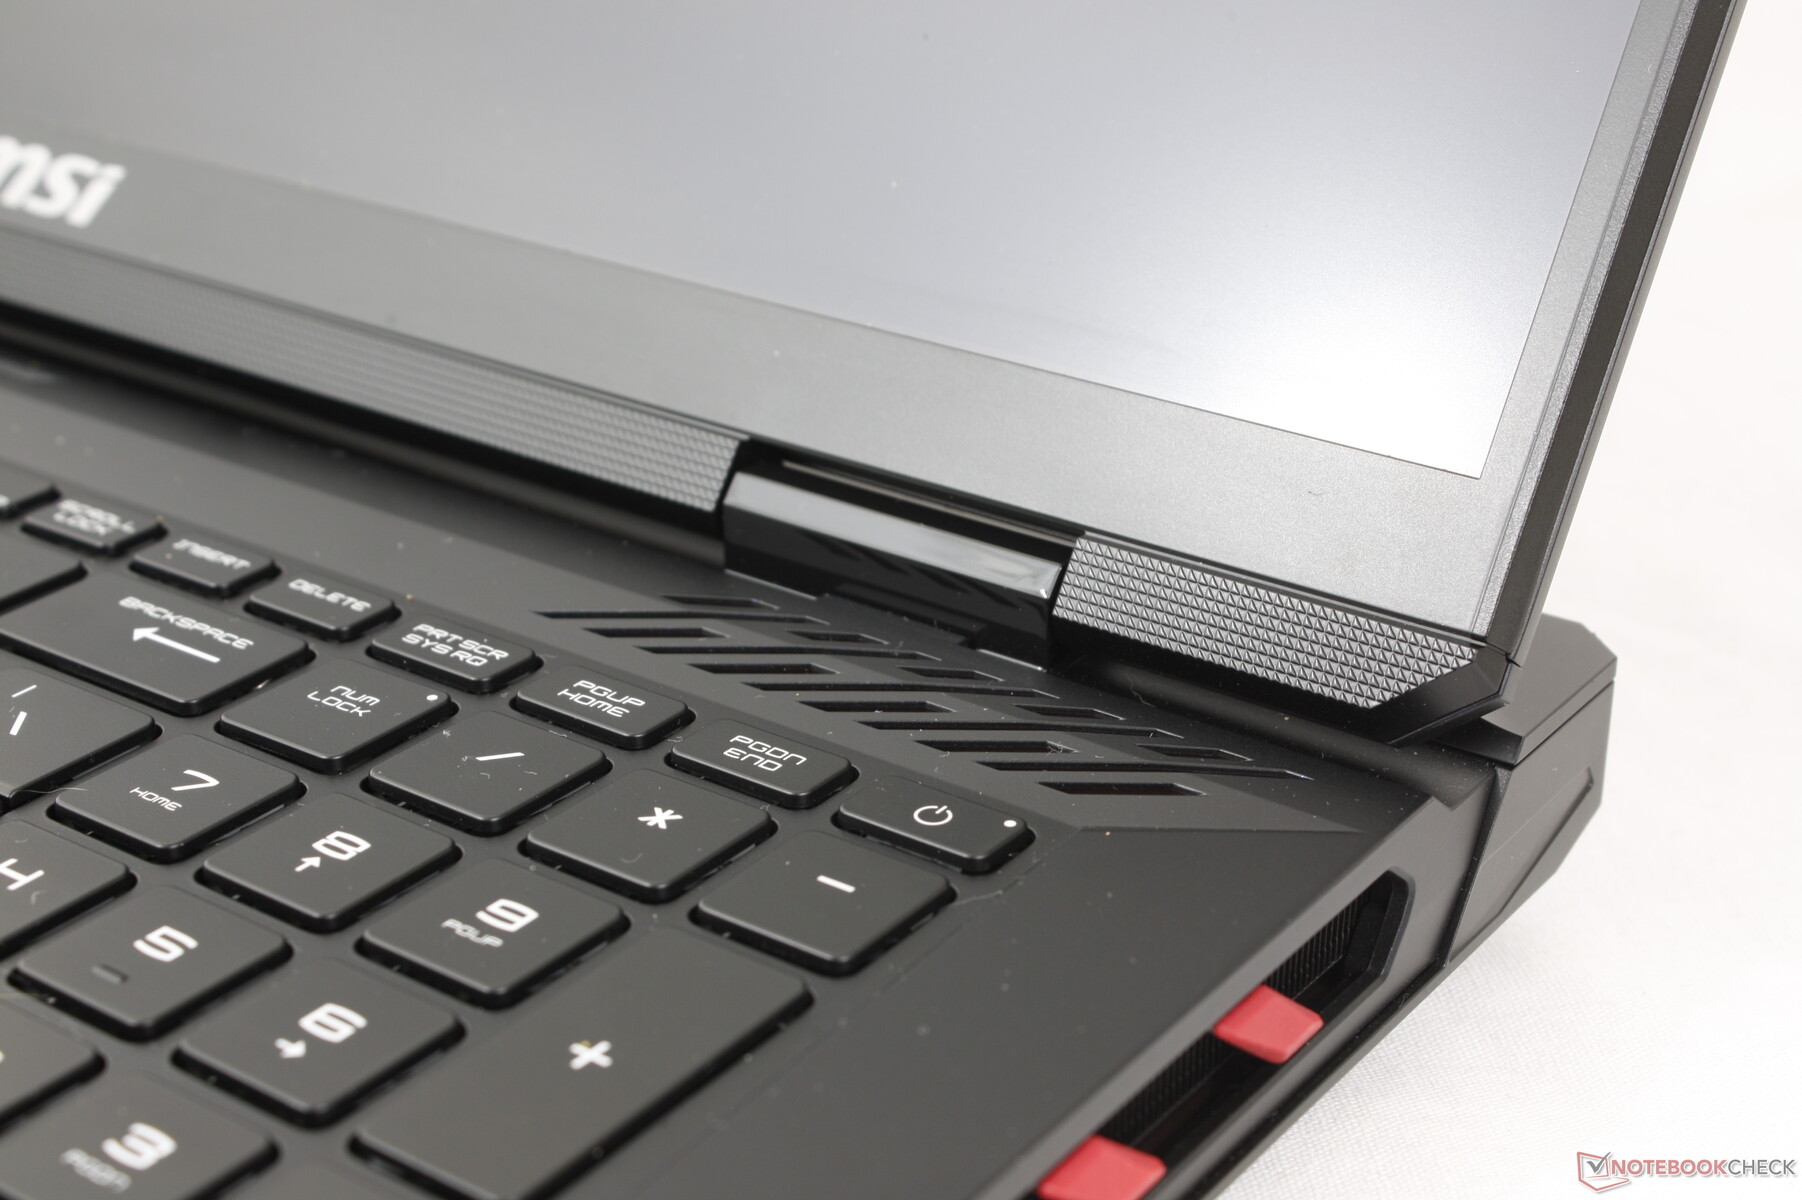
Het chassis is een afgeleide van de Titan 18 HX. De rode accenten van de Titan zijn in plaats daarvan blauw op de nieuwe Raider en de meeste oppervlakken zijn gitzwart in plaats van grijs of zilver voor een algehele donkerdere look. MSI heeft ook een LED-balk toegevoegd langs de voorkant van het systeem, terwijl deze ontbrak op de Titan. De veranderingen zijn grotendeels esthetisch en dus voelt de Raider nog steeds even sterk aan als zijn duurdere broertje of zusje, aangezien de onderliggende materialen en het skelet hetzelfde zijn.
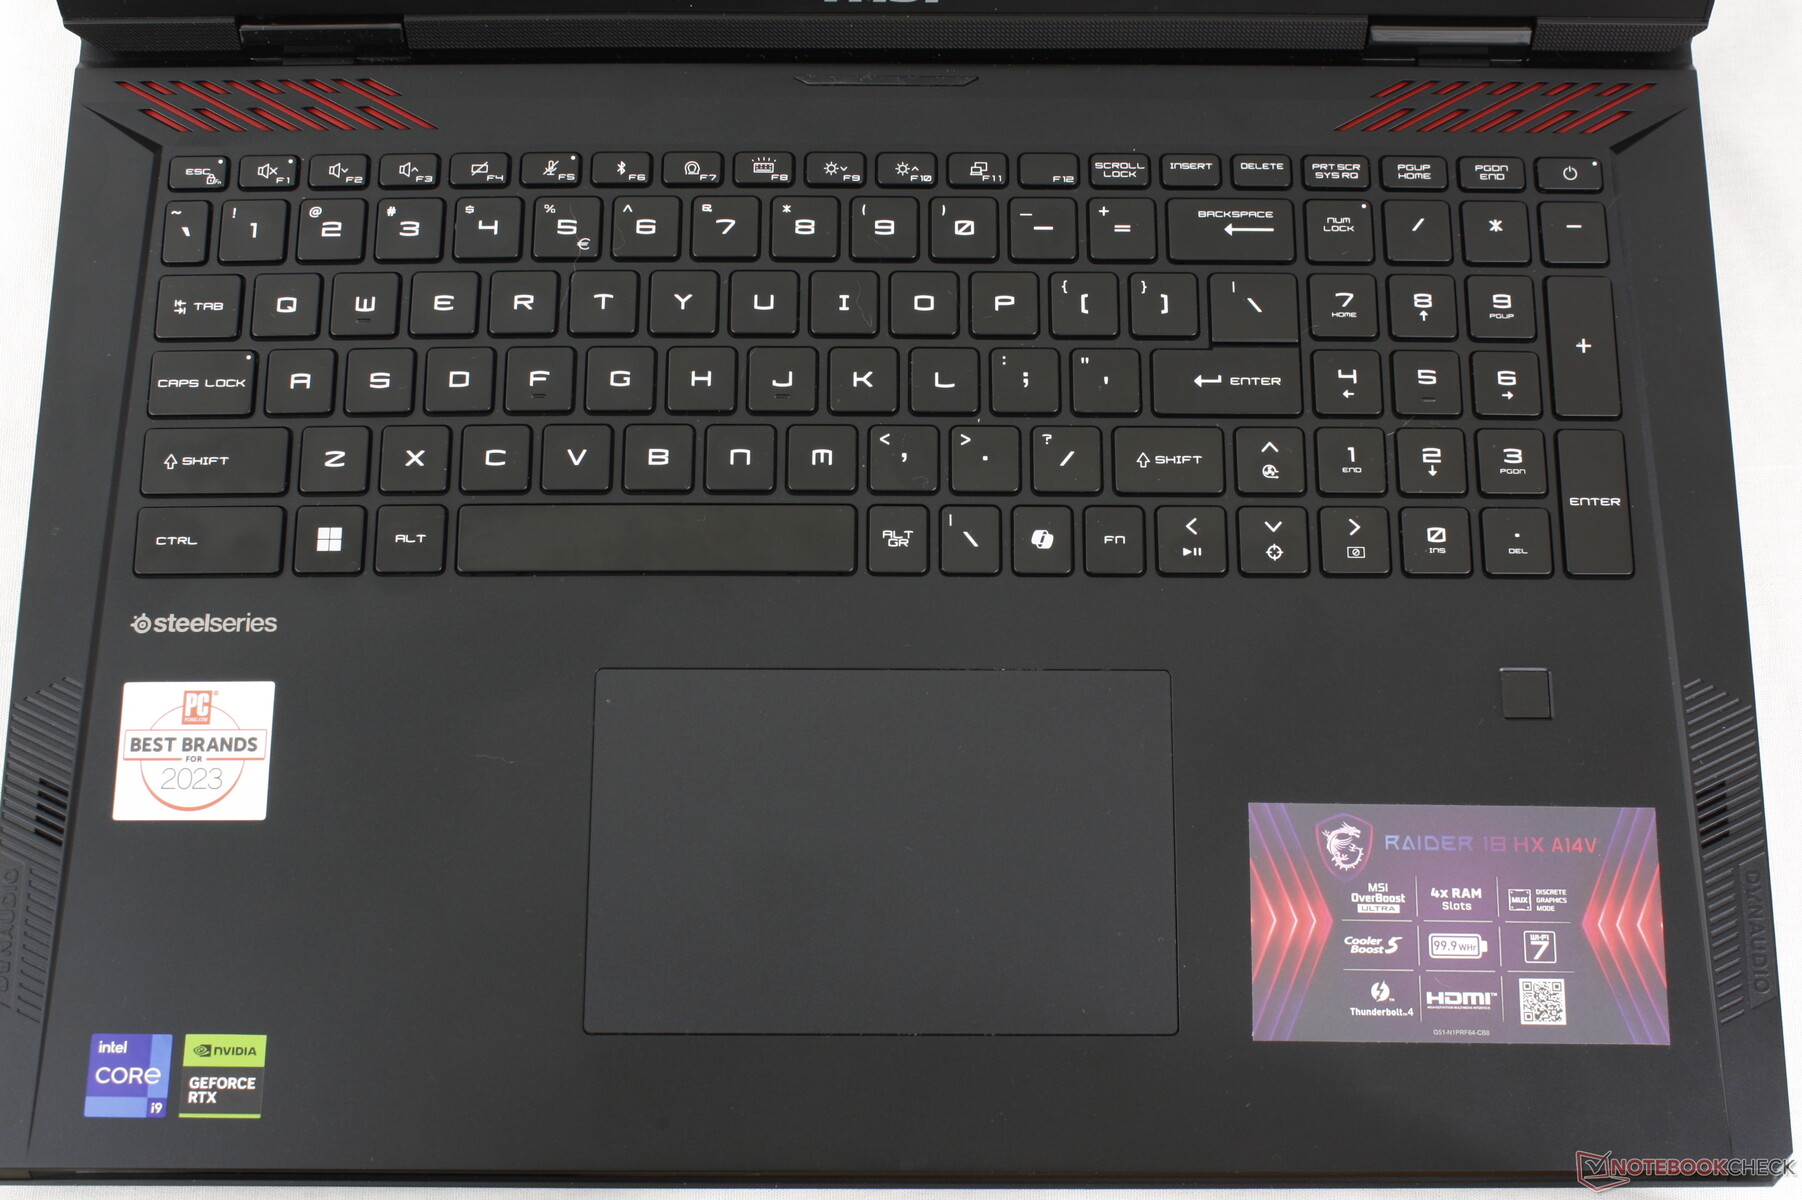
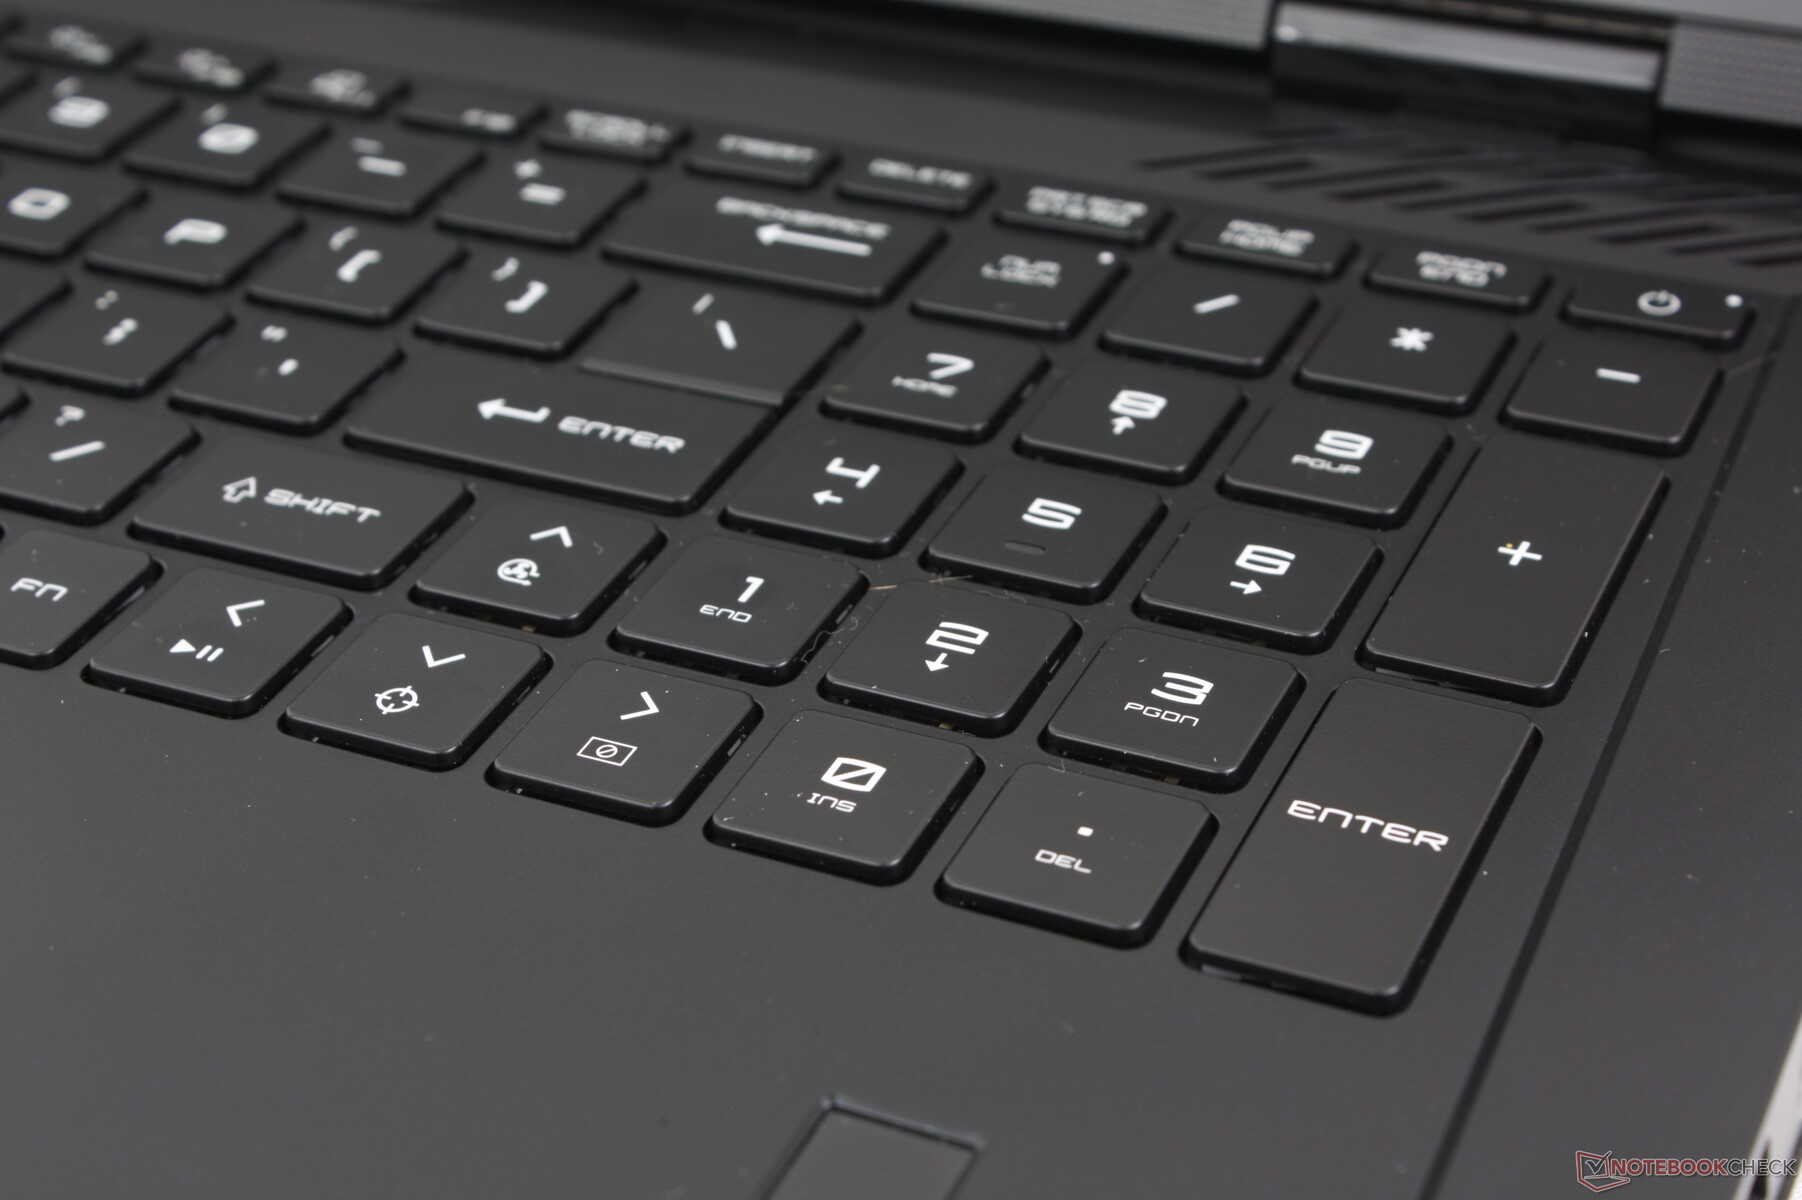
Misschien wel het meest opvallende visuele verschil tussen de Raider 18 HX en Titan 18 HX is het opnieuw ontworpen toetsenbord. Terwijl de Titan 18 HX een vlakker toetsenbord heeft met een fancy glazen paneel dat zich uitstrekt over de palmsteunen en het clickpad, kiest de Raider voor een traditionelere aanpak zonder glas en met alleen een basis clickpad.
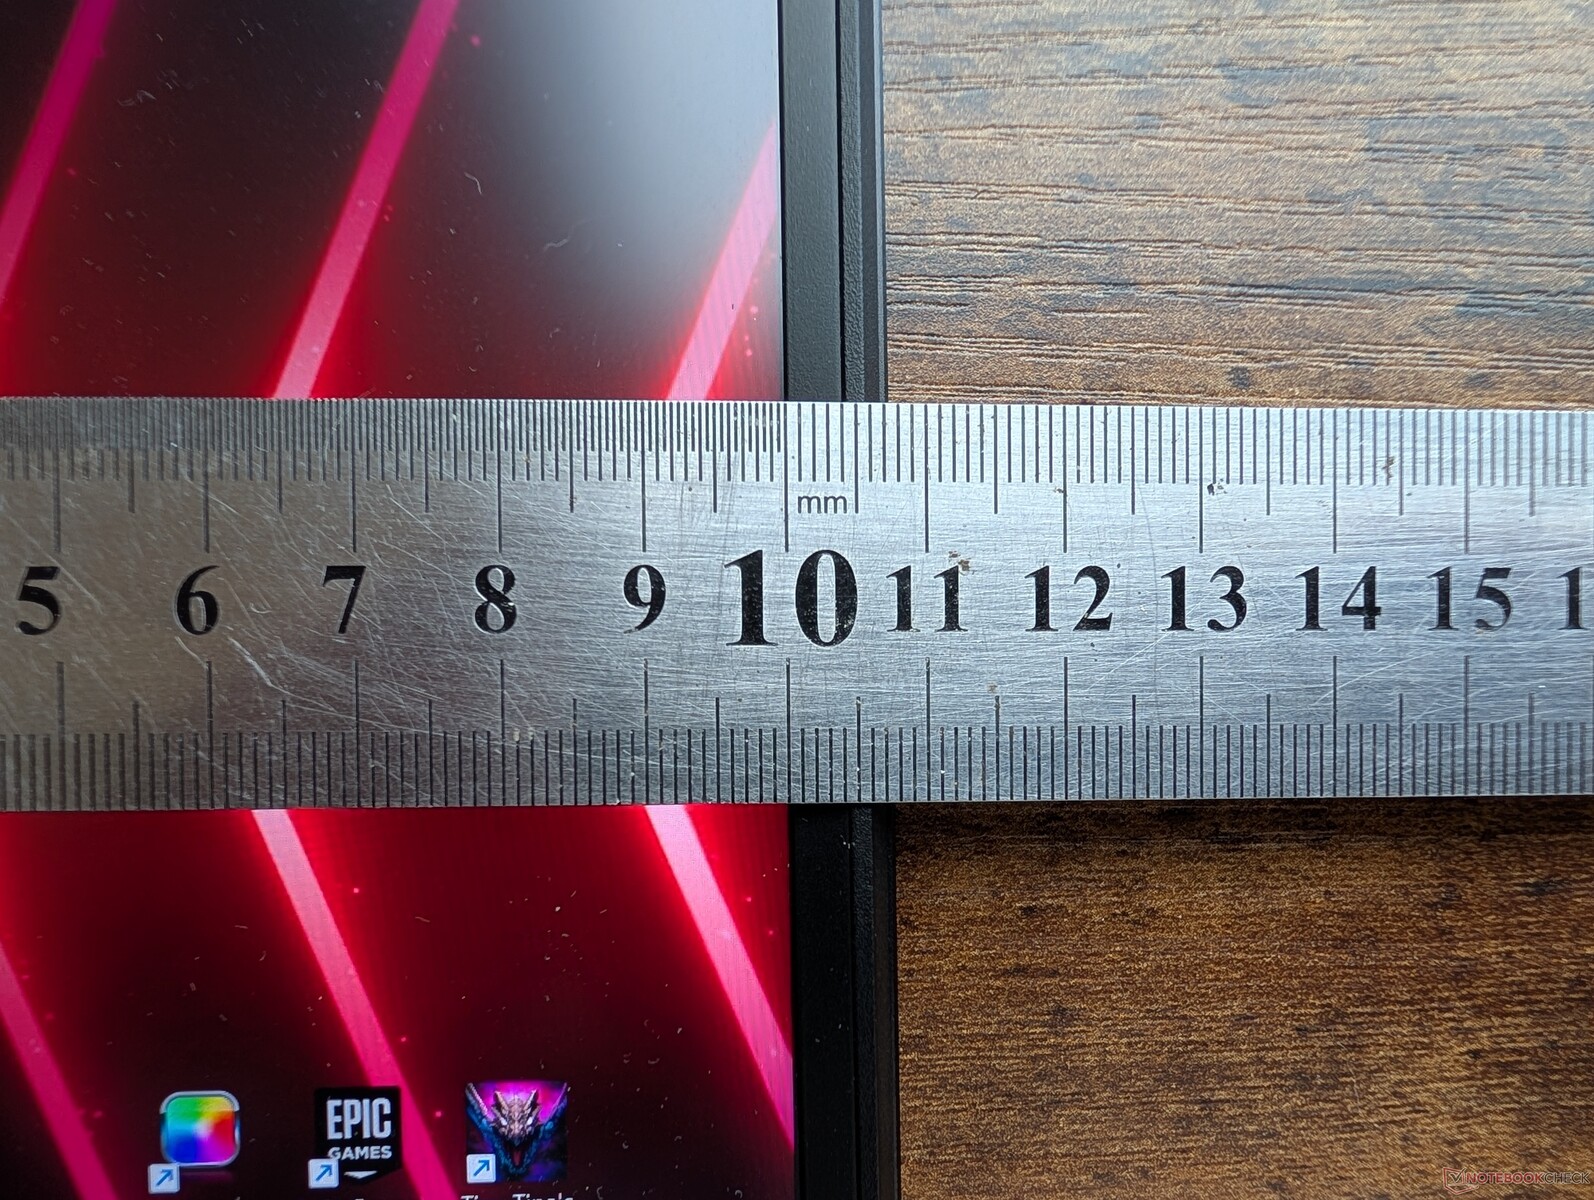
De afmetingen en het gewicht zijn vrijwel identiek aan die van de Titan 18 HX, ondanks alle uiterlijke verschillen. Het model zit daarom in de middenmoot wat draagbaarheid betreft, net als alternatieven zoals de Alienware m18 R2 zwaarder en groter zijn, terwijl de ROG Strix G18 of Blade 18 elk veel lichter zijn.
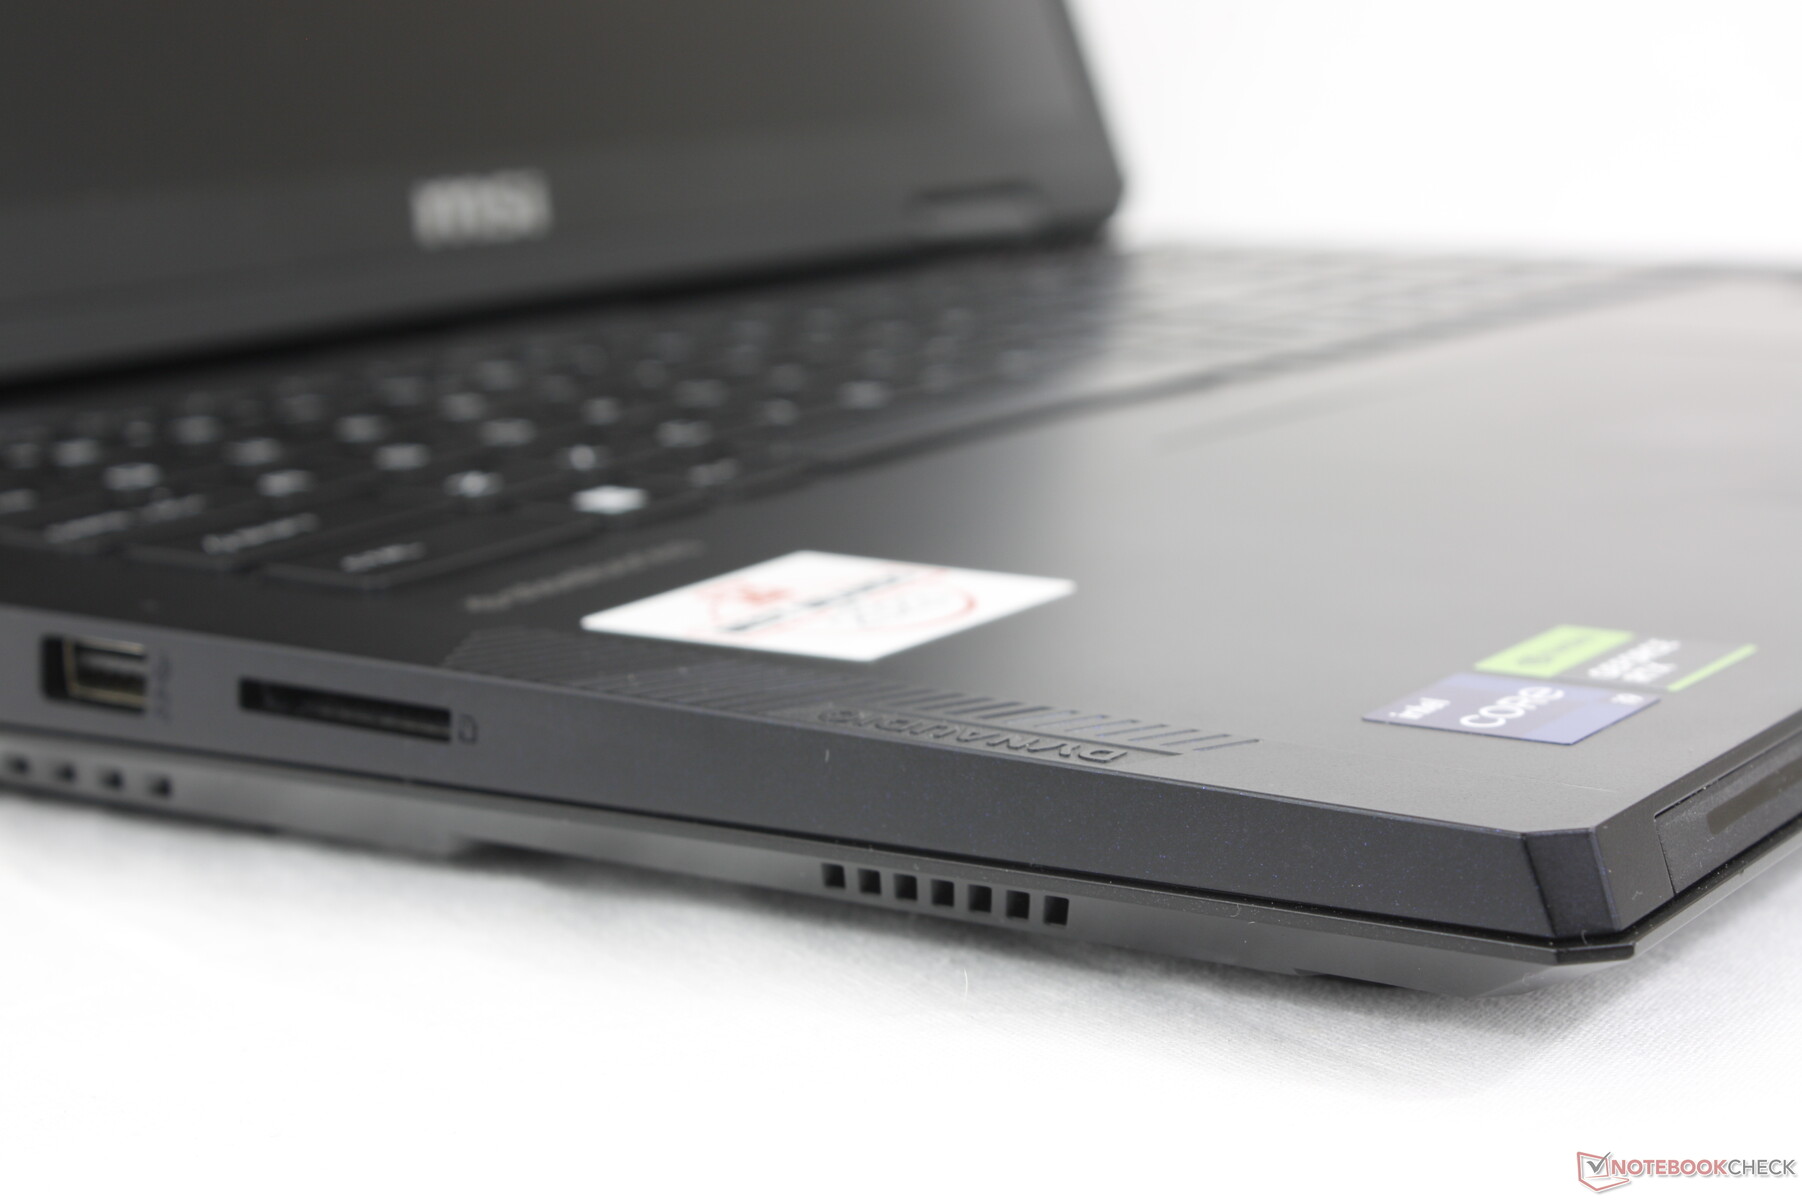
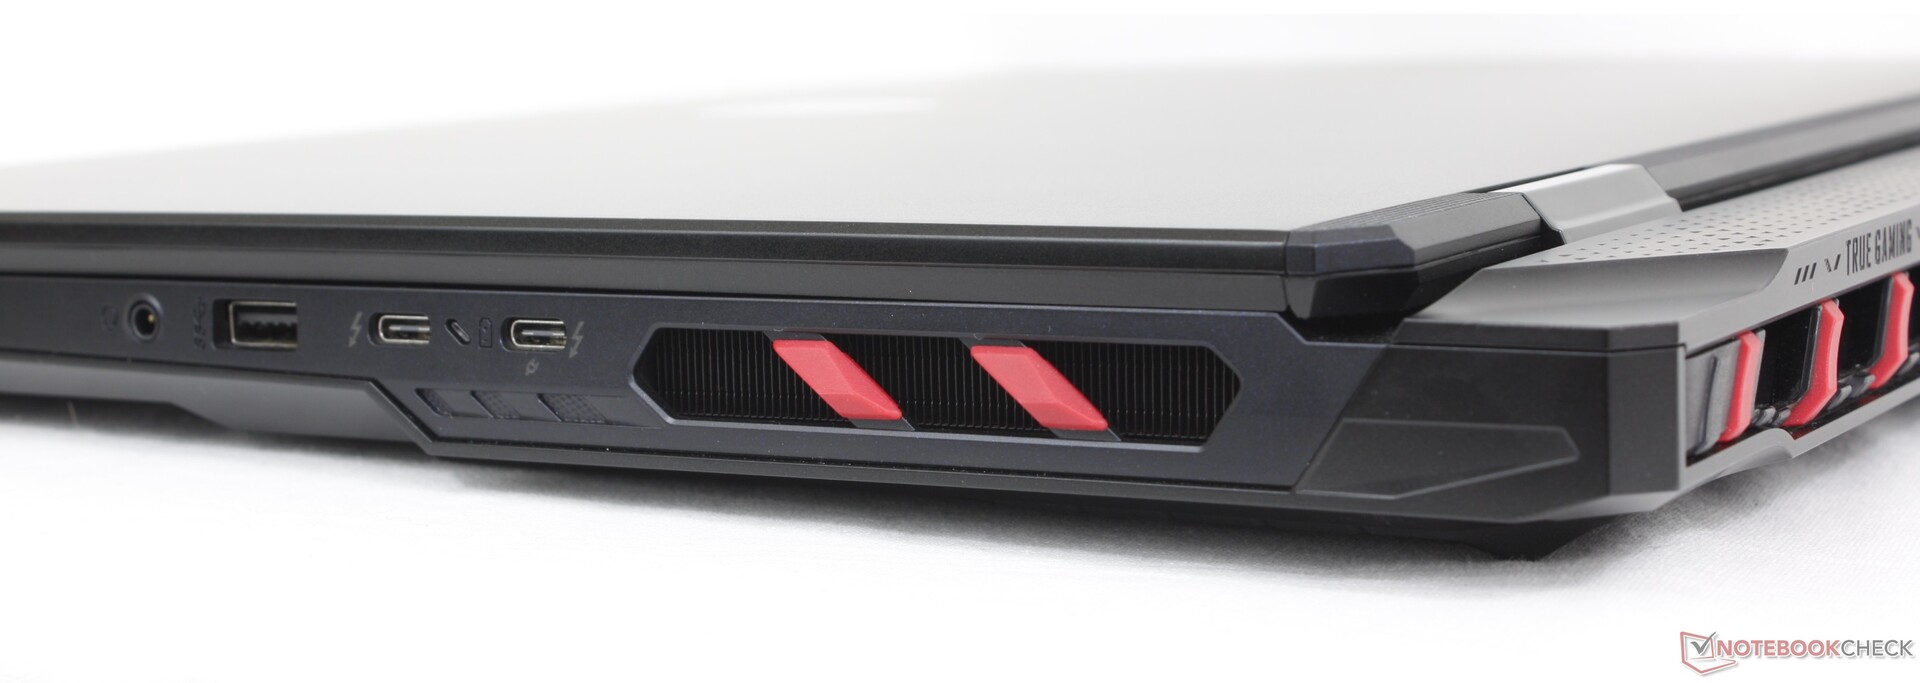
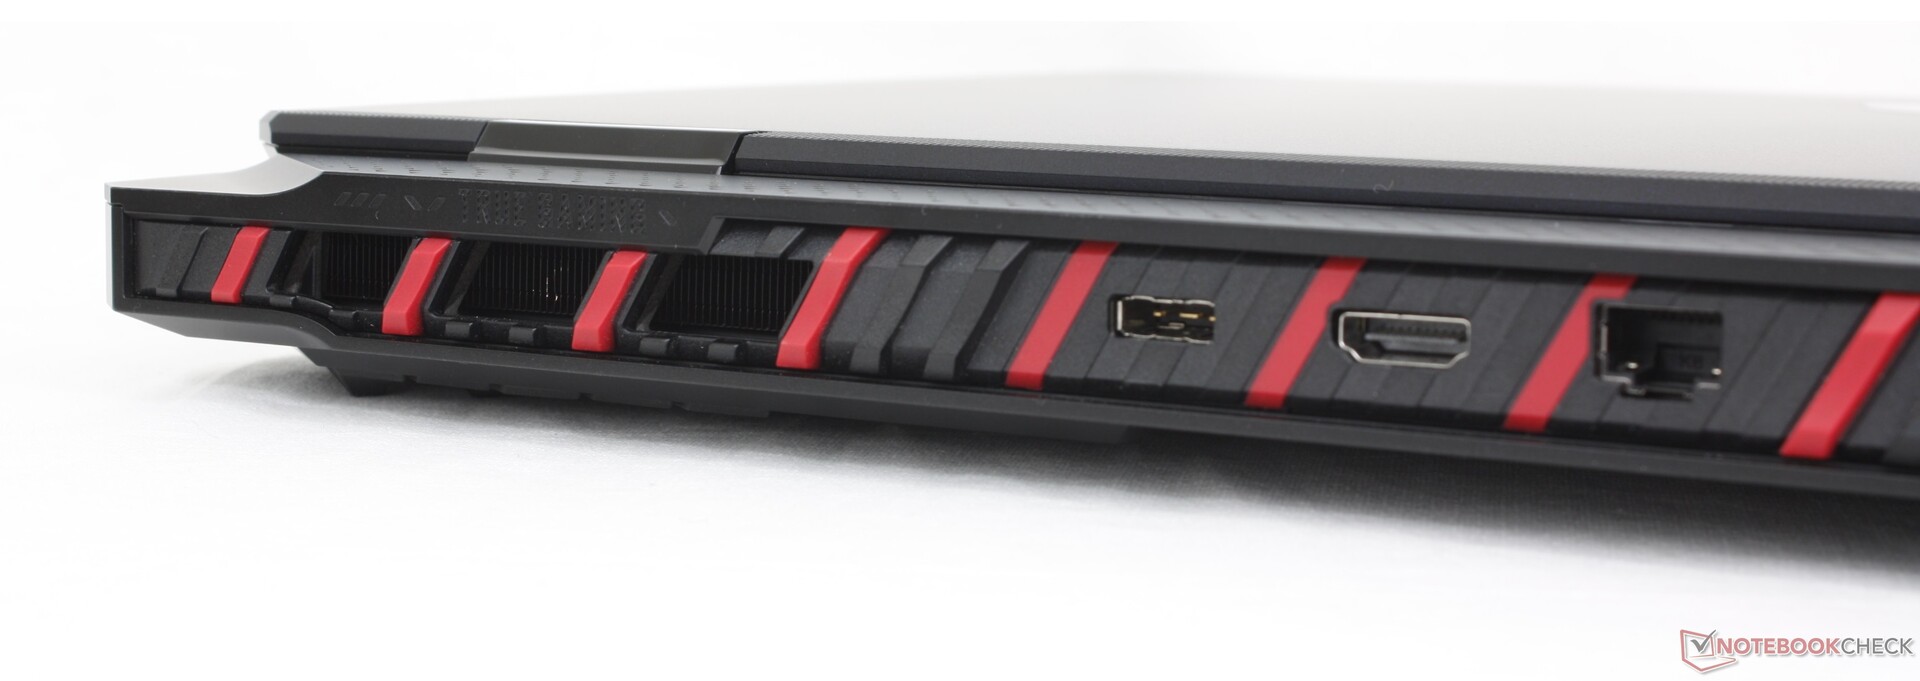
Connectiviteit
De poorten en positionering zijn identiek aan die van de Titan 18 HX, wat een grote hint is over wat u onder de motorkap kunt verwachten. De geïntegreerde opties zijn vergelijkbaar met wat u vindt op de Blade 18 of de ROG Strix G18, zij het in heel andere combinaties.
Houd er rekening mee dat slechts één van de twee USB-C poorten Power Delivery ondersteunt. Beide zijn verder compatibel met DisplayPort.

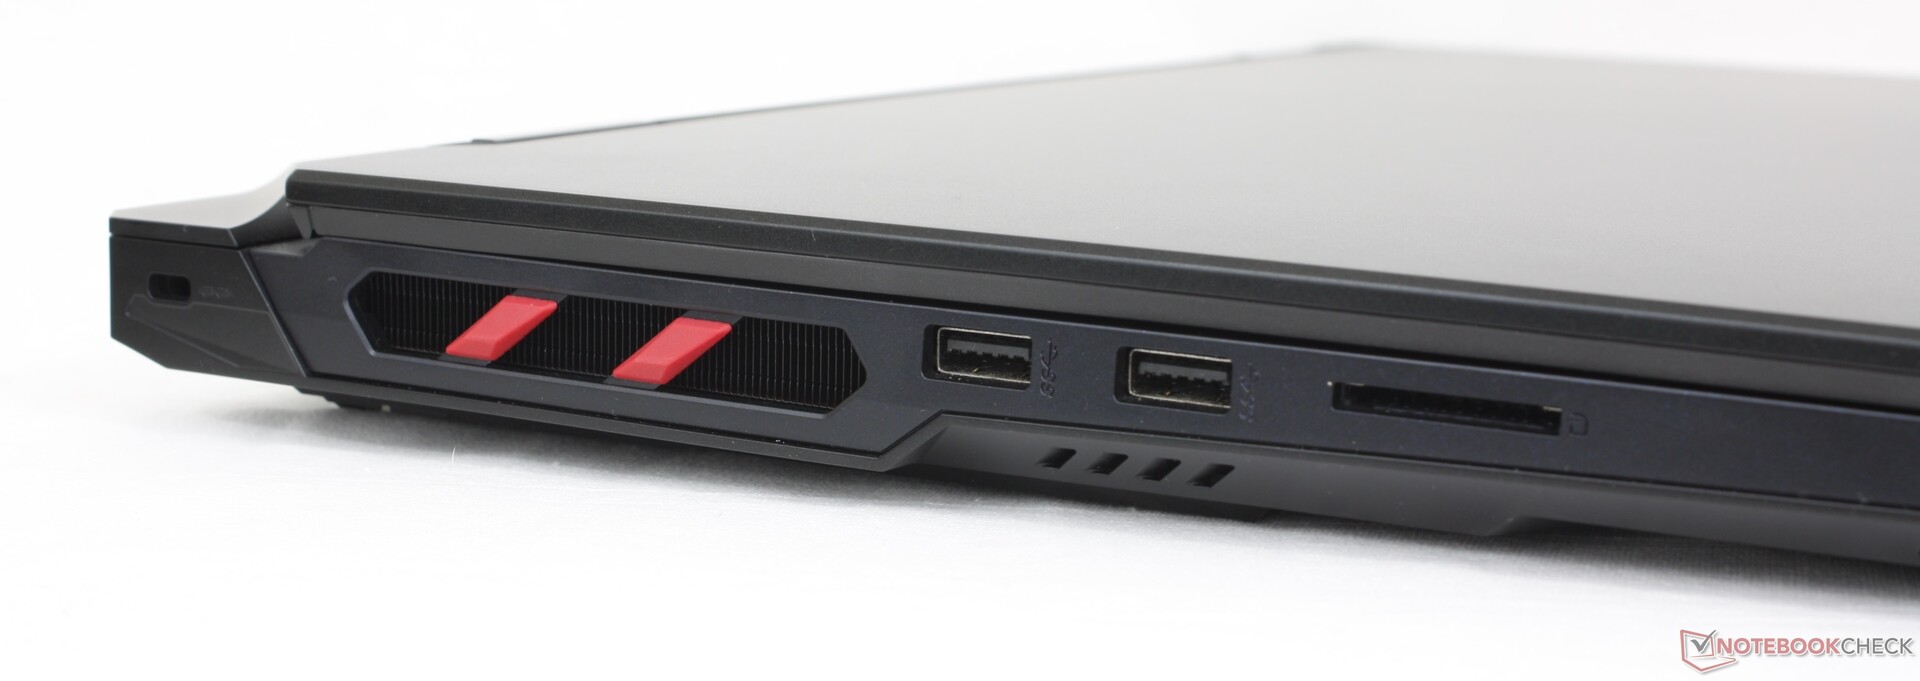
SD-kaartlezer
Met ongeveer 90 MB/s is de geïntegreerde SD-lezer behoorlijk, maar verder traag in verhouding tot de hoge prijs van de Raider 18 HX. De SD-kaartlezers op de Razer Blade 18 of Alienware m18 R2zijn in vergelijking meer dan twee keer zo snel.
| SD Card Reader | |
| average JPG Copy Test (av. of 3 runs) | |
| Alienware m18 R2 (Toshiba Exceria Pro SDXC 64 GB UHS-II) | |
| Razer Blade 18 2024 RZ09-0509 (Toshiba Exceria Pro SDXC 64 GB UHS-II) | |
| Acer Predator Helios 18 PH18-72-98MW (AV PRO microSD 128 GB V60) | |
| MSI Raider 18 HX A14V (Toshiba Exceria Pro SDXC 64 GB UHS-II) | |
| MSI Titan 18 HX A14VIG (Toshiba Exceria Pro SDXC 64 GB UHS-II) | |
| maximum AS SSD Seq Read Test (1GB) | |
| Razer Blade 18 2024 RZ09-0509 (Toshiba Exceria Pro SDXC 64 GB UHS-II) | |
| Alienware m18 R2 (Toshiba Exceria Pro SDXC 64 GB UHS-II) | |
| MSI Titan 18 HX A14VIG (Toshiba Exceria Pro SDXC 64 GB UHS-II) | |
| MSI Raider 18 HX A14V (Toshiba Exceria Pro SDXC 64 GB UHS-II) | |
| Acer Predator Helios 18 PH18-72-98MW (AV PRO microSD 128 GB V60) | |
Communicatie
De Killer BE1750x wordt standaard geleverd met Wi-Fi 7 en Bluetooth 5.4 connectiviteit. De overdrachtsnelheden zijn stabiel en betrouwbaar bij koppeling met onze Wi-Fi 6E testrouter.
Webcam
Een 2 MP webcam met IR en fysieke sluiter is standaard, net als op de Titan 18 HX. Interessant genoeg zou de camera ook soortgelijke helderheidsproblemen vertonen.


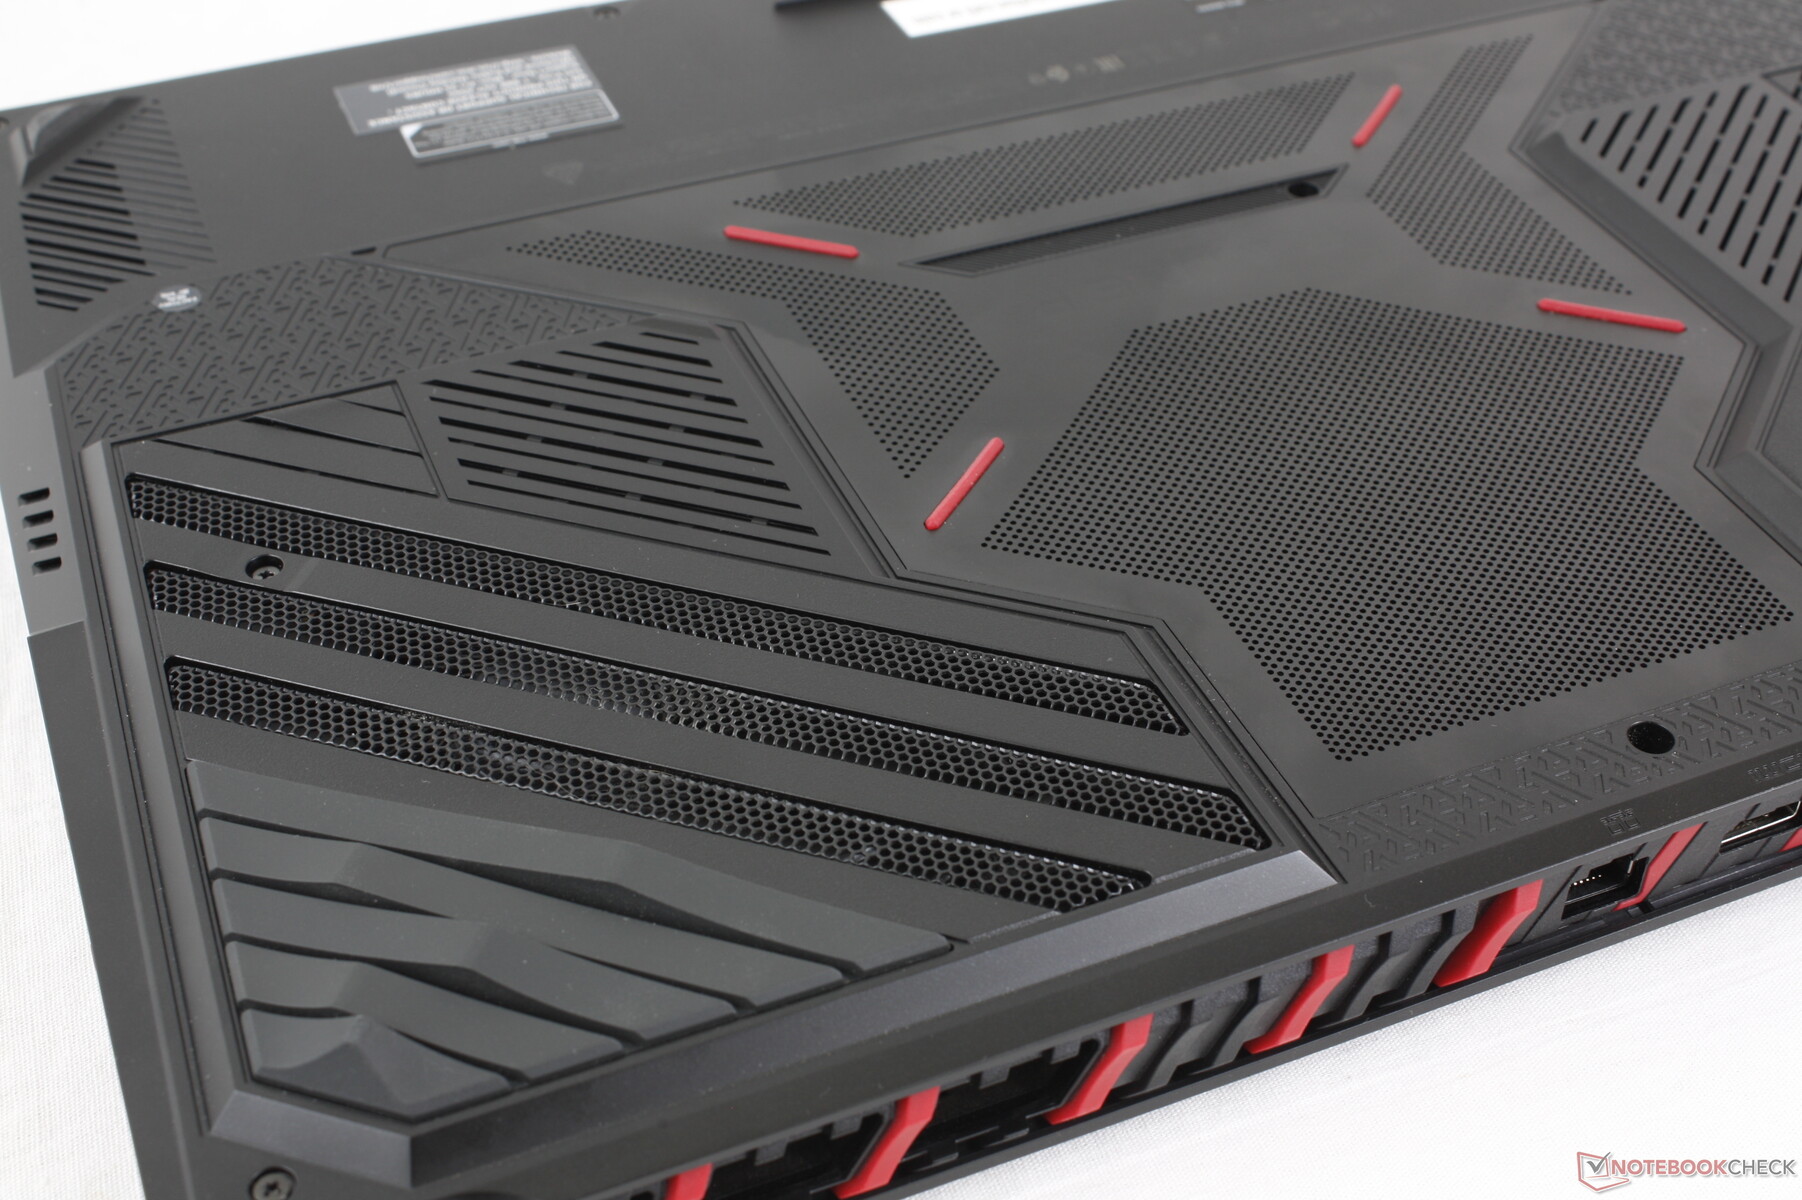
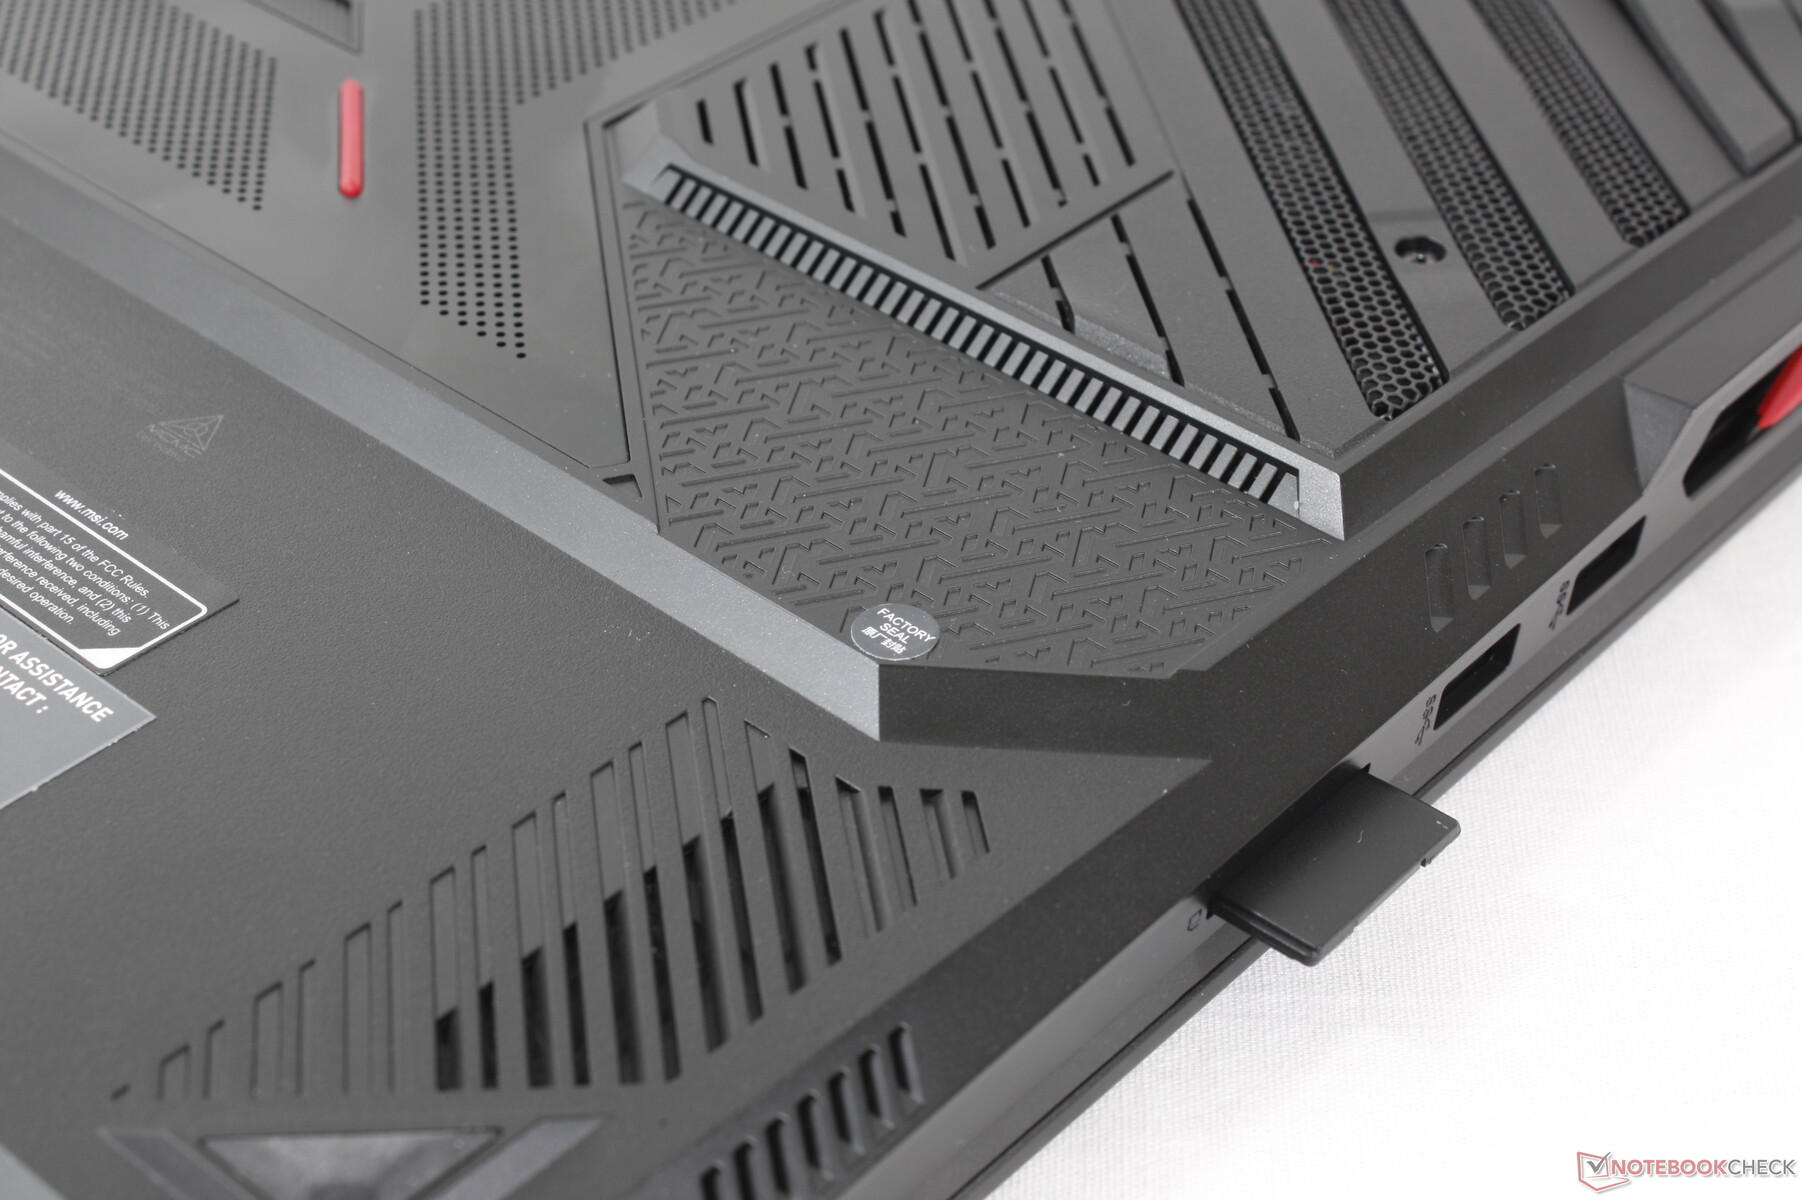
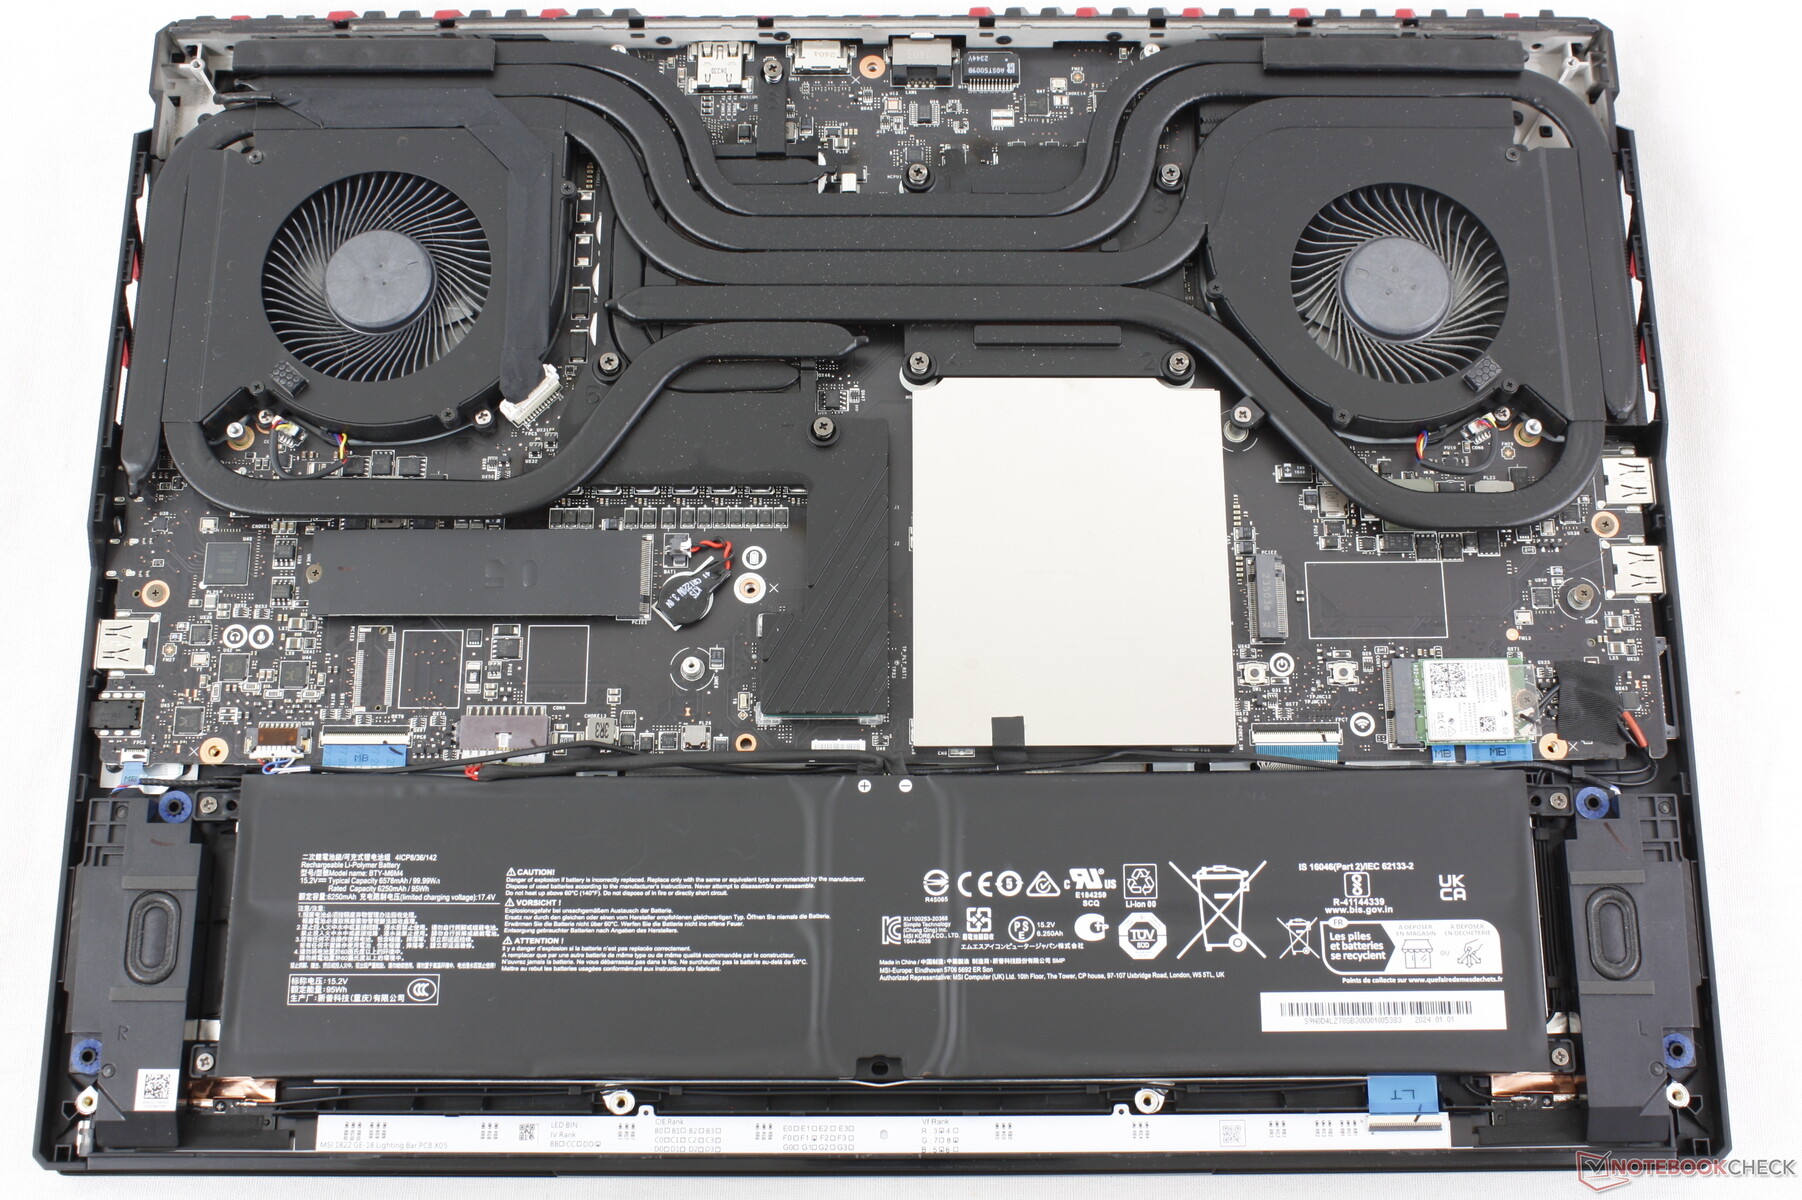
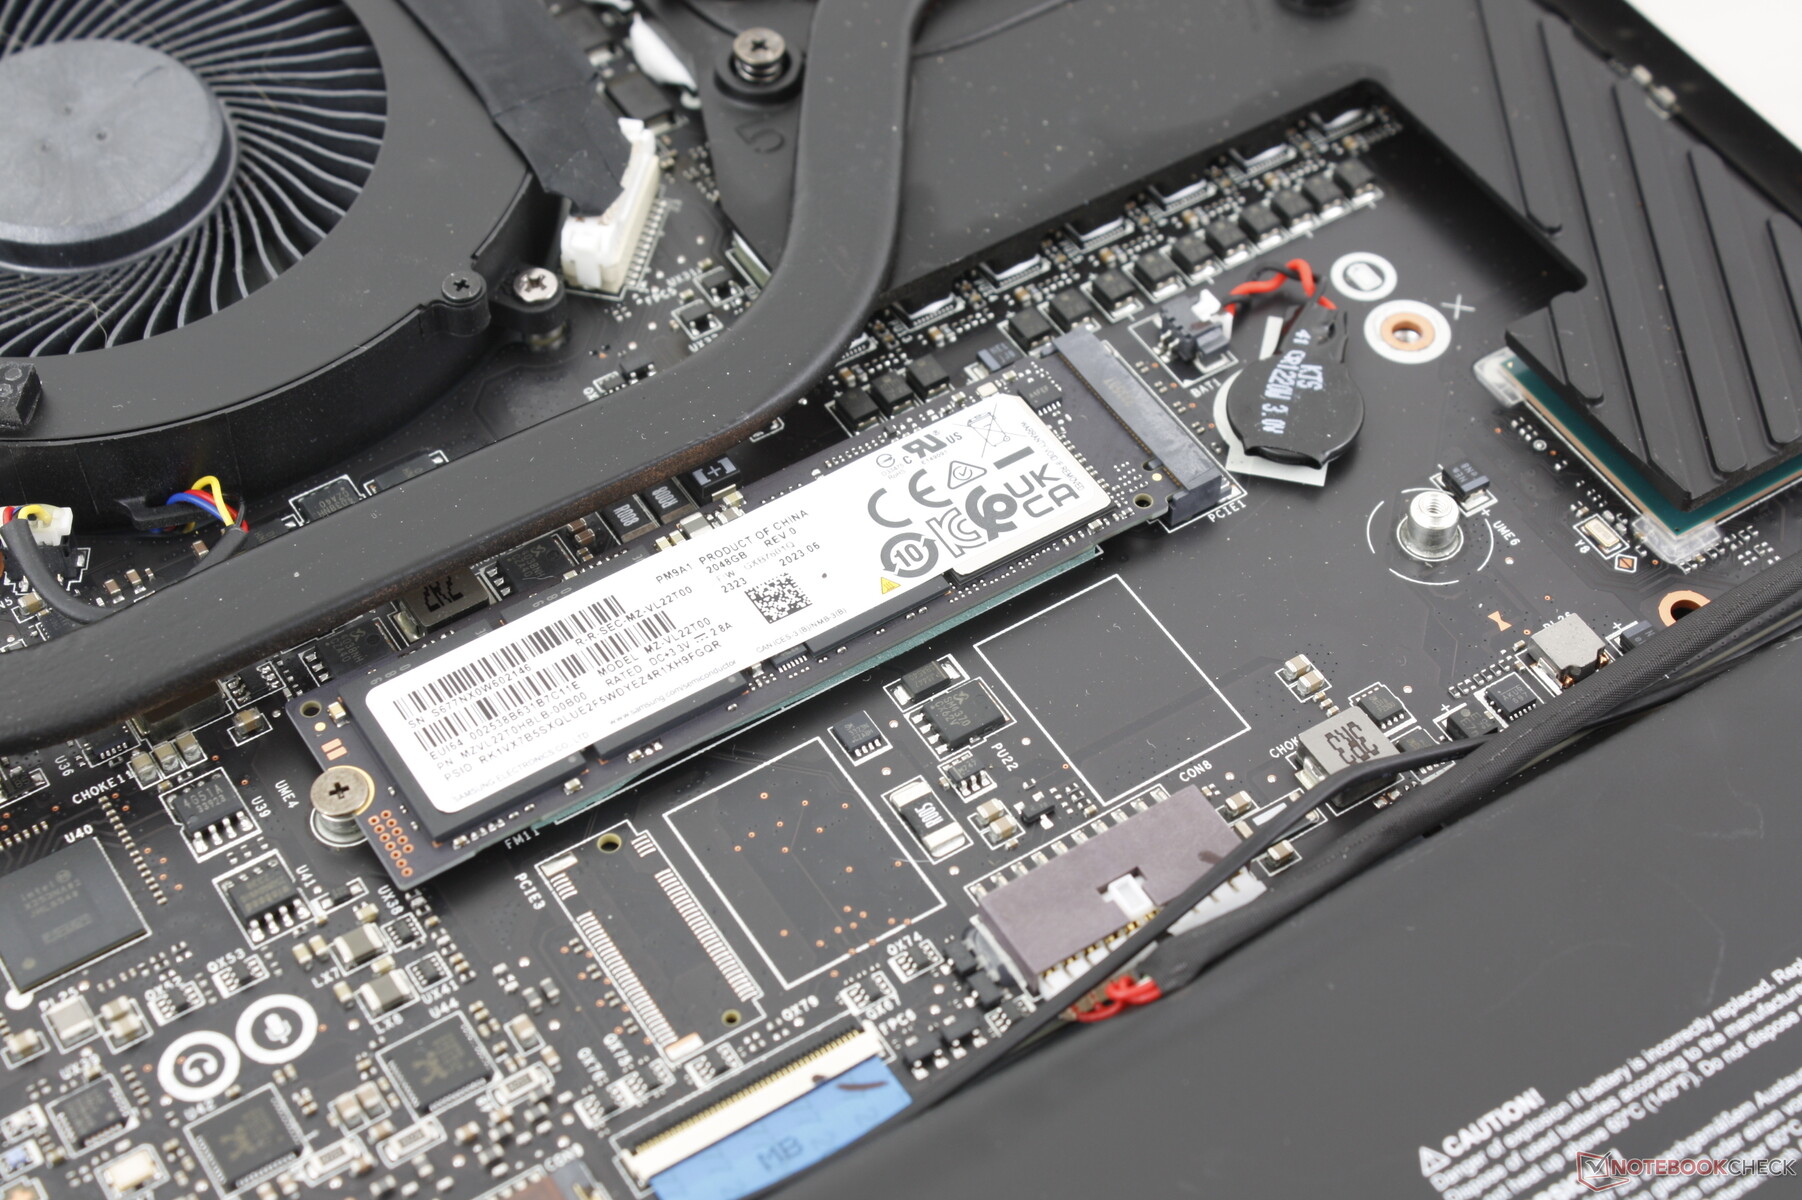
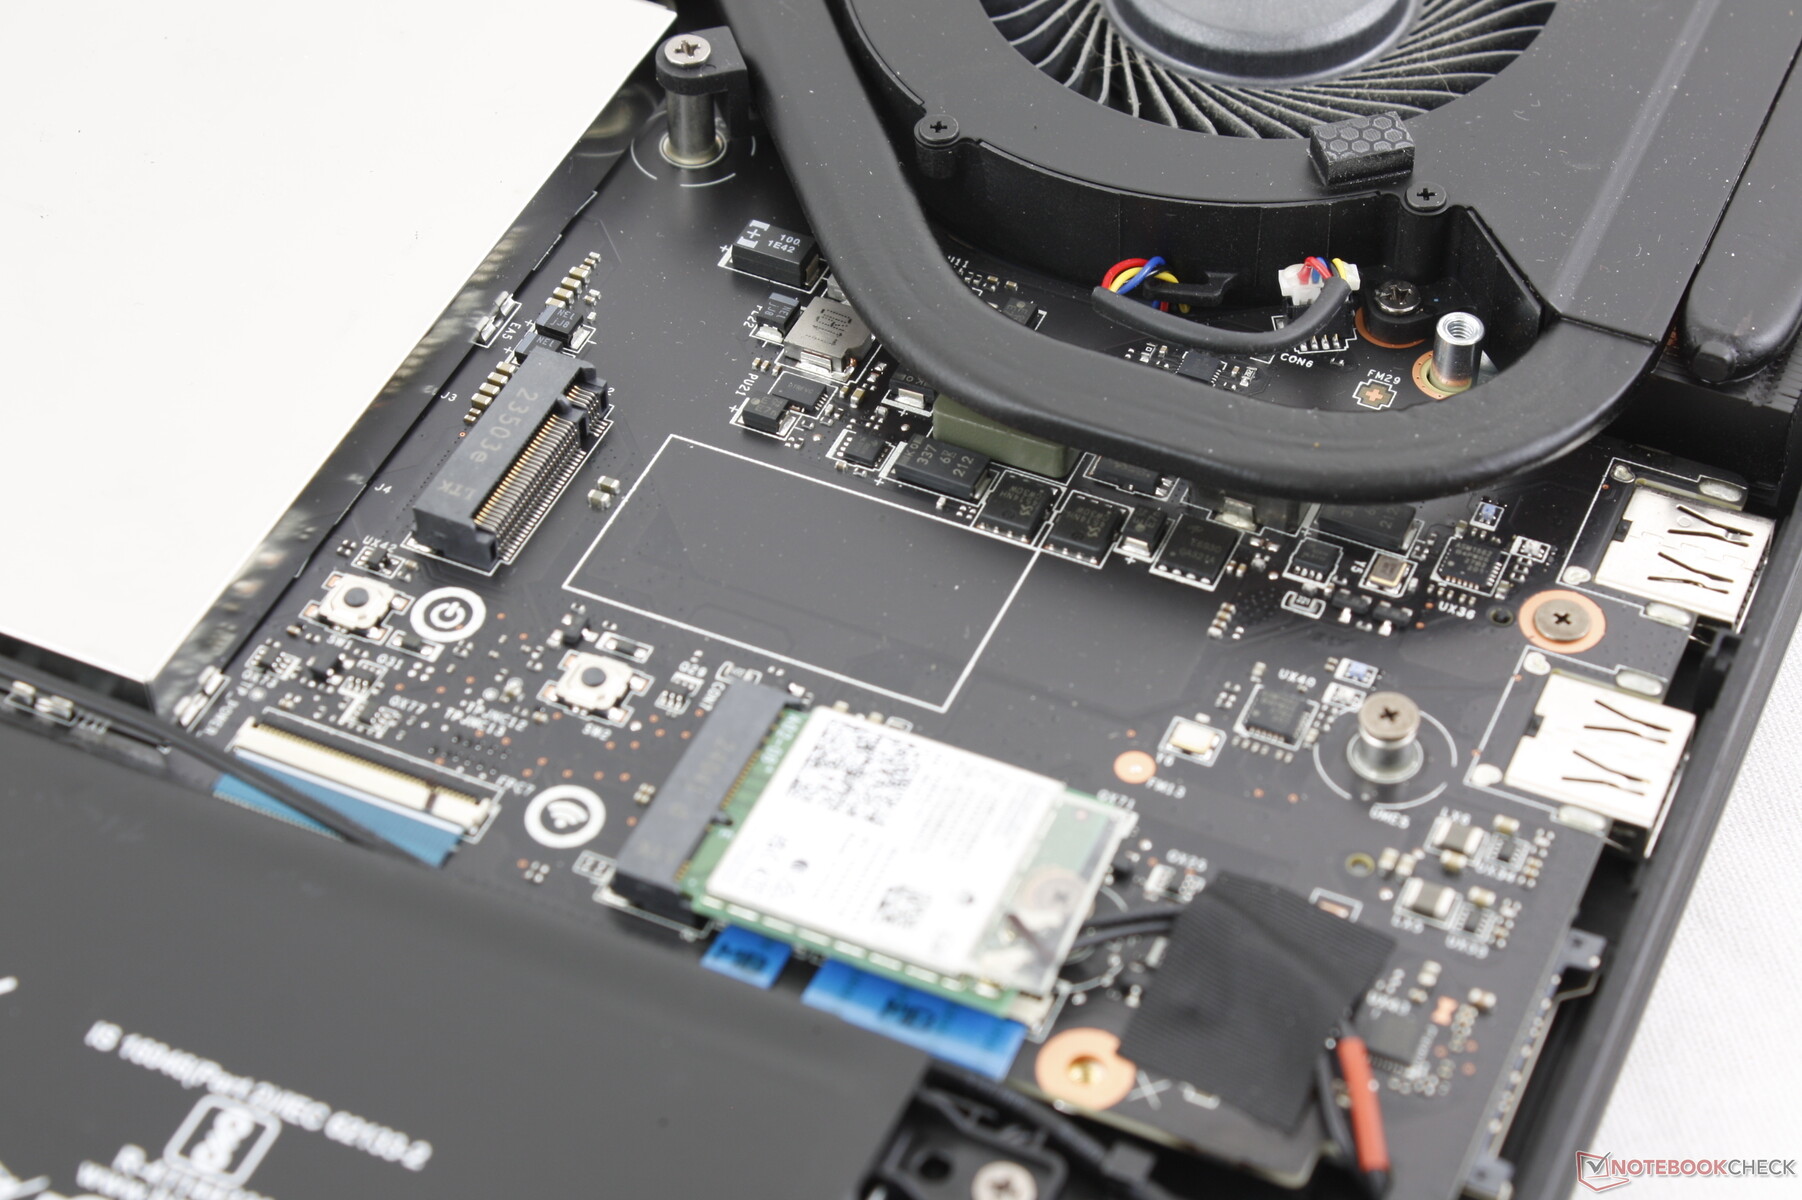
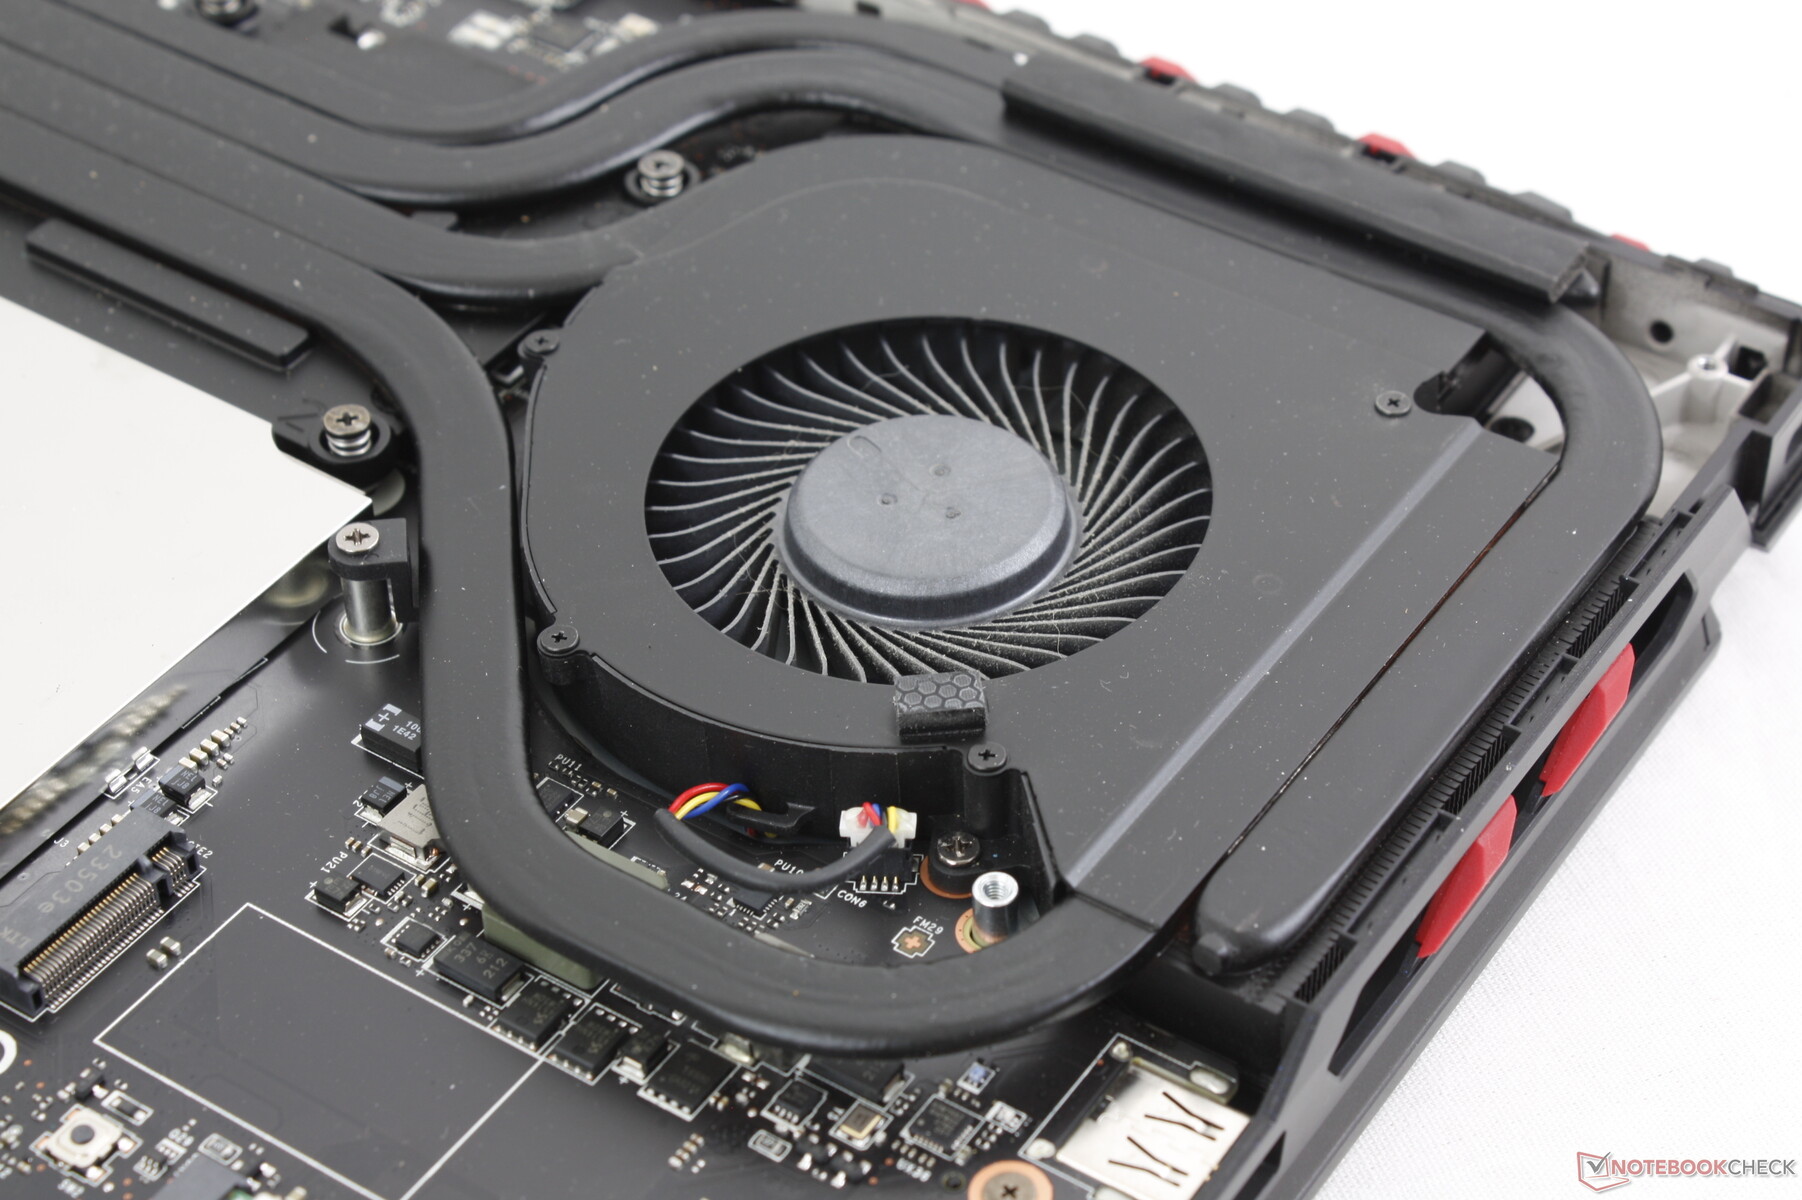
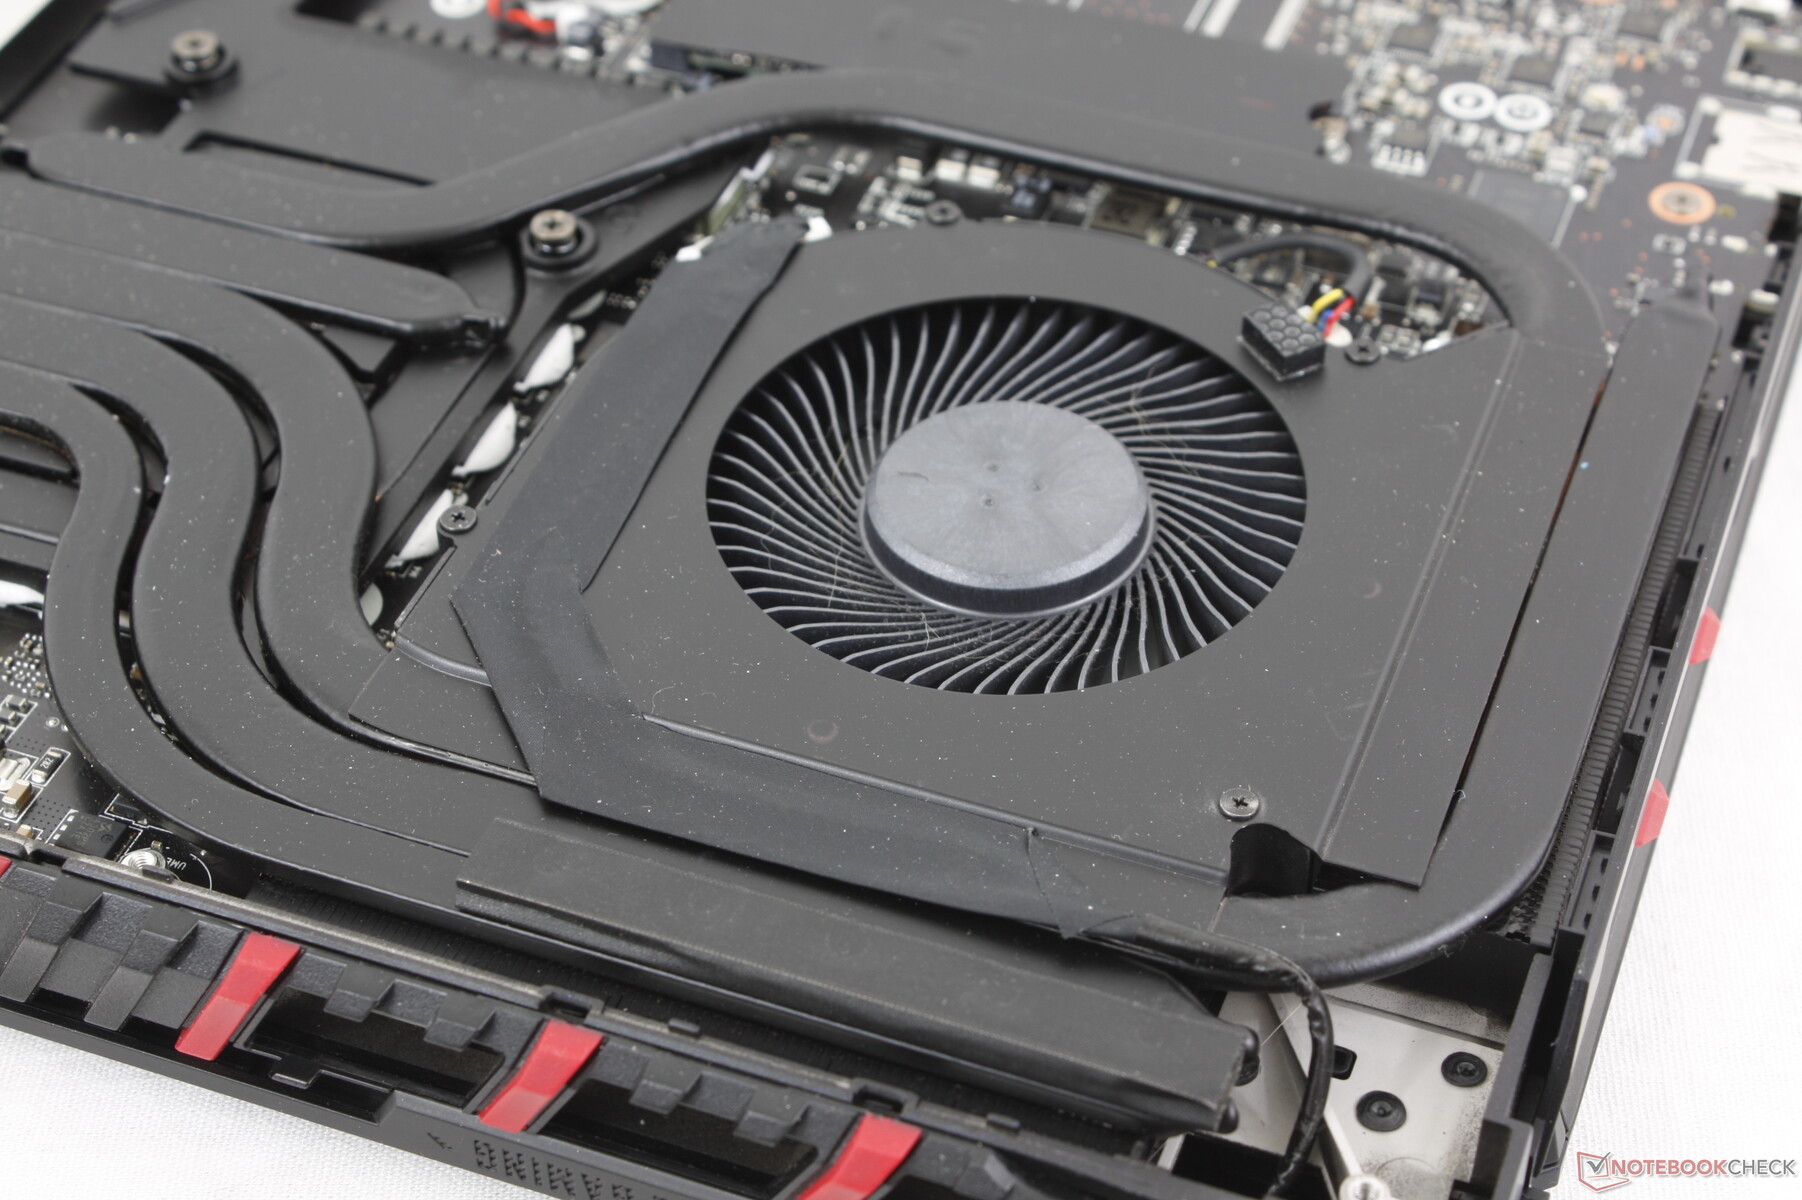
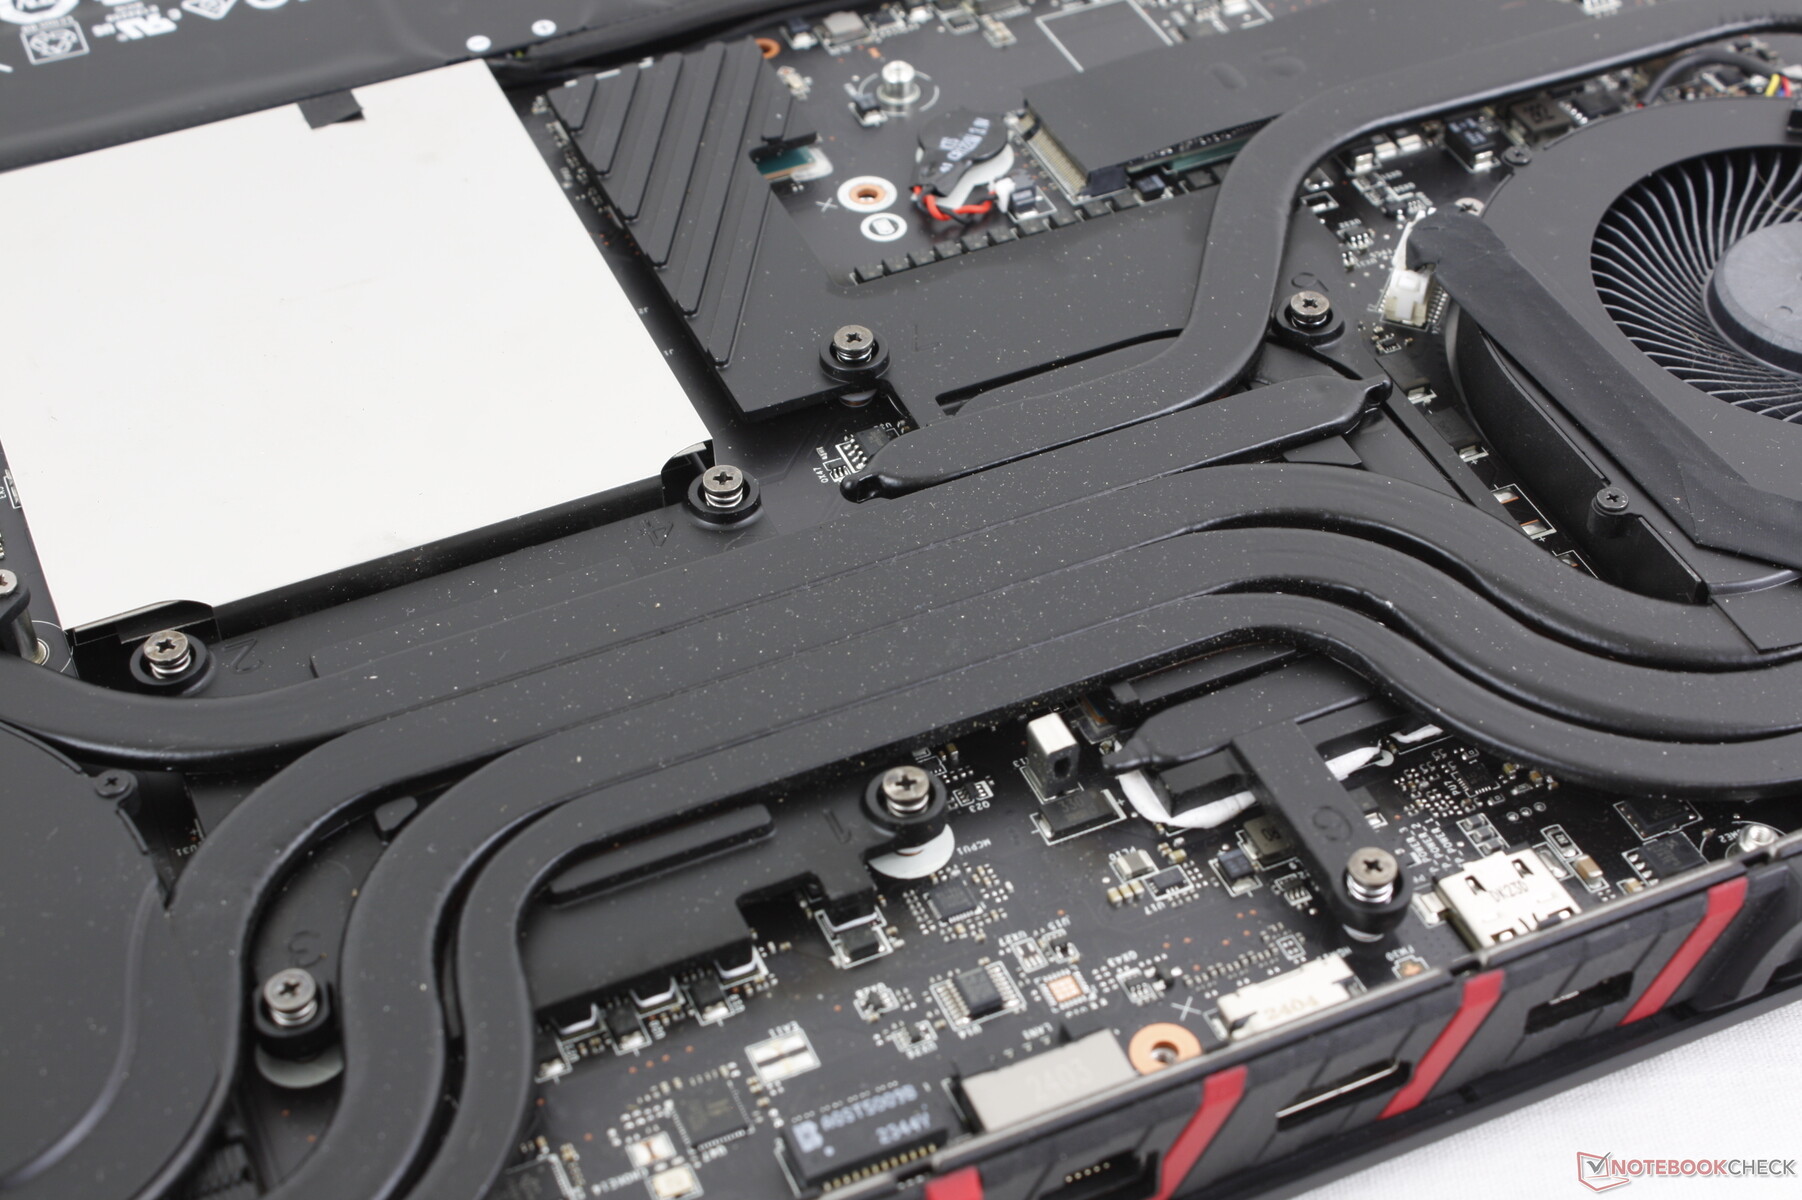
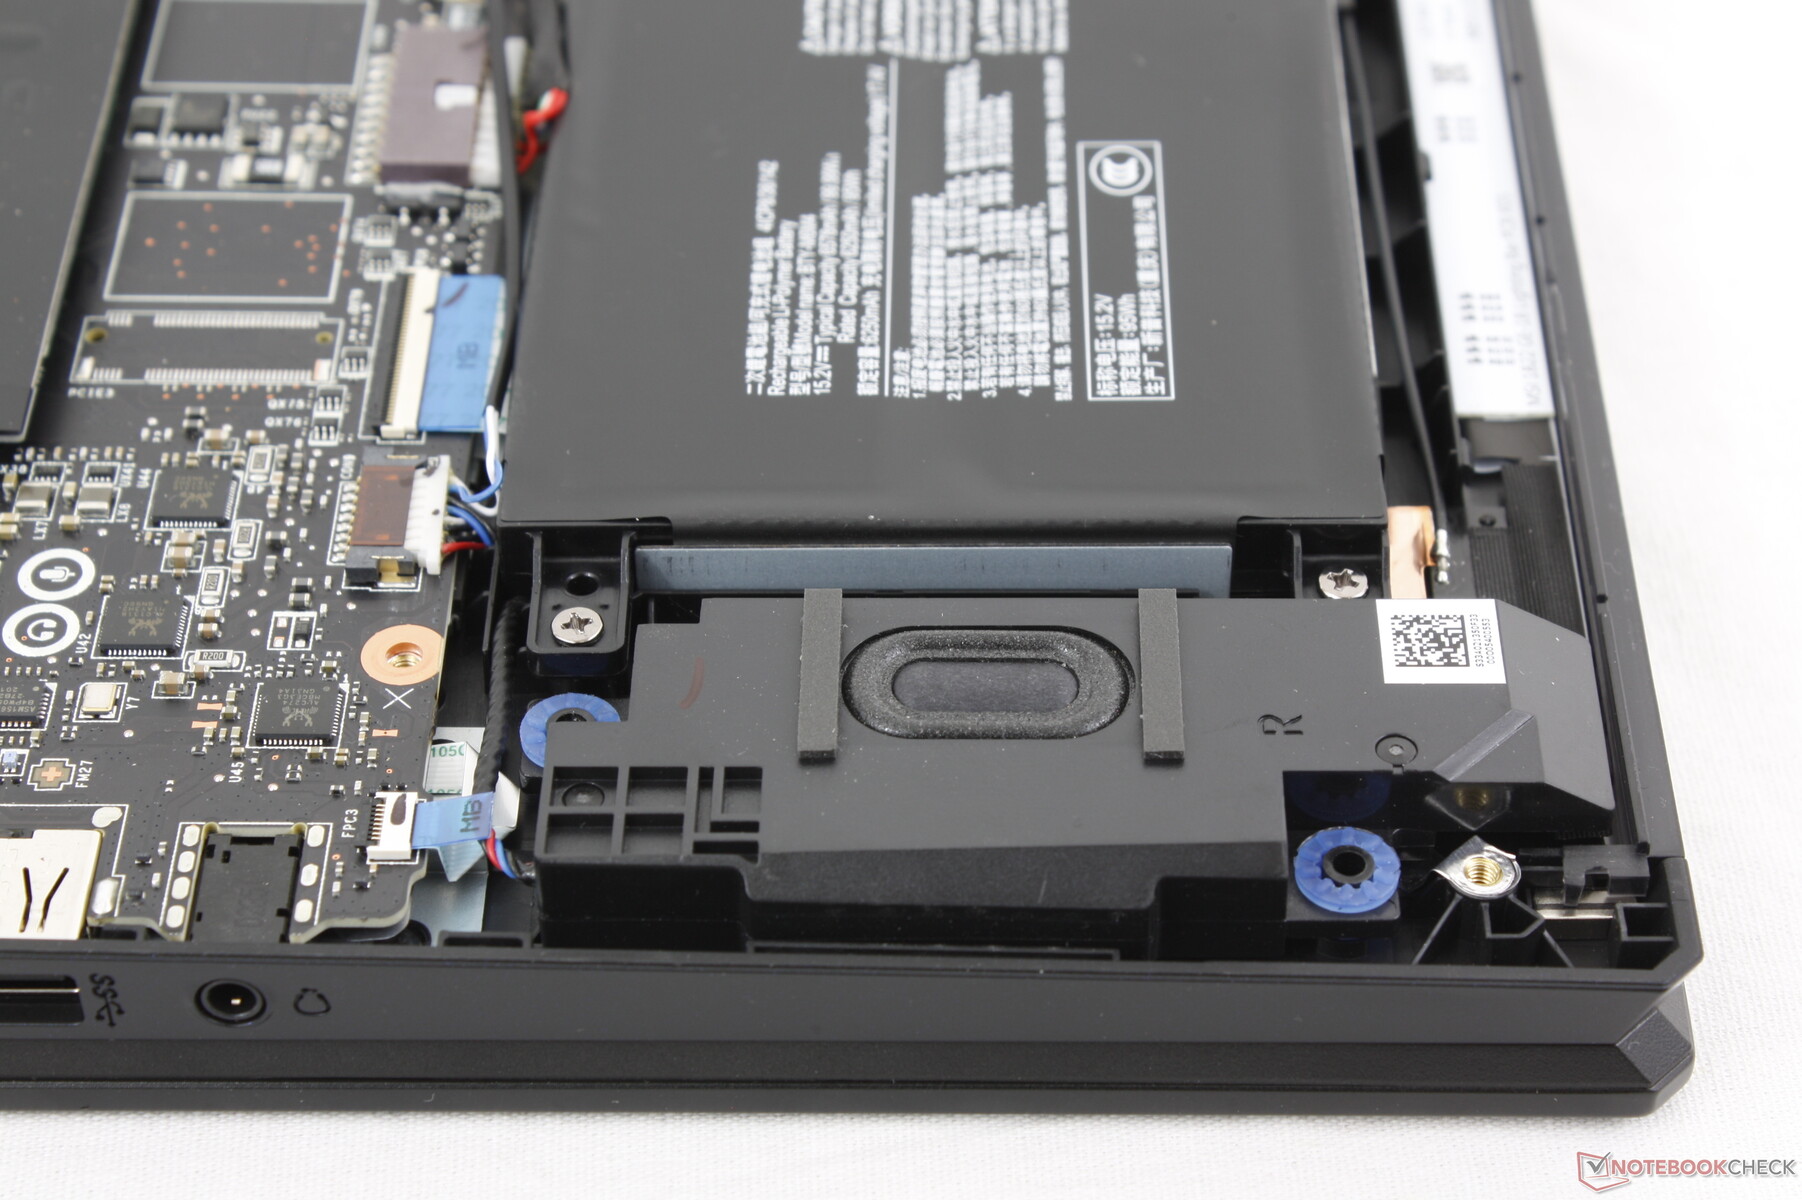
Onderhoud
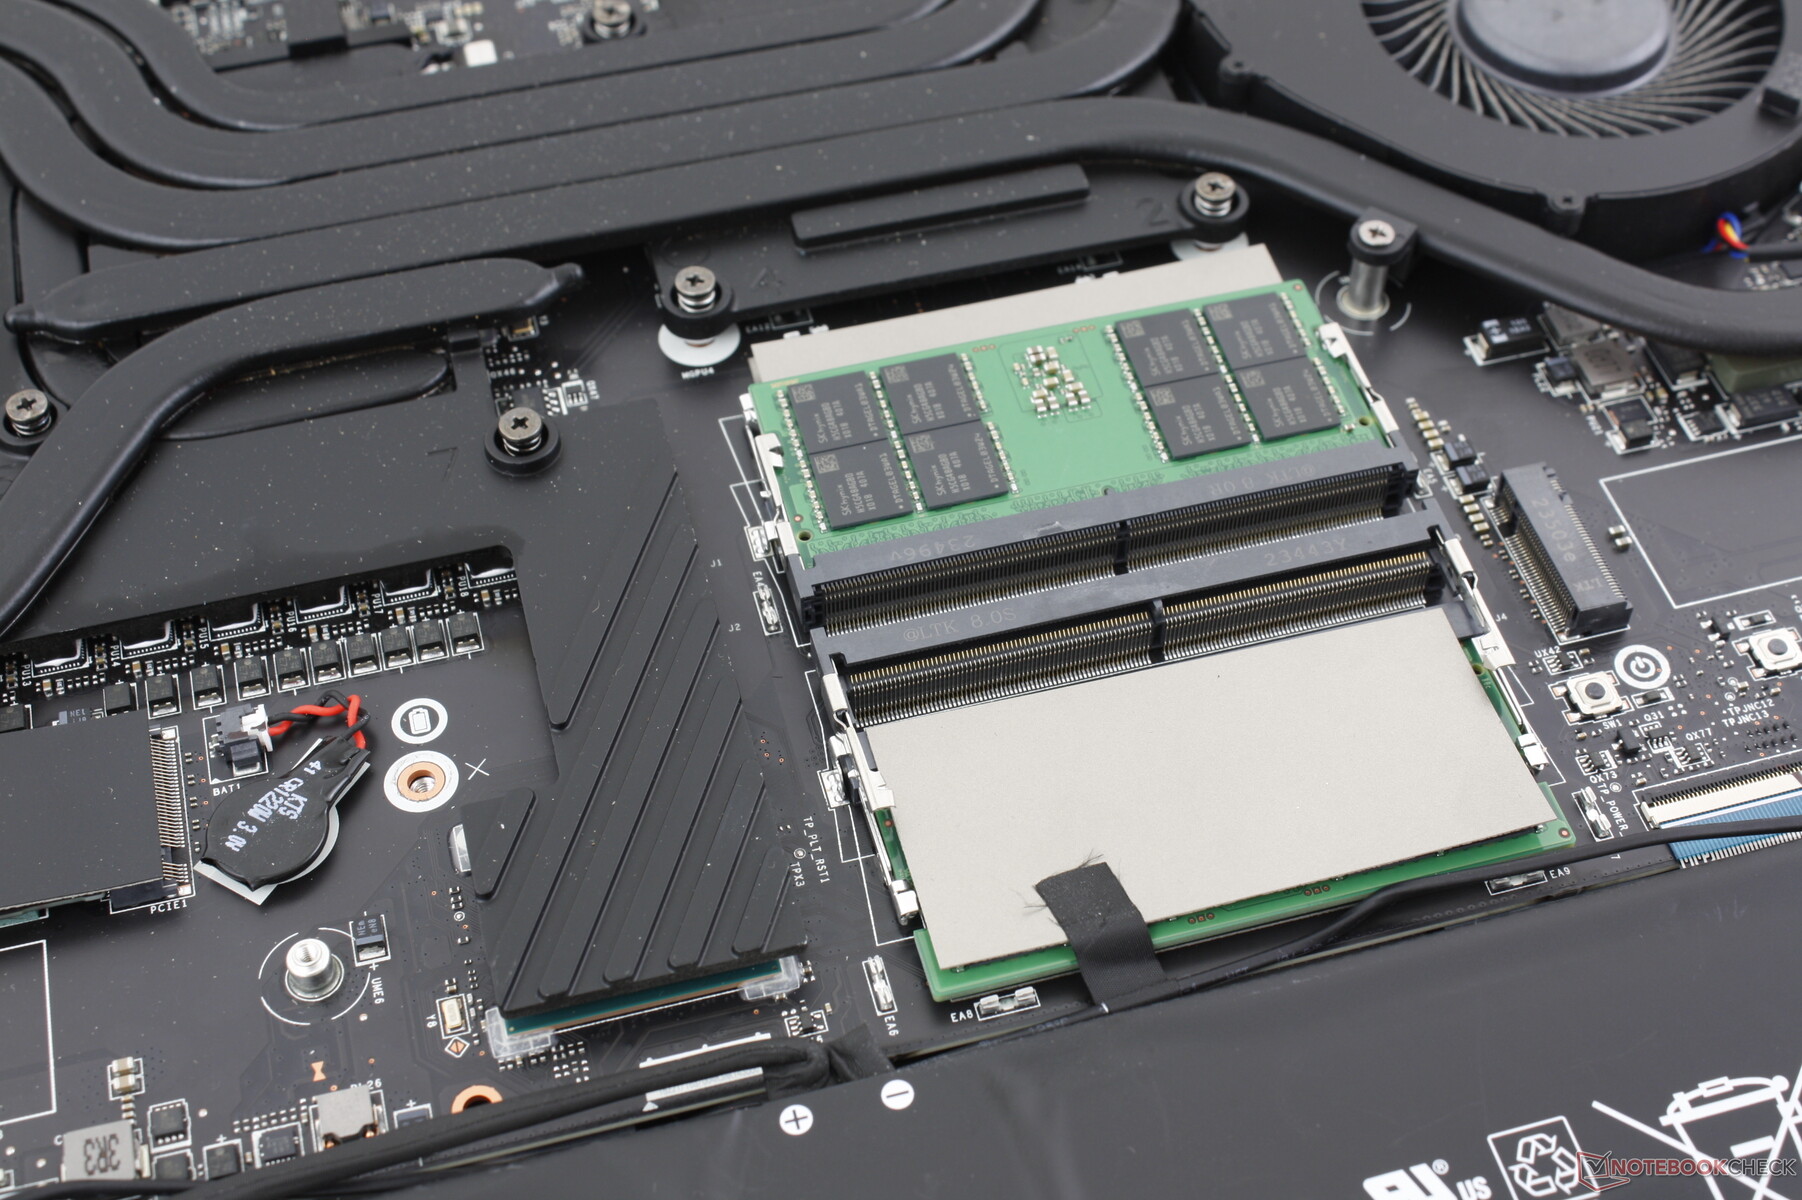
Het onderpaneel wordt vastgezet met 12 kruiskopschroeven die relatief eenvoudig te verwijderen zijn. MSI is echter nog steeds een van de weinige fabrikanten met een anti-tamper sticker die een van de schroeven bedekt, die gebroken moet worden voor zelfs simpele upgrades zoals RAM of opslag.
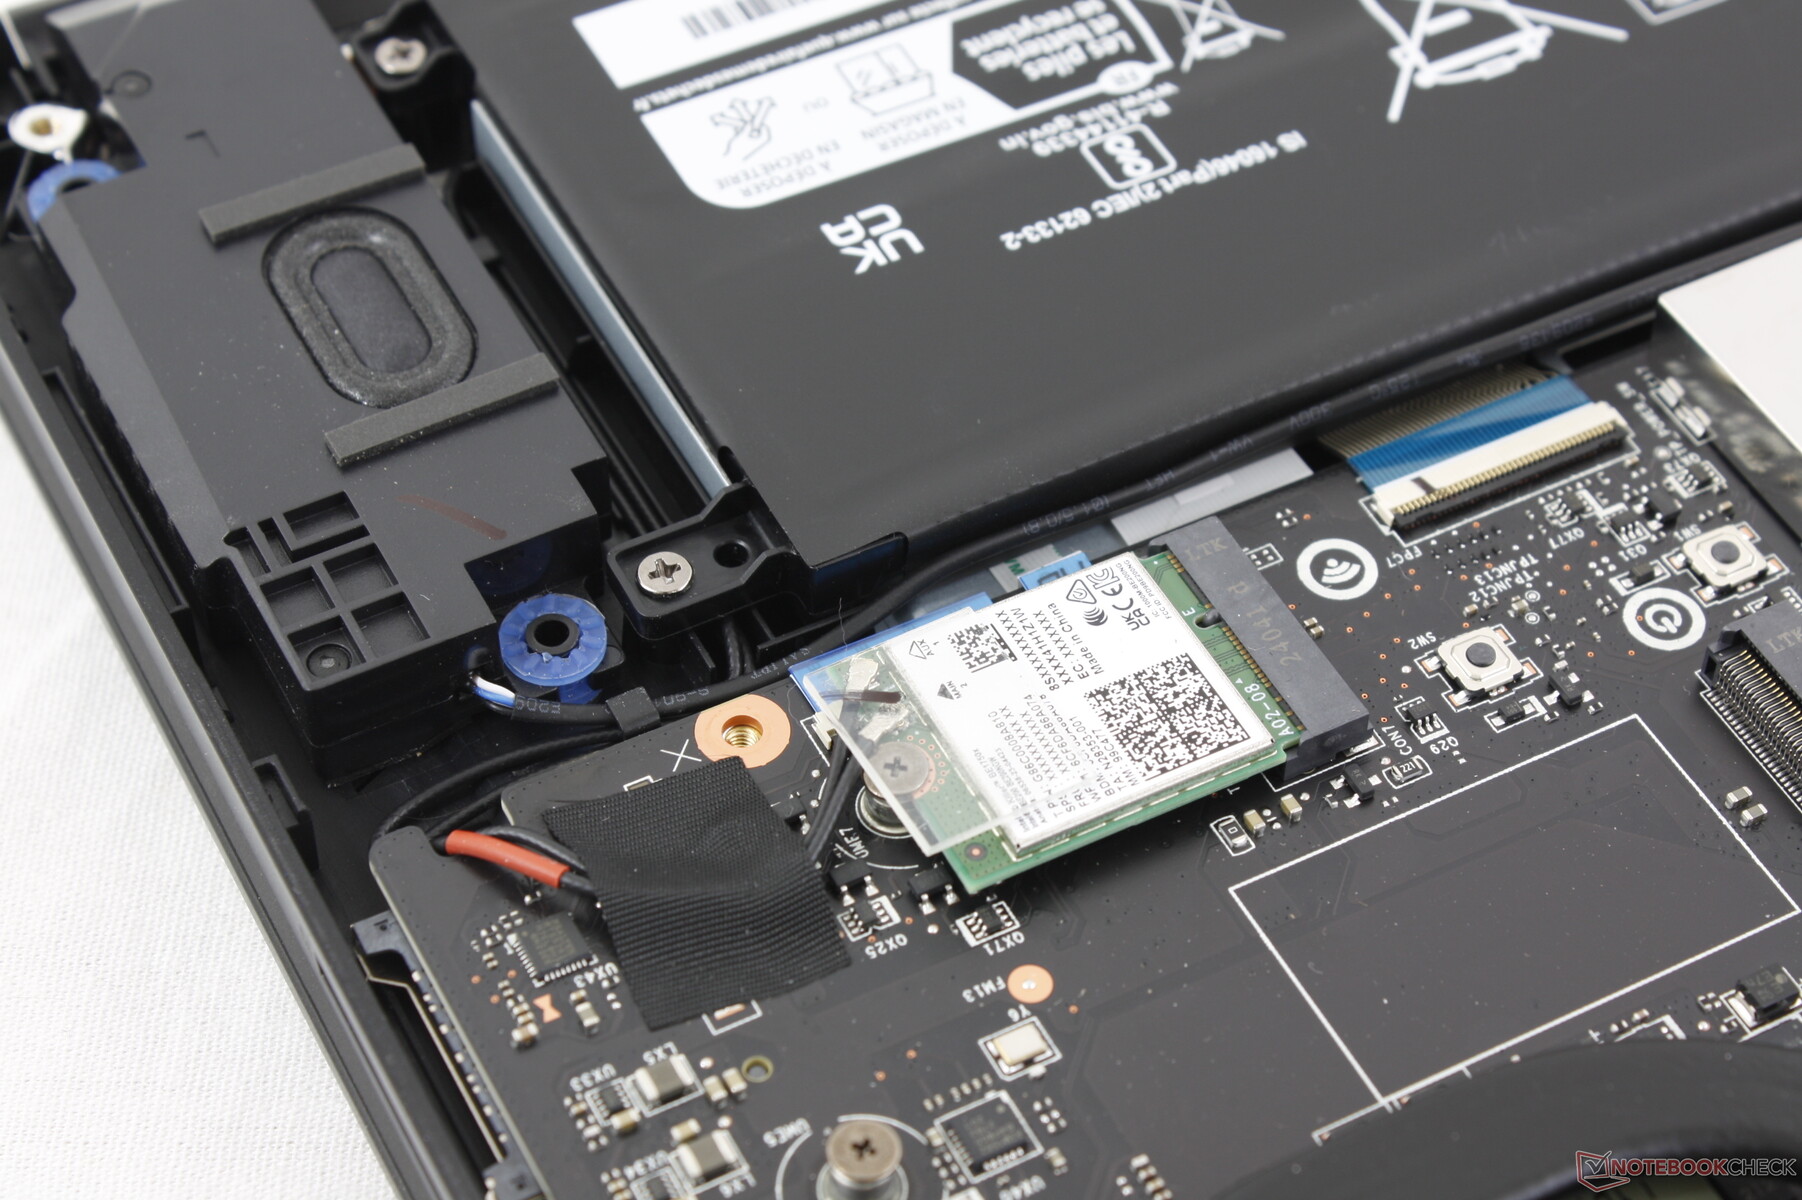
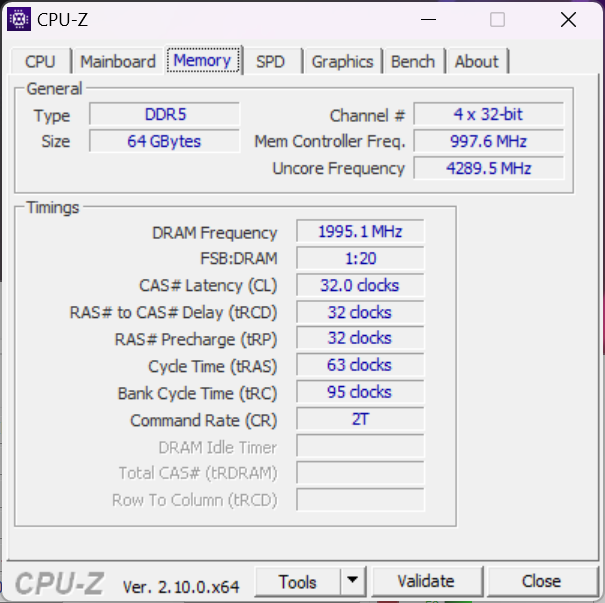
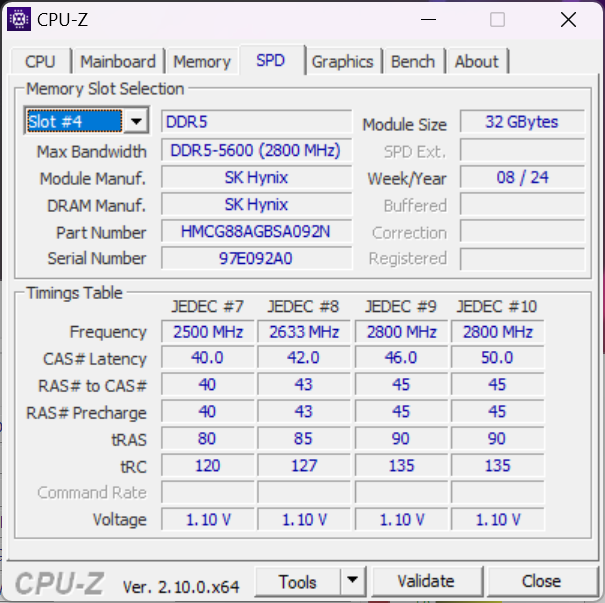
De Raider 18 HX deelt veel van dezelfde interne componenten als de Titan 18 HX. Gebruikers hebben toegang tot twee M.2 2280 SSD slots en vier DDR5 SODIMM slots. Merk op dat het derde M.2 SSD slot verwijderd is uit dit model; gebruikers moeten upgraden naar de Titan 18 HX voor een dergelijke functie.

Duurzaamheid
De verpakking is volledig recyclebaar en bestaat bijna volledig uit karton met alleen een beetje plastic verpakking voor de gebruikershandleiding. Er is echter geen informatie over eventuele gerecyclede materialen die tijdens de productie van het systeem zijn gebruikt.
Accessoires en garantie
Er zitten geen extra's in de doos, behalve de AC-adapter en papierwerk. Oudere Raider-modellen werden geleverd met een fluwelen schoonmaakdoekje, maar dit lijkt niet langer het geval te zijn.
Bij aankoop in de VS geldt de gebruikelijke beperkte fabrieksgarantie van een jaar.
Invoerapparaten - Vertrouwd boven fantasie
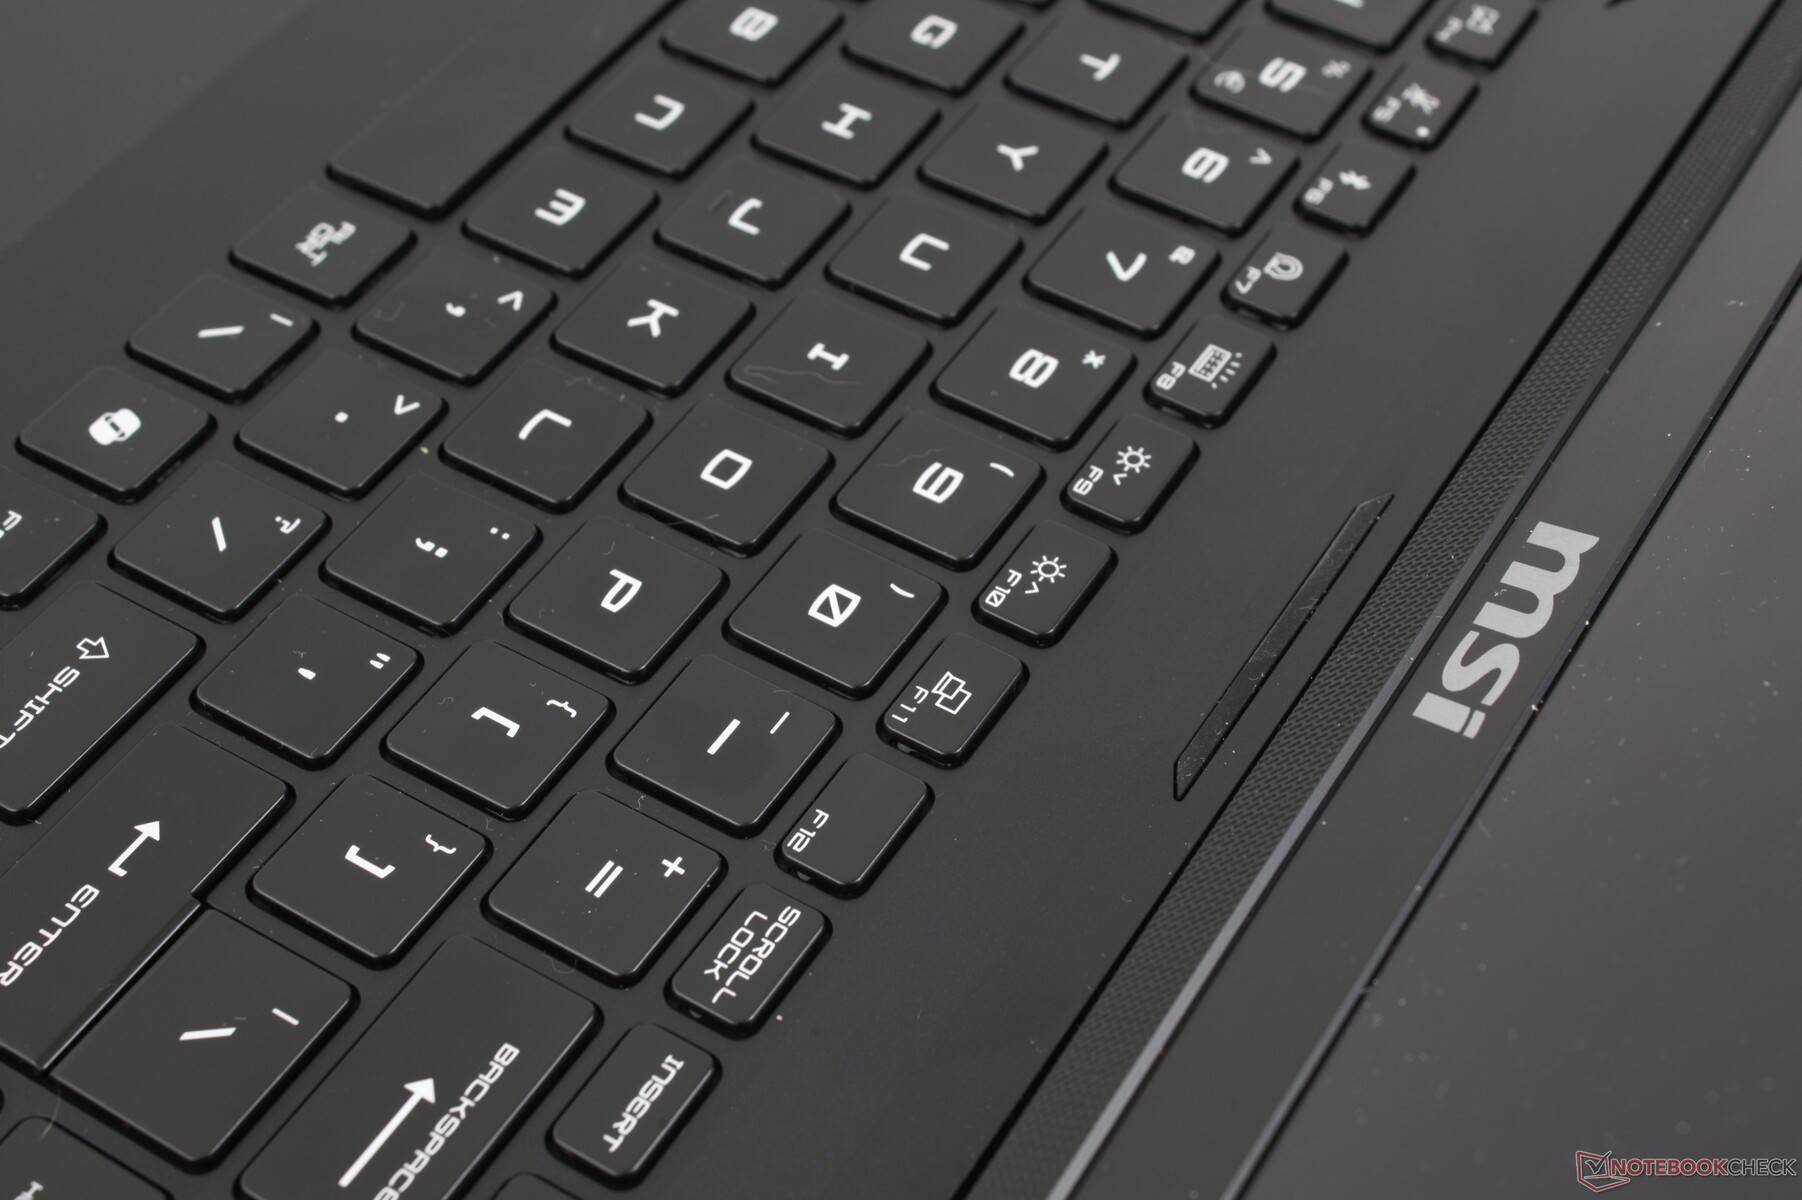
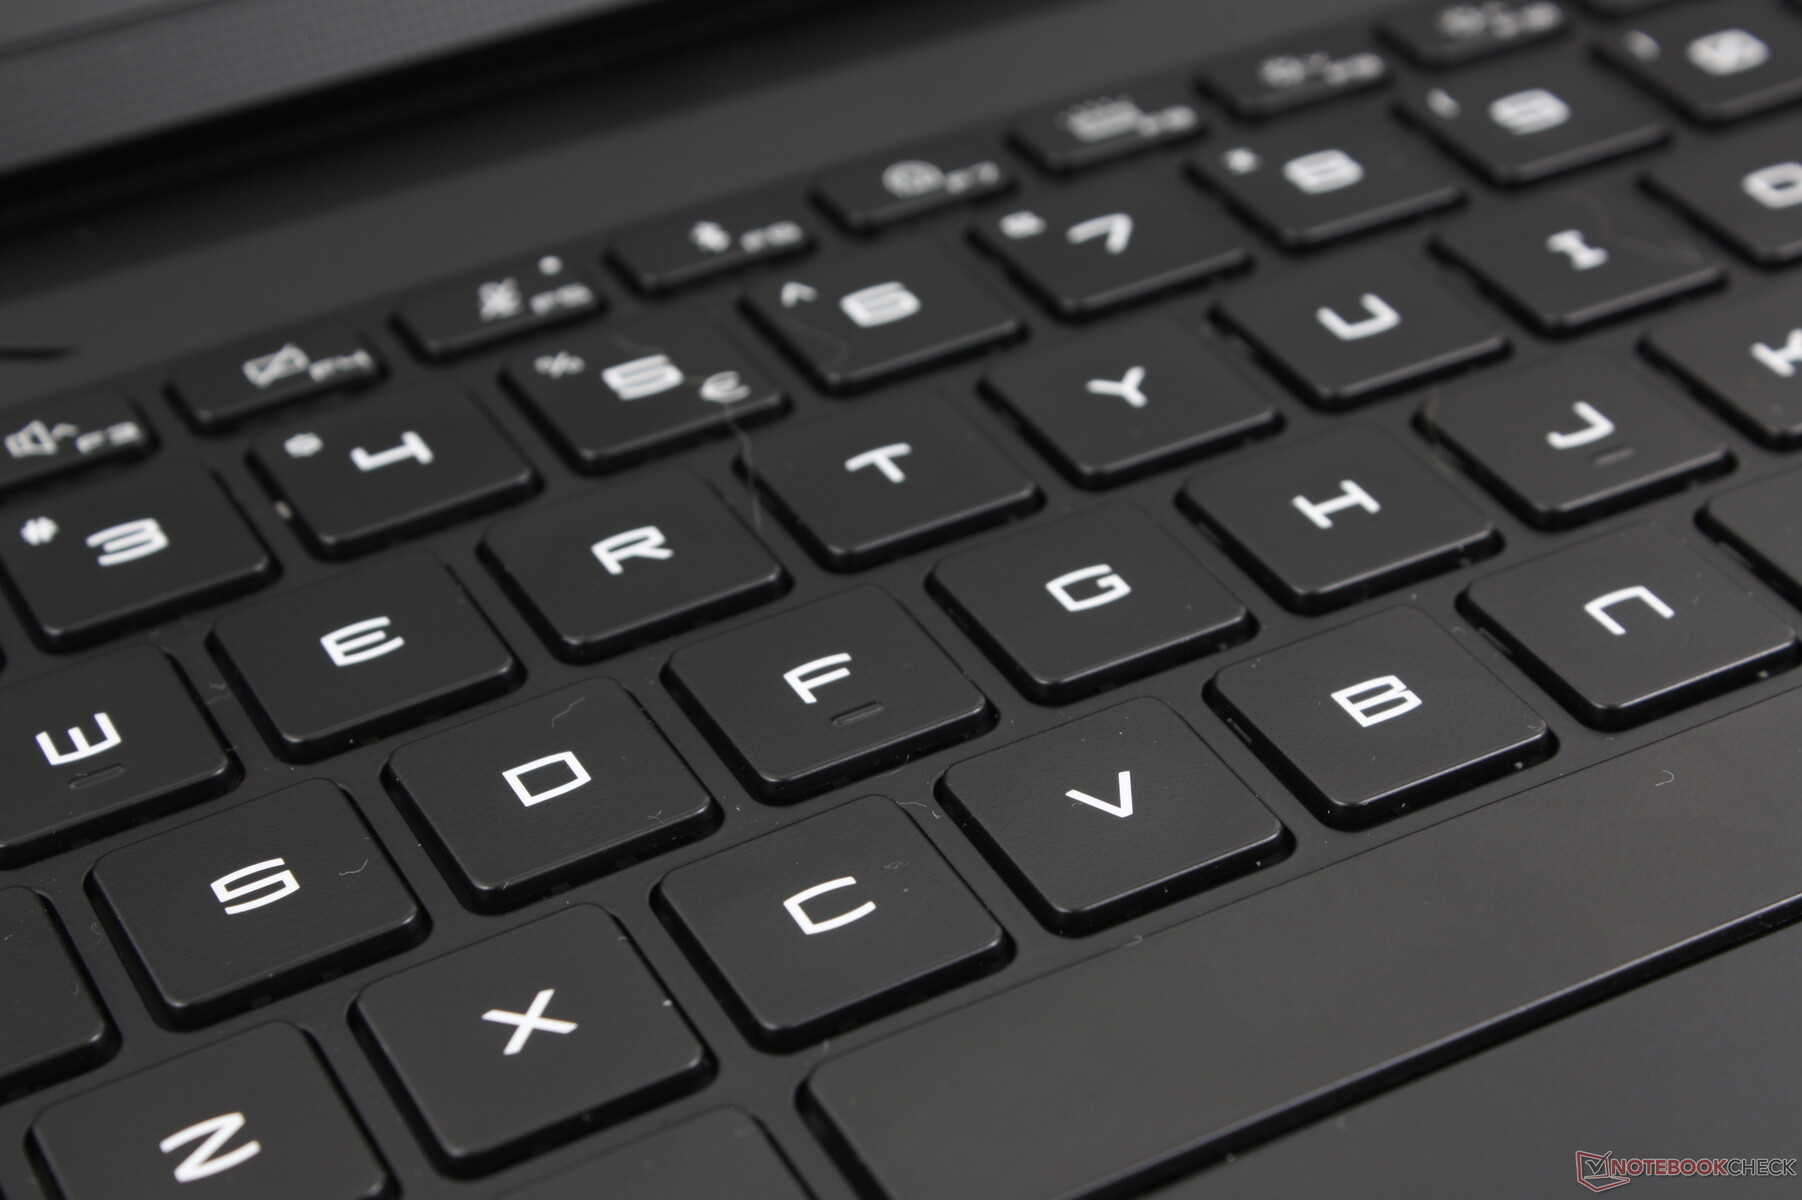
Toetsenbord
Het toetsenbord is visueel identiek aan dat van de Titan 18 HX, maar met één heel belangrijk verschil: Het ontbreken van mechanische CherryMX opties. Typen op de Raider 18 HX lijkt daarom meer op typen op traditionele laptoptoetsenborden zoals de MSI Stealth 16 of oudere generatie Raider-modellen. De feedback is lang niet zo klikkend of stevig, maar het zachtere gekletter kan de voorkeur verdienen in omgevingen zoals vergaderzalen, klaslokalen, bibliotheken of studentenkamers.
Wij waarderen vooral de numpad- en pijltjestoetsen van volledig formaat, omdat deze meestal smaller en kleiner zijn dan de belangrijkste QWERTY-toetsen op de meeste andere laptops. Spreadsheetwerk is daarom comfortabeler op de Raider 18 HX dan op de Blade 18 of ROG Strix G18.
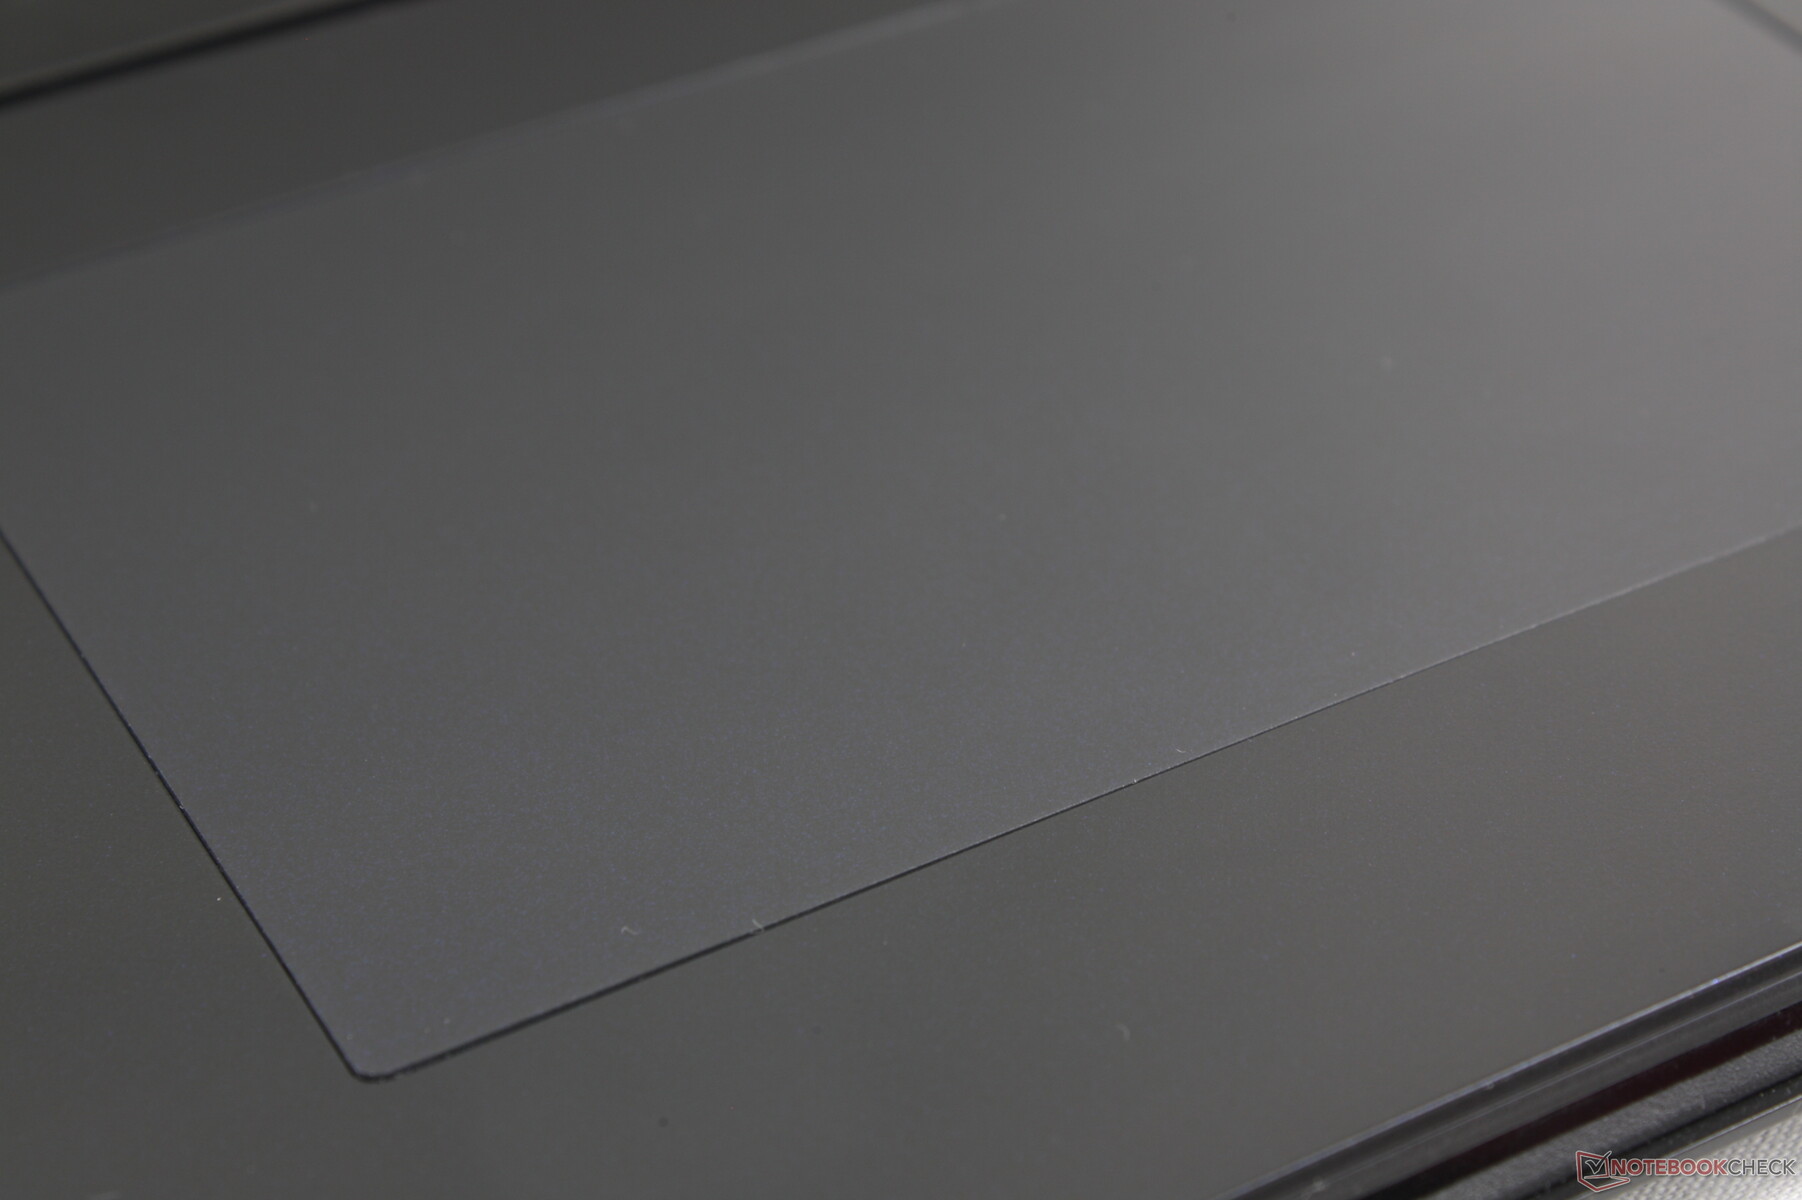
Touchpad
In tegenstelling tot het fancy LED-verlichte randloze clickpad op de Titan 18 HX, gebruikt de Raider 18 HX een traditioneel clickpad voor een meer vertrouwd gevoel. De afmetingen blijven exact hetzelfde (13 x 8,2 cm) en het is aantoonbaar comfortabeler om te gebruiken, omdat het niet probeert iets nieuws te zijn of een probleem op te lossen dat er in eerste instantie niet was. De tractie is ultrazacht met slechts een beetje kleven bij lagere snelheden voor nauwkeurigheid.
Indrukken om een klik in te voeren is helaas nog steeds oppervlakkig en zacht met onbevredigende feedback. Een sterkere en stevigere klik zou beter zijn geweest of zelfs de terugkeer van speciale muistoetsen, aangezien het toetsenbord vrij ruim is.
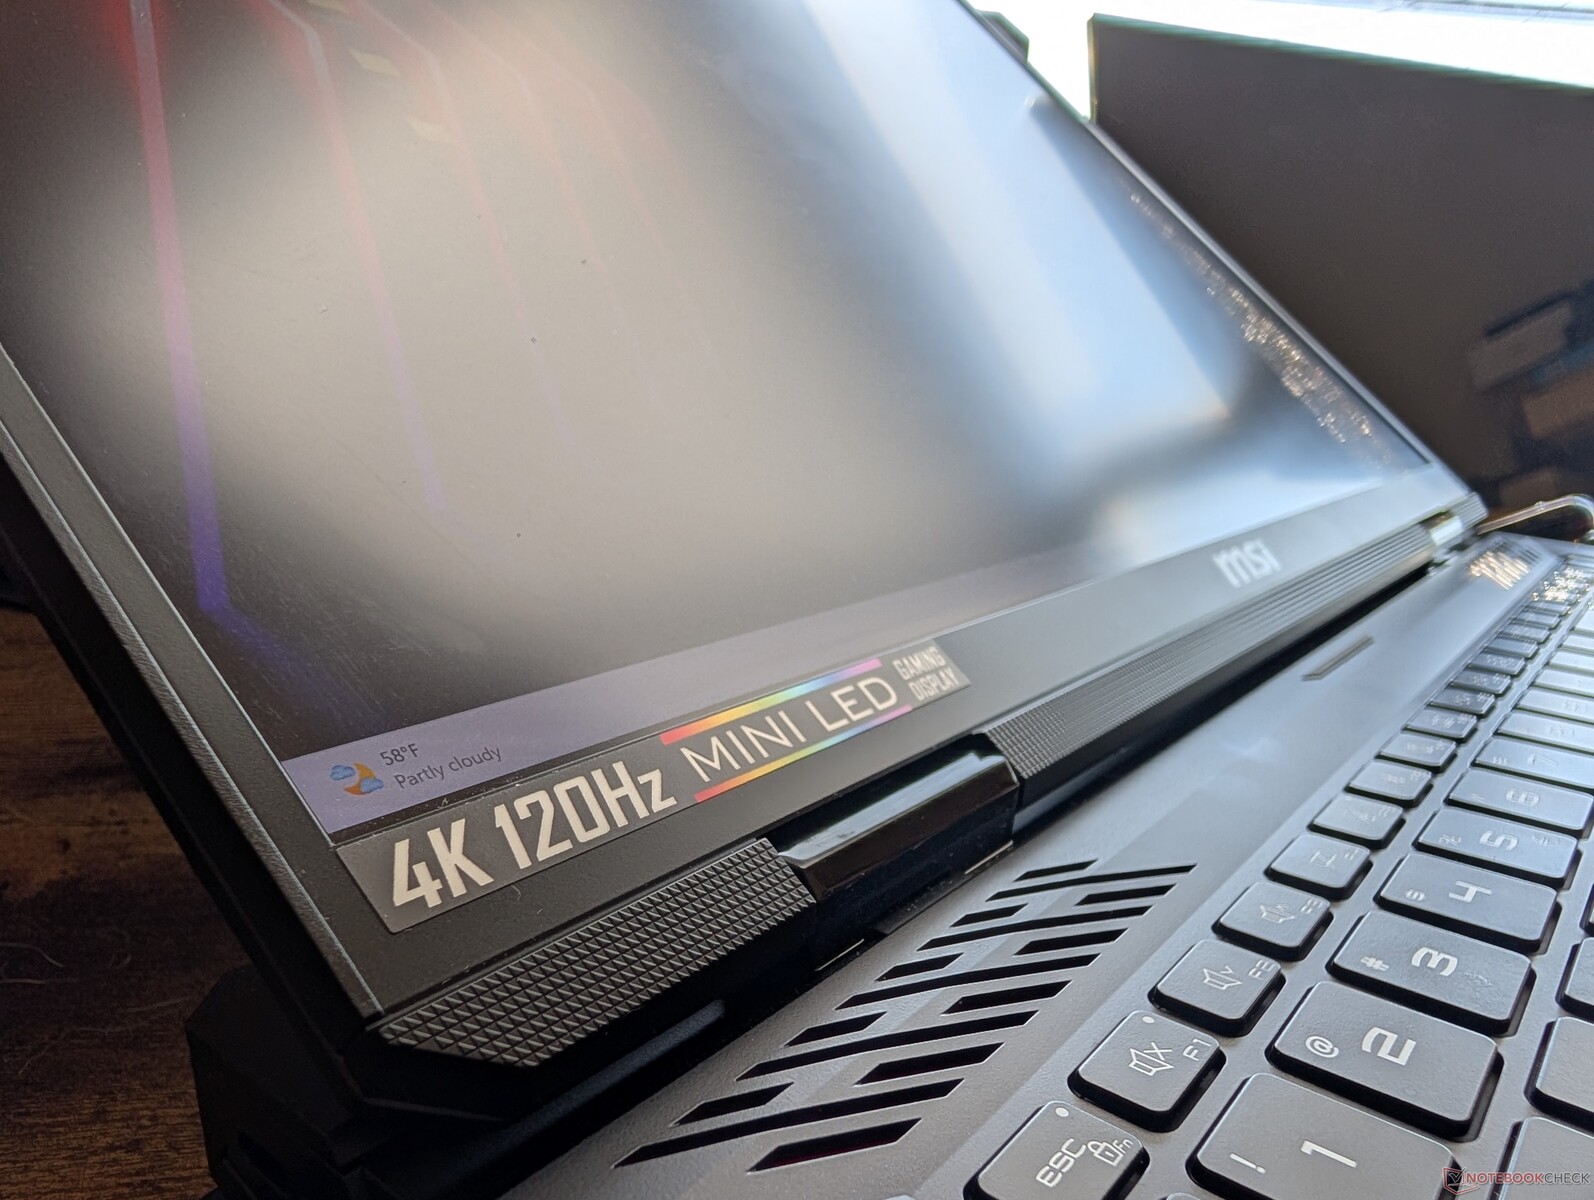
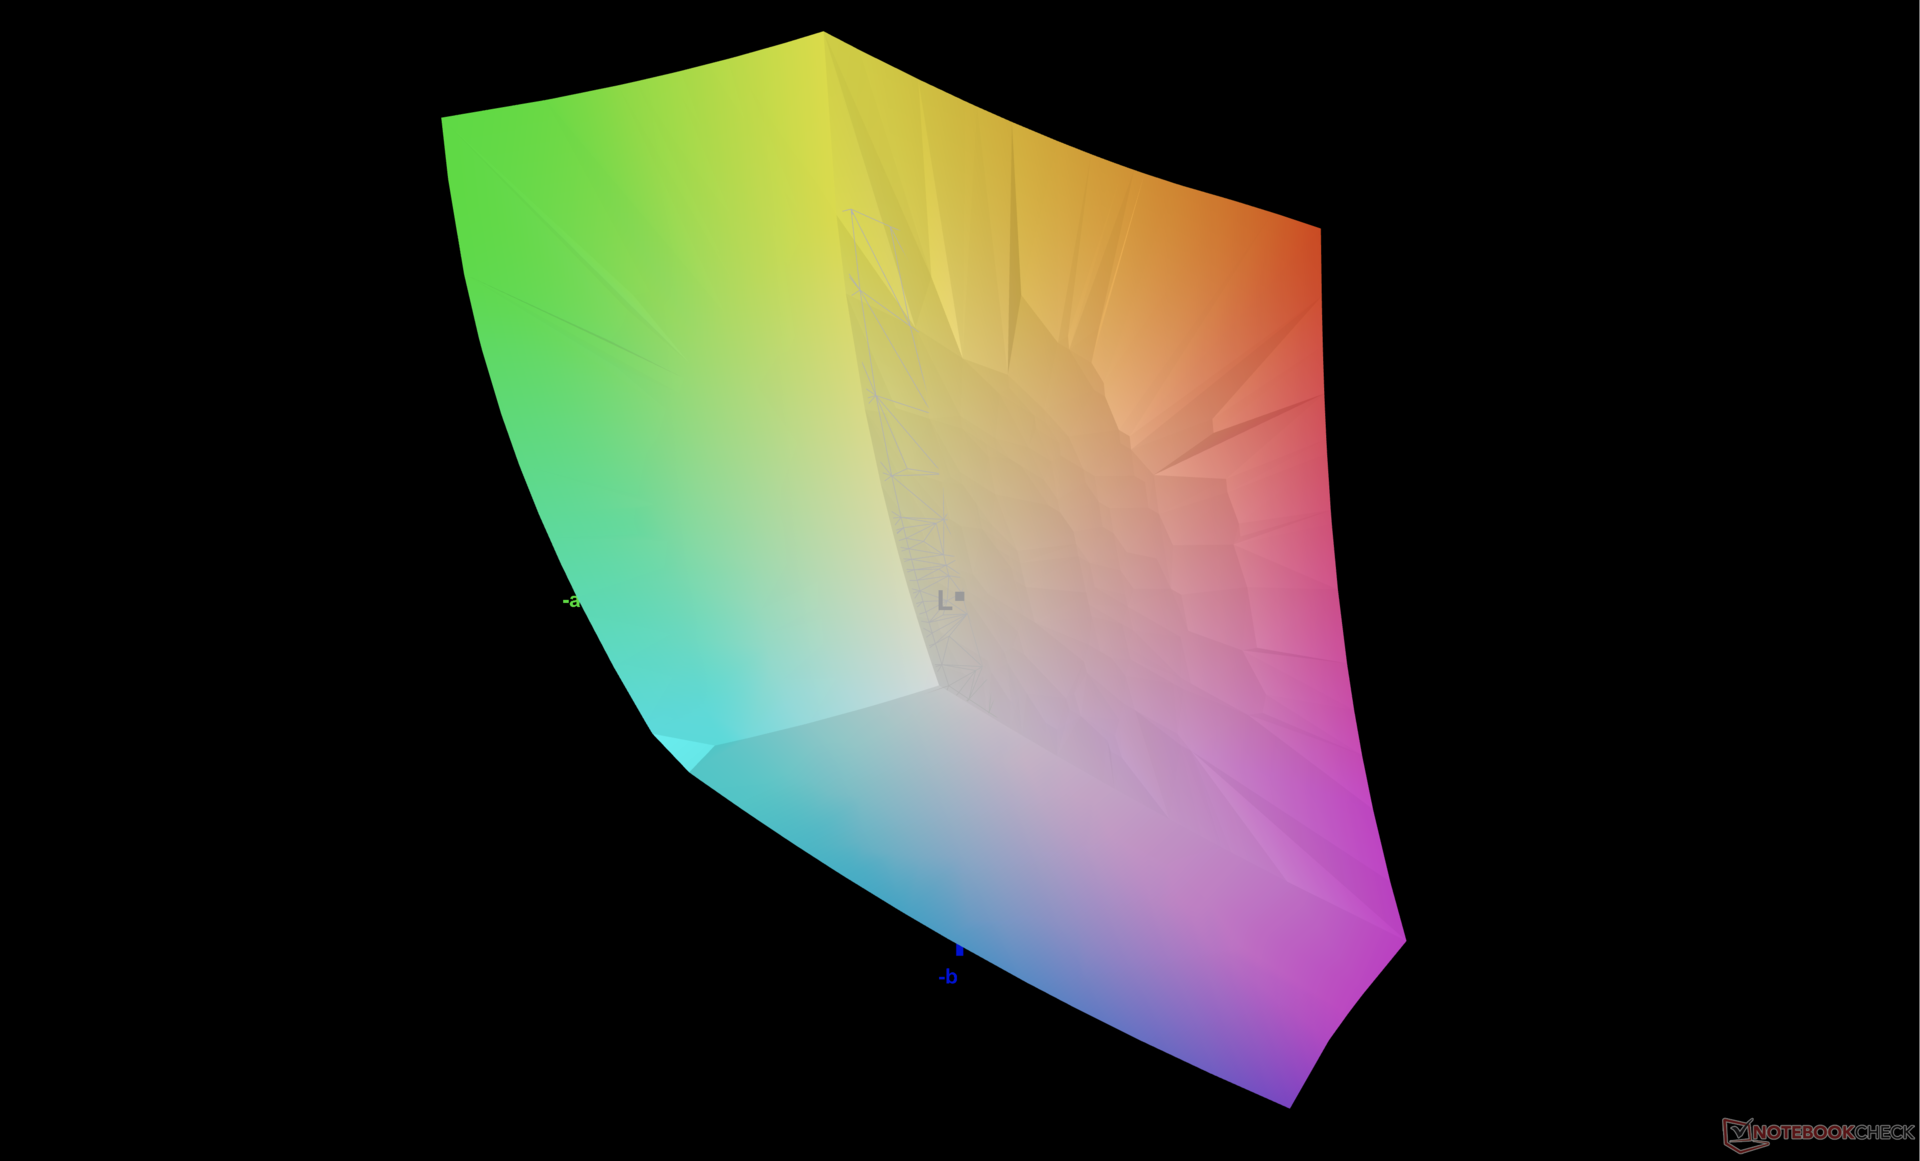
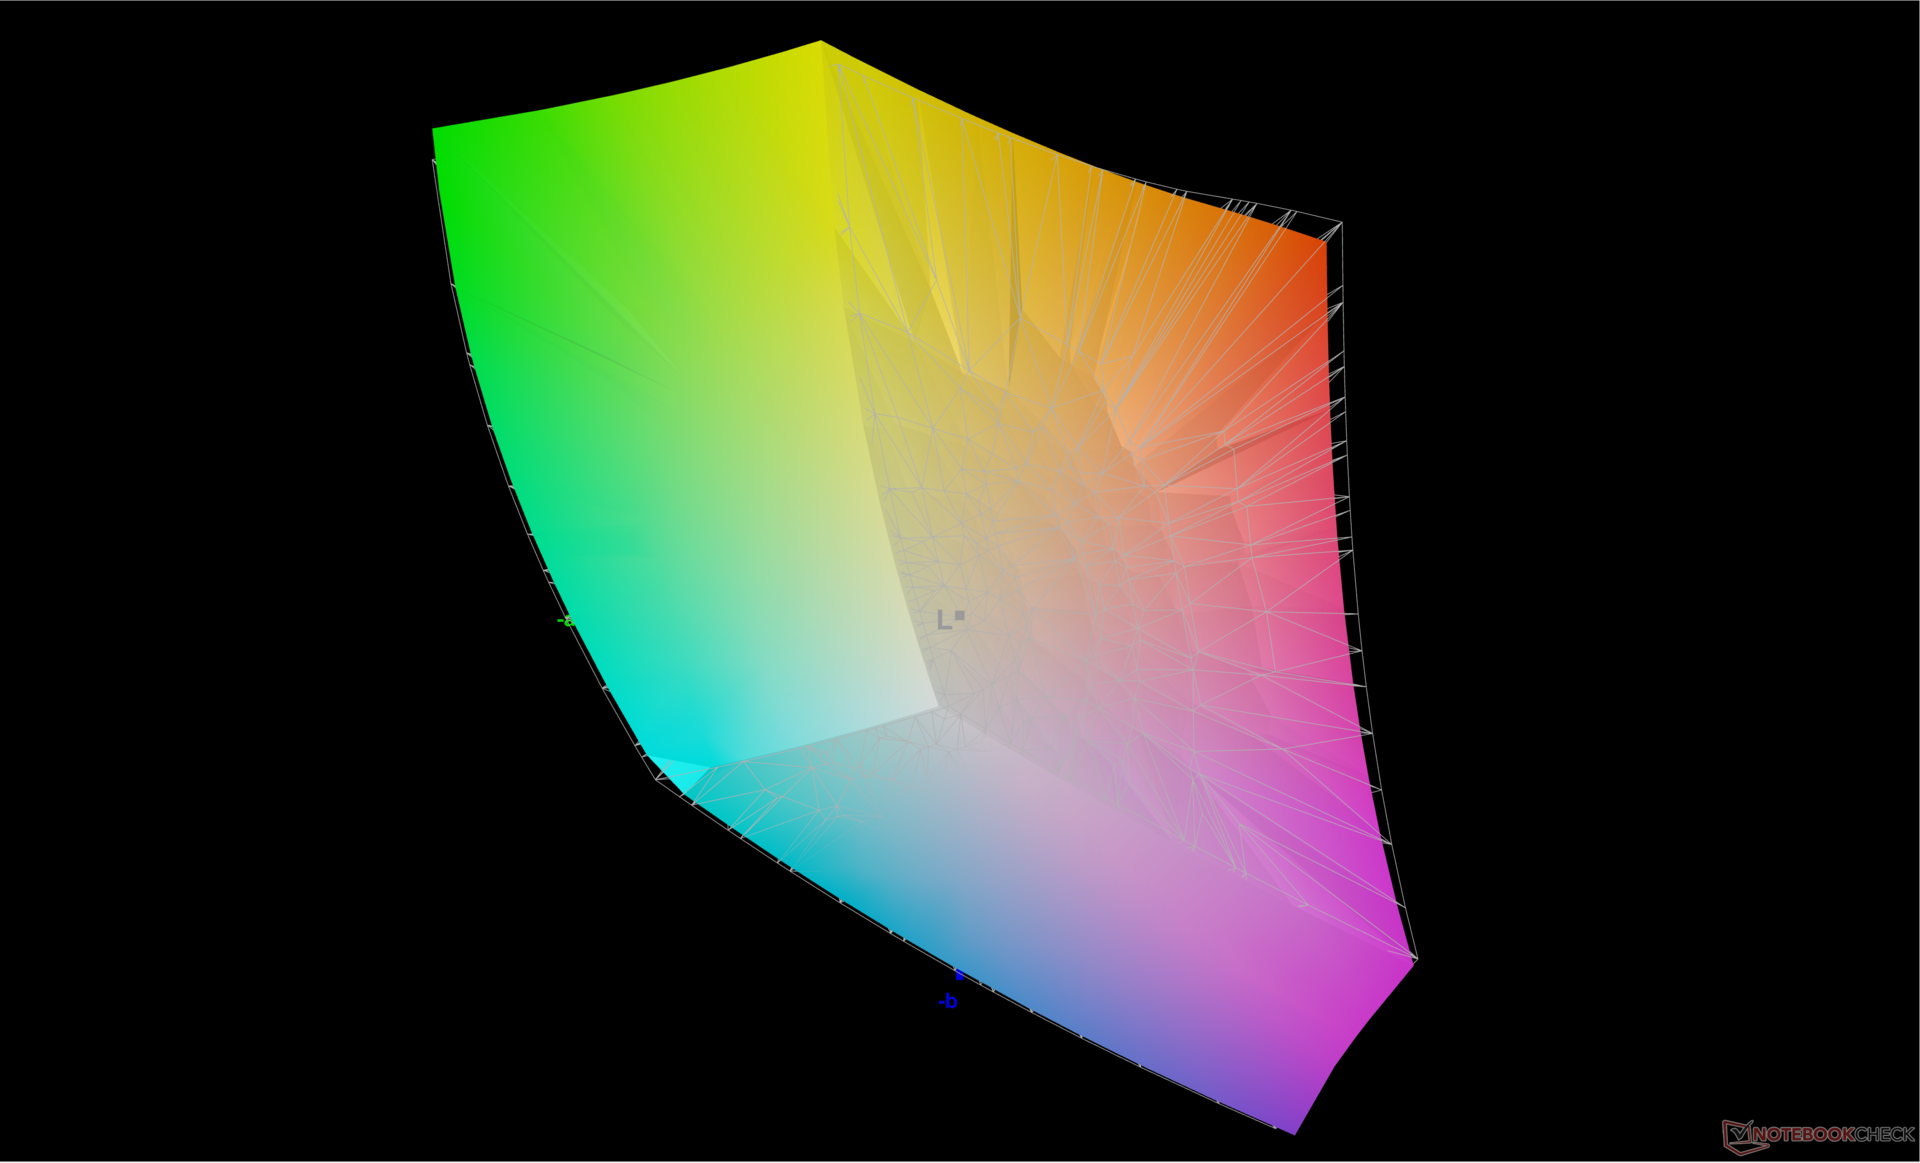
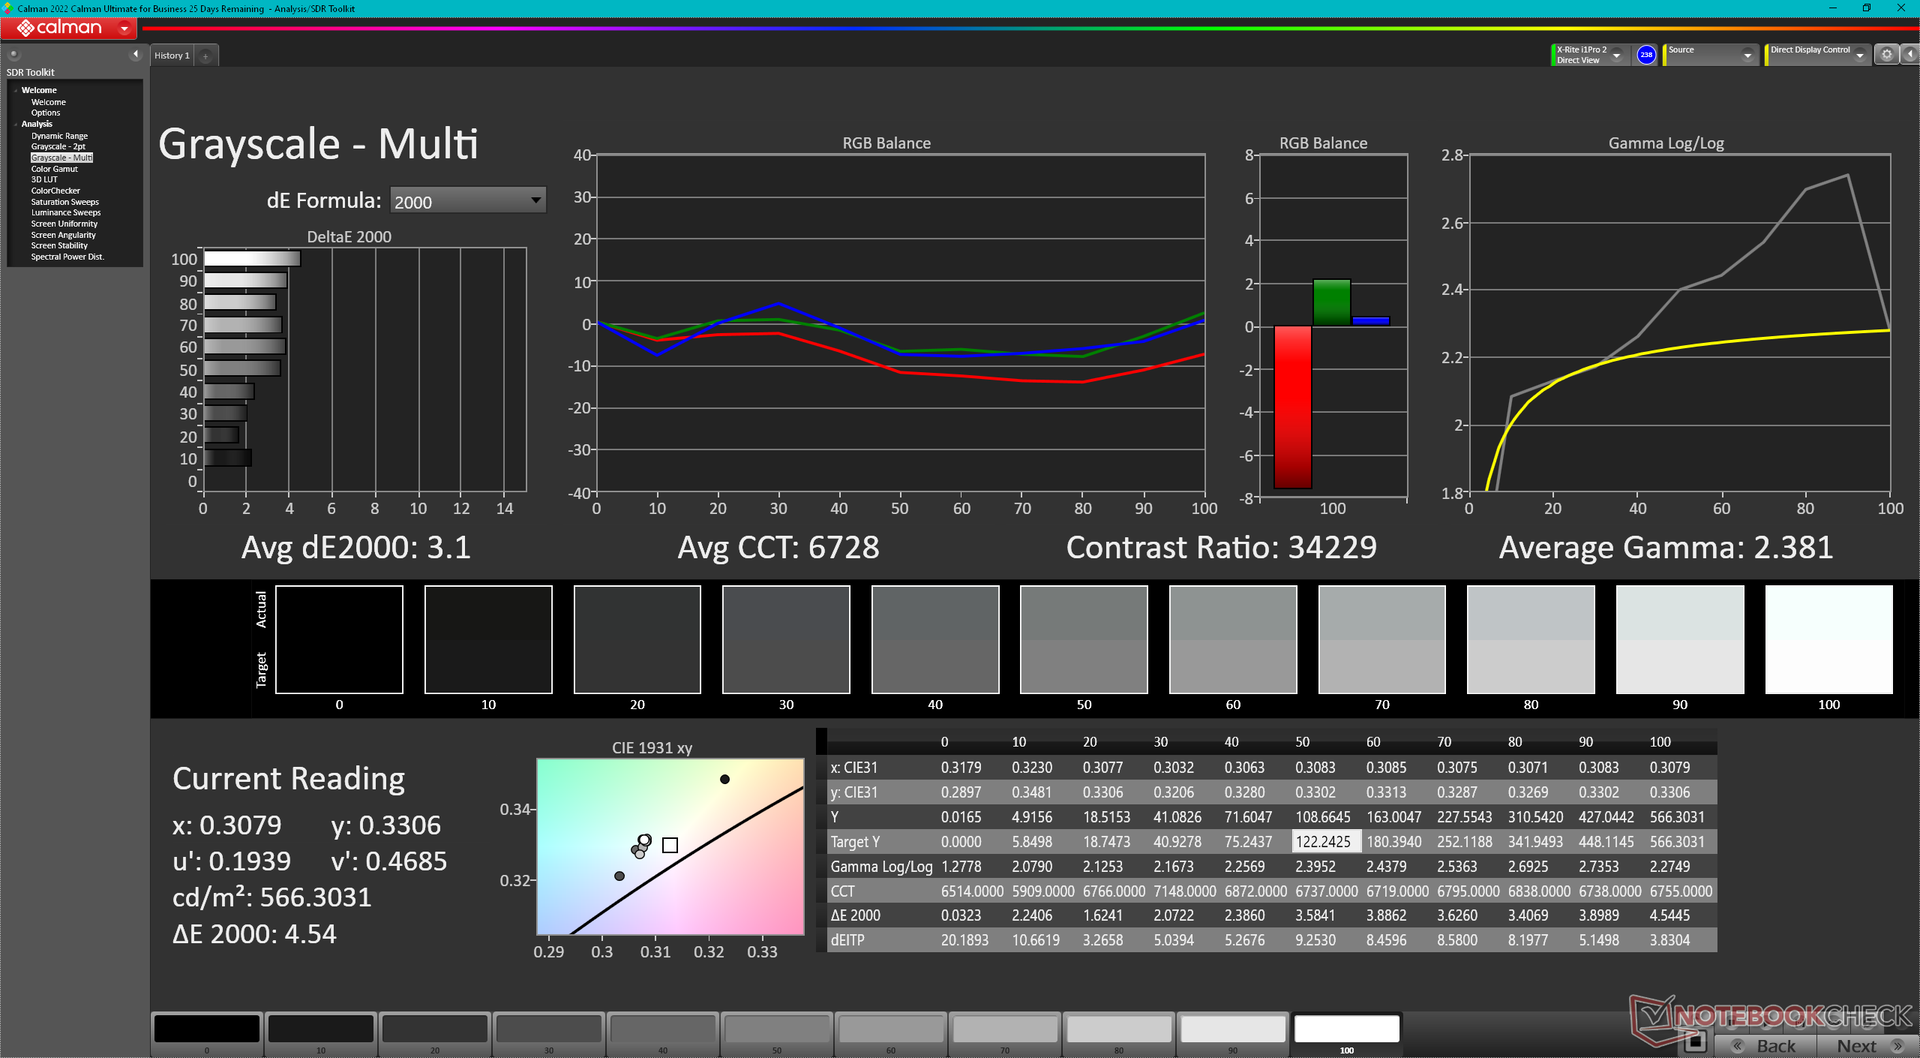
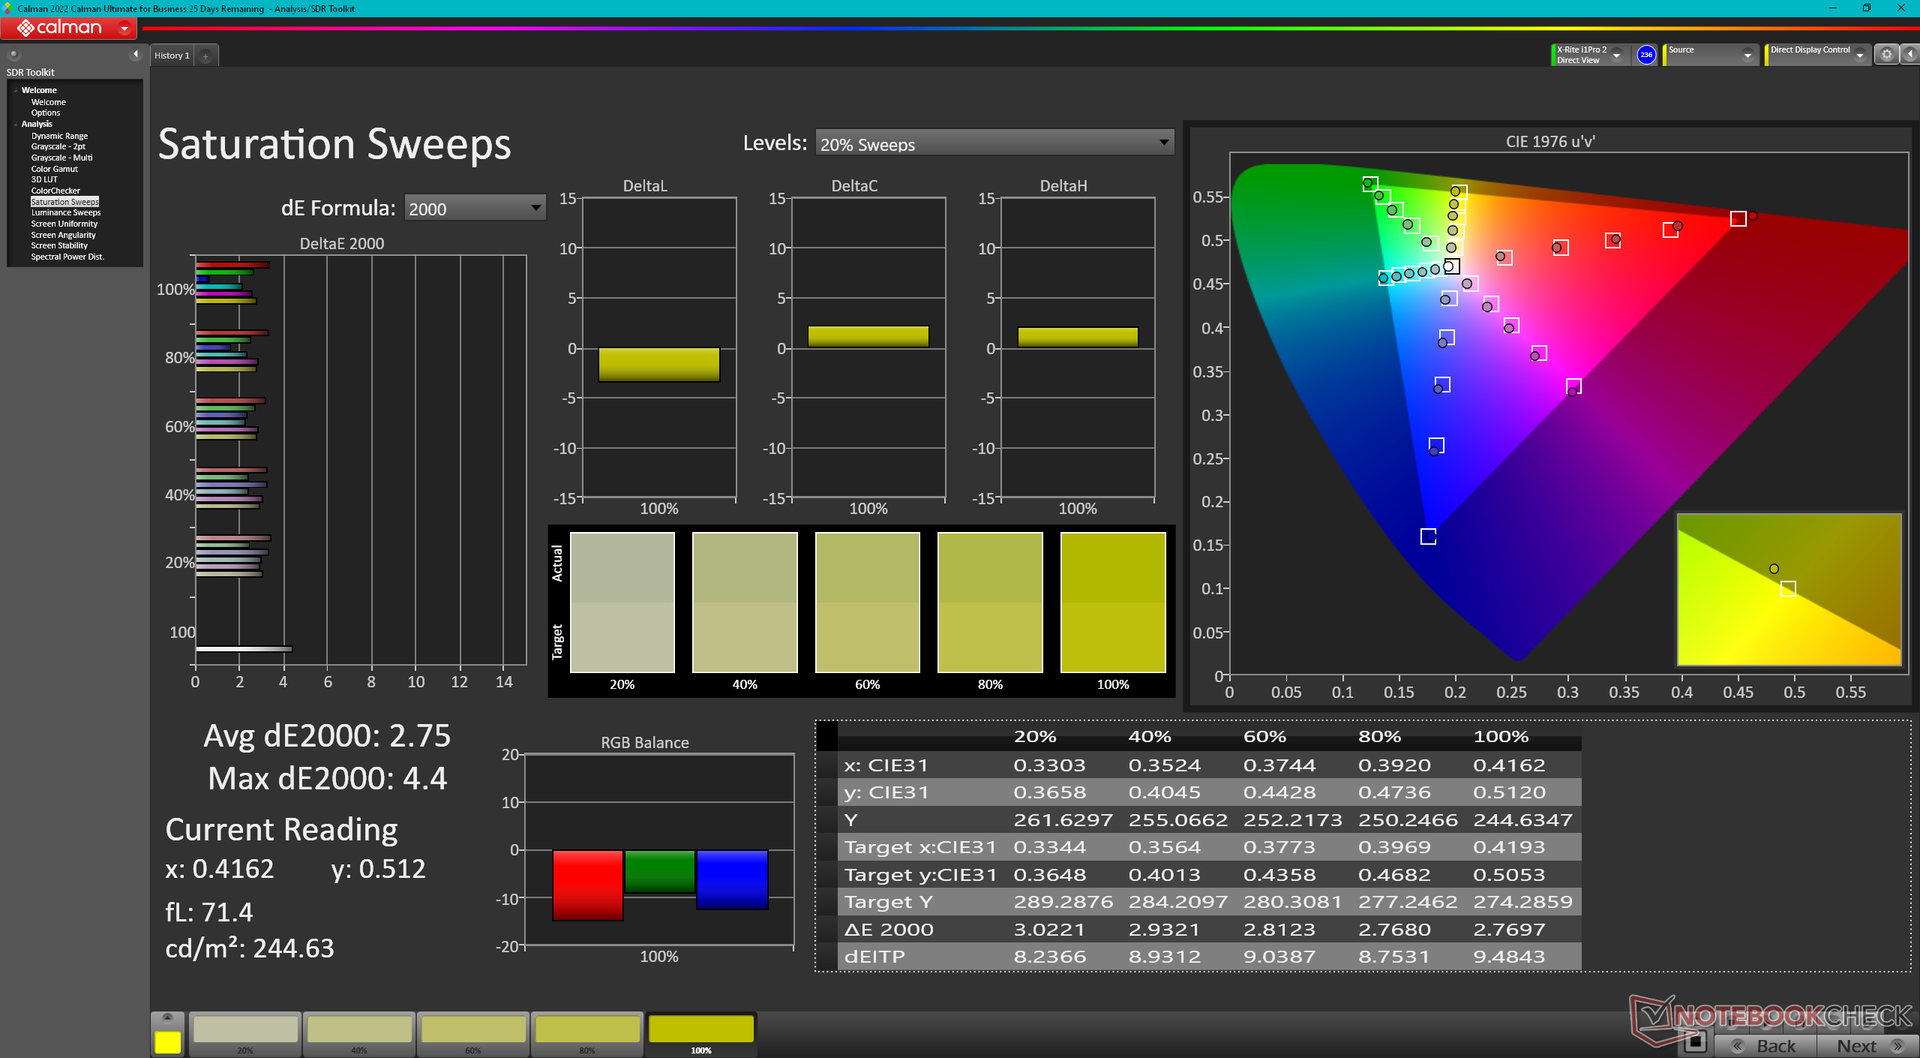
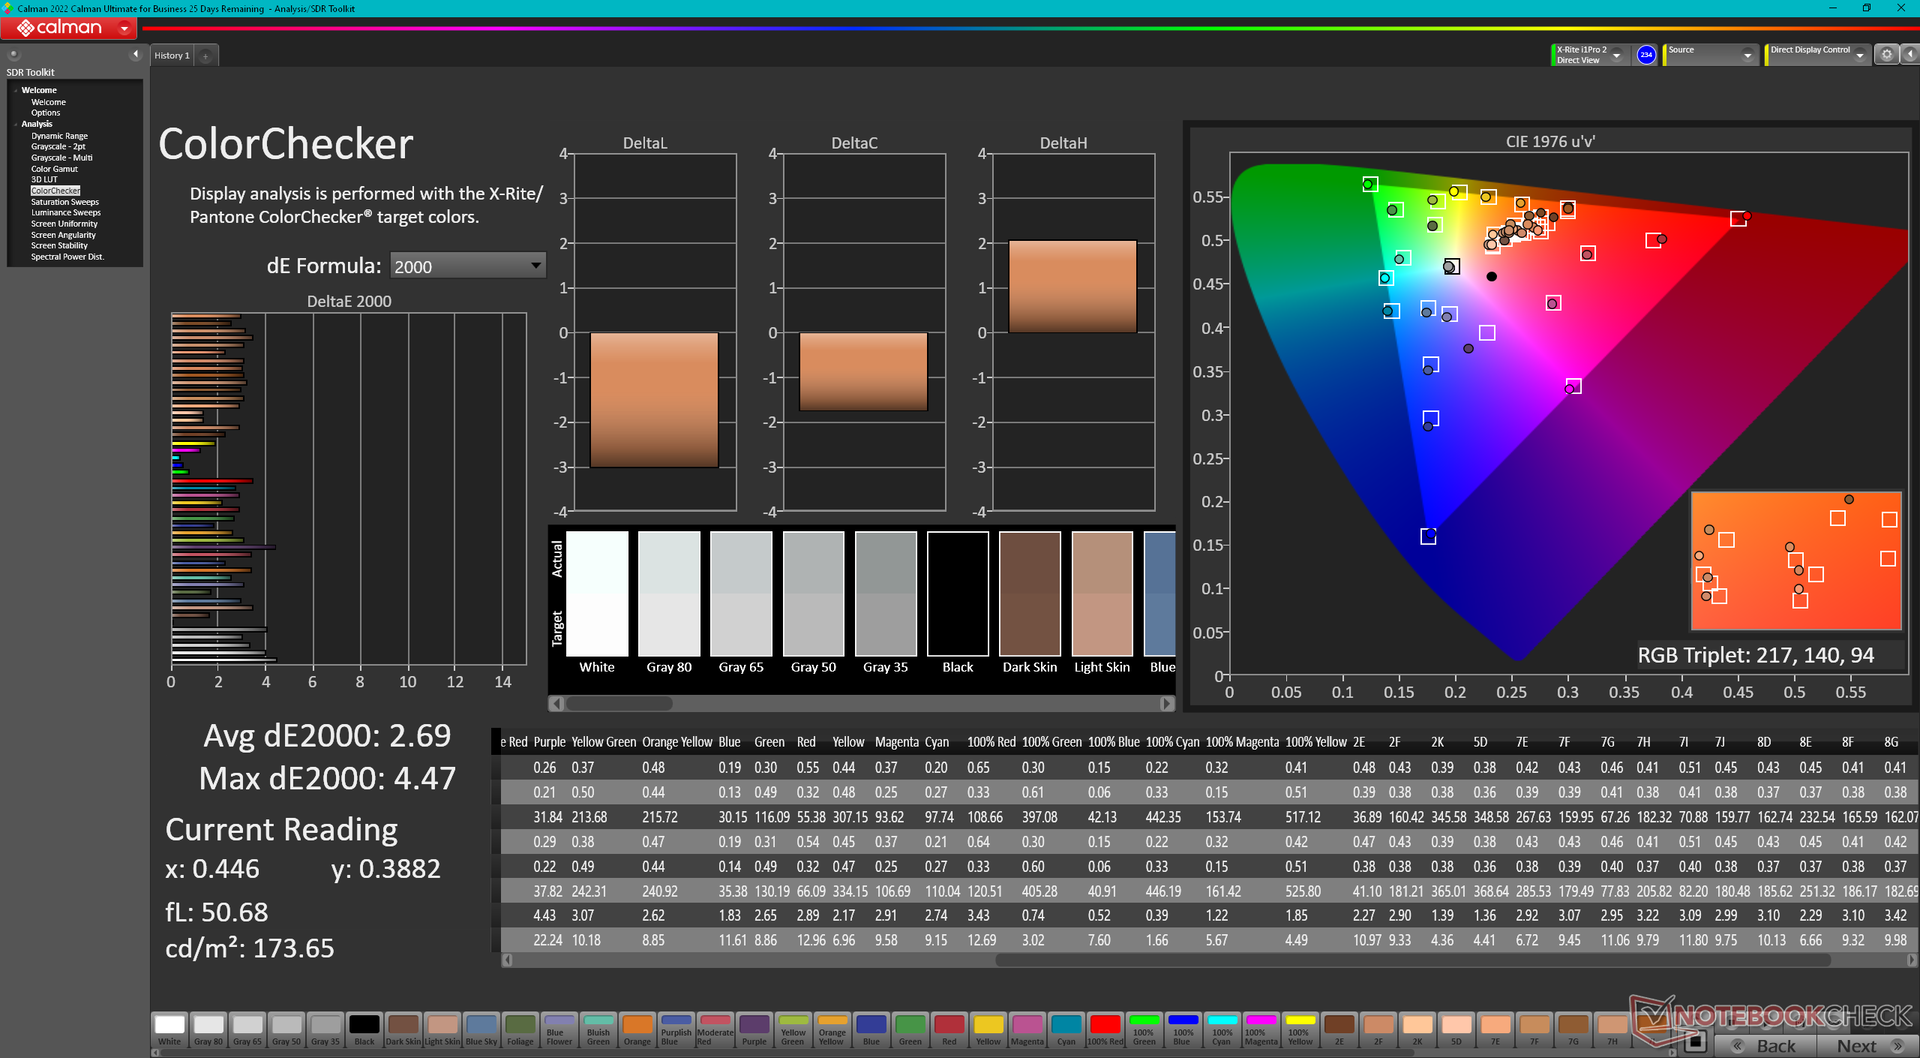
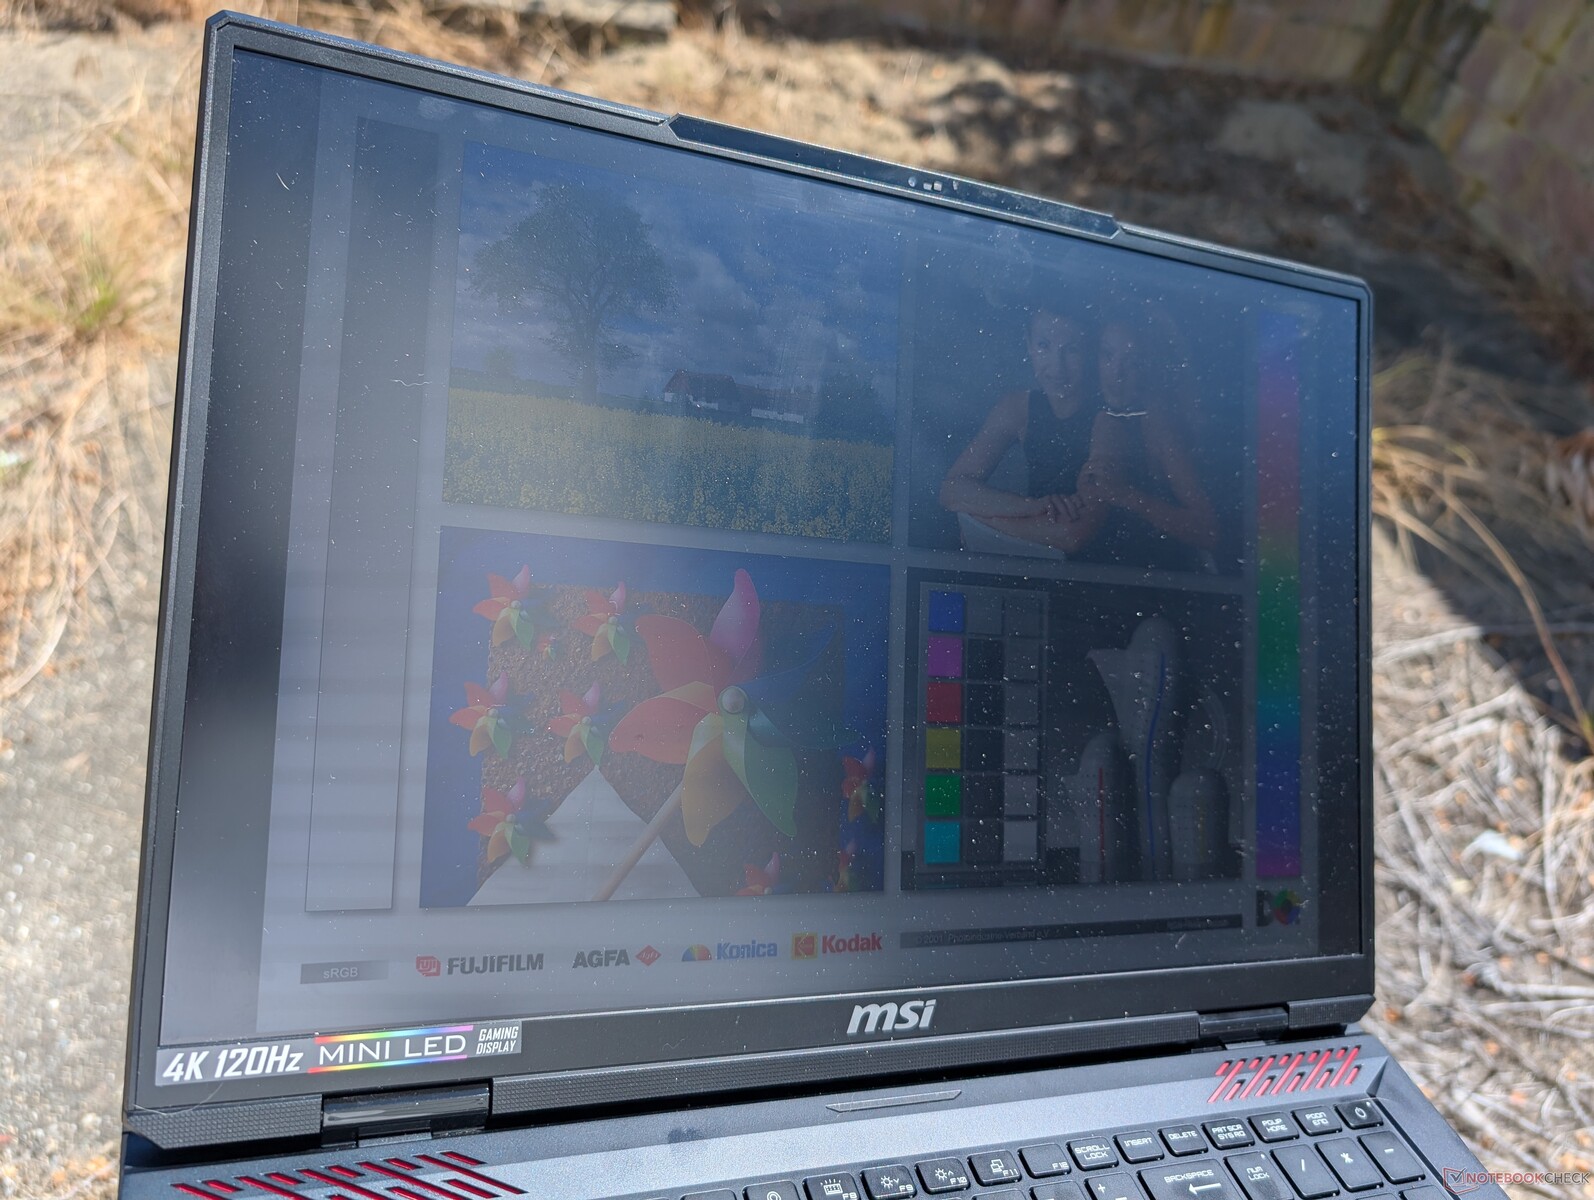
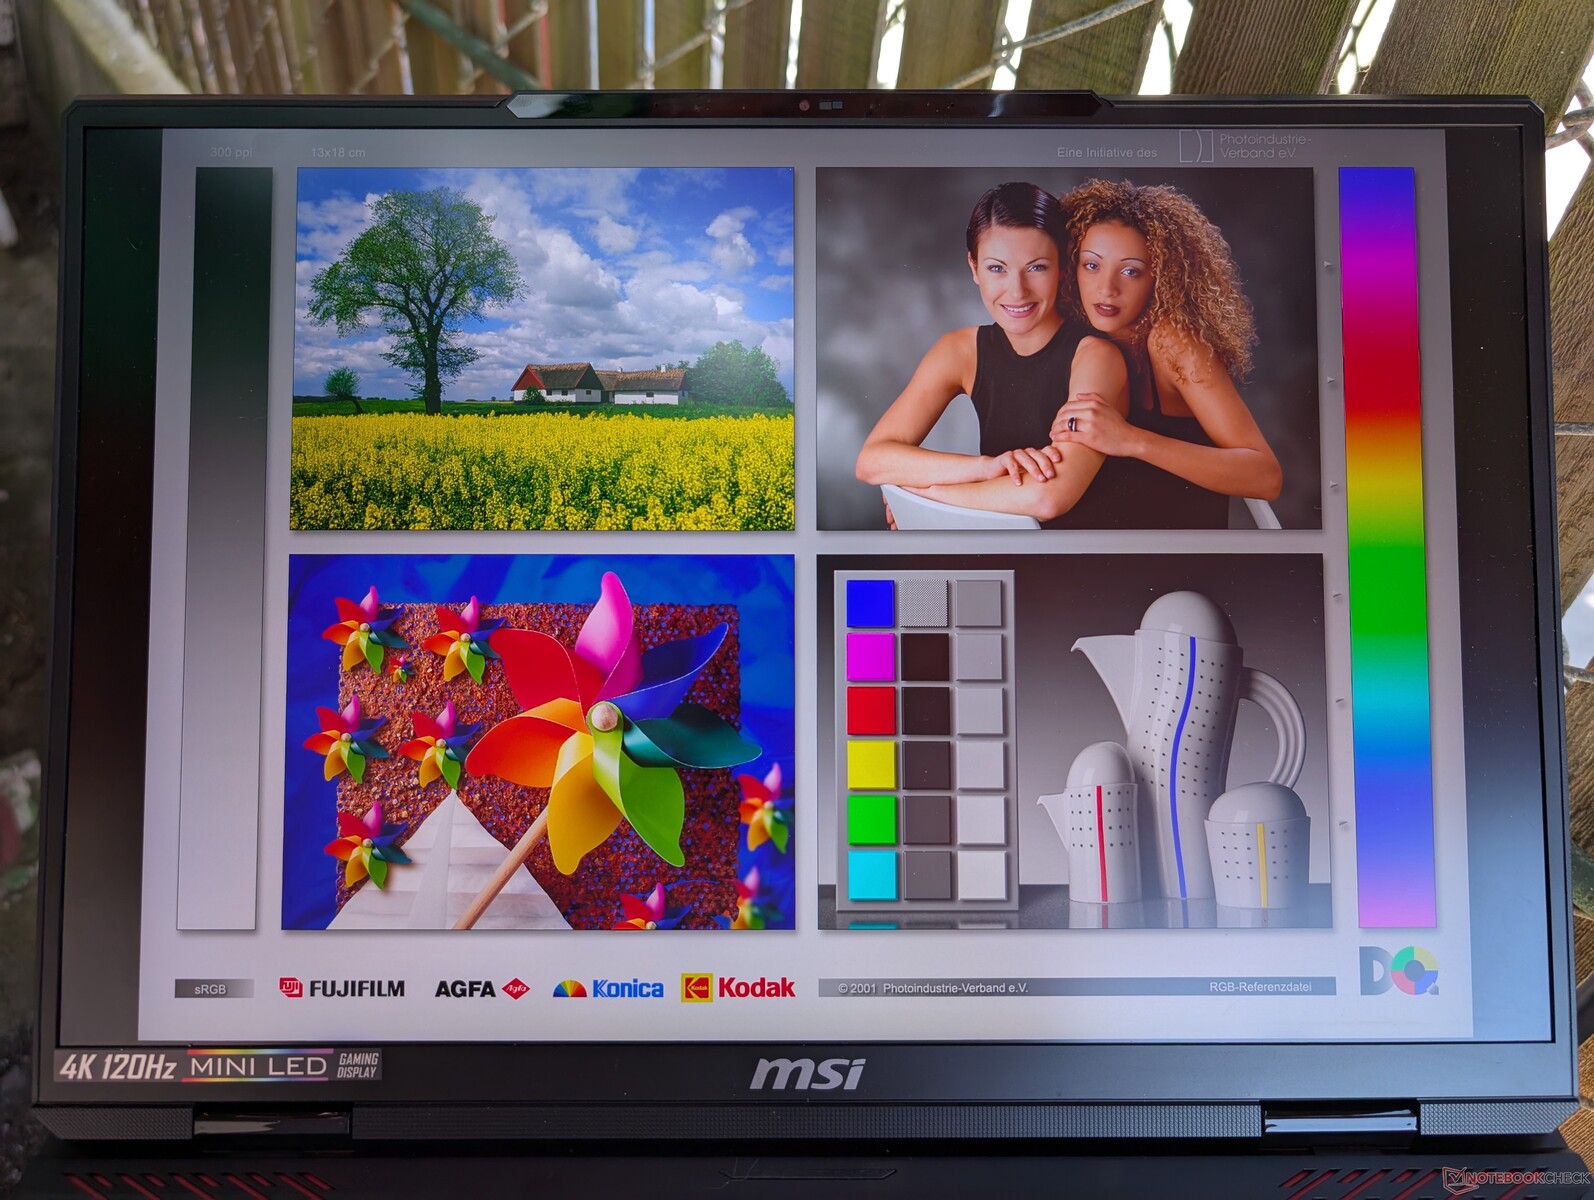
Beeldscherm - Titan 18 HX Experience For Less
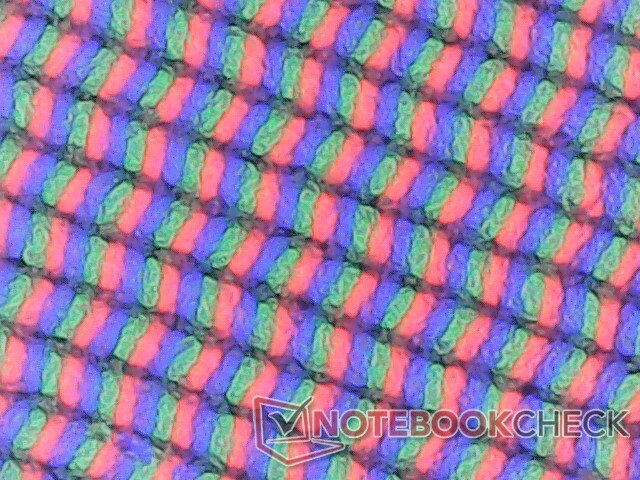
De Raider 18 HX wordt geleverd met exact hetzelfde AU Optronics B180ZAN01.0 120 Hz mini-LED-paneel als de Titan 18 HX voor een vrijwel identieke kijkervaring. De maximale helderheid is bijna 600 nits als HDR uit staat of 935 nits als HDR aan staat. Vergeleken met IPS of OLED biedt mini-LED een betere HDR-kijkervaring omdat het hogere helderheidsniveaus kan bereiken dan beide, maar wel meer stroom verbruikt. IPS- of OLED-laptops ondersteunen in het beste geval HDR600, terwijl mini-LED-panelen vaak HDR1000 beloven.
| |||||||||||||||||||||||||
Helderheidsverdeling: 94 %
Helderheid in Batterij-modus: 392.2 cd/m²
Contrast: ∞:1 (Zwart: 0 cd/m²)
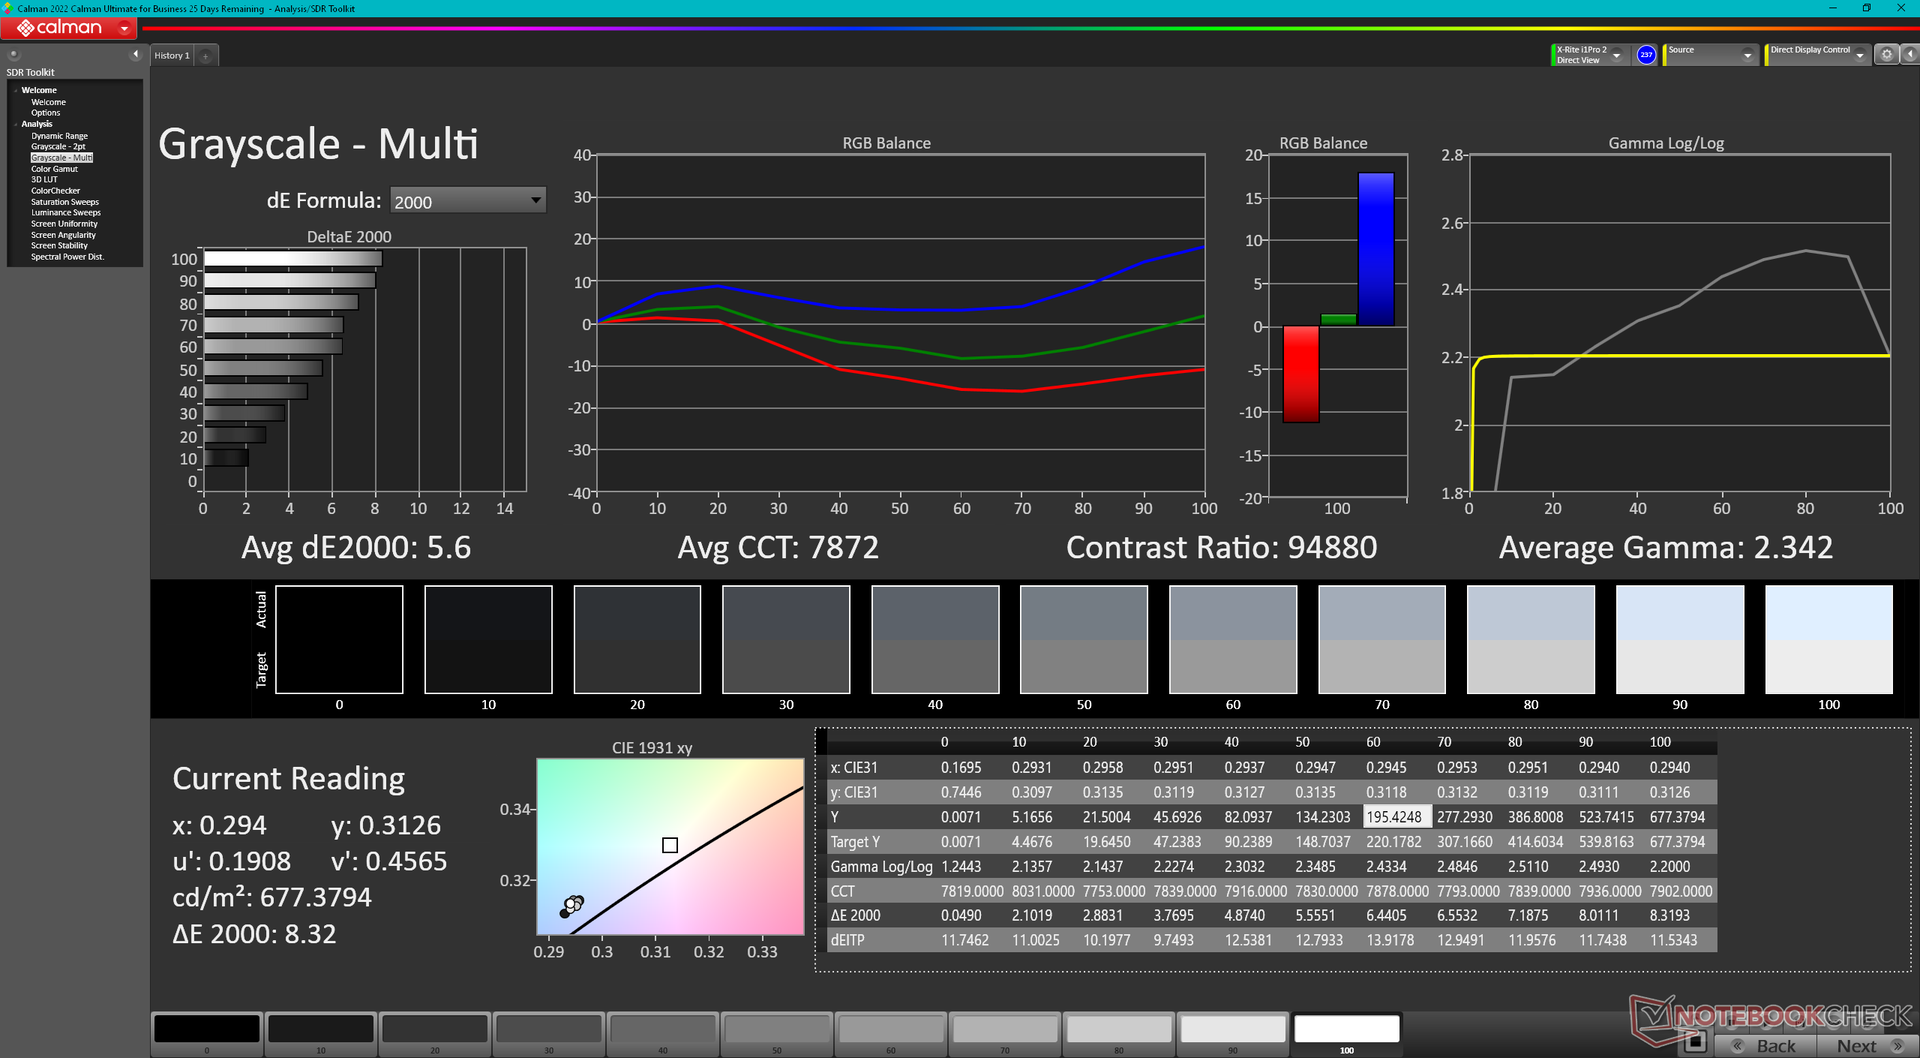
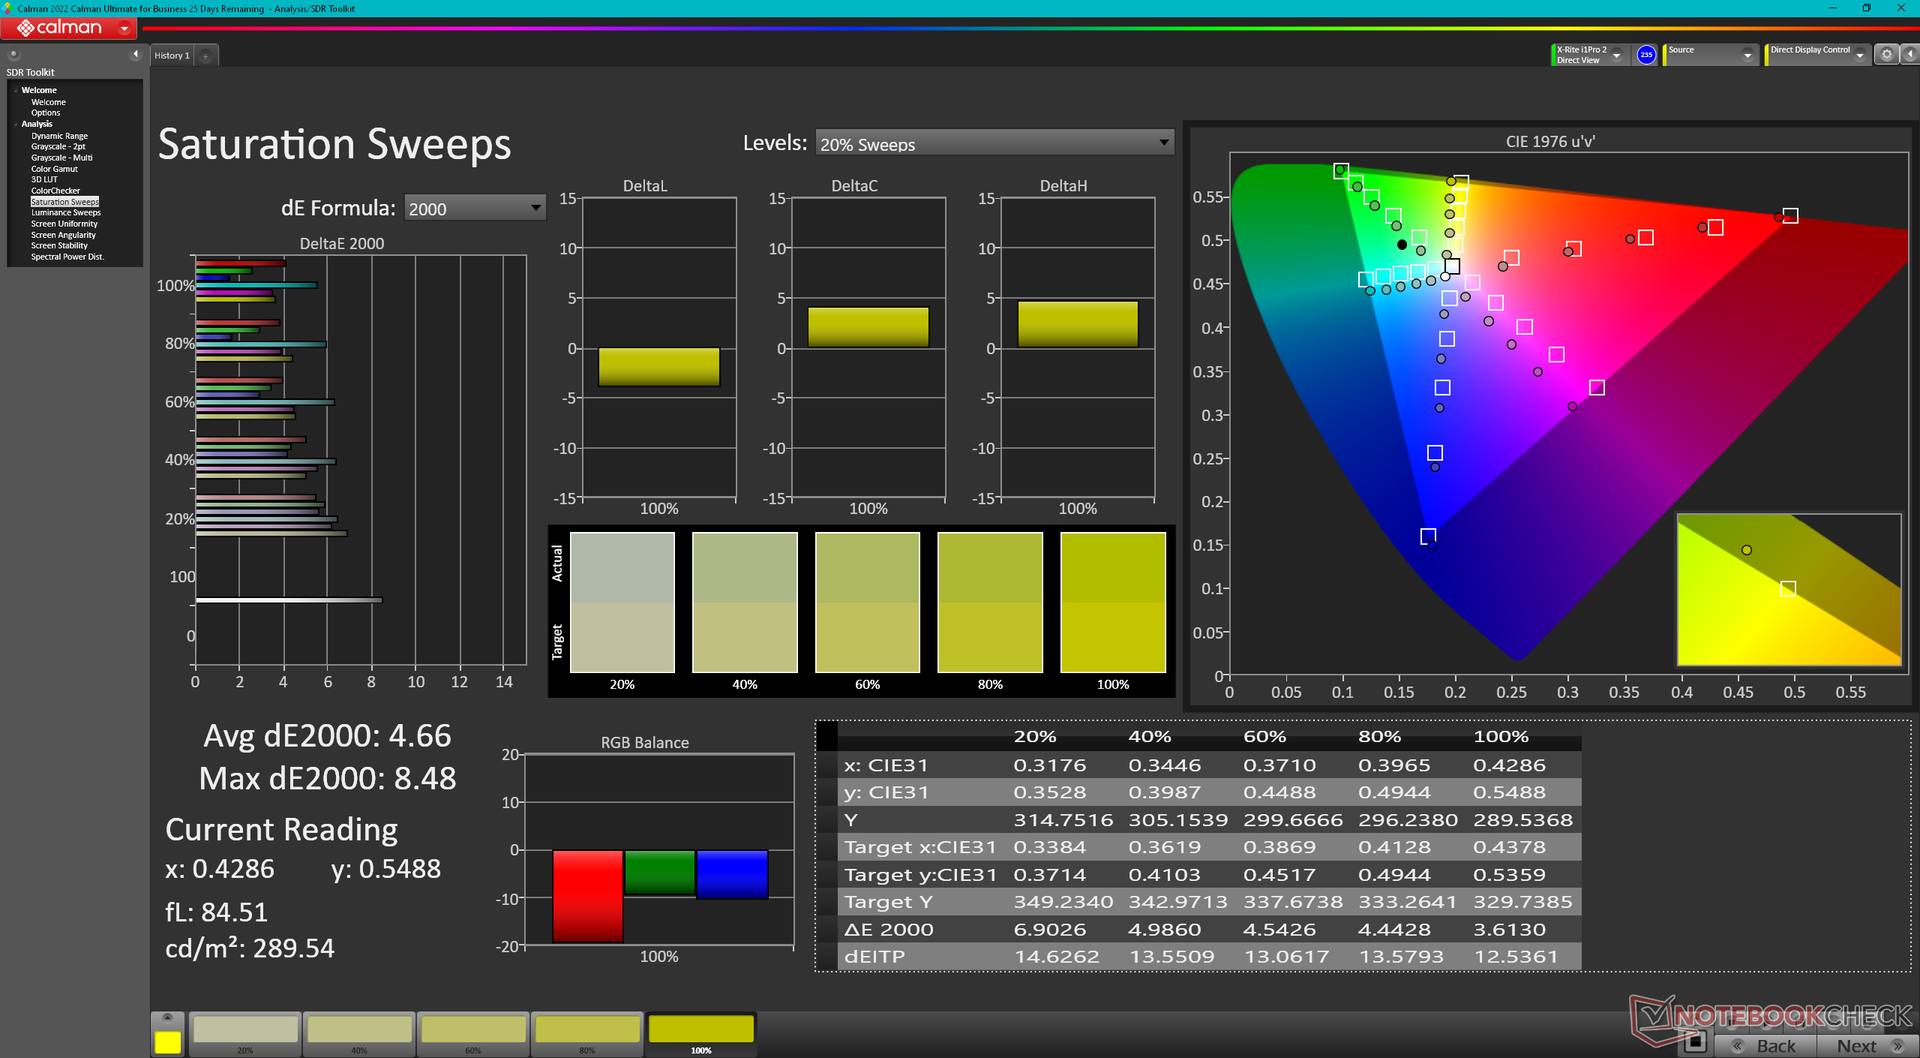
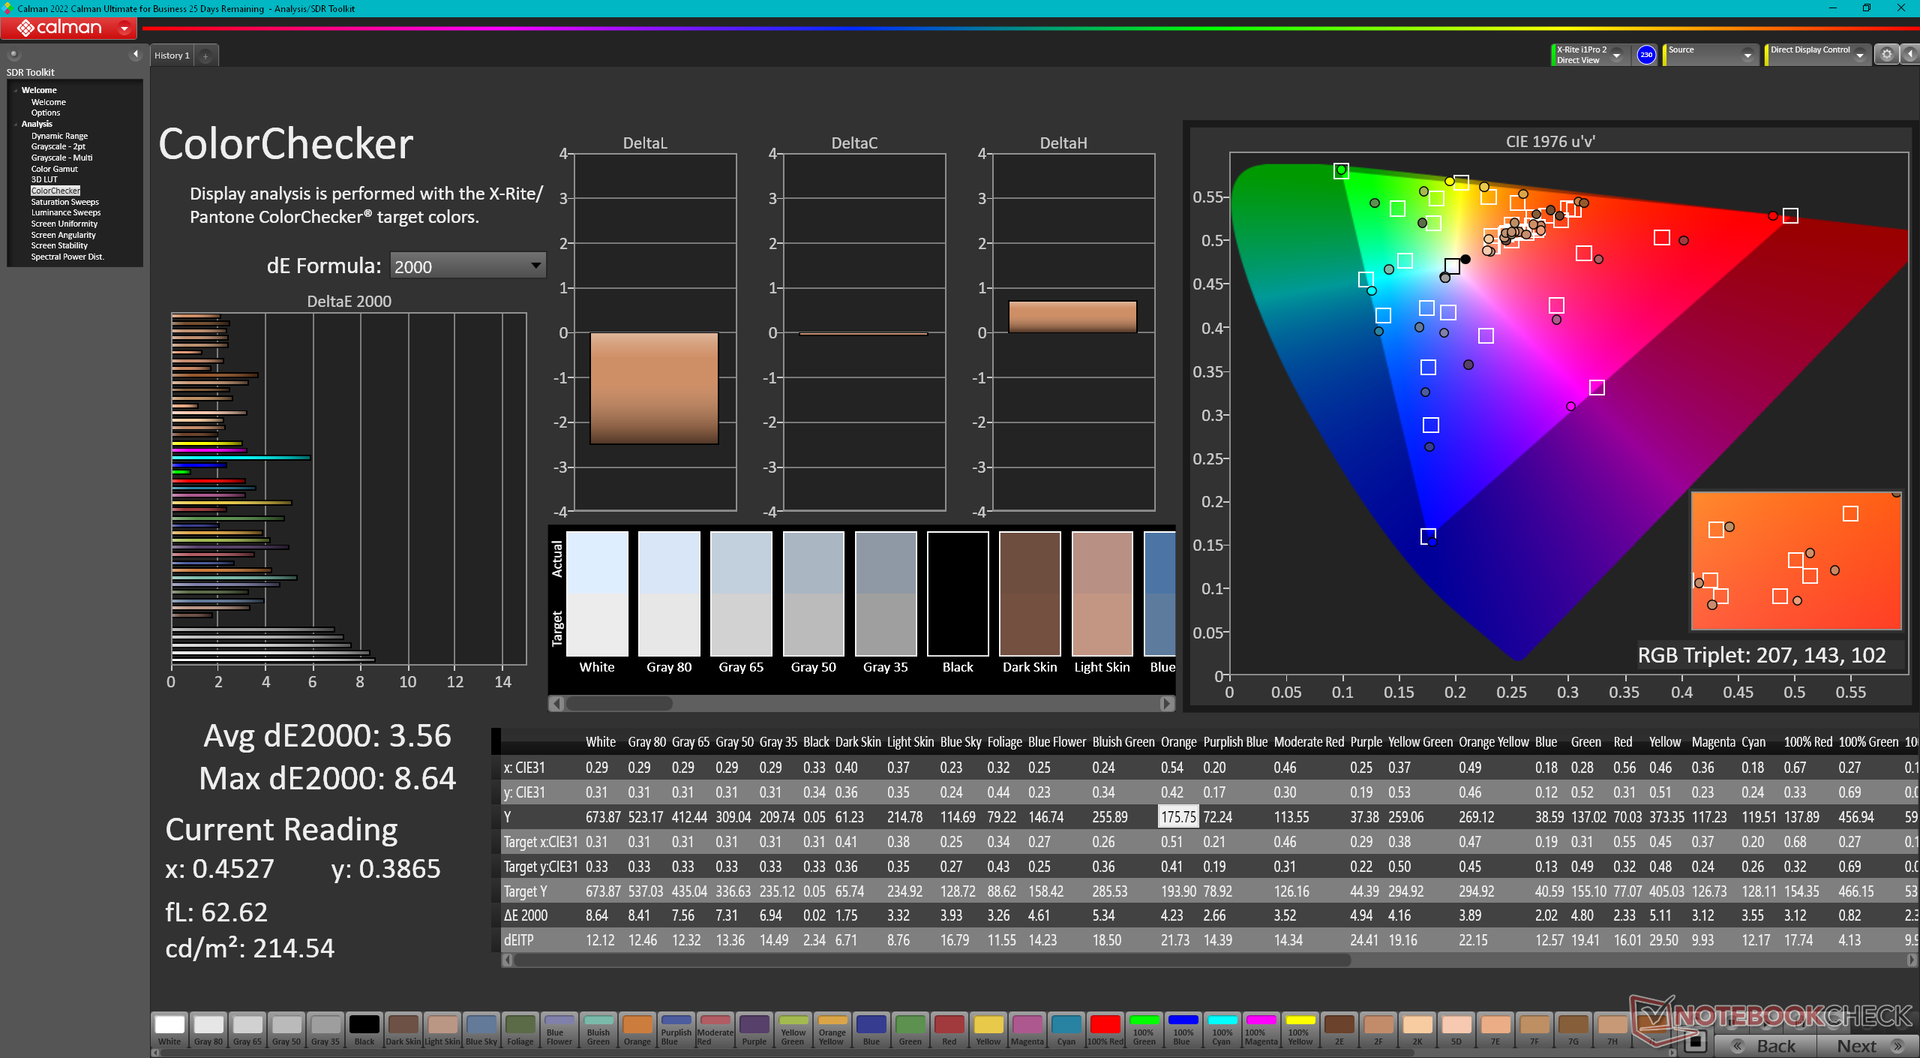
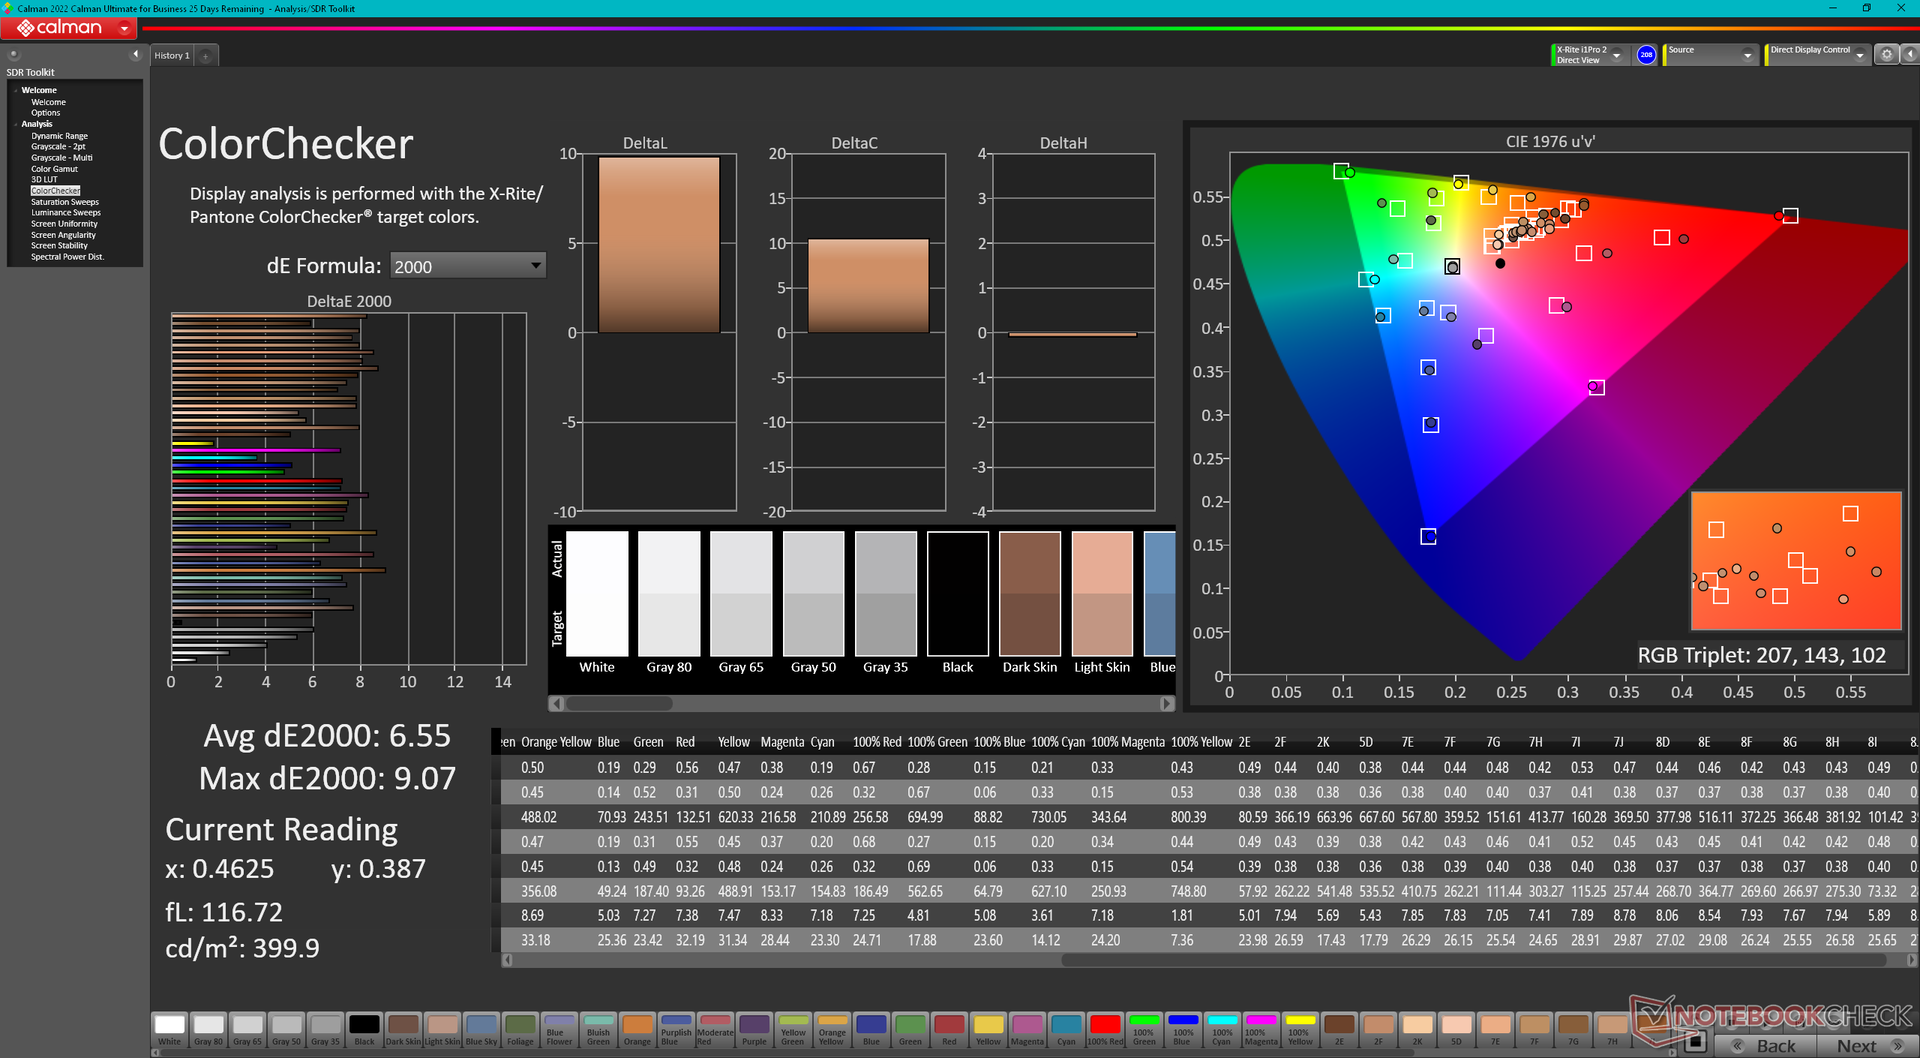
ΔE Color 3.56 | 0.5-29.43 Ø4.87, calibrated: 2.69
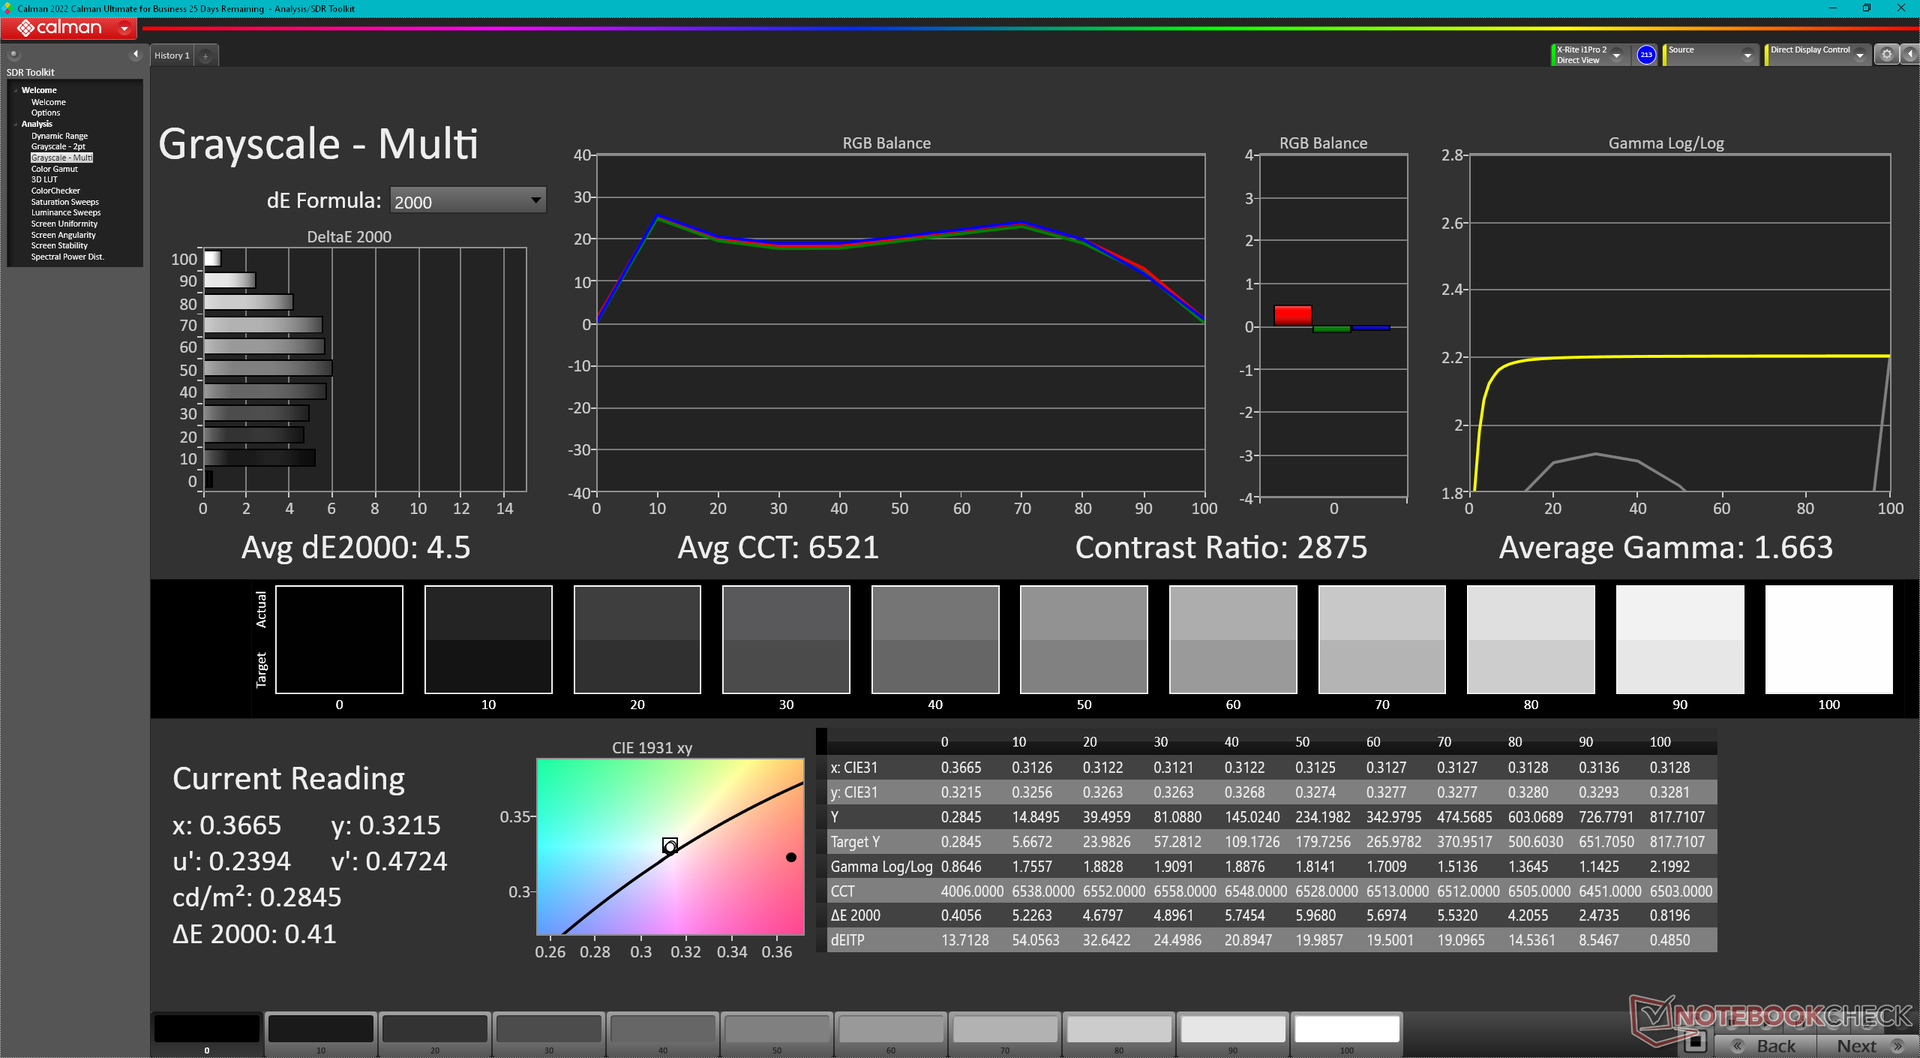
ΔE Greyscale 5.6 | 0.5-98 Ø5.1
84.8% AdobeRGB 1998 (Argyll 2.2.0 3D)
99.9% sRGB (Argyll 2.2.0 3D)
96.6% Display P3 (Argyll 2.2.0 3D)
Gamma: 2.34
| MSI Raider 18 HX A14V AU Optronics B180ZAN1.0, Mini-LED, 3840x2400, 18", 120 Hz | Razer Blade 18 2024 RZ09-0509 BOE NE180QDM-NM1, Mini-LED, 2560x1600, 18", 300 Hz | Alienware m18 R2 BOE NE18NZ1, IPS, 2560x1600, 18", 165 Hz | MSI Titan 18 HX A14VIG AU Optronics B180ZAN01.0, Mini-LED, 3840x2400, 18", 120 Hz | Asus ROG Strix G18 G814JI NE180QDM-NZ2 (BOE0B35), IPS, 2560x1600, 18", 240 Hz | Acer Predator Helios 18 PH18-72-98MW B180QAN01.2 (AUO45A8), Mini-LED, 2560x1600, 18", 250 Hz | |
|---|---|---|---|---|---|---|
| Display | 1% | 2% | 1% | 1% | 4% | |
| Display P3 Coverage | 96.6 | 99 2% | 97.8 1% | 98.1 2% | 98.1 2% | 99.7 3% |
| sRGB Coverage | 99.9 | 100 0% | 99.5 0% | 99.8 0% | 99.9 0% | 100 0% |
| AdobeRGB 1998 Coverage | 84.8 | 86.9 2% | 88.9 5% | 86.2 2% | 85.6 1% | 91.6 8% |
| Response Times | 341% | 68% | 3% | 67% | 62% | |
| Response Time Grey 50% / Grey 80% * | 10.4 ? | 7.6 ? 27% | 5.3 ? 49% | 8.6 ? 17% | 5.6 ? 46% | 8 ? 23% |
| Response Time Black / White * | 75.8 ? | 14 ? 82% | 10.4 ? 86% | 81.8 ? -8% | 9 ? 88% | 17.6 ? 77% |
| PWM Frequency | 2606.2 ? | 26444 ? 915% | 2592 ? -1% | 4832 ? 85% | ||
| Screen | 29% | 8% | 2% | 23% | 24% | |
| Brightness middle | 575.7 | 605.4 5% | 271.8 -53% | 467.5 -19% | 471 -18% | 722 25% |
| Brightness | 574 | 600 5% | 275 -52% | 459 -20% | 422 -26% | 724 26% |
| Brightness Distribution | 94 | 97 3% | 78 -17% | 90 -4% | 83 -12% | 93 -1% |
| Black Level * | 0.62 | 0.27 | 0.47 | 0.04 | ||
| Colorchecker dE 2000 * | 3.56 | 1.53 57% | 2.48 30% | 3.77 -6% | 2.05 42% | 3.4 4% |
| Colorchecker dE 2000 max. * | 8.64 | 4.15 52% | 5.59 35% | 6.12 29% | 4.15 52% | 5.32 38% |
| Colorchecker dE 2000 calibrated * | 2.69 | 0.56 79% | 2.94 -9% | 0.8 70% | 1.6 41% | |
| Greyscale dE 2000 * | 5.6 | 2.6 54% | 3.7 34% | 3.2 43% | 2.8 50% | 3.8 32% |
| Gamma | 2.34 94% | 2.22 99% | 2.2 100% | 2.43 91% | 2.204 100% | 2.383 92% |
| CCT | 7872 83% | 6843 95% | 6355 102% | 6478 100% | 7122 91% | 7051 92% |
| Contrast | 976 | 1007 | 1002 | 18050 | ||
| Totaal Gemiddelde (Programma / Instellingen) | 124% /
100% | 26% /
16% | 2% /
2% | 30% /
25% | 30% /
28% |
* ... kleiner is beter
De kleurtemperatuur wanneer deze is ingesteld op Display P3 en HDR is uitgeschakeld, is met 7872 vrij koel. Als u HDR inschakelt, worden automatisch alle MSI TrueColor-instellingen uitgeschakeld, maar de kleurtemperatuur wordt ook automatisch warmer op 6521 voor nauwkeurigere kleuren. MSI adverteert niet met fabriekskalibratie voor dit Raider-model.
Responstijd Scherm
| ↔ Responstijd Zwart naar Wit | ||
|---|---|---|
| 75.8 ms ... stijging ↗ en daling ↘ gecombineerd | ↗ 71 ms stijging | 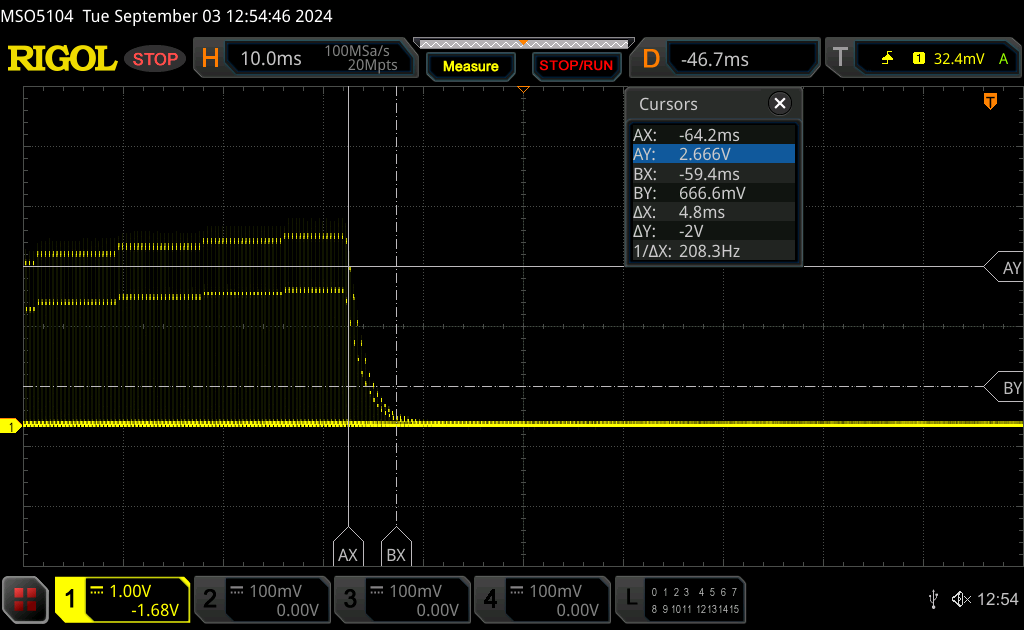 |
| ↘ 4.8 ms daling | ||
| Het scherm vertoonde trage responstijden in onze tests en is misschien te traag voor games. Ter vergelijking: alle testtoestellen variëren van 0.1 (minimum) tot 240 (maximum) ms. » 100 % van alle toestellen zijn beter. Dit betekent dat de gemeten responstijd slechter is dan het gemiddelde (20.8 ms) van alle geteste toestellen. | ||
| ↔ Responstijd 50% Grijs naar 80% Grijs | ||
| 10.4 ms ... stijging ↗ en daling ↘ gecombineerd | ↗ 4.8 ms stijging | 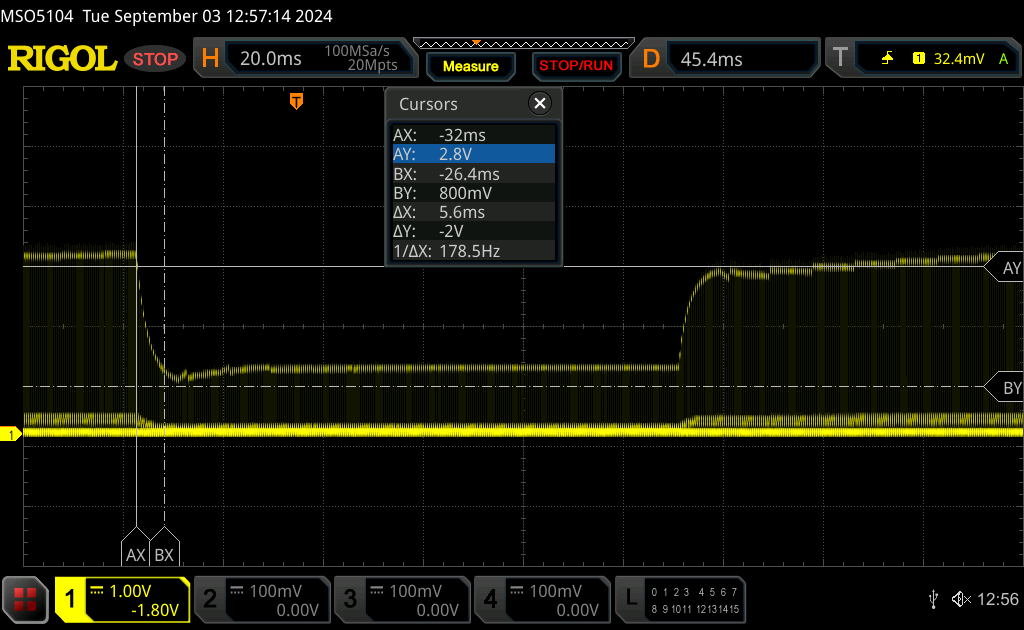 |
| ↘ 5.6 ms daling | ||
| Het scherm vertoonde prima responstijden in onze tests maar is misschien wat te traag voor competitieve games. Ter vergelijking: alle testtoestellen variëren van 0.165 (minimum) tot 636 (maximum) ms. » 21 % van alle toestellen zijn beter. Dit betekent dat de gemeten responstijd beter is dan het gemiddelde (32.5 ms) van alle geteste toestellen. | ||
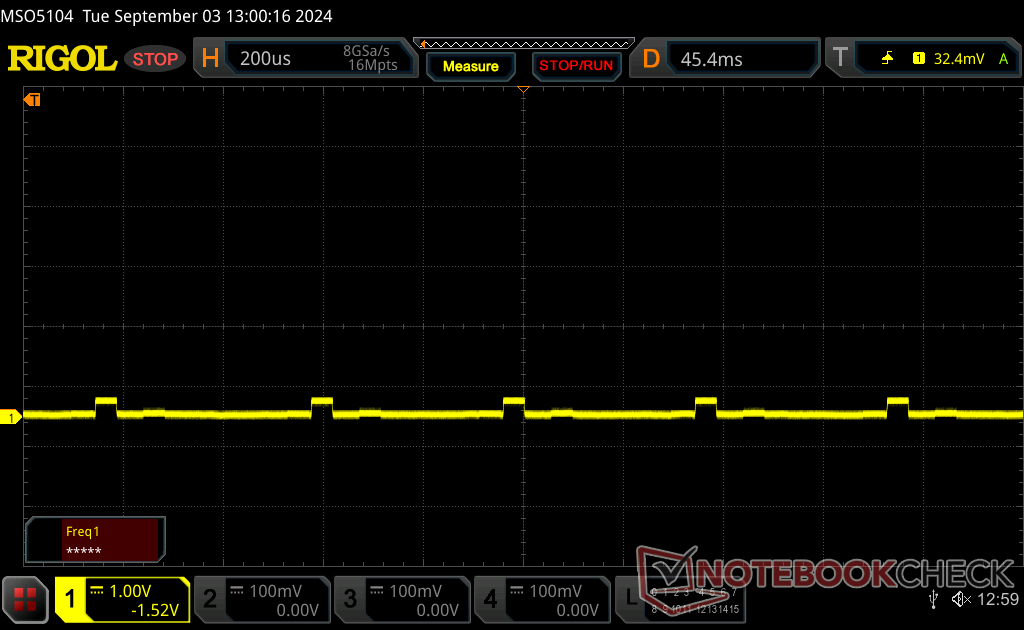
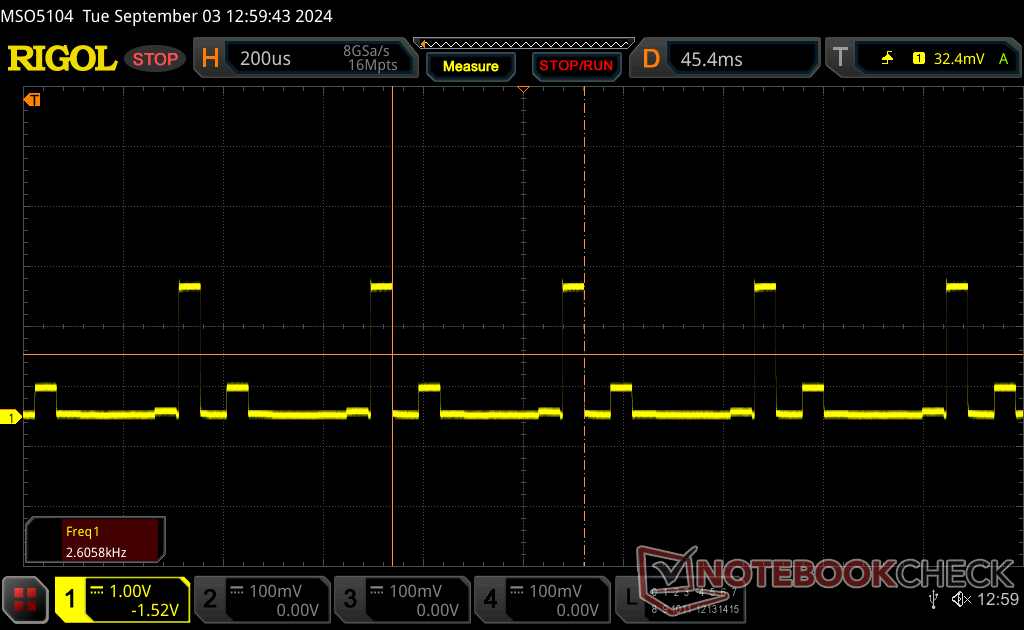
Screen Flickering / PWM (Pulse-Width Modulation)
| Screen flickering / PWM waargenomen | 2606.2 Hz Amplitude: 90 % | ≤ 100 % helderheid instelling | 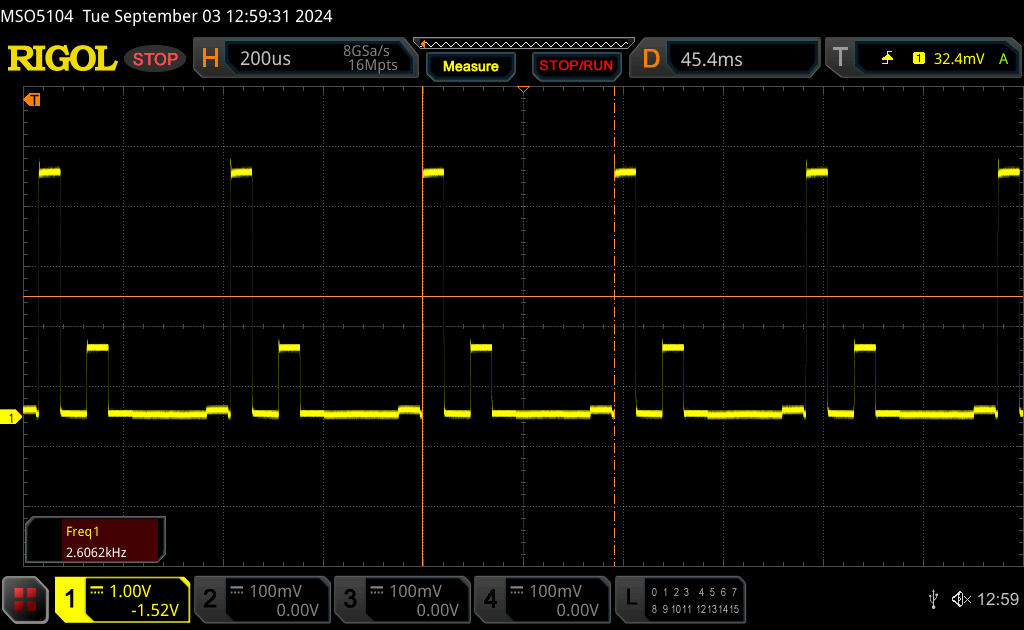 |
De achtergrondverlichting van het scherm flikkert op 2606.2 Hz (in het slechtste geval, bijvoorbeeld bij gebruik van PWM) aan een helderheid van 100 % en lager. Boven deze helderheid zou er geen flickering / PWM mogen optreden. De frequentie van 2606.2 Hz is redelijk hoog en de meeste mensen die gevoelig zijn aan flickering zouden dit dus niet mogen waarnemen of geïrriteerde ogen krijgen. Ter vergelijking: 53 % van alle geteste toestellen maakten geen gebruik van PWM om de schermhelderheid te verlagen. Als het wel werd gebruikt, werd een gemiddelde van 8516 (minimum: 5 - maximum: 343500) Hz waargenomen. | |||


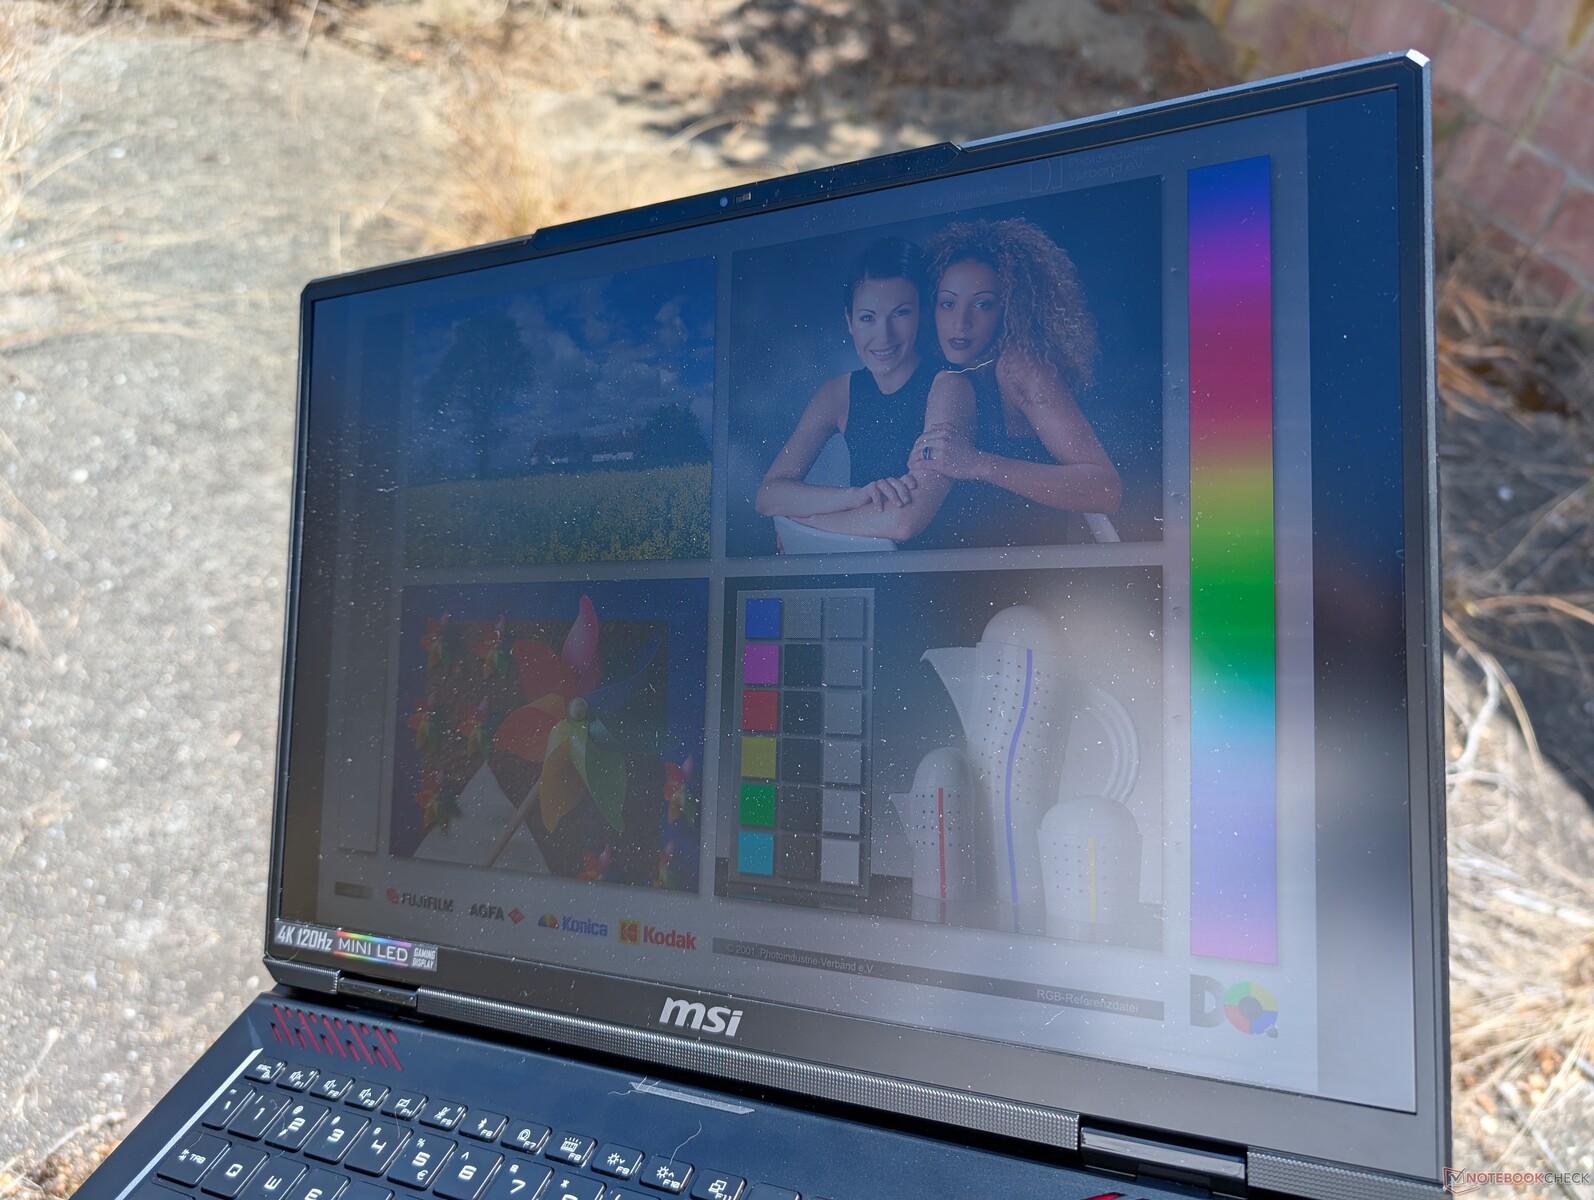
De zichtbaarheid buiten is alleen fatsoenlijk in de schaduw en niet zo geweldig in zonlicht. Als u op de batterij werkt, wordt de maximale helderheid verlaagd tot slechts 392 nits en wordt Windows HDR automatisch uitgeschakeld.
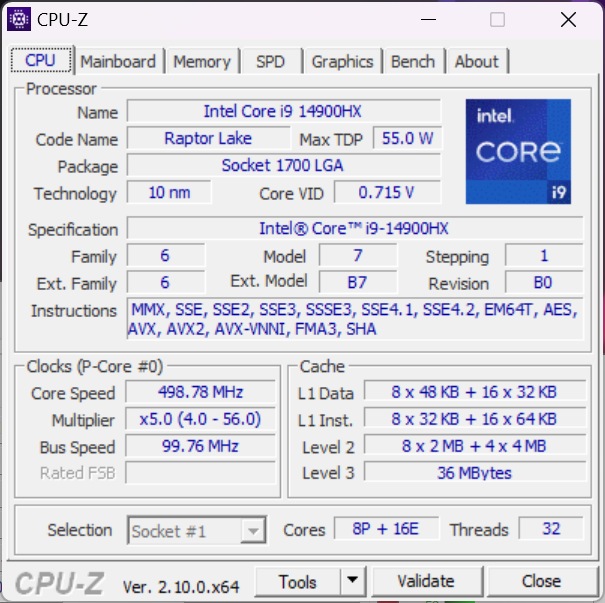
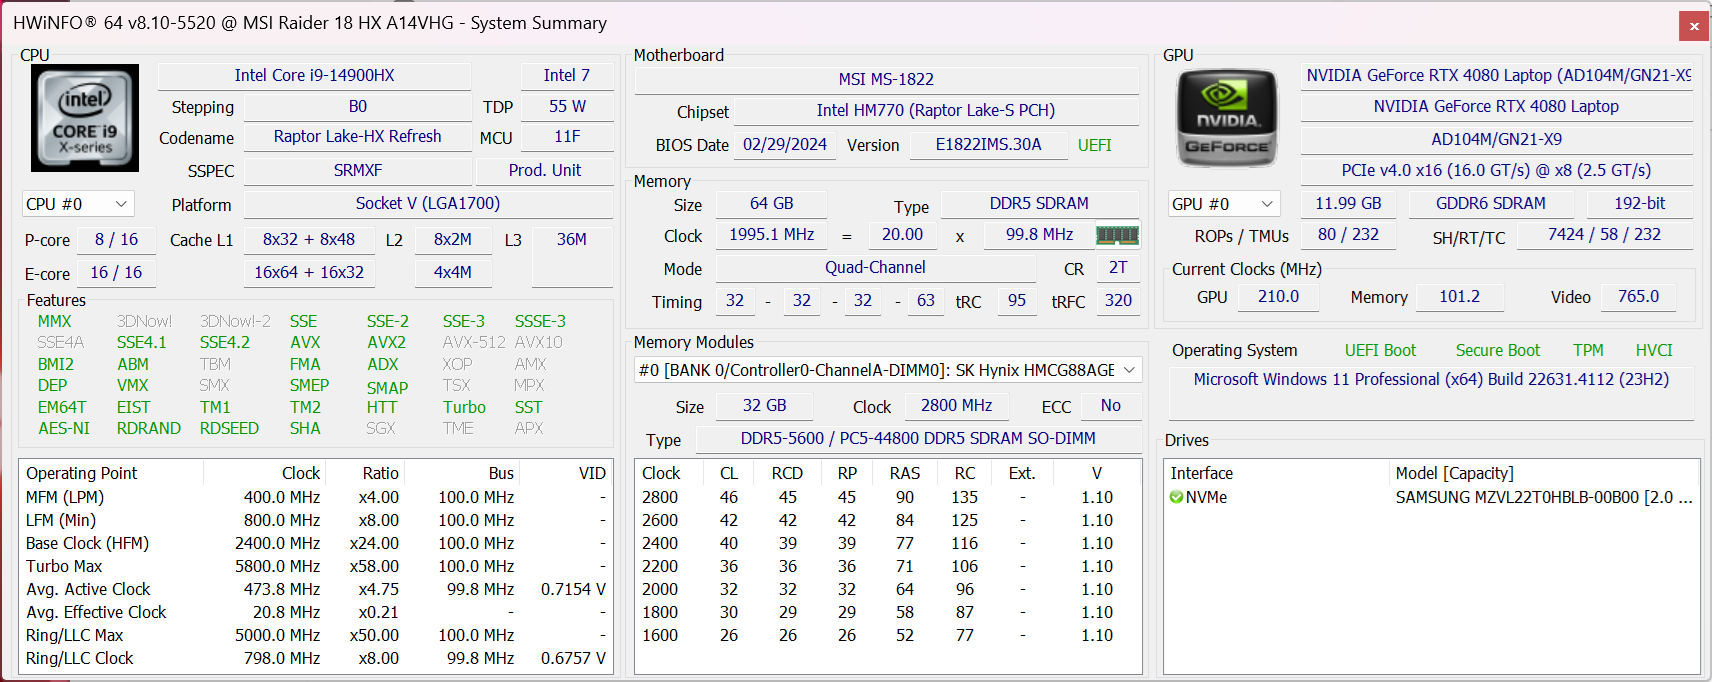
Prestaties - Nieuwe CPU-naam, dezelfde CPU-prestaties
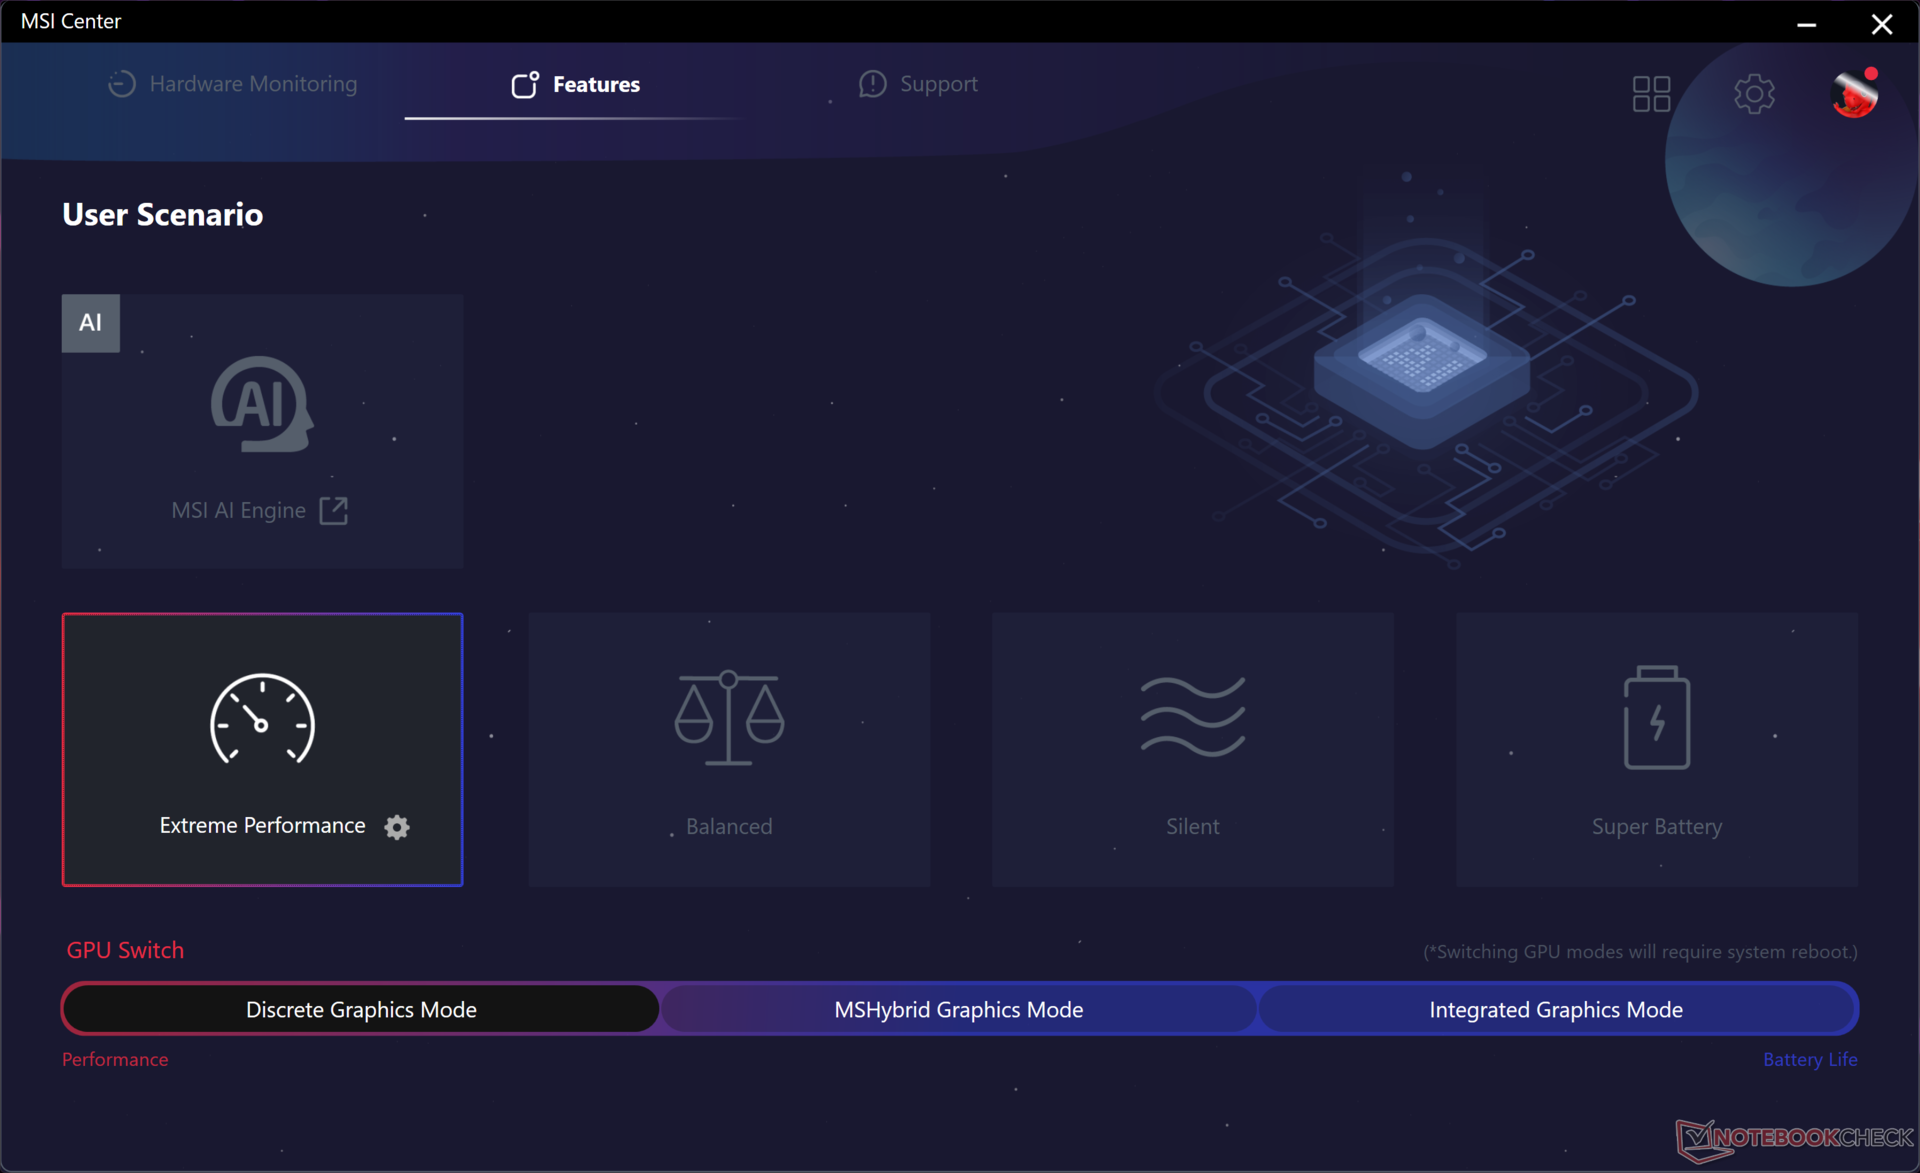
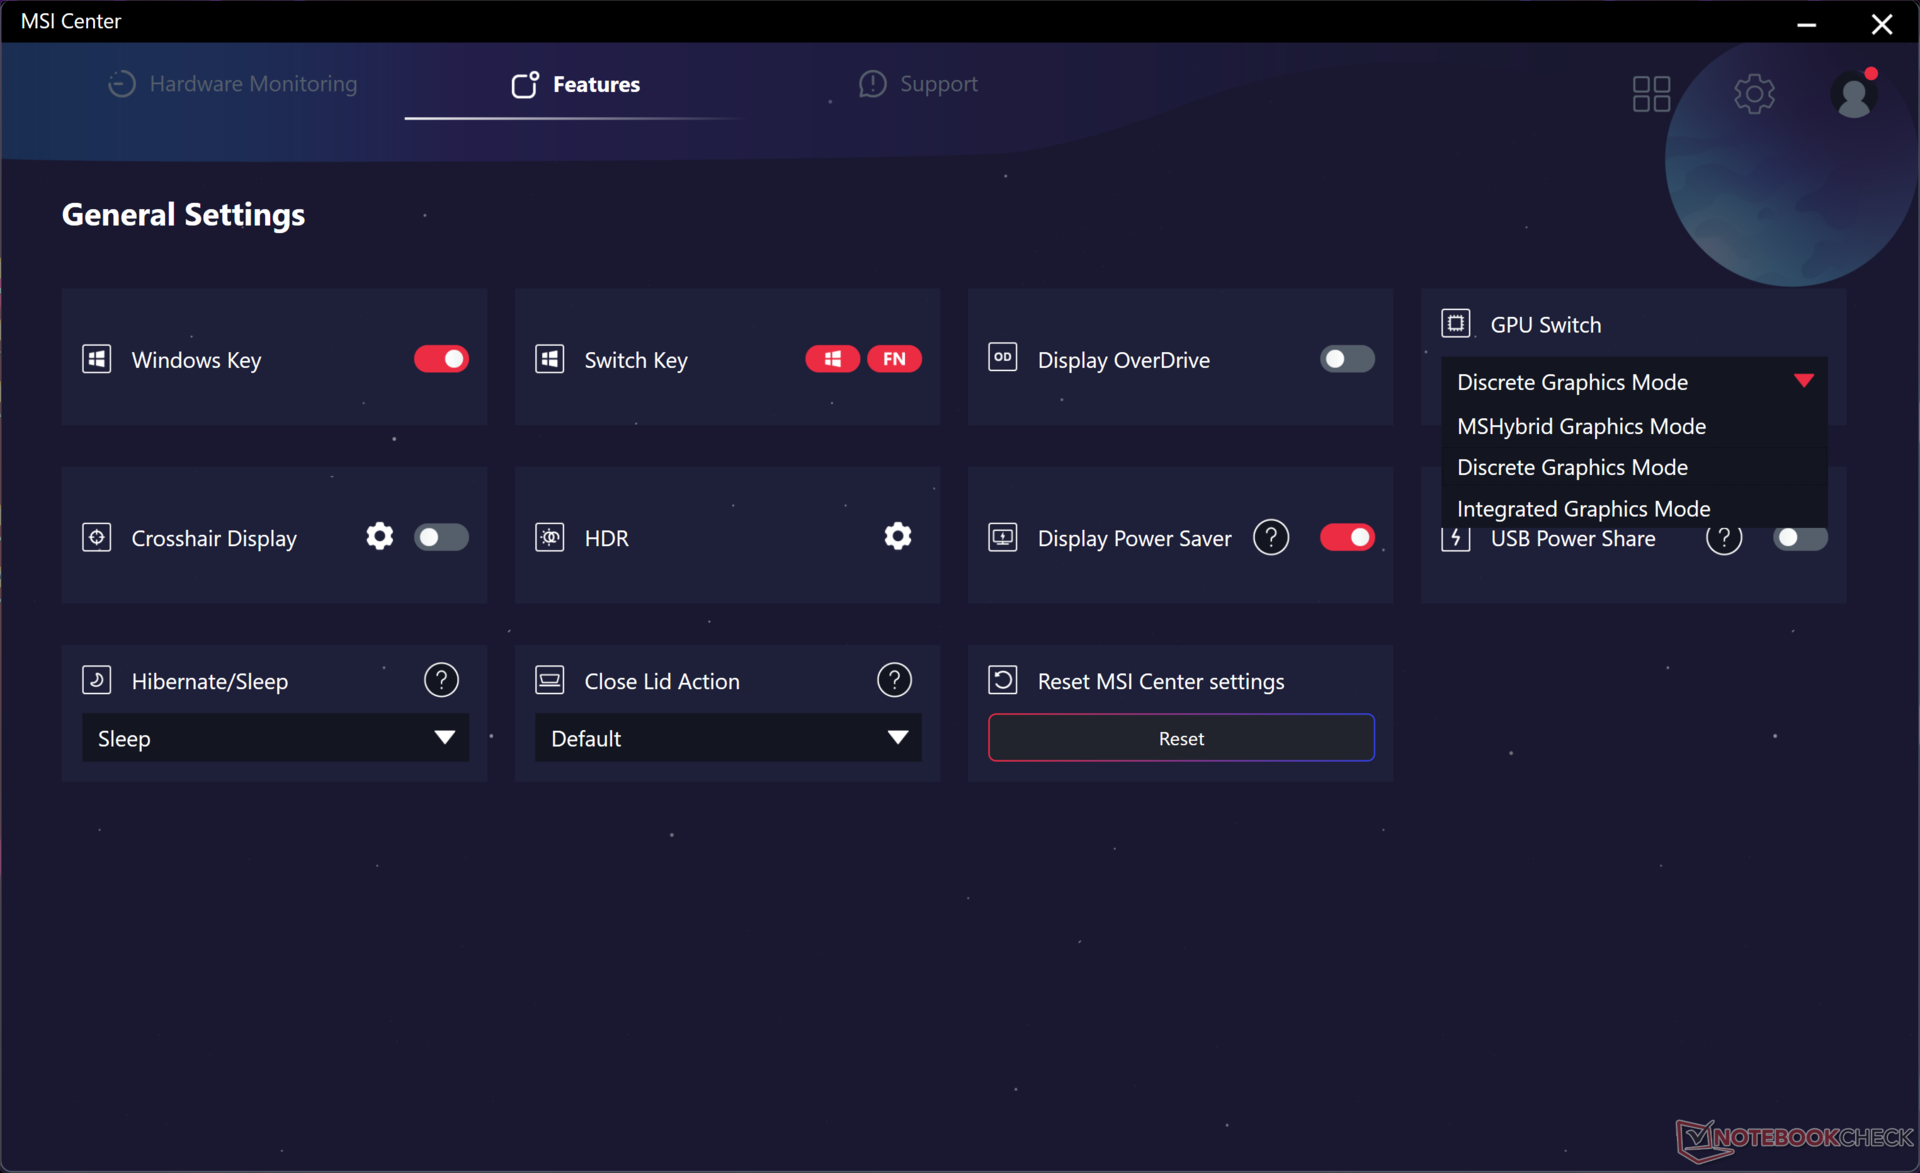
Testomstandigheden
We hebben de GPU ingesteld op de discrete grafische modus, Windows op de modus Prestaties en MSI Center op de modus Extreme prestaties voordat we de onderstaande benchmarks uitvoerden. De Cooler Boost-modus (d.w.z. maximale ventilatormodus) is een andere instelling binnen de Extreme Performance-modus, maar deze optie is over het algemeen niet nodig voor maximale prestaties, zoals onze bevindingen zullen aantonen. Dit komt overeen met onze ervaring op andere MSI laptops met dezelfde Cooler Boost functie.
MUX wordt ondersteund voor het schakelen tussen dGPU-, iGPU- en MSHybrid-modi, maar Advanced Optimus is er niet, net als op de Titan 18 HX. Een belangrijk nadeel van het 4K mini-LED paneel is het gebrek aan G-Sync ondersteuning.
Processor
De Core i9-14900HX is slechts een rebranded Core i9-13900HX en biedt dus op zijn best slechts marginale voordelen. Toch blijft het een van de snelste CPU's voor laptops als het gaat om traditionele prestatiecijfers zoals CineBench of Blender rendering. De CPU is een aanvulling op de Meteor Lake Core Ultra 9 185H die wat ruwe prestaties inruilt voor een geïntegreerde NPU om AI-taken te versnellen.
De duurzaamheid van de prestaties is uitstekend, zonder grote dips in kloksnelheden bij belasting, in tegenstelling tot wat we zagen op de Acer Predator Helios 18 uitgerust met dezelfde Core i9-14900HX CPU.
Overschakelen naar de AMD-gebaseerde Ryzen 9 7945HX configuratie zal naar verwachting de multi-thread prestaties met ongeveer 10 tot 15 procent verbeteren, terwijl de single-thread prestaties met 10 tot 15 procent afnemen.
Cinebench R15 Multi Loop
Cinebench R23: Multi Core | Single Core
Cinebench R20: CPU (Multi Core) | CPU (Single Core)
Cinebench R15: CPU Multi 64Bit | CPU Single 64Bit
Blender: v2.79 BMW27 CPU
7-Zip 18.03: 7z b 4 | 7z b 4 -mmt1
Geekbench 6.4: Multi-Core | Single-Core
Geekbench 5.5: Multi-Core | Single-Core
HWBOT x265 Benchmark v2.2: 4k Preset
LibreOffice : 20 Documents To PDF
R Benchmark 2.5: Overall mean
* ... kleiner is beter
AIDA64: FP32 Ray-Trace | FPU Julia | CPU SHA3 | CPU Queen | FPU SinJulia | FPU Mandel | CPU AES | CPU ZLib | FP64 Ray-Trace | CPU PhotoWorxx
| Performance Rating | |
| Alienware m18 R2 | |
| MSI Titan 18 HX A14VIG | |
| MSI Raider 18 HX A14V | |
| Gemiddeld Intel Core i9-14900HX | |
| Razer Blade 18 2024 RZ09-0509 | |
| Acer Predator Helios 18 PH18-72-98MW | |
| Asus ROG Strix G18 G814JI | |
| AIDA64 / FP32 Ray-Trace | |
| MSI Titan 18 HX A14VIG | |
| Alienware m18 R2 | |
| MSI Raider 18 HX A14V | |
| Razer Blade 18 2024 RZ09-0509 | |
| Gemiddeld Intel Core i9-14900HX (13098 - 33474, n=36) | |
| Acer Predator Helios 18 PH18-72-98MW | |
| Asus ROG Strix G18 G814JI | |
| AIDA64 / FPU Julia | |
| MSI Titan 18 HX A14VIG | |
| Alienware m18 R2 | |
| MSI Raider 18 HX A14V | |
| Razer Blade 18 2024 RZ09-0509 | |
| Gemiddeld Intel Core i9-14900HX (67573 - 166040, n=36) | |
| Acer Predator Helios 18 PH18-72-98MW | |
| Asus ROG Strix G18 G814JI | |
| AIDA64 / CPU SHA3 | |
| MSI Titan 18 HX A14VIG | |
| Alienware m18 R2 | |
| MSI Raider 18 HX A14V | |
| Razer Blade 18 2024 RZ09-0509 | |
| Gemiddeld Intel Core i9-14900HX (3589 - 7979, n=36) | |
| Acer Predator Helios 18 PH18-72-98MW | |
| Asus ROG Strix G18 G814JI | |
| AIDA64 / CPU Queen | |
| MSI Titan 18 HX A14VIG | |
| MSI Raider 18 HX A14V | |
| Alienware m18 R2 | |
| Acer Predator Helios 18 PH18-72-98MW | |
| Gemiddeld Intel Core i9-14900HX (118405 - 148966, n=36) | |
| Razer Blade 18 2024 RZ09-0509 | |
| Asus ROG Strix G18 G814JI | |
| AIDA64 / FPU SinJulia | |
| MSI Titan 18 HX A14VIG | |
| MSI Raider 18 HX A14V | |
| Alienware m18 R2 | |
| Razer Blade 18 2024 RZ09-0509 | |
| Gemiddeld Intel Core i9-14900HX (10475 - 18517, n=36) | |
| Acer Predator Helios 18 PH18-72-98MW | |
| Asus ROG Strix G18 G814JI | |
| AIDA64 / FPU Mandel | |
| Alienware m18 R2 | |
| MSI Titan 18 HX A14VIG | |
| MSI Raider 18 HX A14V | |
| Razer Blade 18 2024 RZ09-0509 | |
| Gemiddeld Intel Core i9-14900HX (32543 - 83662, n=36) | |
| Acer Predator Helios 18 PH18-72-98MW | |
| Asus ROG Strix G18 G814JI | |
| AIDA64 / CPU AES | |
| Gemiddeld Intel Core i9-14900HX (86964 - 241777, n=36) | |
| MSI Titan 18 HX A14VIG | |
| Alienware m18 R2 | |
| MSI Raider 18 HX A14V | |
| Razer Blade 18 2024 RZ09-0509 | |
| Acer Predator Helios 18 PH18-72-98MW | |
| Asus ROG Strix G18 G814JI | |
| AIDA64 / CPU ZLib | |
| MSI Titan 18 HX A14VIG | |
| Alienware m18 R2 | |
| MSI Raider 18 HX A14V | |
| Razer Blade 18 2024 RZ09-0509 | |
| Gemiddeld Intel Core i9-14900HX (1054 - 2292, n=36) | |
| Acer Predator Helios 18 PH18-72-98MW | |
| Asus ROG Strix G18 G814JI | |
| AIDA64 / FP64 Ray-Trace | |
| Alienware m18 R2 | |
| MSI Titan 18 HX A14VIG | |
| MSI Raider 18 HX A14V | |
| Razer Blade 18 2024 RZ09-0509 | |
| Gemiddeld Intel Core i9-14900HX (6809 - 18349, n=36) | |
| Acer Predator Helios 18 PH18-72-98MW | |
| Asus ROG Strix G18 G814JI | |
| AIDA64 / CPU PhotoWorxx | |
| Alienware m18 R2 | |
| Razer Blade 18 2024 RZ09-0509 | |
| Acer Predator Helios 18 PH18-72-98MW | |
| Gemiddeld Intel Core i9-14900HX (23903 - 54702, n=36) | |
| Asus ROG Strix G18 G814JI | |
| MSI Raider 18 HX A14V | |
| MSI Titan 18 HX A14VIG | |
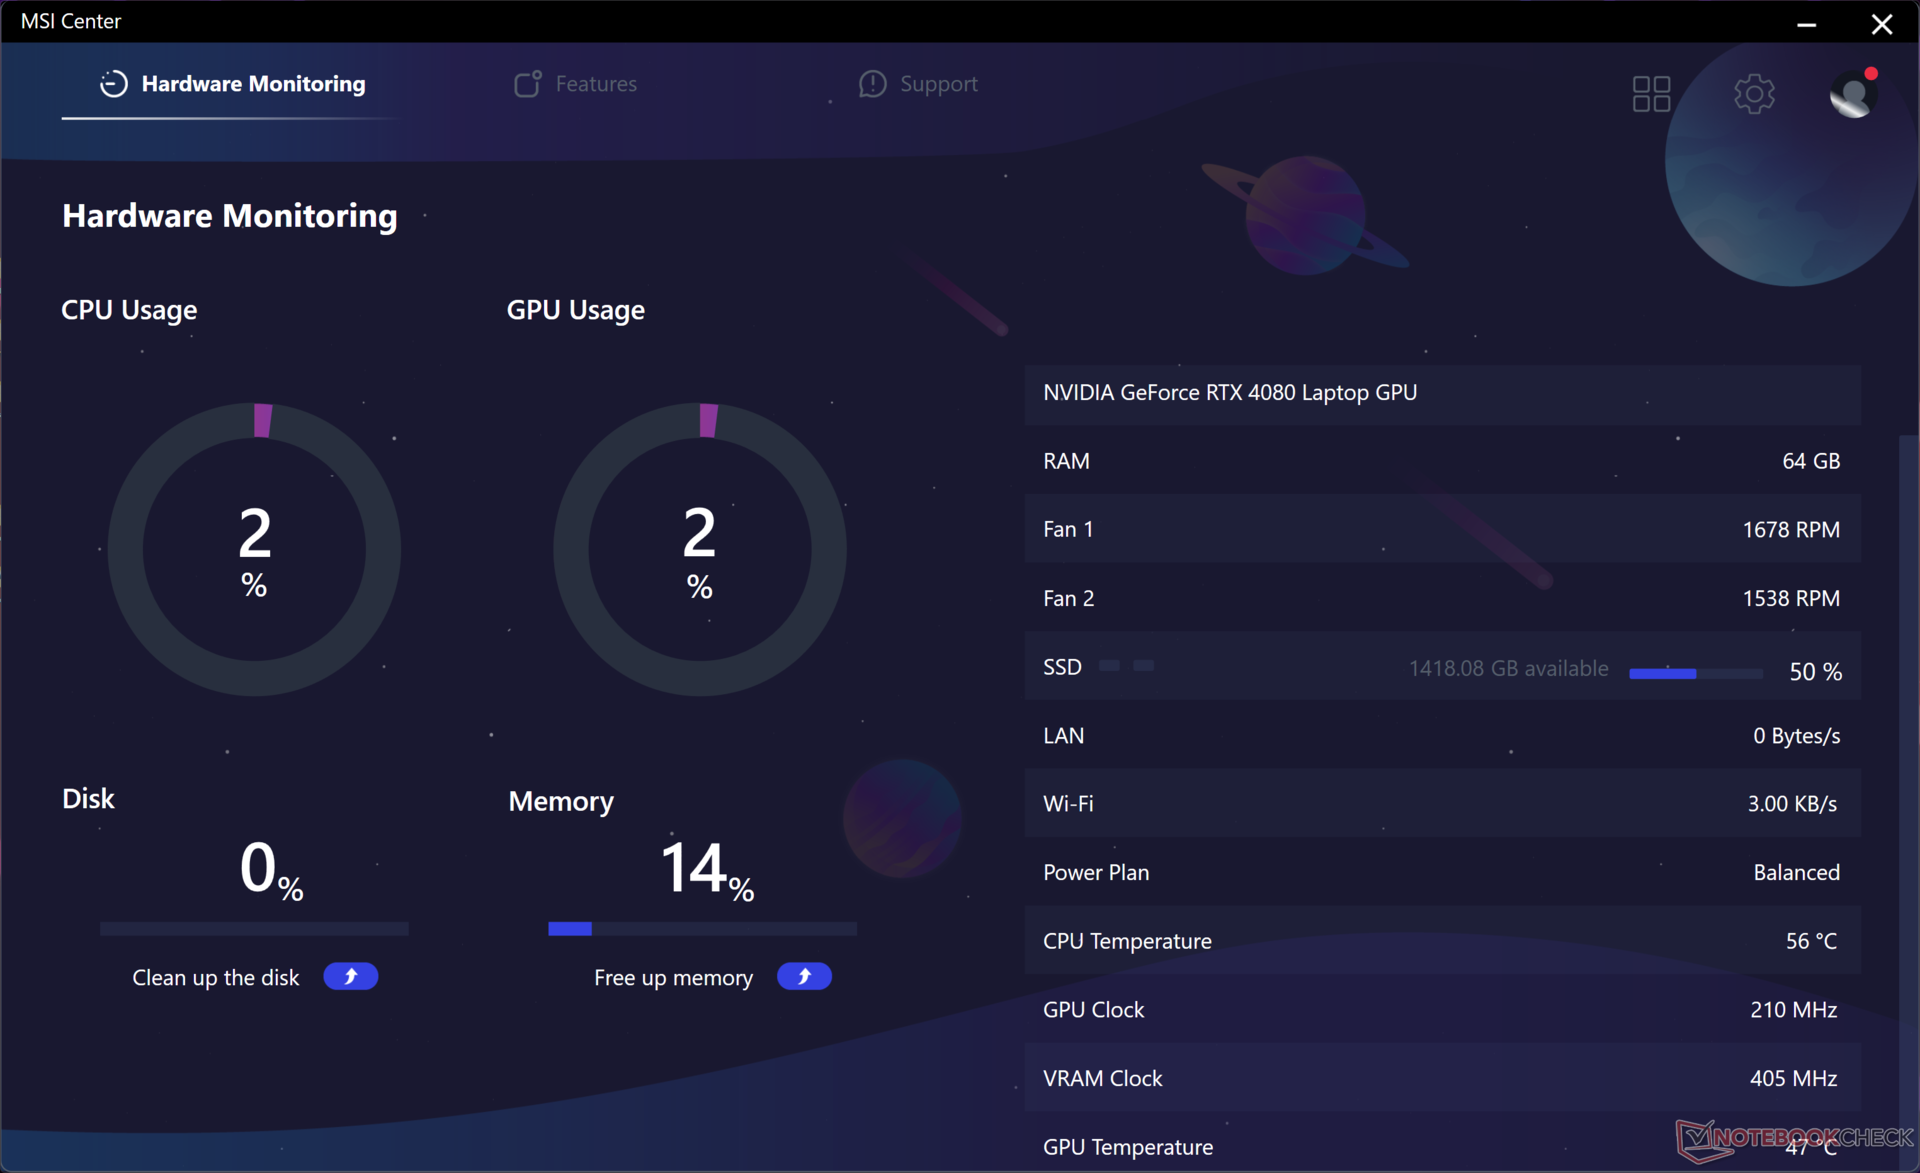
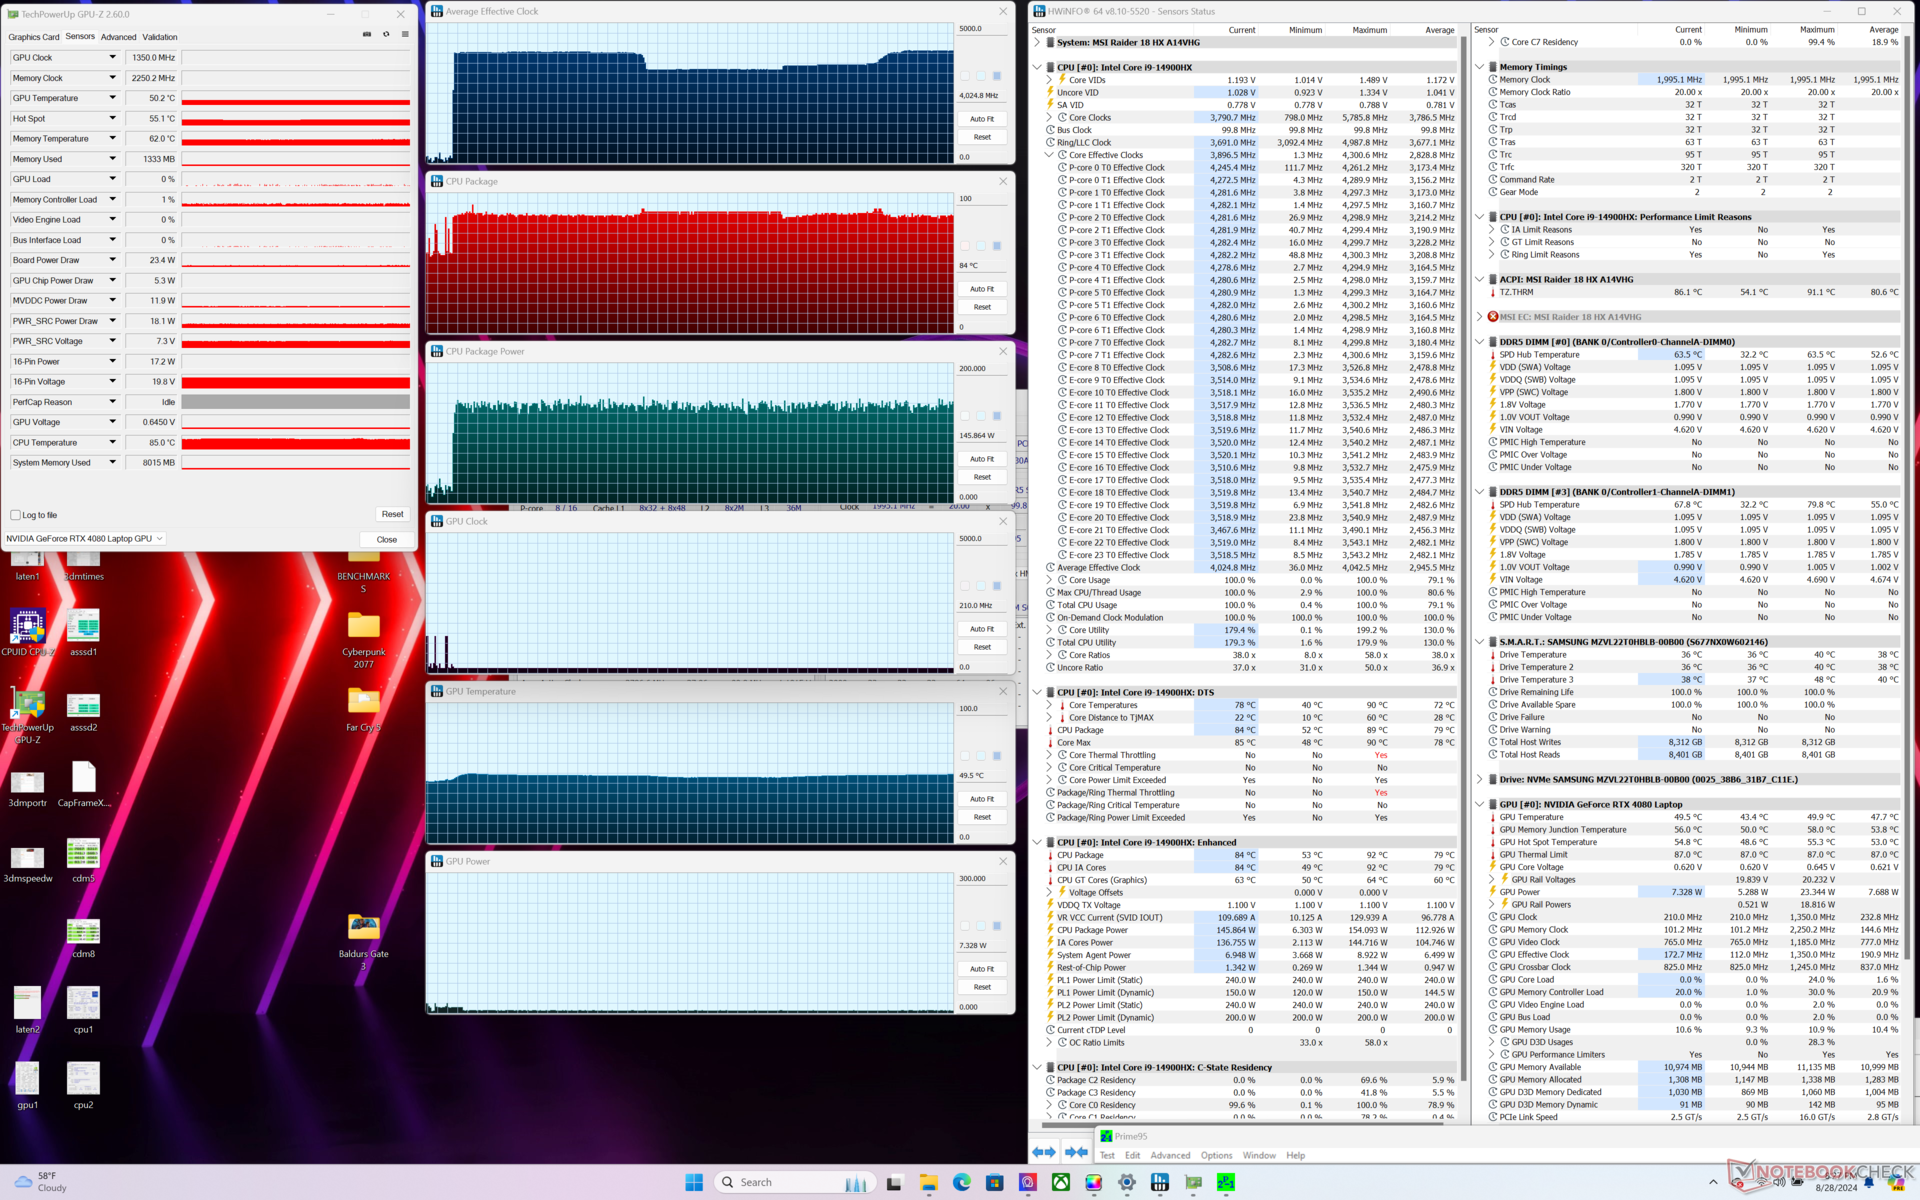
Stresstest
De CPU steeg naar 4 GHz, 86 C en 145 W bij het starten van Prime95 stress zonder grote dips in kloksnelheden of prestaties na verloop van tijd. Het grote chassis en de koeloplossing kunnen meer prestaties uit de Core i9-14900HX halen in vergelijking met kleinere systemen met dezelfde processor, zoals de RedMagic Titan 16 Pro die vrij zwaar throttled.
Het draaien in de modus Extreme prestaties met Cooler Boost aan levert geen tastbare prestatievoordelen op ten opzichte van Cooler Boost uit tijdens het gamen. GPU-kloksnelheden, geheugenkloksnelheden en stroomverbruik op het bord tijdens het uitvoeren van Cyberpunk 2077 stabiliseren zich op respectievelijk 2550 MHz, 2250 MHz en 159 W tussen de twee instellingen. De kerntemperaturen zijn een paar graden koeler met Cooler Boost aan omdat het geluid van de ventilator luider is, maar dat is het enige noemenswaardige voordeel.
Door te verlagen naar de Gebalanceerde modus worden de kloksnelheden van de GPU en het stroomverbruik op het bord verlaagd naar respectievelijk 2295 MHz en 150 W, wat slechts marginaal langzamer is dan in de Extreme Performance-modus. De prestatieverschillen tussen de Balanced en Extreme Performance-modus zijn daarom kleiner dan men zou verwachten.
De GPU-temperaturen zijn warmer dan op de Razer Blade 18 tot 9 C tijdens het gamen, ook al is onze MSI het dikkere en zwaardere systeem.
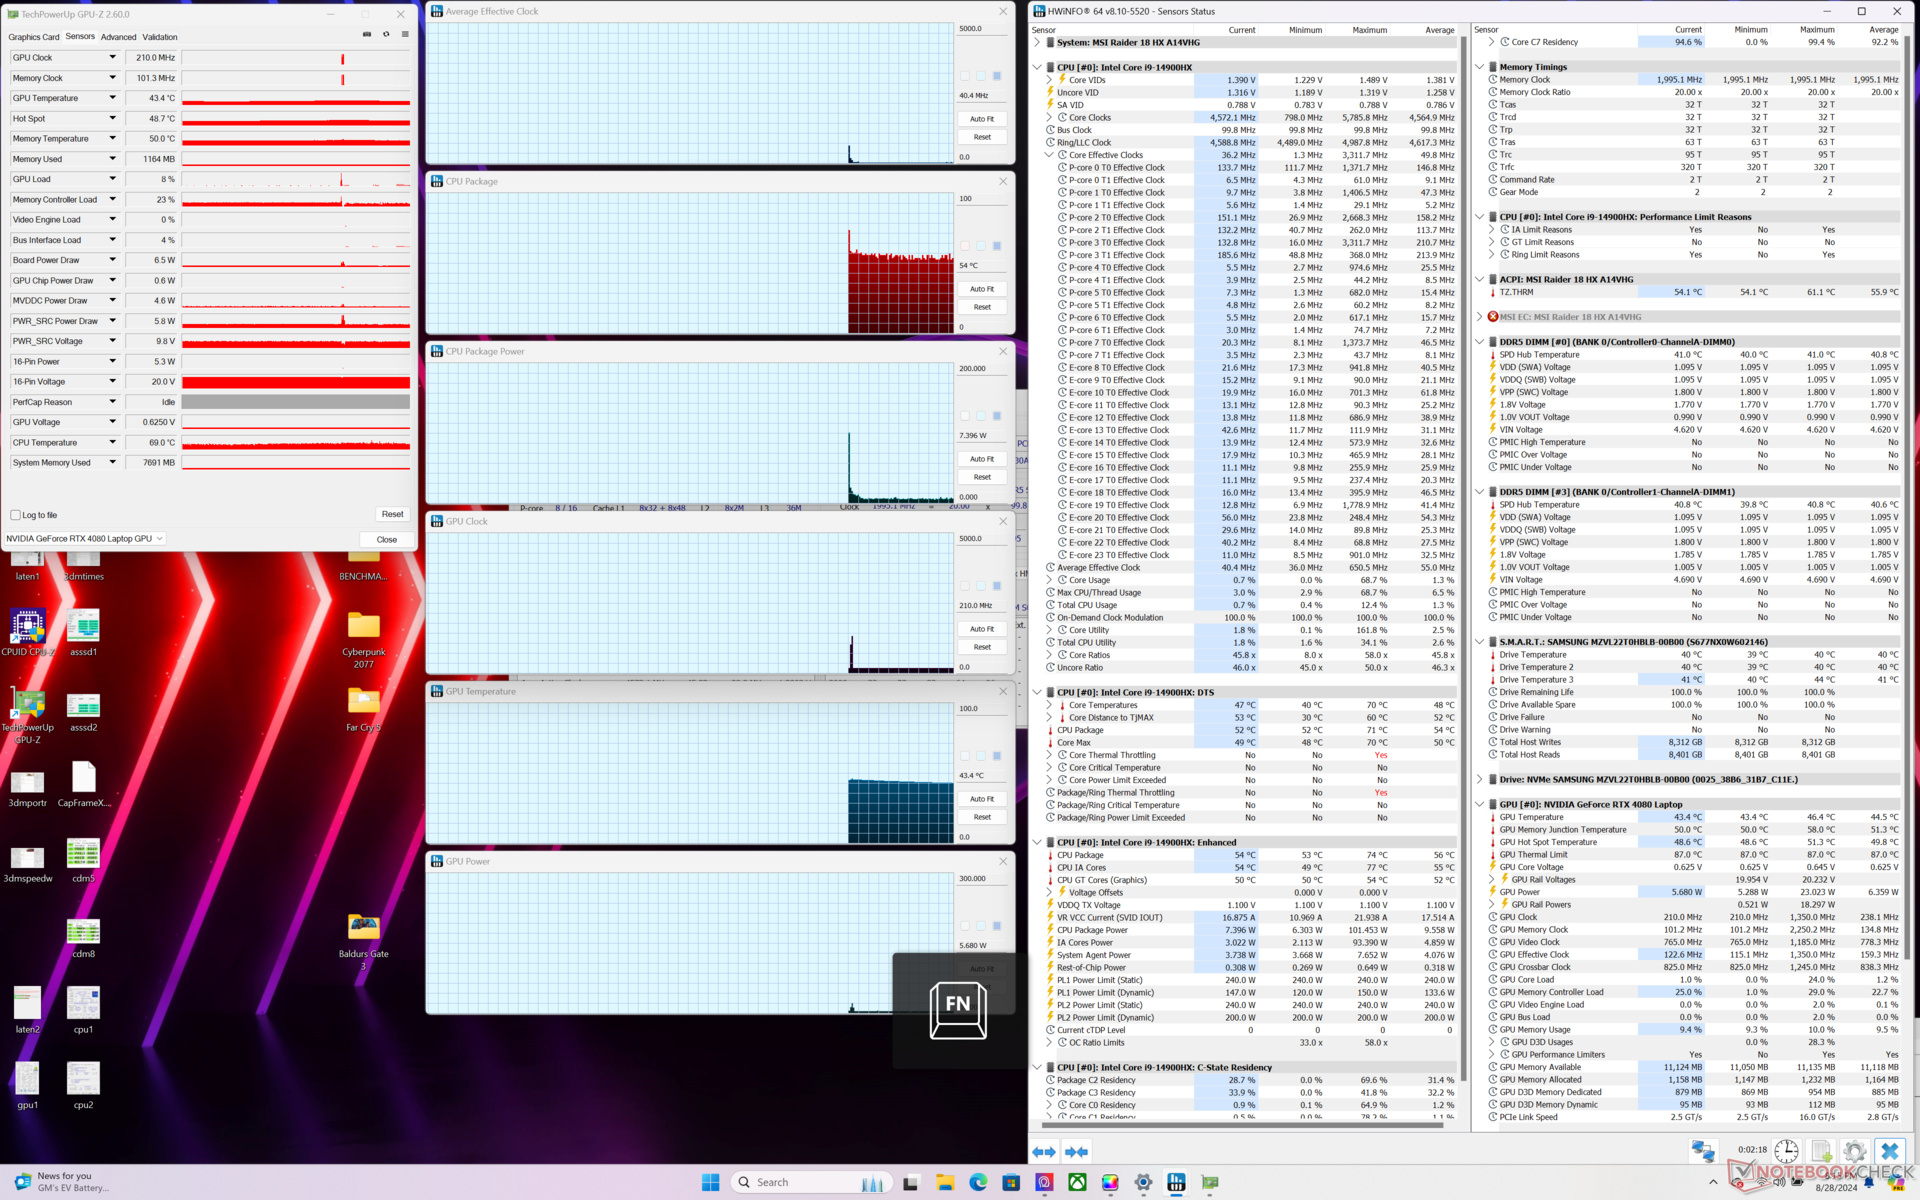

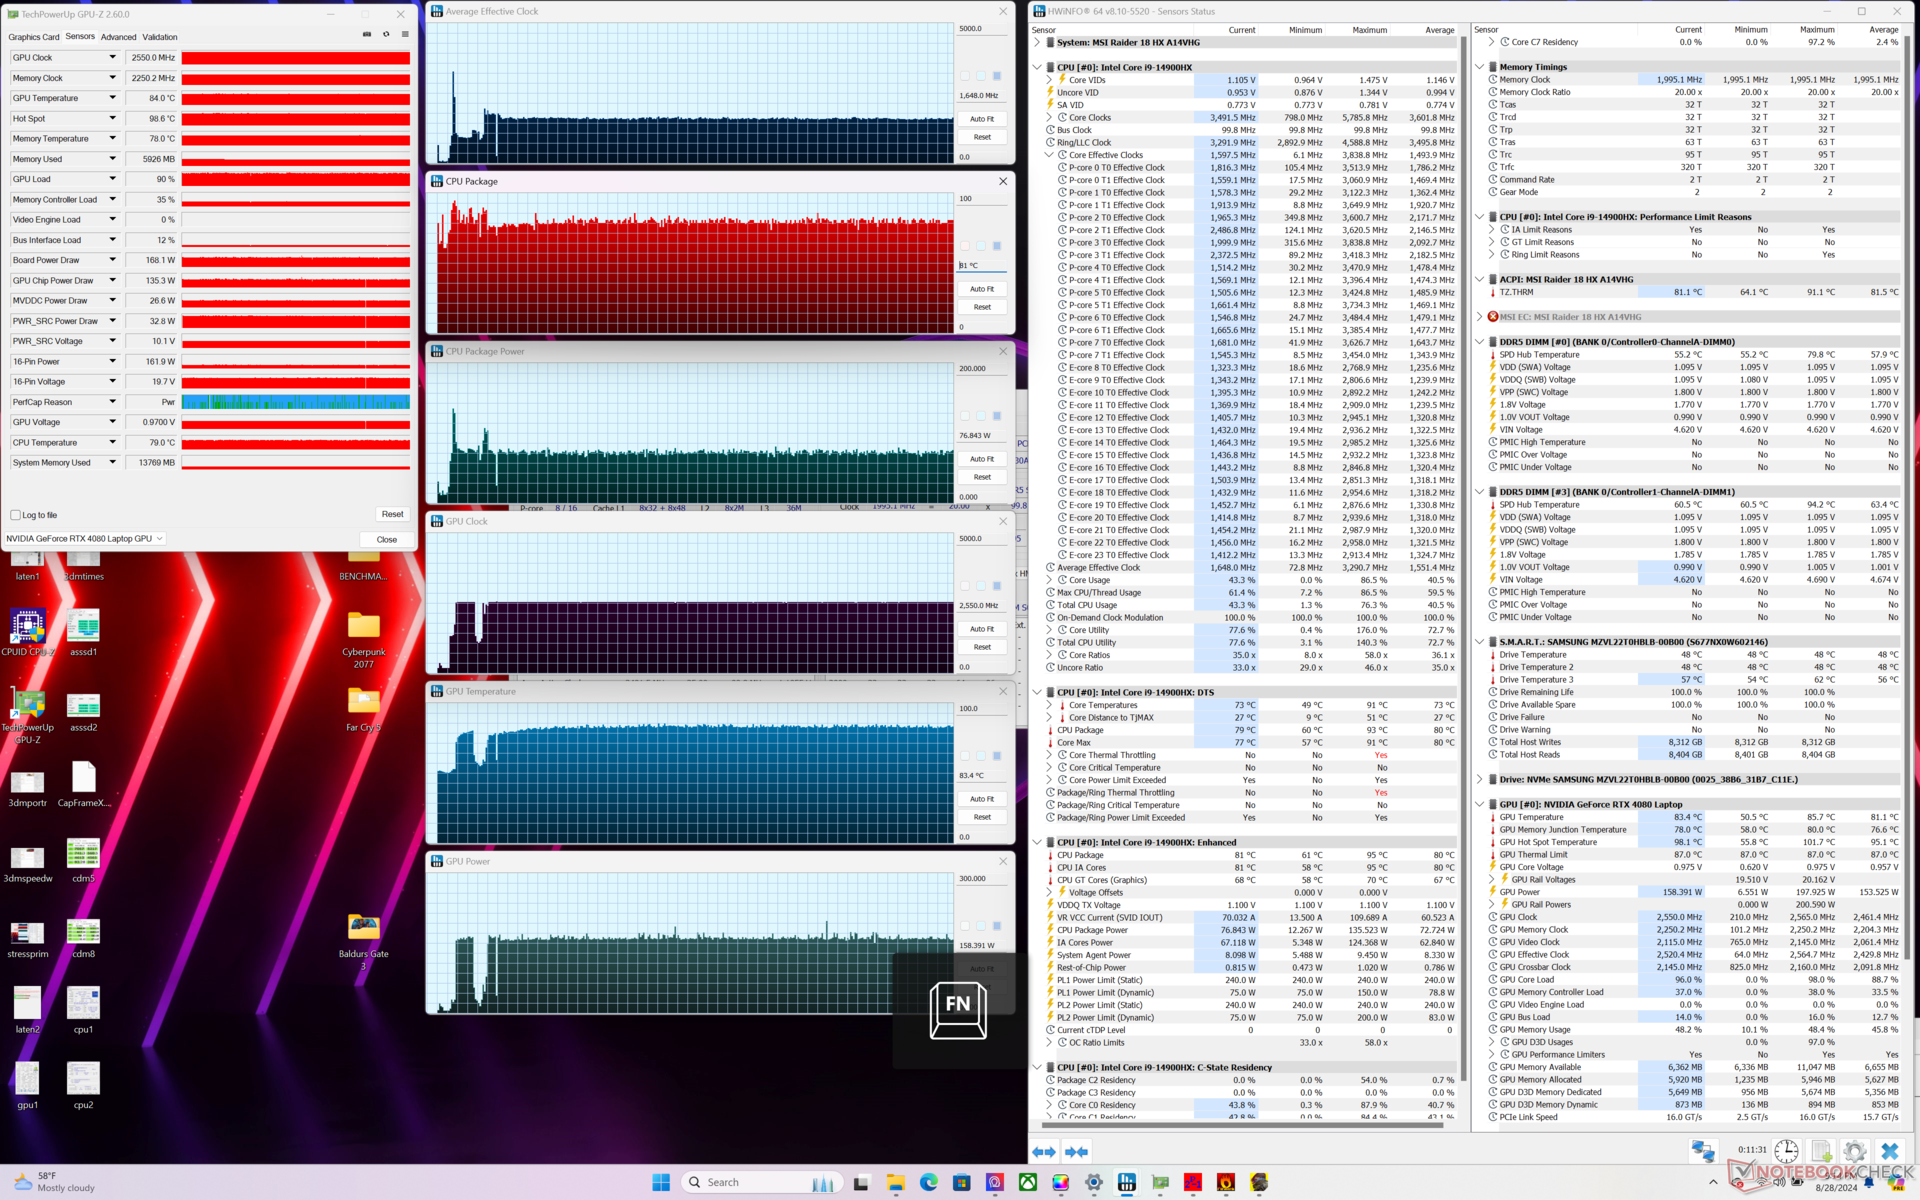
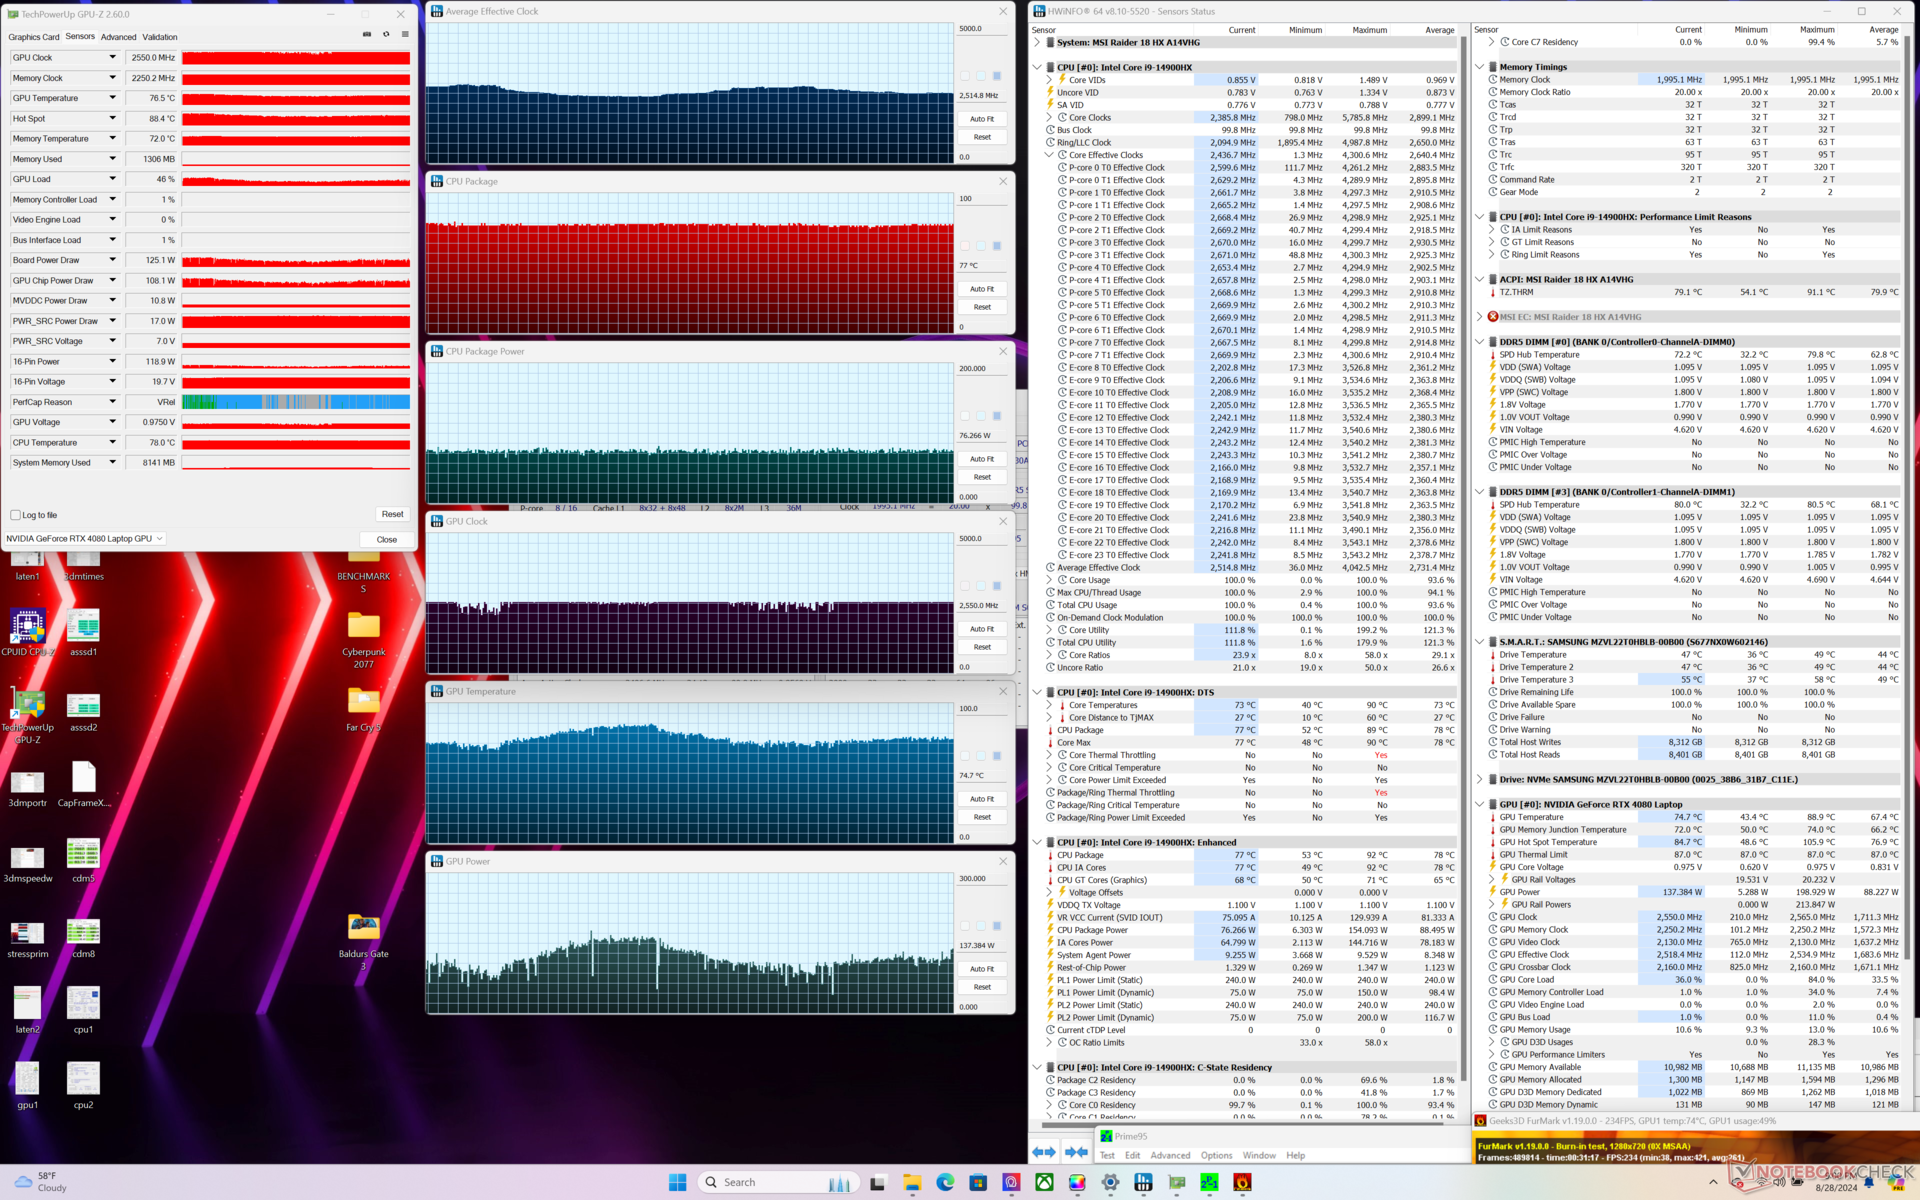
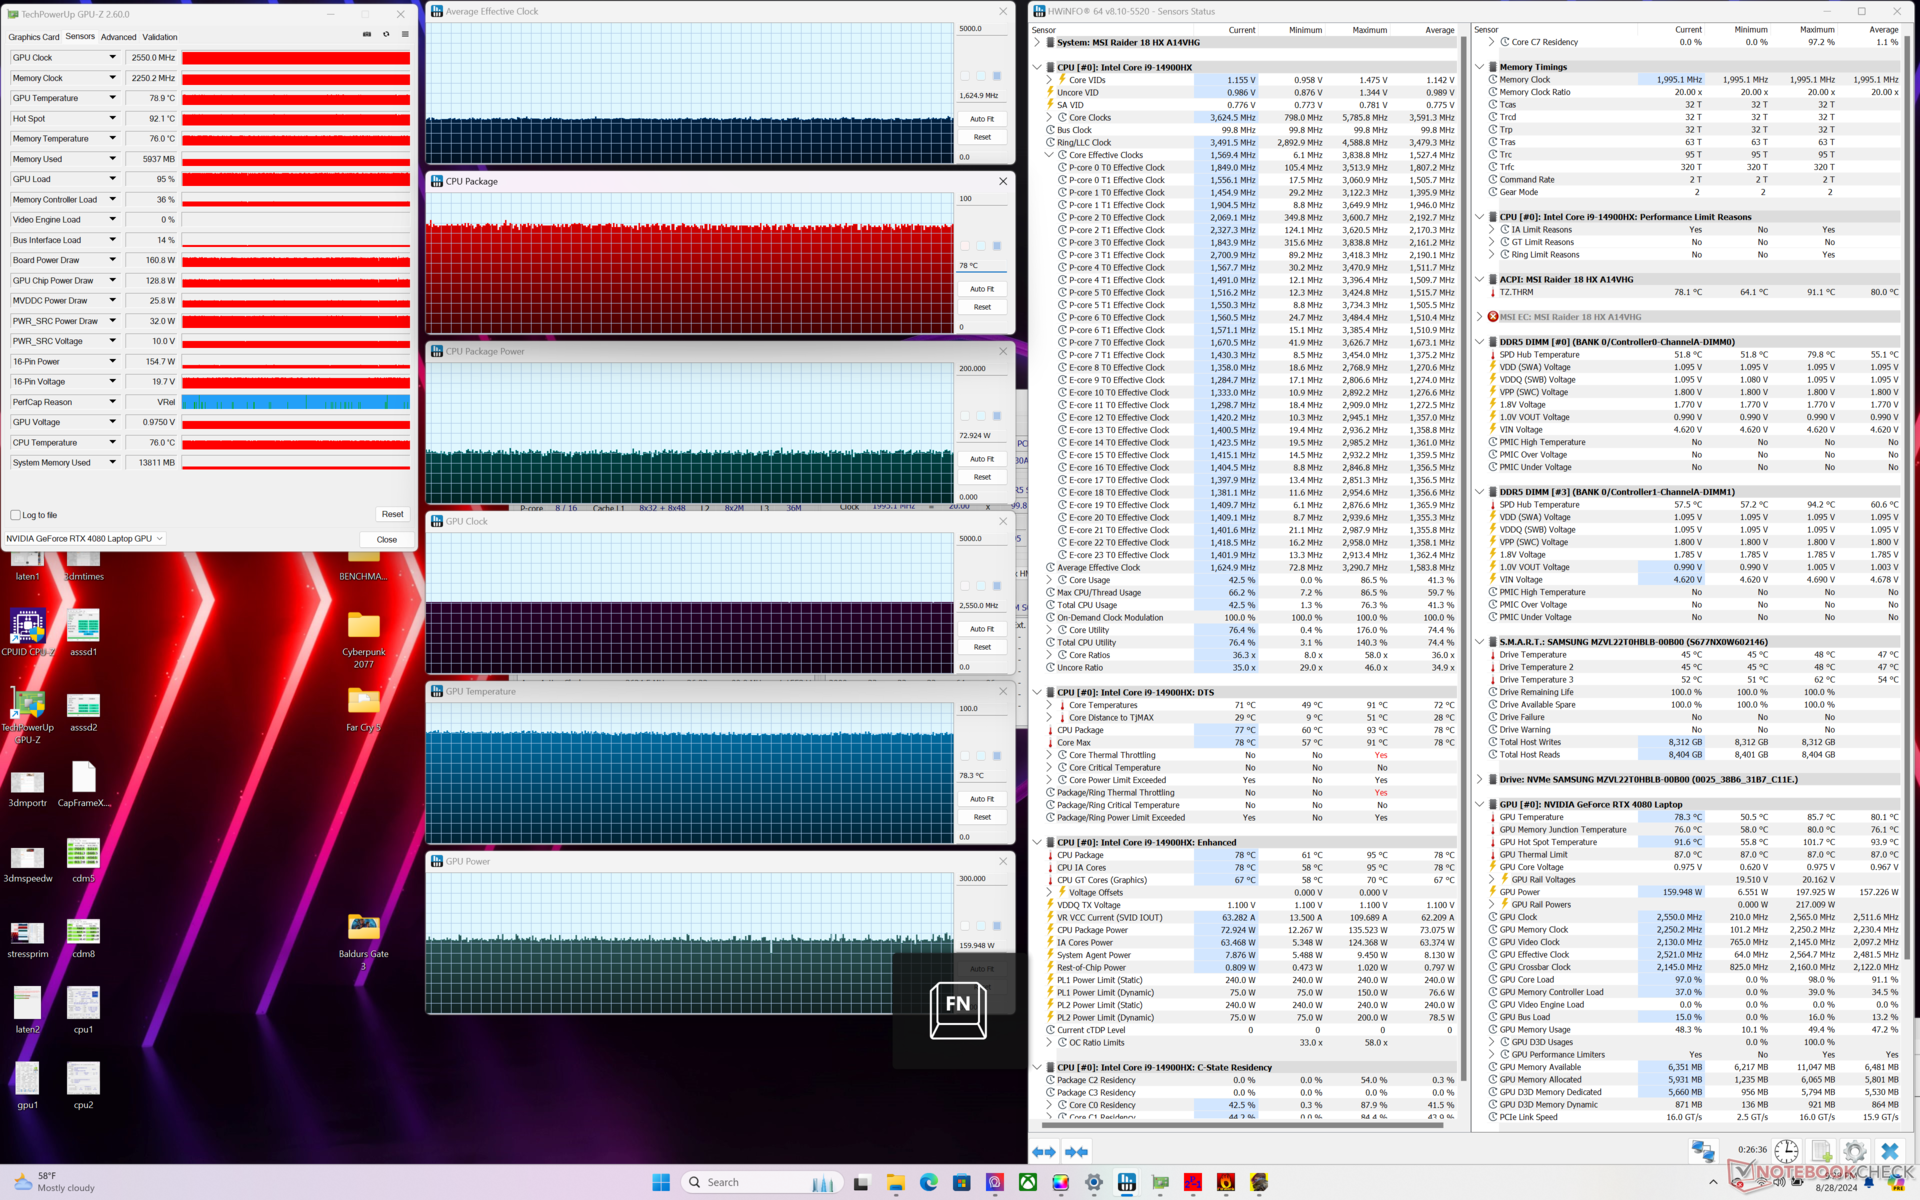
| Gemiddelde CPU-klok (GHz) | GPU-klok (MHz) | Gemiddelde CPU-temperatuur (°C) | Gemiddelde GPU-temperatuur (°C) | |
| Systeem inactief | -- | -- | 54 | 43 |
| Prime95 Stress | 4.0 | -- | 84 | 50 |
| Prime95 + FurMark Stress | 2.5 | 2550 | 77 | 75 |
| Cyberpunk 2077 Stress (evenwichtige modus) | 1.5 | 2295 | 78 | 85 |
| Cyberpunk 2077 Stress (Extreme prestaties w/ Cooler Boost uit) | 1.7 | 2550 | 81 | 83 |
| Cyberpunk 2077 Stress (Extreme prestaties/ Cooler Boost aan) | 1.6 | 2550 | 78 | 78 |
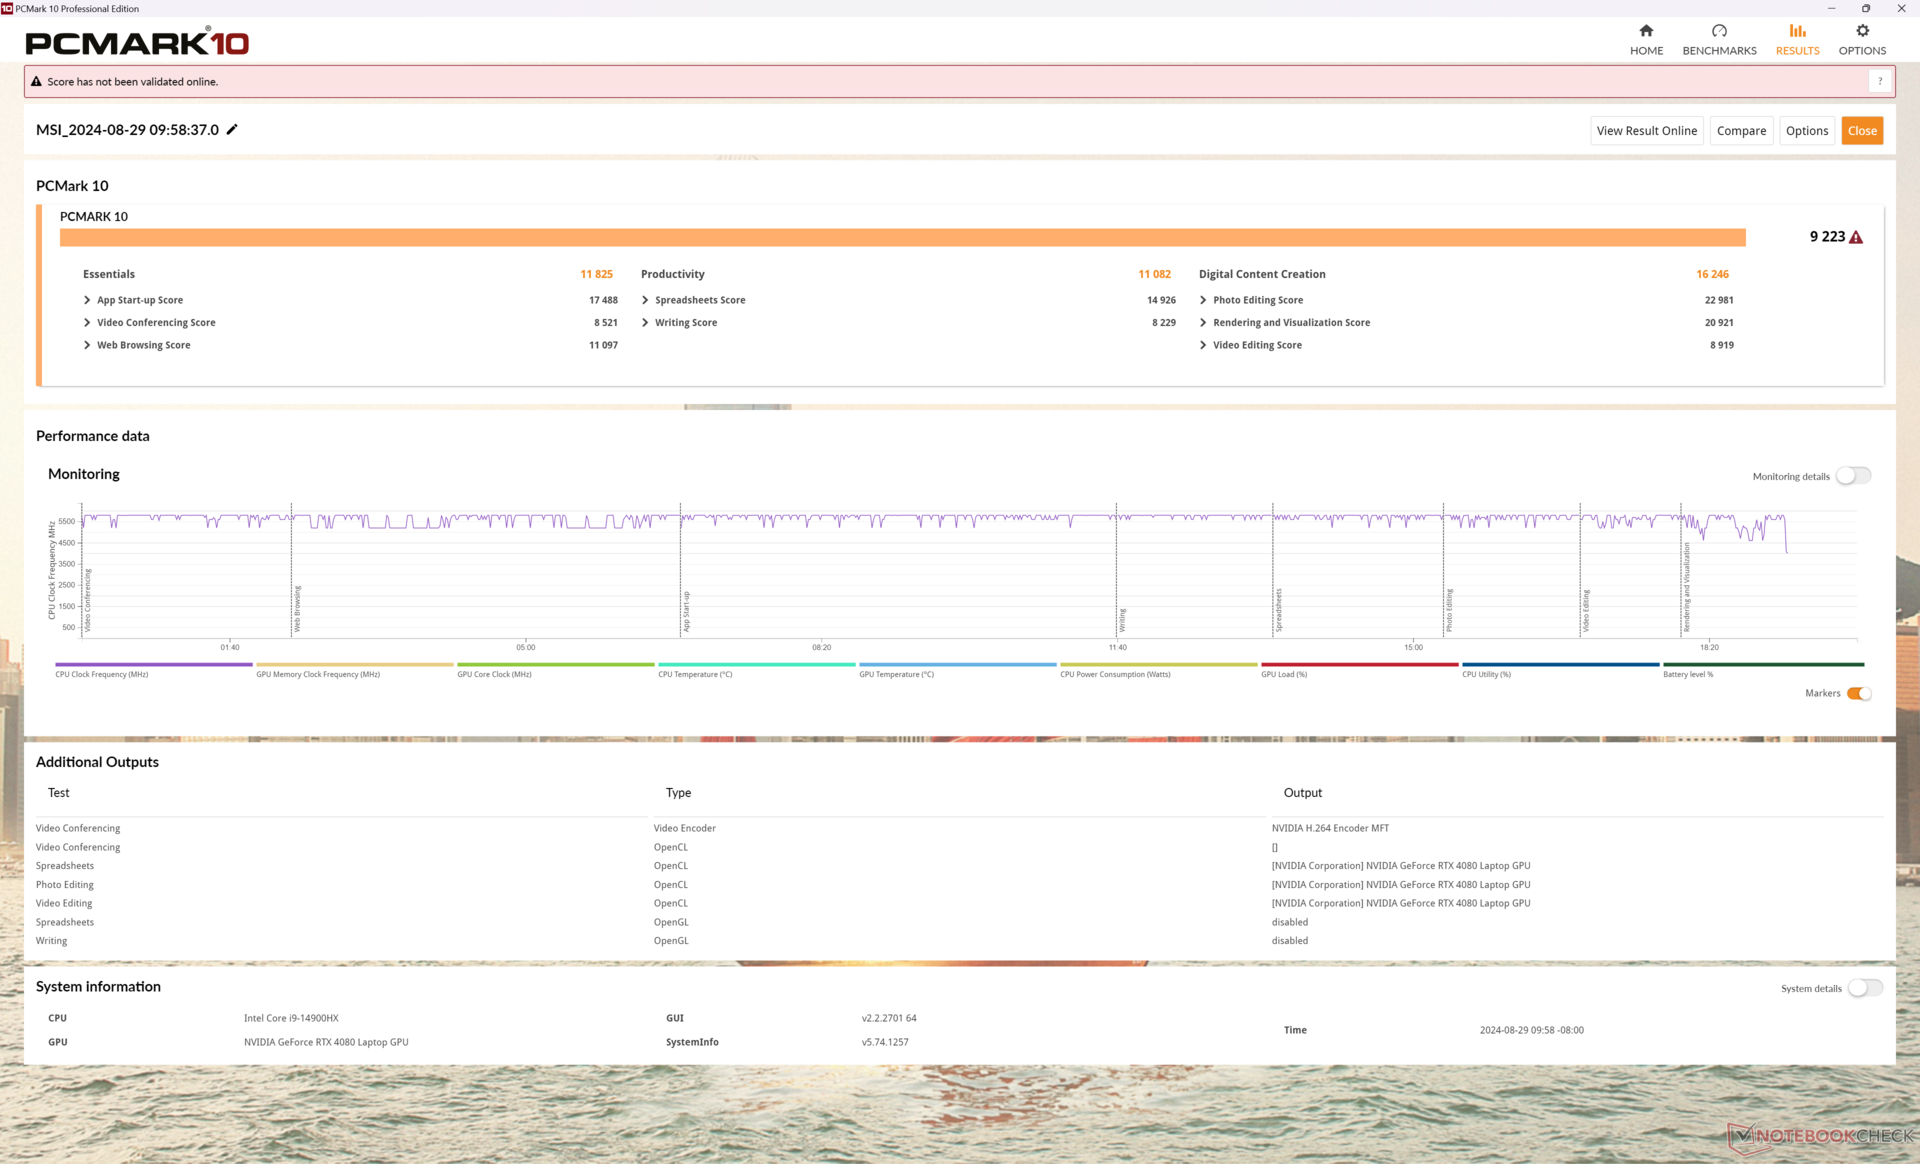
Systeemprestaties
PCMark 10 scores zijn vergelijkbaar met de MSI Titan 18 HX om aan te tonen dat dagelijkse taken niet echt langzamer zijn op de Raider 18 HX, ook al is het in wezen een afgezwakte Titan.
We ondervonden vreemde aanmeldingsproblemen met onze testunit bij het schakelen tussen dGPU- en iGPU-modi, waardoor we telkens de PIN opnieuw moesten instellen.
CrossMark: Overall | Productivity | Creativity | Responsiveness
WebXPRT 3: Overall
WebXPRT 4: Overall
Mozilla Kraken 1.1: Total
| PCMark 10 / Score | |
| Alienware m18 R2 | |
| MSI Raider 18 HX A14V | |
| MSI Titan 18 HX A14VIG | |
| Razer Blade 18 2024 RZ09-0509 | |
| Gemiddeld Intel Core i9-14900HX, NVIDIA GeForce RTX 4080 Laptop GPU (7703 - 9223, n=7) | |
| Acer Predator Helios 18 PH18-72-98MW | |
| Asus ROG Strix G18 G814JI | |
| PCMark 10 / Essentials | |
| MSI Raider 18 HX A14V | |
| Gemiddeld Intel Core i9-14900HX, NVIDIA GeForce RTX 4080 Laptop GPU (11255 - 12600, n=7) | |
| MSI Titan 18 HX A14VIG | |
| Alienware m18 R2 | |
| Razer Blade 18 2024 RZ09-0509 | |
| Acer Predator Helios 18 PH18-72-98MW | |
| Asus ROG Strix G18 G814JI | |
| PCMark 10 / Productivity | |
| Alienware m18 R2 | |
| MSI Raider 18 HX A14V | |
| Gemiddeld Intel Core i9-14900HX, NVIDIA GeForce RTX 4080 Laptop GPU (6662 - 11410, n=7) | |
| MSI Titan 18 HX A14VIG | |
| Razer Blade 18 2024 RZ09-0509 | |
| Acer Predator Helios 18 PH18-72-98MW | |
| Asus ROG Strix G18 G814JI | |
| PCMark 10 / Digital Content Creation | |
| MSI Titan 18 HX A14VIG | |
| Alienware m18 R2 | |
| MSI Raider 18 HX A14V | |
| Razer Blade 18 2024 RZ09-0509 | |
| Gemiddeld Intel Core i9-14900HX, NVIDIA GeForce RTX 4080 Laptop GPU (14211 - 16246, n=7) | |
| Acer Predator Helios 18 PH18-72-98MW | |
| Asus ROG Strix G18 G814JI | |
| CrossMark / Overall | |
| Gemiddeld Intel Core i9-14900HX, NVIDIA GeForce RTX 4080 Laptop GPU (1992 - 2334, n=7) | |
| MSI Raider 18 HX A14V | |
| Alienware m18 R2 | |
| Razer Blade 18 2024 RZ09-0509 | |
| MSI Titan 18 HX A14VIG | |
| CrossMark / Productivity | |
| Gemiddeld Intel Core i9-14900HX, NVIDIA GeForce RTX 4080 Laptop GPU (1812 - 2204, n=7) | |
| MSI Raider 18 HX A14V | |
| Razer Blade 18 2024 RZ09-0509 | |
| Alienware m18 R2 | |
| MSI Titan 18 HX A14VIG | |
| CrossMark / Creativity | |
| Gemiddeld Intel Core i9-14900HX, NVIDIA GeForce RTX 4080 Laptop GPU (2327 - 2500, n=7) | |
| Alienware m18 R2 | |
| MSI Raider 18 HX A14V | |
| Razer Blade 18 2024 RZ09-0509 | |
| MSI Titan 18 HX A14VIG | |
| CrossMark / Responsiveness | |
| Gemiddeld Intel Core i9-14900HX, NVIDIA GeForce RTX 4080 Laptop GPU (1520 - 2254, n=7) | |
| MSI Raider 18 HX A14V | |
| Alienware m18 R2 | |
| Razer Blade 18 2024 RZ09-0509 | |
| MSI Titan 18 HX A14VIG | |
| WebXPRT 3 / Overall | |
| Razer Blade 18 2024 RZ09-0509 | |
| MSI Raider 18 HX A14V | |
| Gemiddeld Intel Core i9-14900HX, NVIDIA GeForce RTX 4080 Laptop GPU (310 - 345, n=7) | |
| MSI Titan 18 HX A14VIG | |
| Alienware m18 R2 | |
| Asus ROG Strix G18 G814JI | |
| Asus ROG Strix G18 G814JI | |
| WebXPRT 4 / Overall | |
| MSI Raider 18 HX A14V | |
| Gemiddeld Intel Core i9-14900HX, NVIDIA GeForce RTX 4080 Laptop GPU (300 - 321, n=7) | |
| Alienware m18 R2 | |
| MSI Titan 18 HX A14VIG | |
| Asus ROG Strix G18 G814JI | |
| Asus ROG Strix G18 G814JI | |
| Mozilla Kraken 1.1 / Total | |
| Asus ROG Strix G18 G814JI | |
| Asus ROG Strix G18 G814JI | |
| MSI Titan 18 HX A14VIG | |
| Razer Blade 18 2024 RZ09-0509 | |
| MSI Raider 18 HX A14V | |
| Acer Predator Helios 18 PH18-72-98MW | |
| Gemiddeld Intel Core i9-14900HX, NVIDIA GeForce RTX 4080 Laptop GPU (437 - 446, n=7) | |
| Alienware m18 R2 | |
* ... kleiner is beter
| PCMark 10 Score | 9223 punten | |
Help | ||
| AIDA64 / Memory Copy | |
| Alienware m18 R2 | |
| Acer Predator Helios 18 PH18-72-98MW | |
| Razer Blade 18 2024 RZ09-0509 | |
| Gemiddeld Intel Core i9-14900HX (38028 - 83392, n=36) | |
| MSI Raider 18 HX A14V | |
| Asus ROG Strix G18 G814JI | |
| MSI Titan 18 HX A14VIG | |
| AIDA64 / Memory Read | |
| Alienware m18 R2 | |
| Acer Predator Helios 18 PH18-72-98MW | |
| Razer Blade 18 2024 RZ09-0509 | |
| Gemiddeld Intel Core i9-14900HX (43306 - 87568, n=36) | |
| Asus ROG Strix G18 G814JI | |
| MSI Raider 18 HX A14V | |
| MSI Titan 18 HX A14VIG | |
| AIDA64 / Memory Write | |
| Alienware m18 R2 | |
| Gemiddeld Intel Core i9-14900HX (37146 - 80589, n=36) | |
| Acer Predator Helios 18 PH18-72-98MW | |
| Razer Blade 18 2024 RZ09-0509 | |
| MSI Raider 18 HX A14V | |
| Asus ROG Strix G18 G814JI | |
| MSI Titan 18 HX A14VIG | |
| AIDA64 / Memory Latency | |
| MSI Titan 18 HX A14VIG | |
| MSI Raider 18 HX A14V | |
| Razer Blade 18 2024 RZ09-0509 | |
| Alienware m18 R2 | |
| Gemiddeld Intel Core i9-14900HX (76.1 - 105, n=36) | |
| Asus ROG Strix G18 G814JI | |
| Acer Predator Helios 18 PH18-72-98MW | |
* ... kleiner is beter
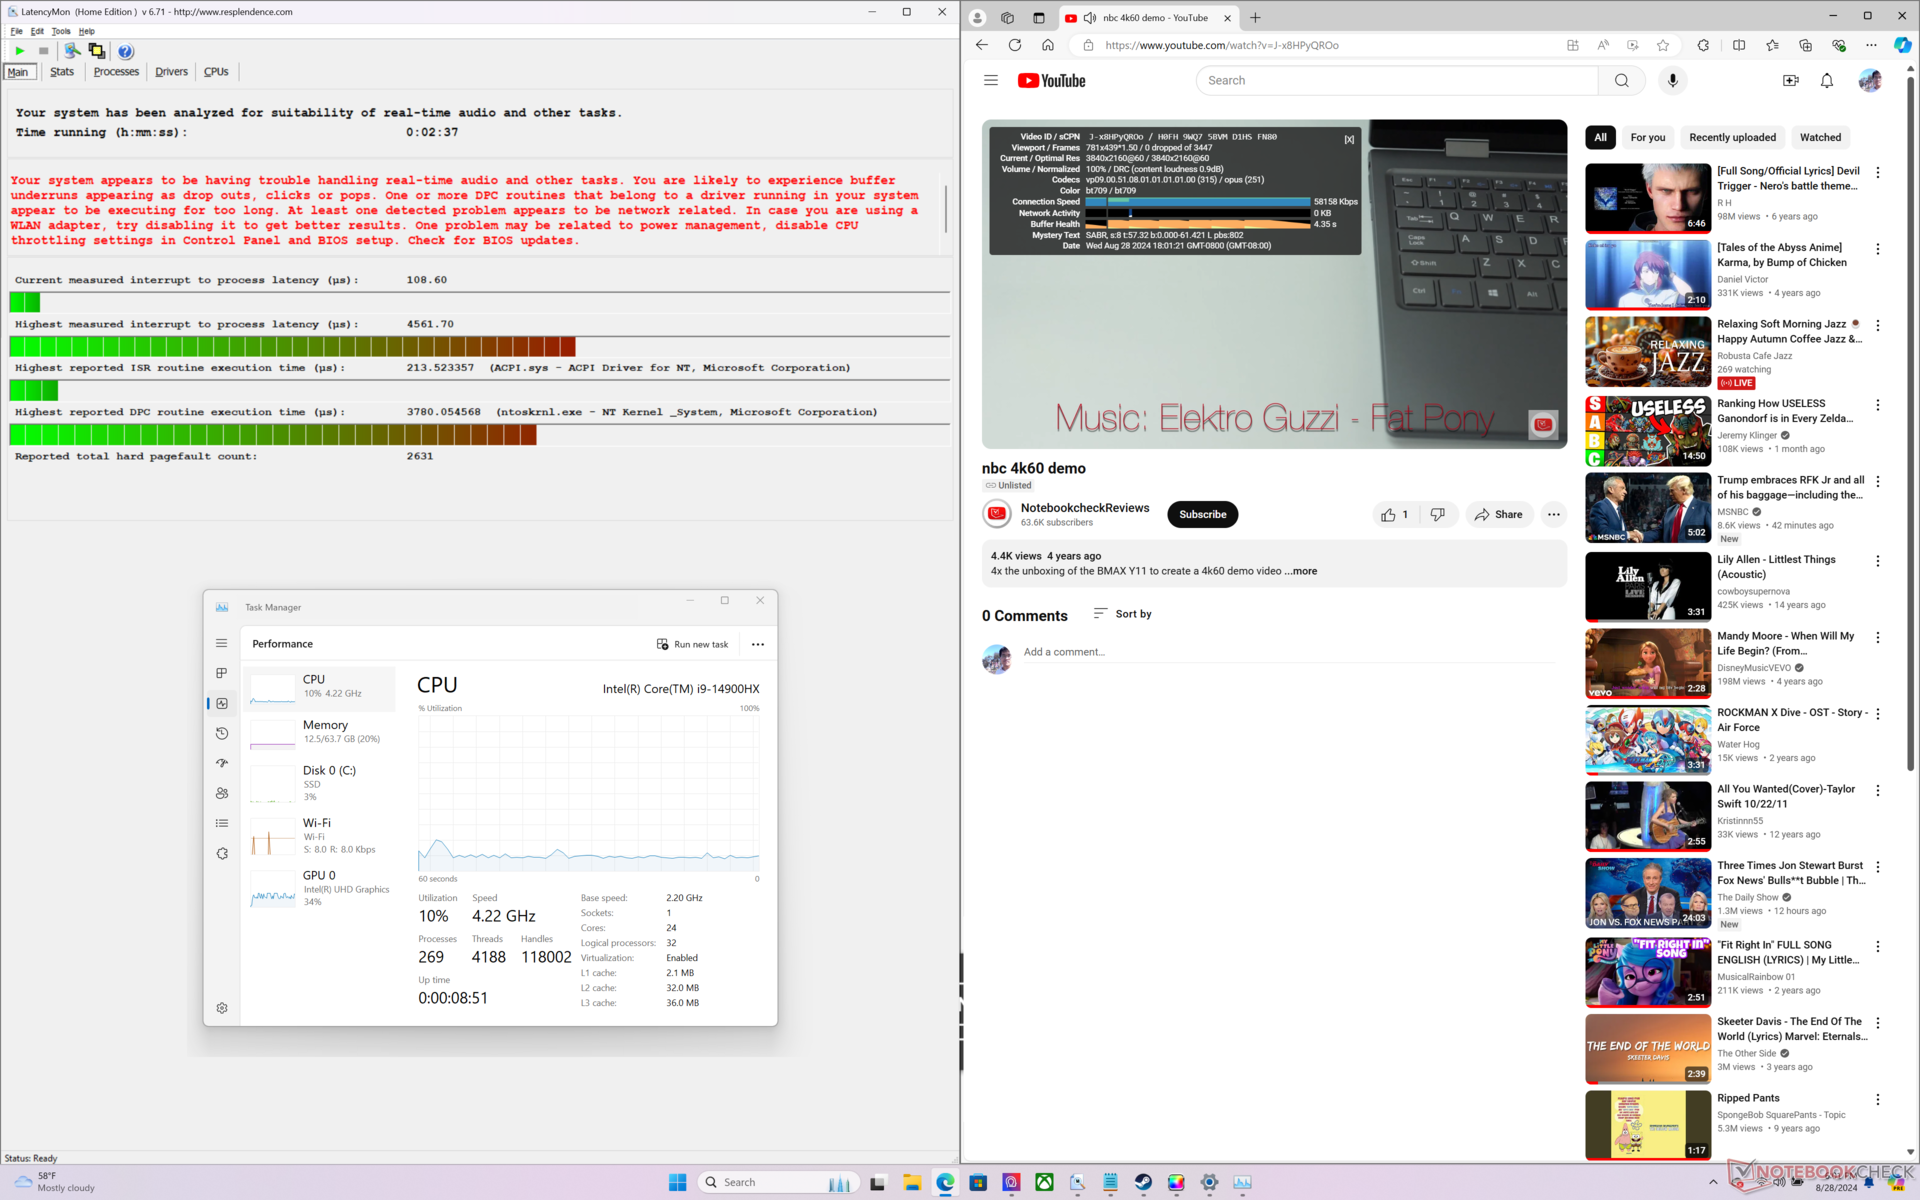
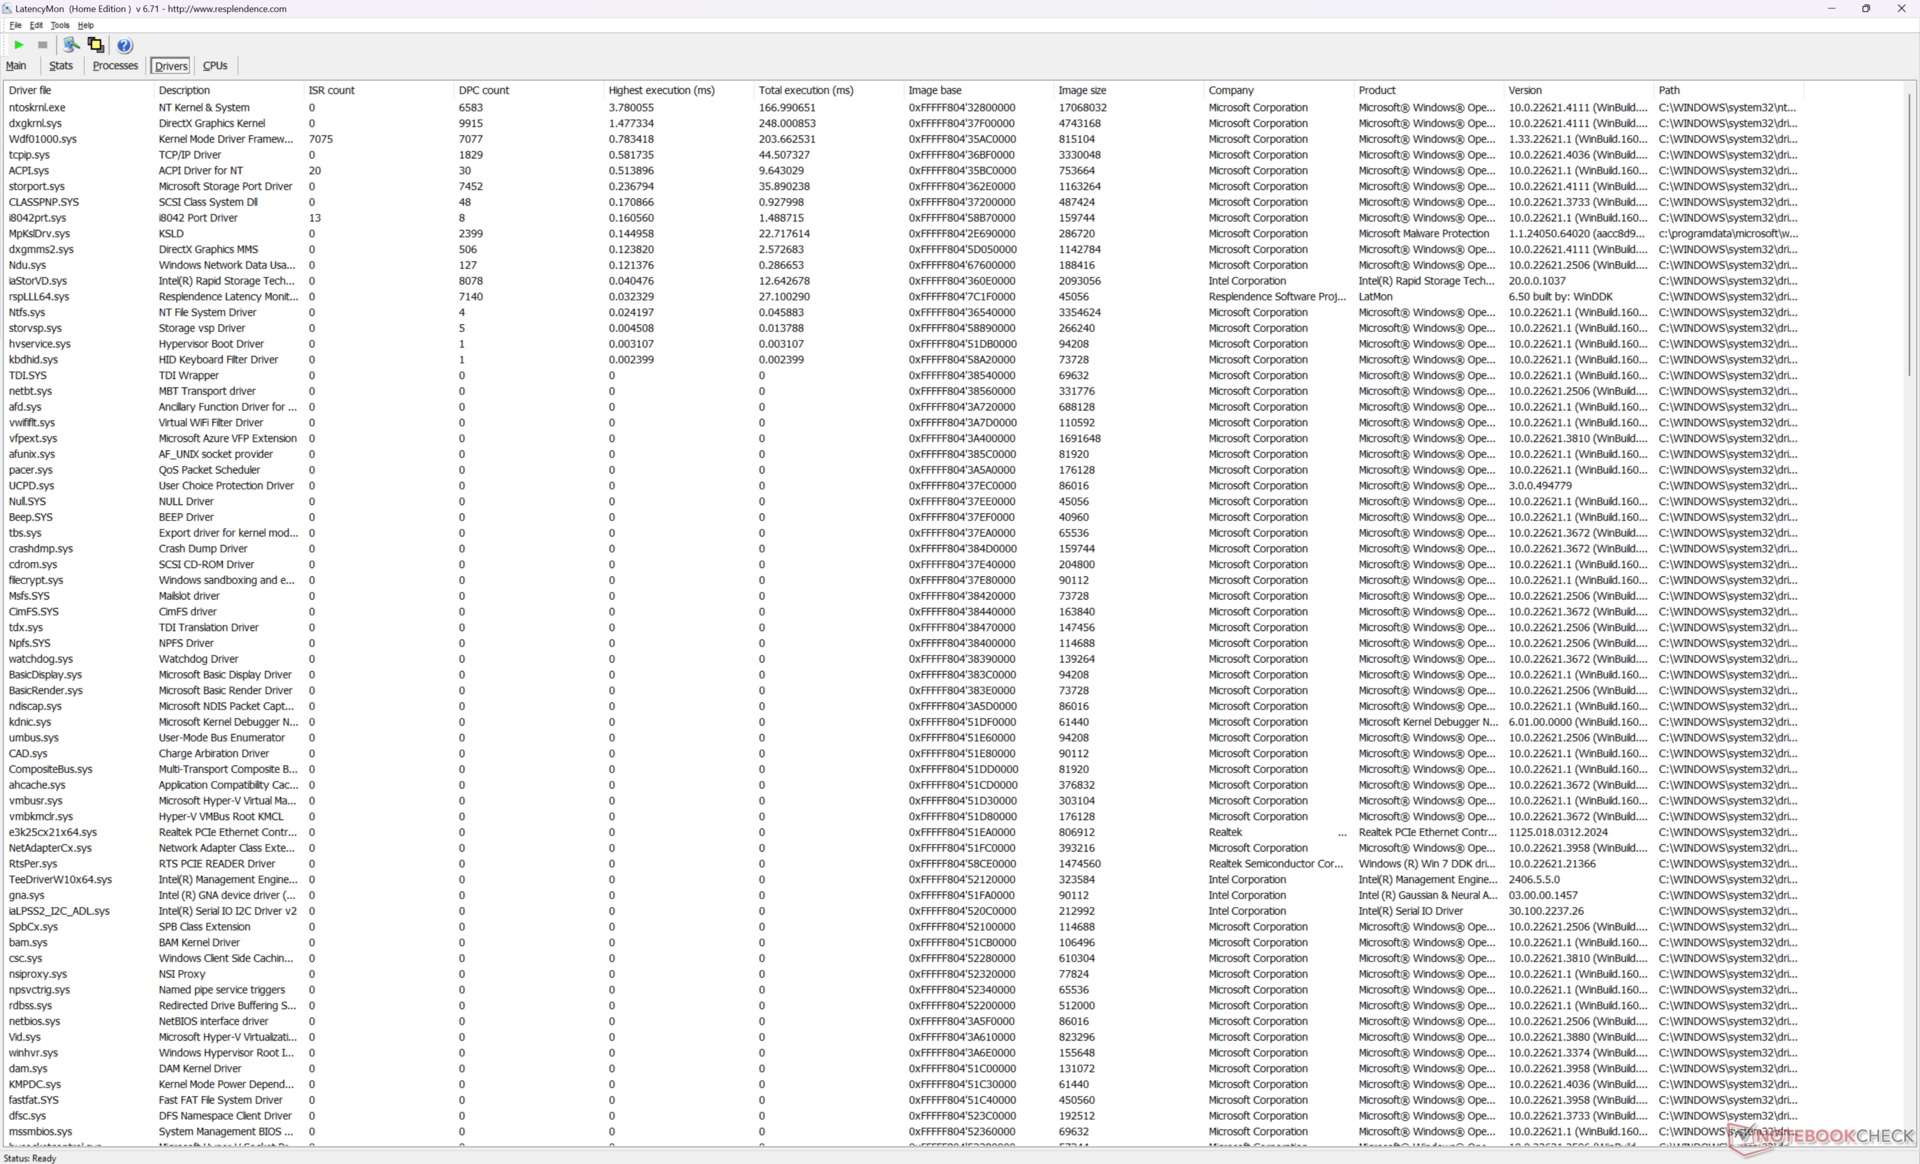
DPC latentie
LatencyMon onthult DPC-problemen bij het openen van meerdere tabbladen van onze startpagina, zelfs wanneer deze is ingesteld op de iGPU-modus. het afspelen van 4K-video's met 60 FPS verloopt verder perfect, zonder dropped frames.
| DPC Latencies / LatencyMon - interrupt to process latency (max), Web, Youtube, Prime95 | |
| MSI Raider 18 HX A14V | |
| Acer Predator Helios 18 PH18-72-98MW | |
| Alienware m18 R2 | |
| MSI Titan 18 HX A14VIG | |
| Razer Blade 18 2024 RZ09-0509 | |
| Asus ROG Strix G18 G814JI | |
* ... kleiner is beter
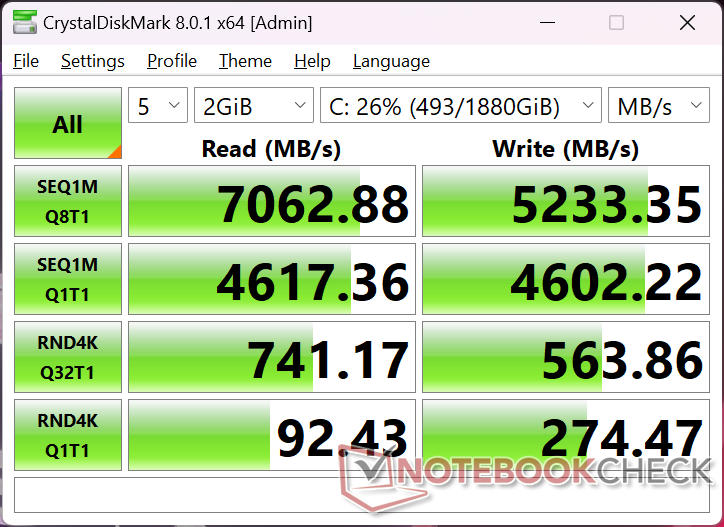
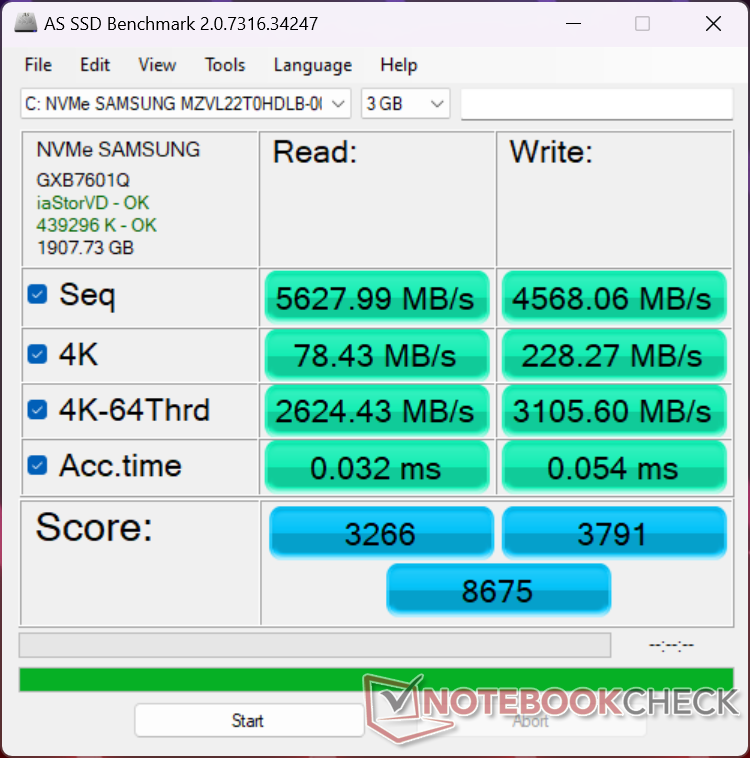
Opslagapparaten
Ons apparaat wordt geleverd met de Samsung PM9A1a MZVL22T0HDLB PCIe4 SSD die vaak wordt aangetroffen in laptops van hoge kwaliteit. De overdrachtsnelheden zijn stabiel op ~7000 MB/s, zelfs onder zware belasting, en ze kunnen nog sneller zijn als ze geconfigureerd zijn met een PCIe5-schijf. Het ontbreken van een bijgeleverde hitteverspreider kan echter betekenen dat PCIe5-schijven sneller vastlopen.

| Drive Performance Rating - Percent | |
| Alienware m18 R2 | |
| MSI Raider 18 HX A14V | |
| Acer Predator Helios 18 PH18-72-98MW | |
| MSI Titan 18 HX A14VIG | |
| Razer Blade 18 2024 RZ09-0509 | |
| Asus ROG Strix G18 G814JI | |
* ... kleiner is beter
Disk Throttling: DiskSpd Read Loop, Queue Depth 8
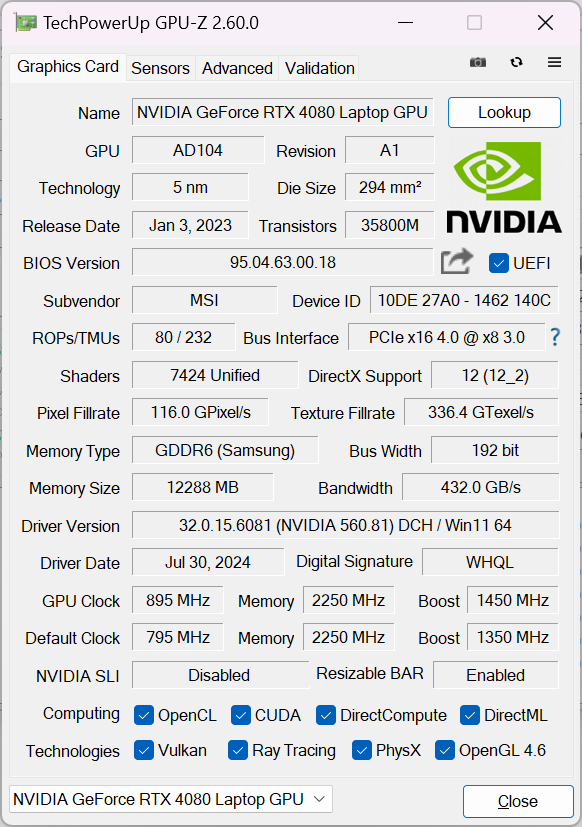
GPU-prestaties - 175 W TGP Graphics
In tegenstelling tot dunnere laptops die worden geleverd met zwakkere 80 W GeForce RTX 4080 grafische processorwordt de grotere Raider 18 HX geleverd met een krachtigere 175 W (150 W + 25 W dynamic boost) versie. De prestaties zijn ongeveer 5 procent sneller dan de gemiddelde laptop in onze database met dezelfde dezelfde GPU terwijl upgraden naar de RTX 4090 de prestaties met nog eens 10 procent zal verbeteren.
Houd er rekening mee dat de algehele prestaties nog steeds 30 tot 35 procent langzamer zijn dan de desktopversie van de GeForce RTX 4080 ook al heeft de mobiele versie dezelfde naam. Onze mobiele RTX 4080 komt qua prestaties dus dichter in de buurt van de desktop RTX 4070.
| Vermogen Profiel | Grafische Score | Natuurkunde Score | Gecombineerde Score |
| Extreme prestaties (Cooler Boost aan) | 42289 | 41396 | 11806 |
| Extreme prestaties (koeler Boost uit) | 41778 (-1%) | 40723 (-2%) | 11968 (-1%) |
| Gebalanceerde modus | 41673 (-2%) | 41013 (-1%) | 10404 (-12%) |
| Batterijvoeding | 21731 (-49%) | 17988 (-57%) | 5809 (-51%) |
Het terugschakelen van de Extreme Performance-modus naar de Balanced-modus heeft slechts een kleine invloed op de prestaties, wat overeenkomt met onze Stress Test-waarnemingen hierboven. Het inschakelen van Cooler Boost maakt ook weinig verschil, behalve dat het de kerntemperaturen verlaagt door het ventilatorgeluid aanzienlijk te verhogen.
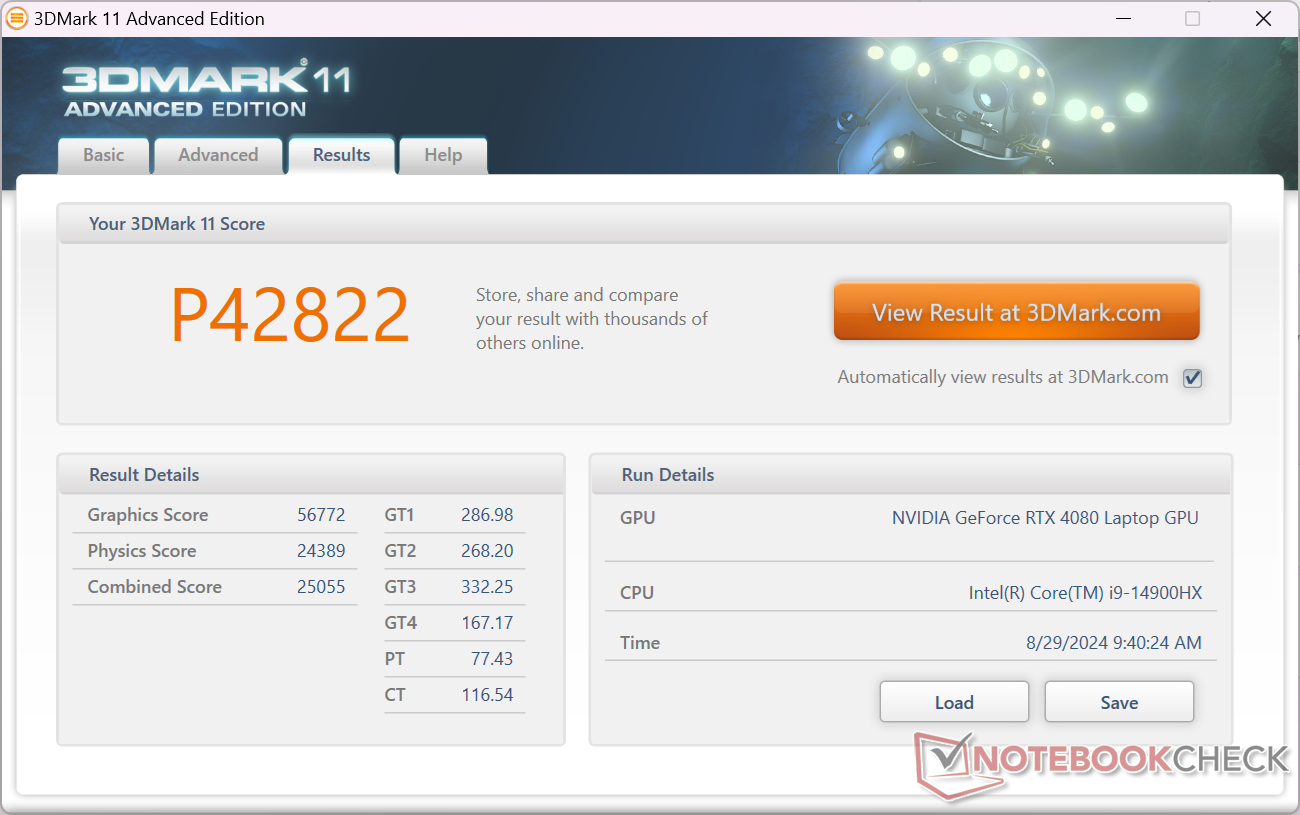
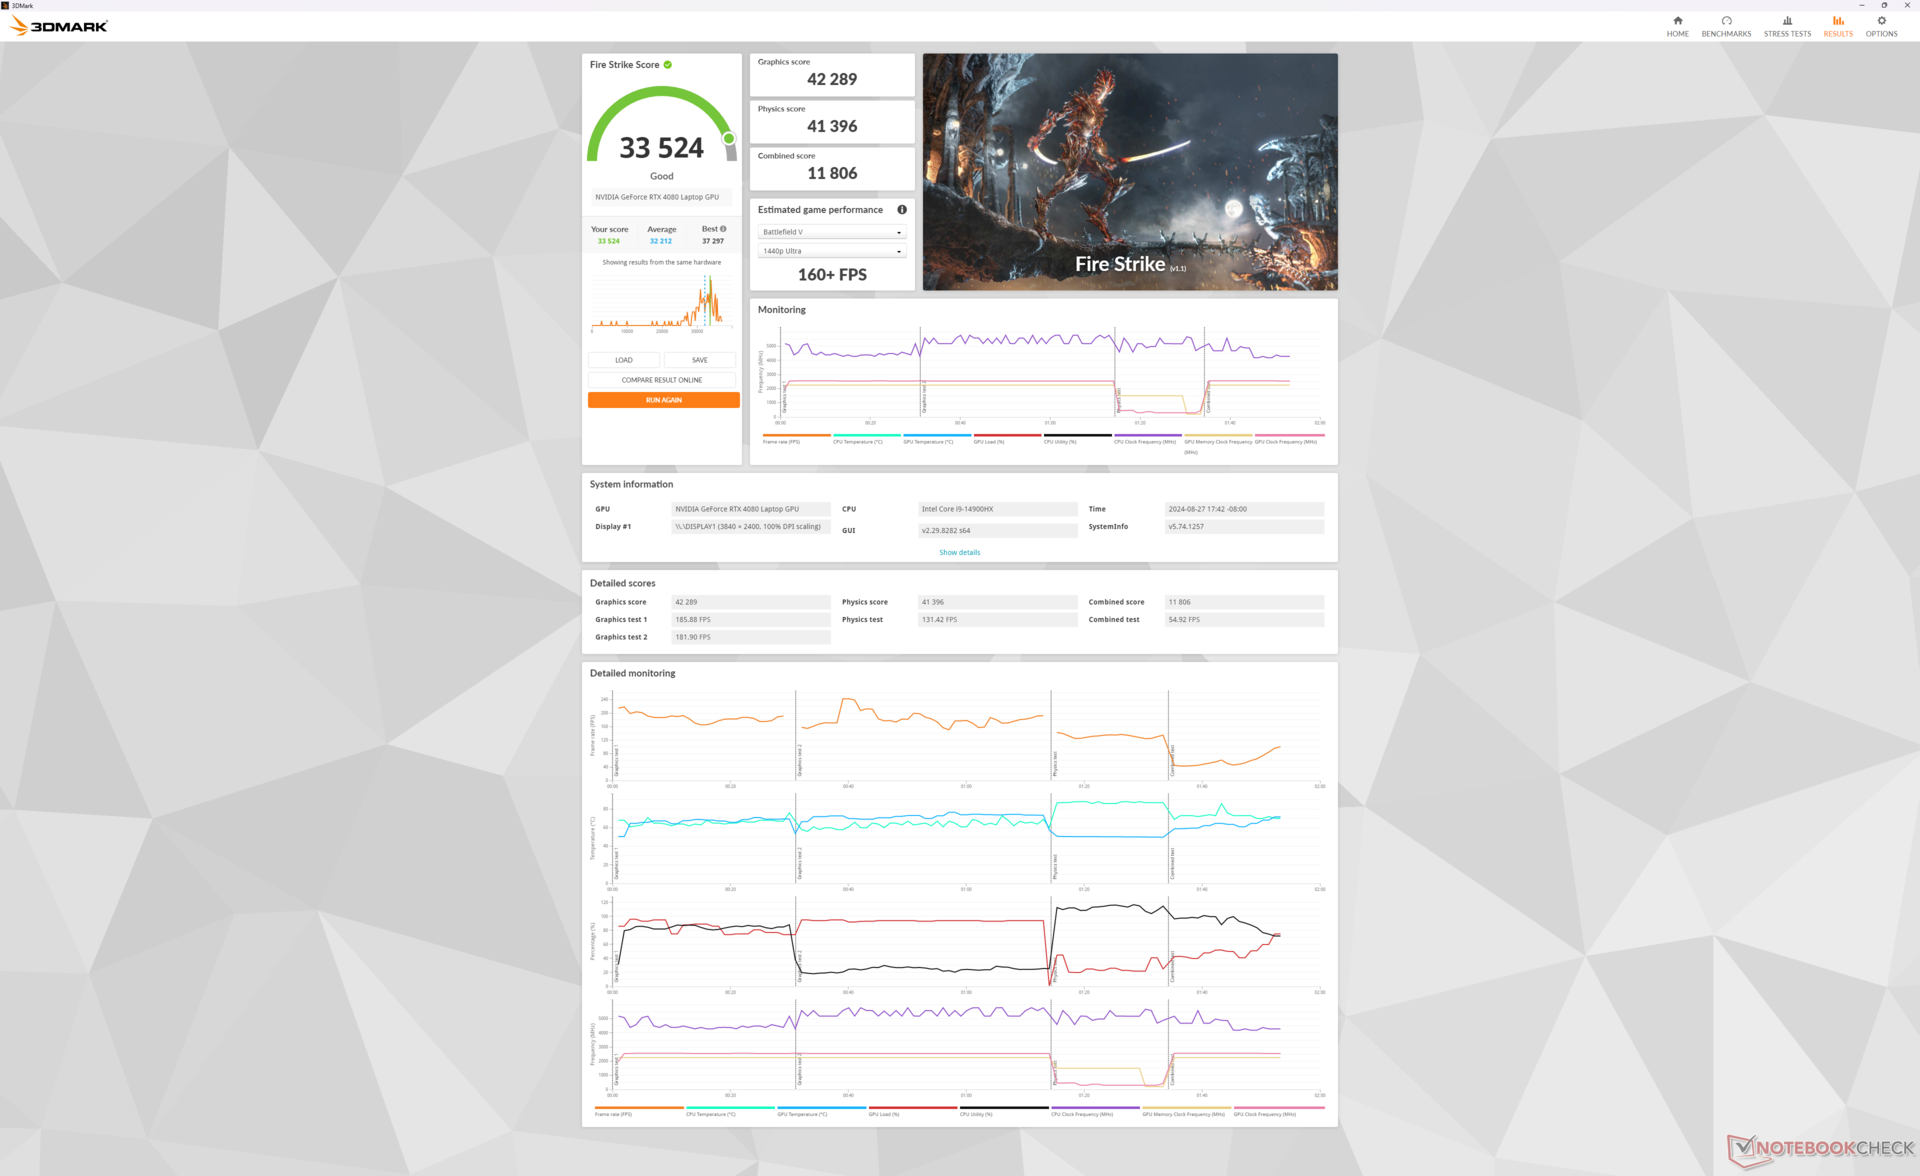

| 3DMark 11 Performance | 42822 punten | |
| 3DMark Fire Strike Score | 33524 punten | |
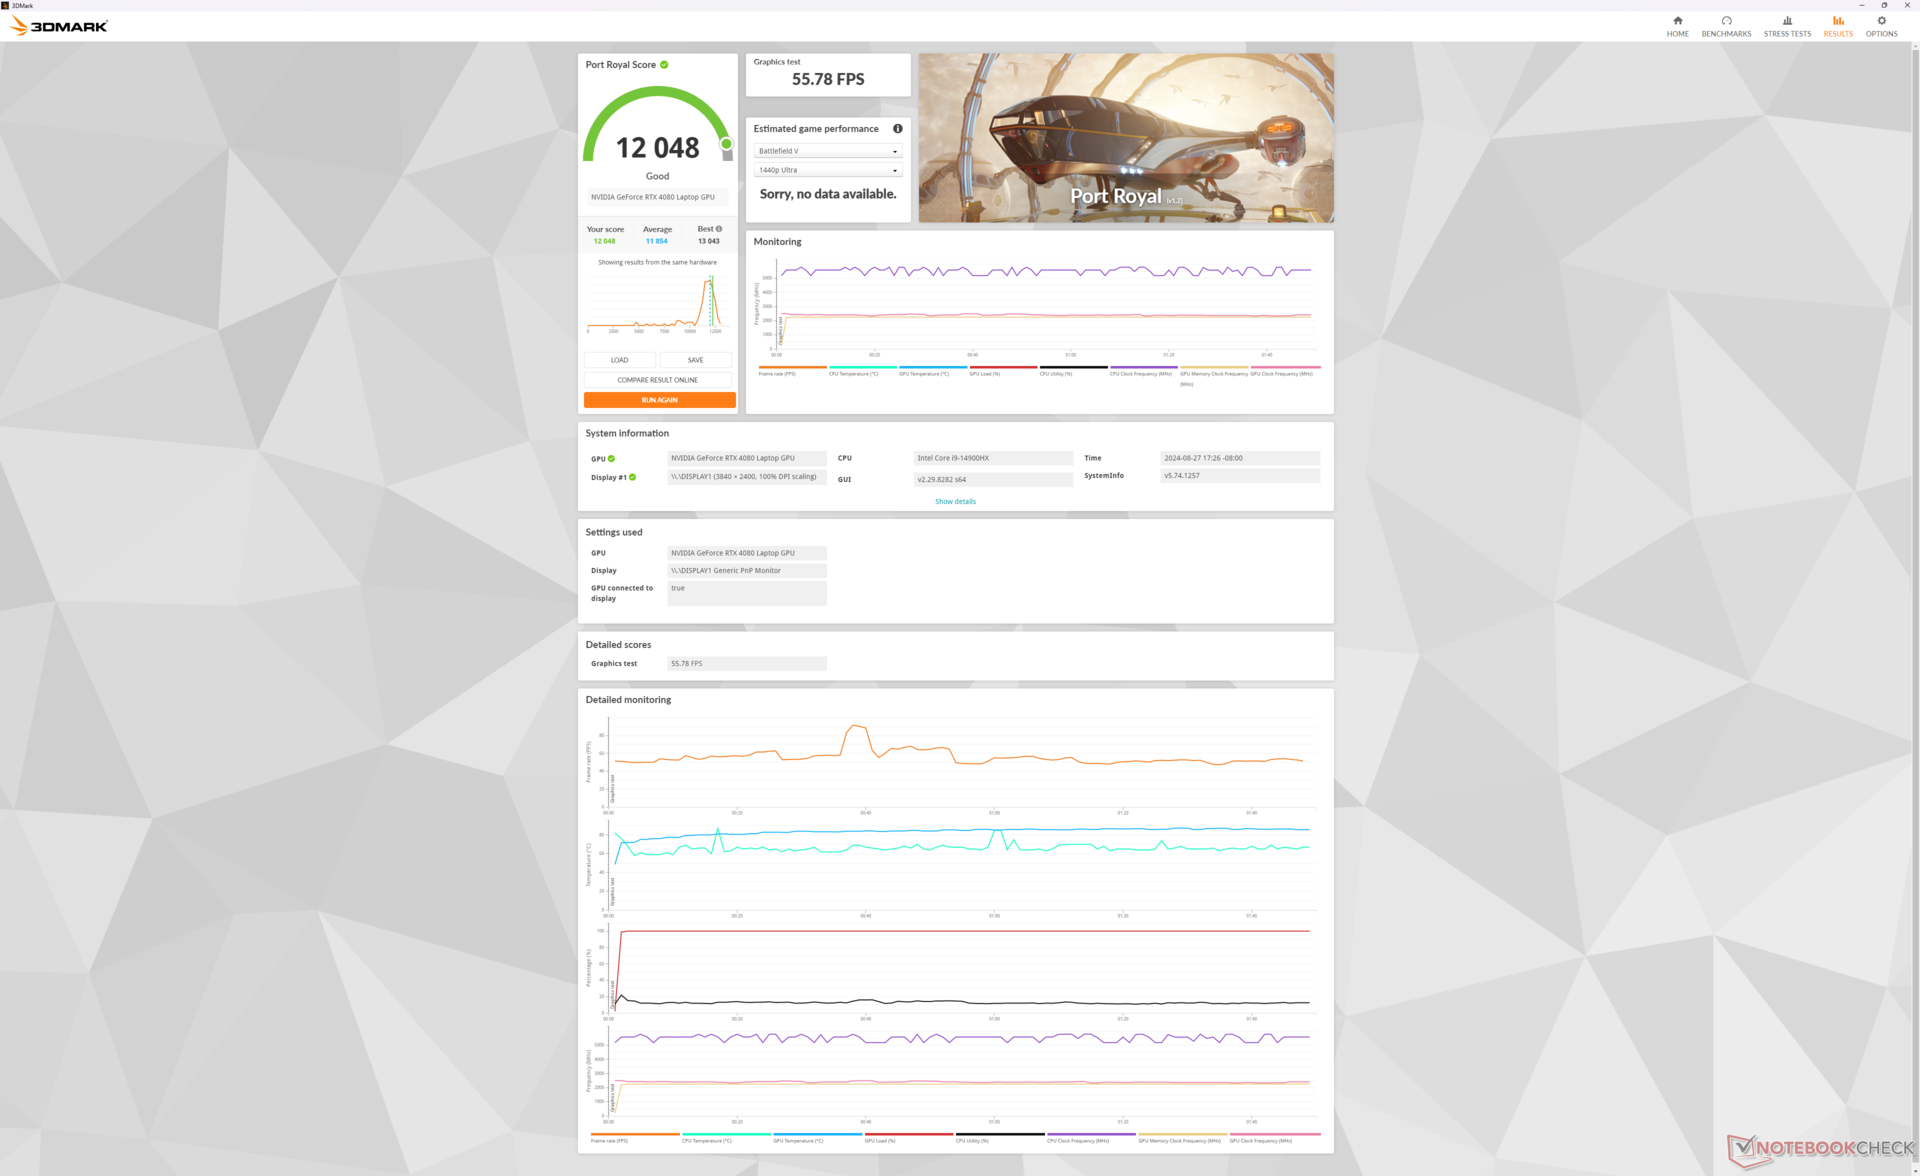
| 3DMark Time Spy Score | 18608 punten | |
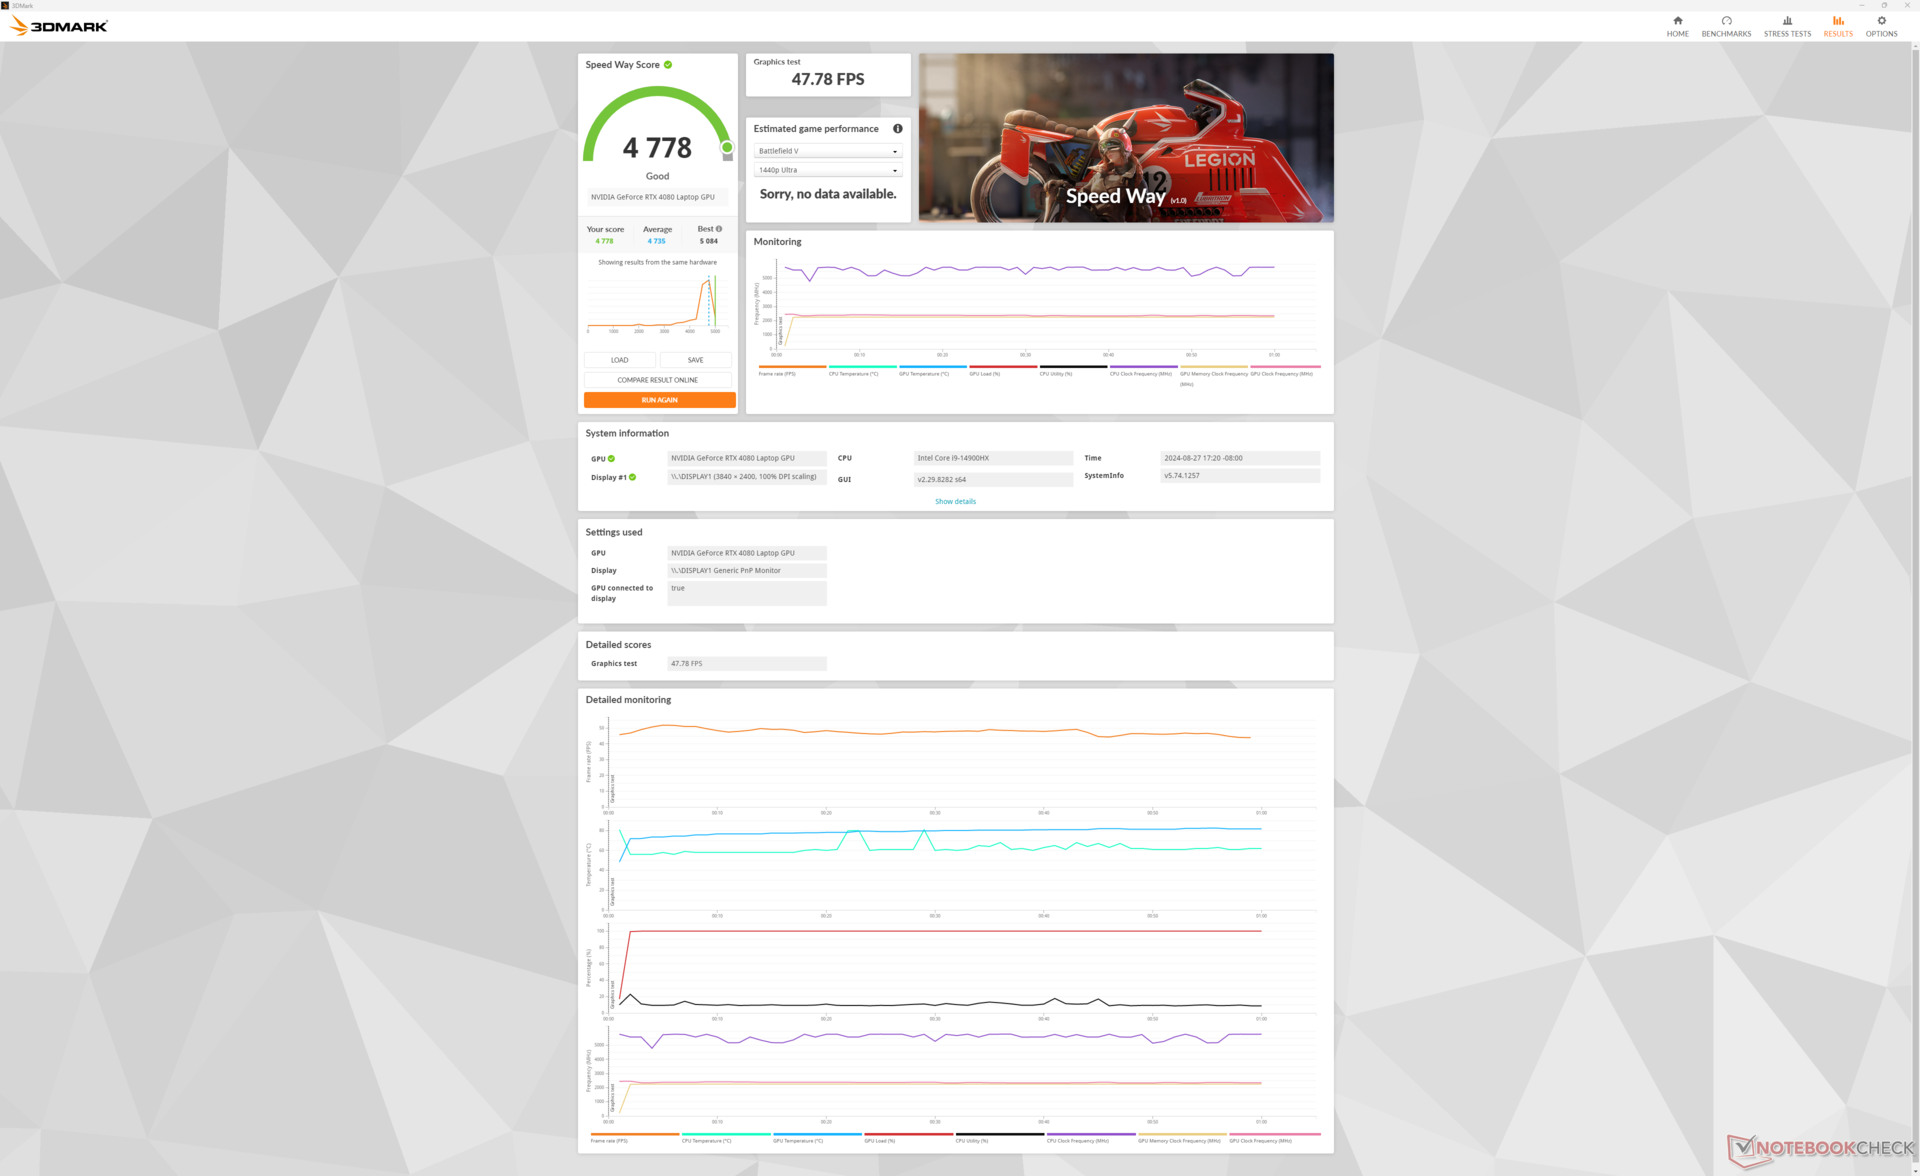
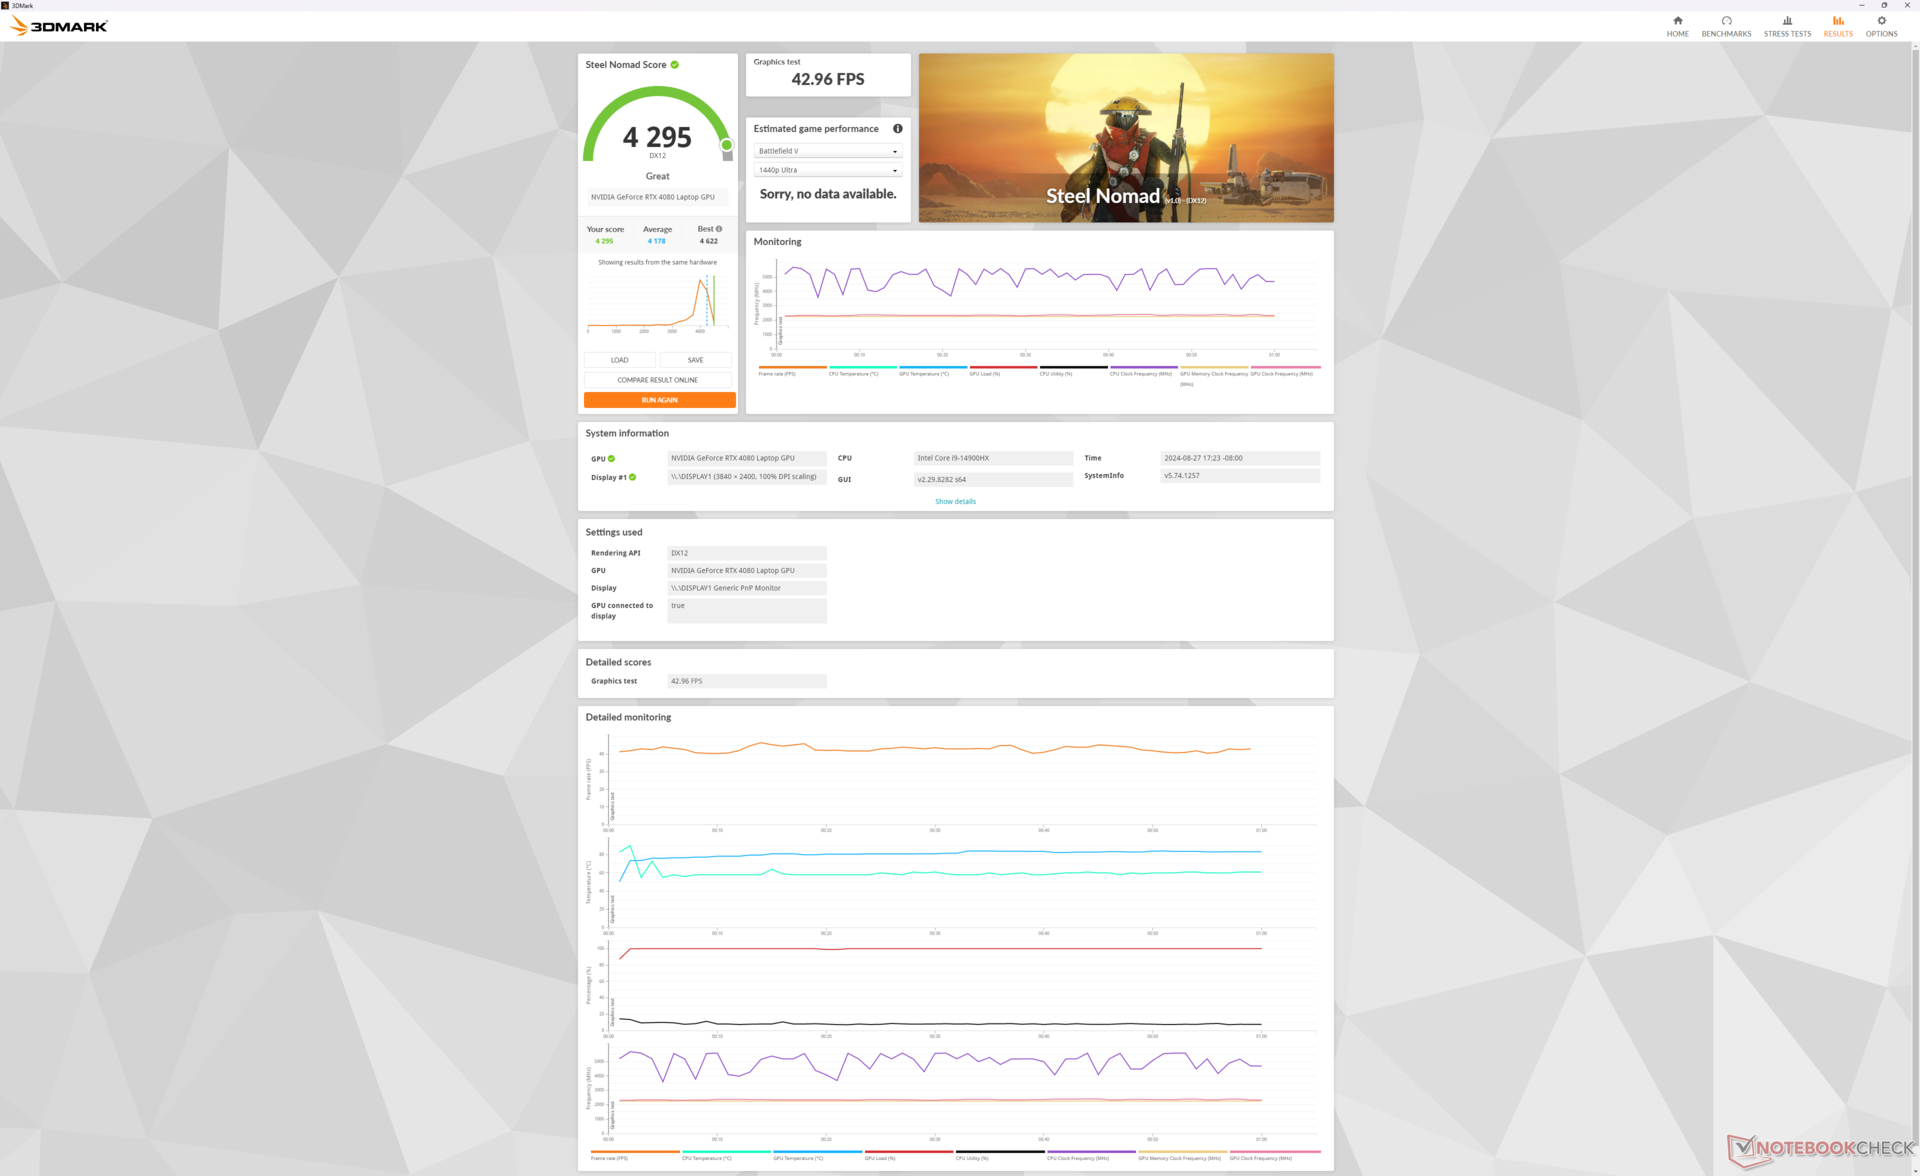
| 3DMark Steel Nomad Score | 4295 punten | |
Help | ||
* ... kleiner is beter
Gaming prestaties
Moderne titels draaien redelijk goed op de native 4K UHD+ resolutie. DLSS wordt aanbevolen bij veeleisende titels zoals Cyberpunk 2077 om framerates dichter bij 60 FPS te krijgen.
Vreemd genoeg kon Baldur's Gate 3 niet starten op ons apparaat, zelfs niet na meerdere systeemresets in DX11- of DX12-modus.
| Performance Rating - Percent | |
| Alienware m18 R2 | |
| MSI Titan 18 HX A14VIG | |
| MSI Raider 18 HX A14V | |
| Razer Blade 18 2024 RZ09-0509 -1! | |
| Acer Predator Helios 18 PH18-72-98MW | |
| Asus ROG Strix G18 G814JI | |
| GTA V - 1920x1080 Highest Settings possible AA:4xMSAA + FX AF:16x | |
| MSI Raider 18 HX A14V | |
| MSI Titan 18 HX A14VIG | |
| Alienware m18 R2 | |
| Acer Predator Helios 18 PH18-72-98MW | |
| Razer Blade 18 2024 RZ09-0509 | |
| Asus ROG Strix G18 G814JI | |
| Final Fantasy XV Benchmark - 1920x1080 High Quality | |
| Alienware m18 R2 | |
| MSI Titan 18 HX A14VIG | |
| MSI Raider 18 HX A14V | |
| Acer Predator Helios 18 PH18-72-98MW | |
| Razer Blade 18 2024 RZ09-0509 | |
| Asus ROG Strix G18 G814JI | |
| Strange Brigade - 1920x1080 ultra AA:ultra AF:16 | |
| MSI Titan 18 HX A14VIG | |
| Alienware m18 R2 | |
| MSI Raider 18 HX A14V | |
| Razer Blade 18 2024 RZ09-0509 | |
| Acer Predator Helios 18 PH18-72-98MW | |
| Asus ROG Strix G18 G814JI | |
| Dota 2 Reborn - 1920x1080 ultra (3/3) best looking | |
| Acer Predator Helios 18 PH18-72-98MW | |
| MSI Titan 18 HX A14VIG | |
| MSI Raider 18 HX A14V | |
| Alienware m18 R2 | |
| Razer Blade 18 2024 RZ09-0509 | |
| Asus ROG Strix G18 G814JI | |
| X-Plane 11.11 - 1920x1080 high (fps_test=3) | |
| MSI Raider 18 HX A14V | |
| Alienware m18 R2 | |
| Razer Blade 18 2024 RZ09-0509 | |
| MSI Titan 18 HX A14VIG | |
| Acer Predator Helios 18 PH18-72-98MW | |
| Asus ROG Strix G18 G814JI | |
| Far Cry 5 - 1920x1080 Ultra Preset AA:T | |
| Alienware m18 R2 | |
| MSI Titan 18 HX A14VIG | |
| MSI Raider 18 HX A14V | |
| Asus ROG Strix G18 G814JI | |
| Acer Predator Helios 18 PH18-72-98MW | |
| Tiny Tina's Wonderlands | |
| 1920x1080 High Preset (DX12) | |
| Alienware m18 R2 | |
| MSI Raider 18 HX A14V | |
| Gemiddeld NVIDIA GeForce RTX 4080 Laptop GPU (166.7 - 213, n=6) | |
| 1920x1080 Badass Preset (DX12) | |
| Alienware m18 R2 | |
| MSI Raider 18 HX A14V | |
| Alienware m18 R1 AMD | |
| Gemiddeld NVIDIA GeForce RTX 4080 Laptop GPU (112.9 - 167.1, n=9) | |
| 2560x1440 Badass Preset (DX12) | |
| Alienware m18 R2 | |
| MSI Raider 18 HX A14V | |
| Alienware m18 R1 AMD | |
| Gemiddeld NVIDIA GeForce RTX 4080 Laptop GPU (85 - 114.8, n=9) | |
| 3840x2160 Badass Preset (DX12) | |
| Alienware m18 R2 | |
| MSI Raider 18 HX A14V | |
| Alienware m18 R1 AMD | |
| Gemiddeld NVIDIA GeForce RTX 4080 Laptop GPU (46.4 - 60.9, n=9) | |
Cyberpunk 2077 ultra FPS Chart
| lage | gem. | hoge | ultra | QHD | 4K | |
|---|---|---|---|---|---|---|
| GTA V (2015) | 185.1 | 183.8 | 181.6 | 143.4 | 134.6 | 158.3 |
| Dota 2 Reborn (2015) | 218 | 193.1 | 184.6 | 172.5 | 166.4 | |
| Final Fantasy XV Benchmark (2018) | 223 | 212 | 177 | 141.8 | 78.6 | |
| X-Plane 11.11 (2018) | 199 | 178.5 | 143.5 | 119.3 | ||
| Far Cry 5 (2018) | 173 | 163 | 151 | 149 | 96 | |
| Strange Brigade (2018) | 504 | 408 | 378 | 349 | 246 | 122.6 |
| Tiny Tina's Wonderlands (2022) | 352.5 | 292.6 | 203.3 | 159.4 | 111.2 | 60.9 |
| F1 22 (2022) | 305 | 299 | 271 | 121.2 | 77.8 | 39.8 |
| Cyberpunk 2077 2.2 Phantom Liberty (2023) | 150.6 | 150 | 140.7 | 125.5 | 82.5 | 35.1 |
Uitstoot - Stil bij stationair draaien, luid bij gamen
Systeemgeluid
Het geluid en gedrag van de ventilator zijn vergelijkbaar met de Titan 18 HX ondanks de verschillen in koeloplossing. De ventilatoren hebben de neiging om te pulseren, zelfs tijdens het surfen op het web in de gebalanceerde modus of stille modus, net als bij de Titan, maar de geluidstoename is gelukkig niet sterk genoeg om storend te zijn.
MSI Center heeft een directe invloed op de game-ervaring, omdat het ventilatorgeluid nauw samenhangt met uw geselecteerde energieprofiel. Het uitvoeren van Cyberpunk 2077 in de modus Gebalanceerd, de modus Extreme prestaties met Cooler Boost uit en de modus Extreme prestaties met Cooler Boost aan resulteert in een stabiel ventilatorgeluid van respectievelijk 52,8 dB(A), 59,4 dB(A) en 62,7 dB(A). Het geluidsverschil tussen de standen Gebalanceerd en Extreme prestaties is aanzienlijk, ook al is het prestatietekort tussen beide klein, wat betekent dat de modus Gebalanceerd voor de meeste spelscenario's wordt aanbevolen. Cooler Boost is daarom vooral nuttig voor handmatig overklokken, omdat het anders geen grote voordelen voor gaming biedt bij de standaardinstellingen.
Het lage tot middelhoge 50 dB(A) bereik tijdens het gamen komt het meest overeen met de Blade 18 of Alienware m18 R2. Een hoofdtelefoon wordt aanbevolen, vooral bij gamen in de modus Extreme prestaties.
Geluidsniveau
| Onbelast |
| 28.6 / 28.6 / 31.3 dB (A) |
| Belasting |
| 44.1 / 62.7 dB (A) |
 | ||
30 dB stil 40 dB(A) hoorbaar 50 dB(A) luid |
||
min: | ||
| MSI Raider 18 HX A14V NVIDIA GeForce RTX 4080 Laptop GPU, i9-14900HX, Samsung PM9A1 MZVL22T0HBLB | Razer Blade 18 2024 RZ09-0509 NVIDIA GeForce RTX 4090 Laptop GPU, i9-14900HX | Alienware m18 R2 NVIDIA GeForce RTX 4090 Laptop GPU, i9-14900HX, SK Hynix PC811 HFS002TEM9X152N | MSI Titan 18 HX A14VIG NVIDIA GeForce RTX 4090 Laptop GPU, i9-14900HX, 2x Samsung PM9A1a MZVL22T0HDLB (RAID 0) | Asus ROG Strix G18 G814JI NVIDIA GeForce RTX 4070 Laptop GPU, i7-13650HX, Micron 2400 MTFDKBA1T0QFM | Acer Predator Helios 18 PH18-72-98MW NVIDIA GeForce RTX 4090 Laptop GPU, i9-14900HX, 2x SK Hynix HFS001TEJ9X115N (RAID 0) | |
|---|---|---|---|---|---|---|
| Noise | 7% | 11% | 10% | 8% | -12% | |
| uit / omgeving * | 23.3 | 23.4 -0% | 23.6 -1% | 22.8 2% | 25 -7% | 25 -7% |
| Idle Minimum * | 28.6 | 23.9 16% | 23.8 17% | 23.8 17% | 26 9% | 30 -5% |
| Idle Average * | 28.6 | 28.2 1% | 26.1 9% | 23.8 17% | 28 2% | 36 -26% |
| Idle Maximum * | 31.3 | 29 7% | 31.5 -1% | 28 11% | 29 7% | 44 -41% |
| Load Average * | 44.1 | 36.8 17% | 31.5 29% | 38 14% | 41 7% | 48 -9% |
| Cyberpunk 2077 ultra * | 59.4 | |||||
| Load Maximum * | 62.7 | 61.1 3% | 56.6 10% | 62.8 -0% | 46 27% | 51 19% |
| Witcher 3 ultra * | 54.1 | 52.1 | 57.3 | 44 | 49 |
* ... kleiner is beter
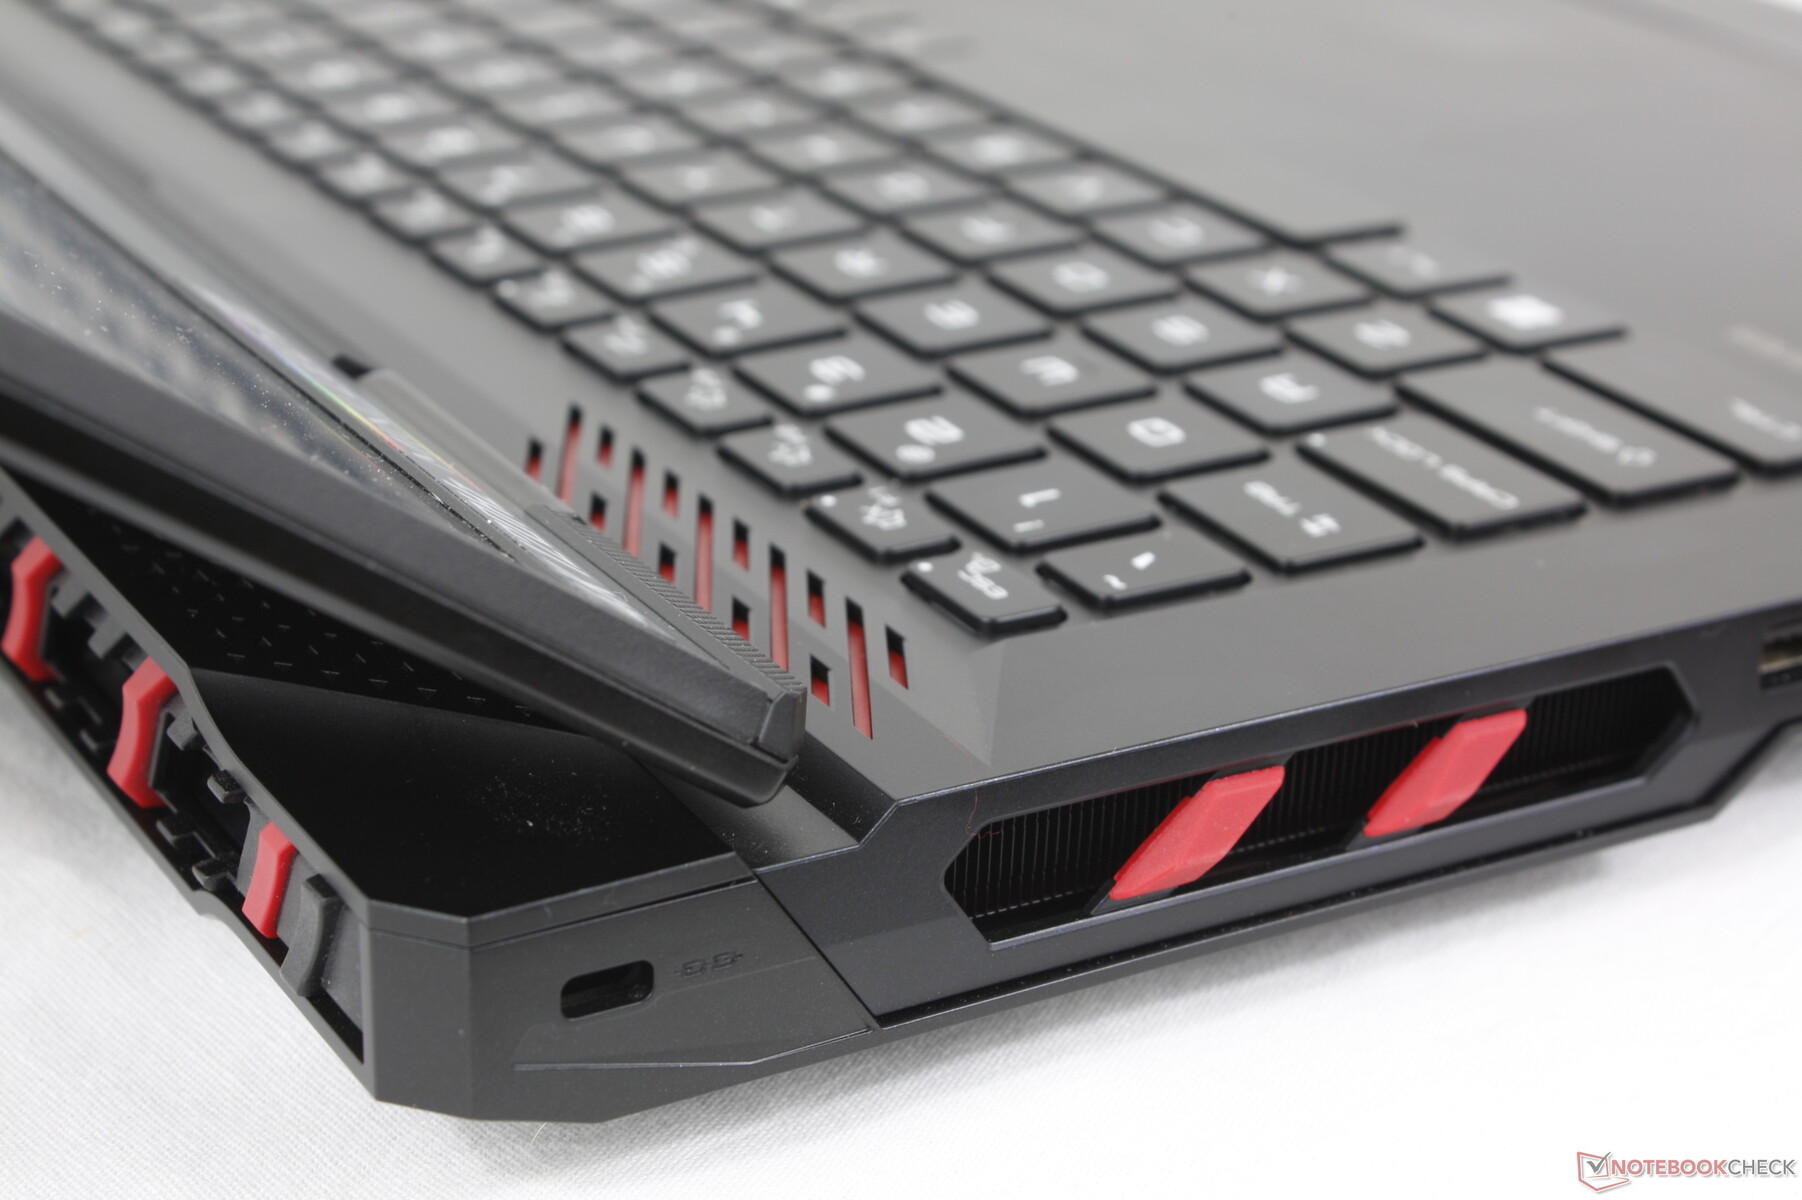
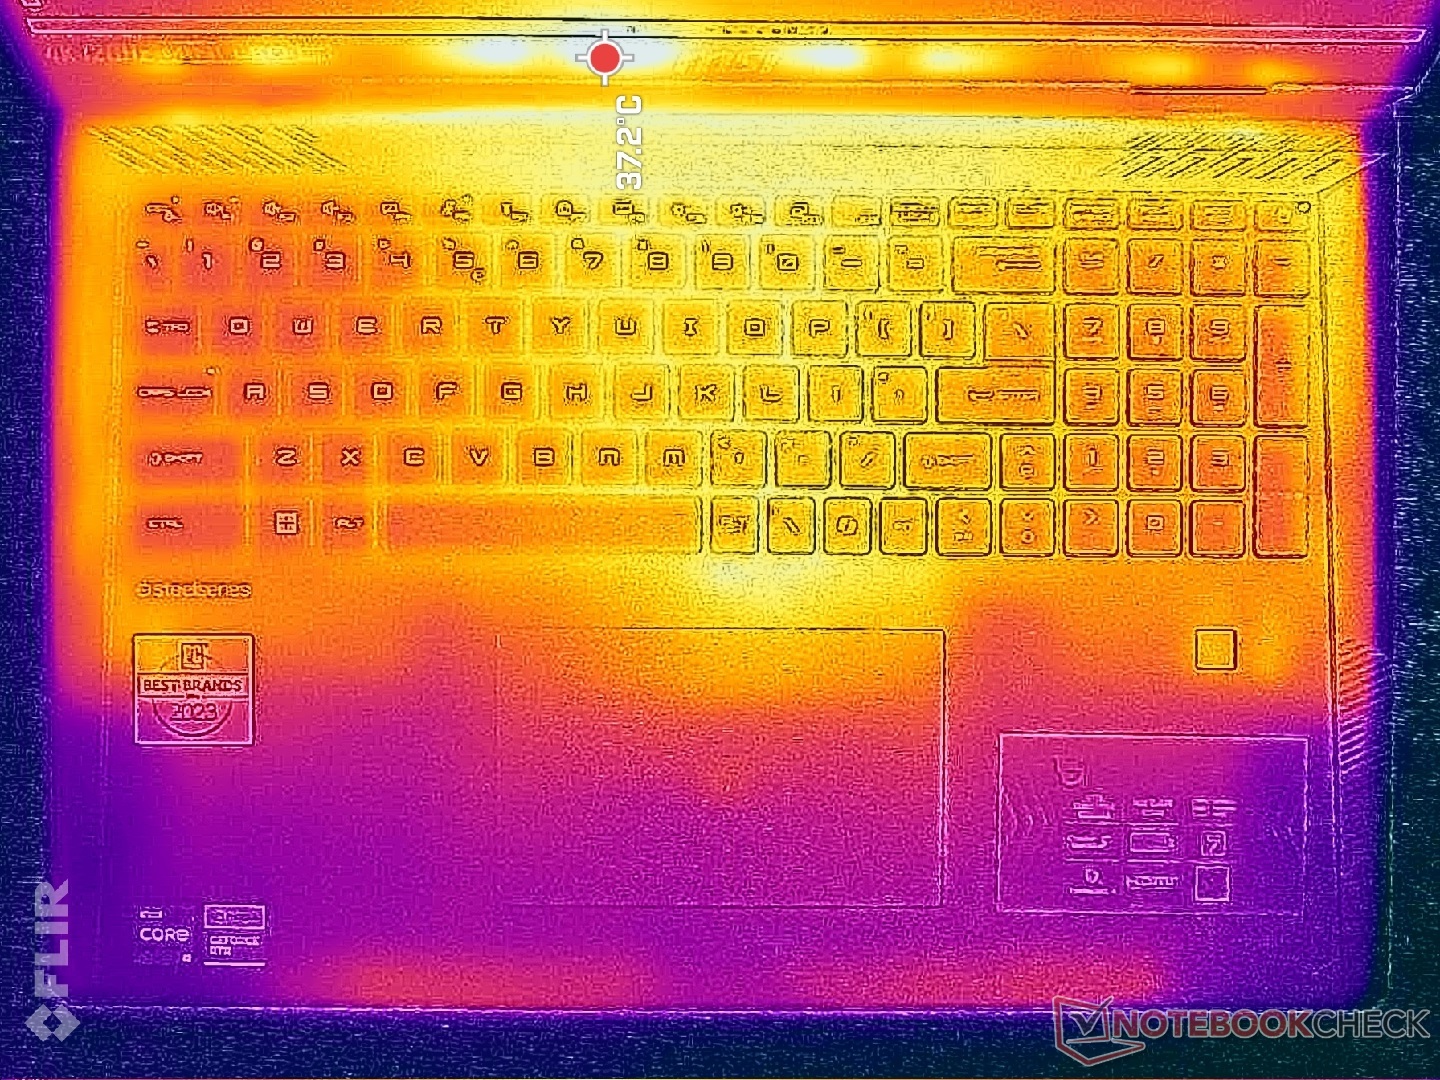
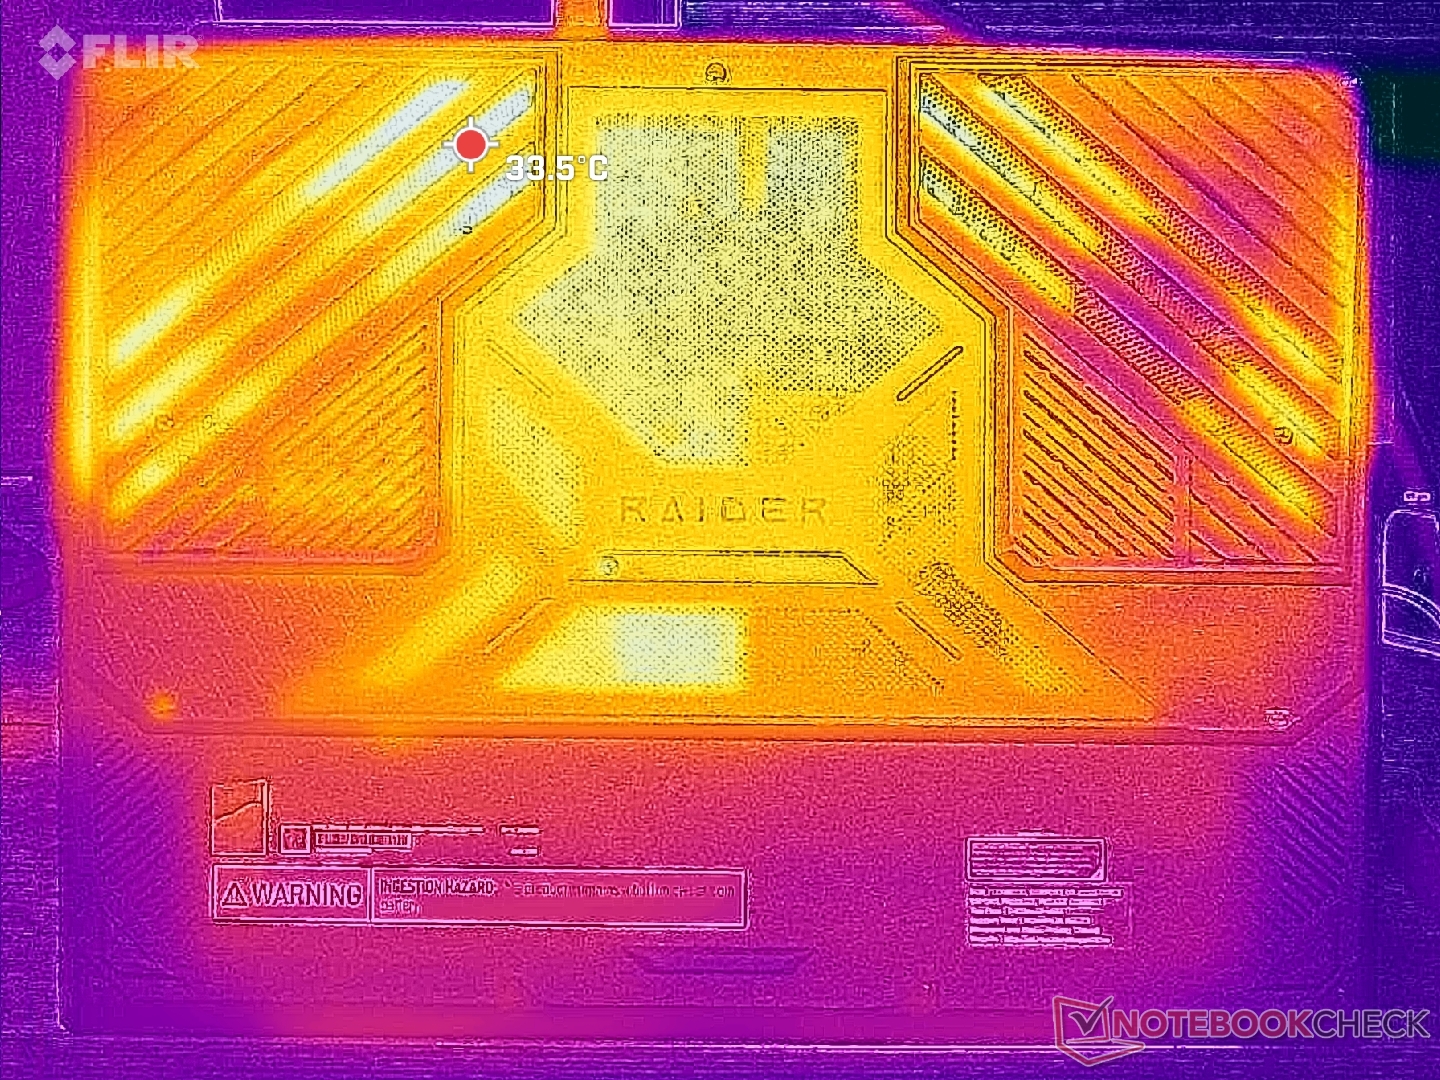
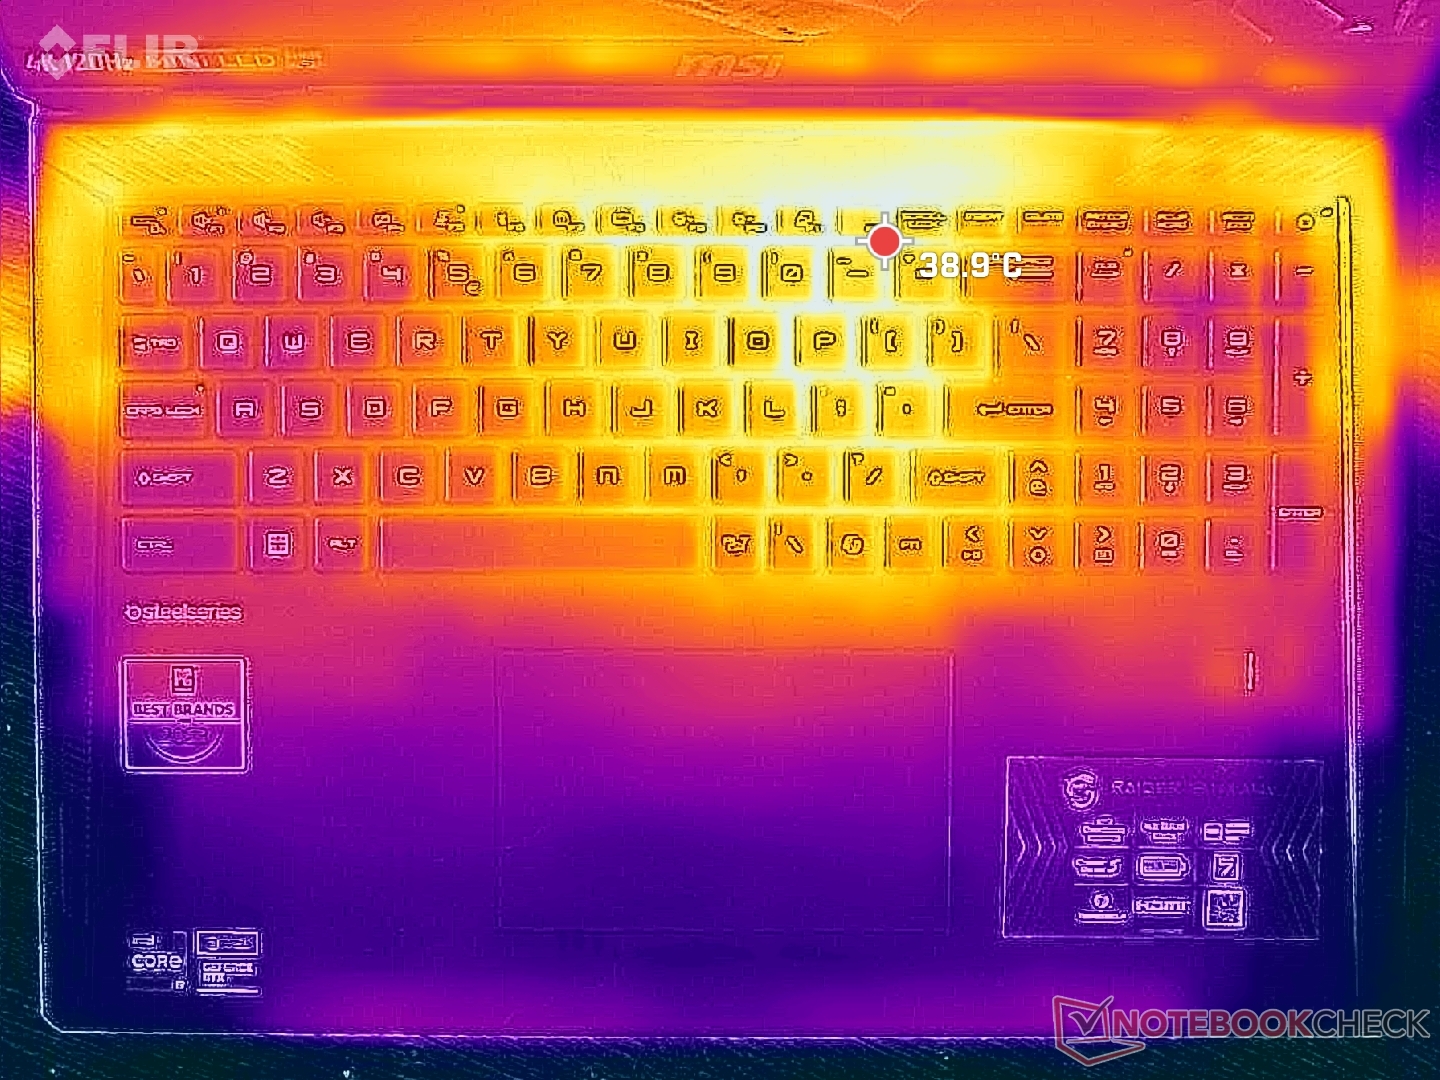
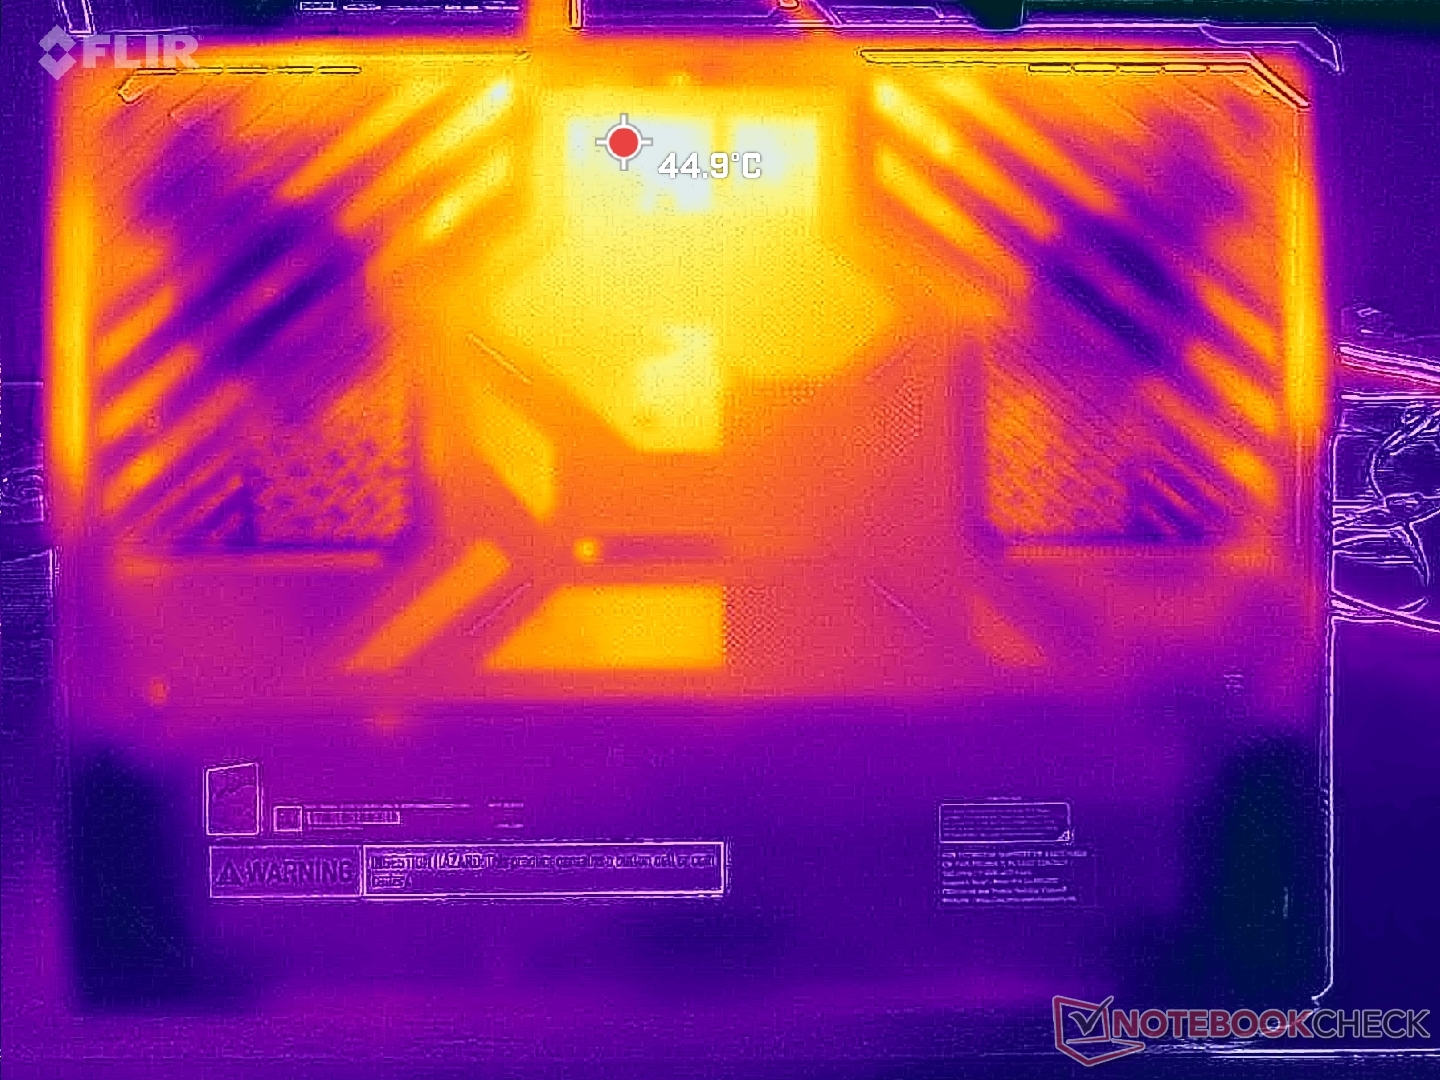
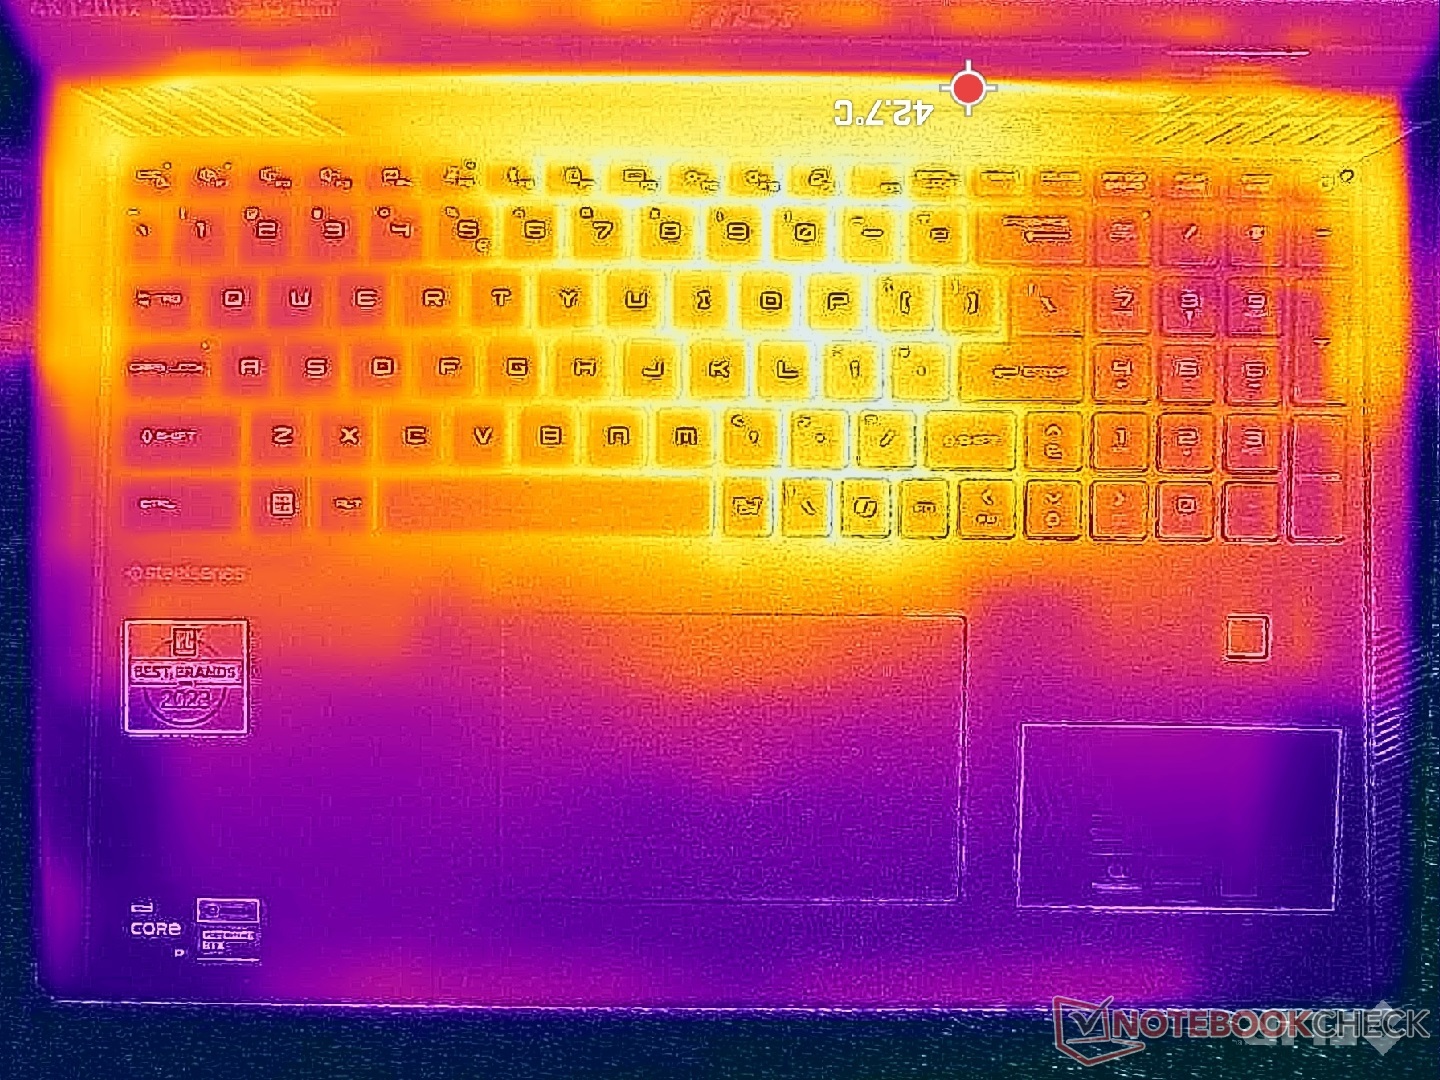
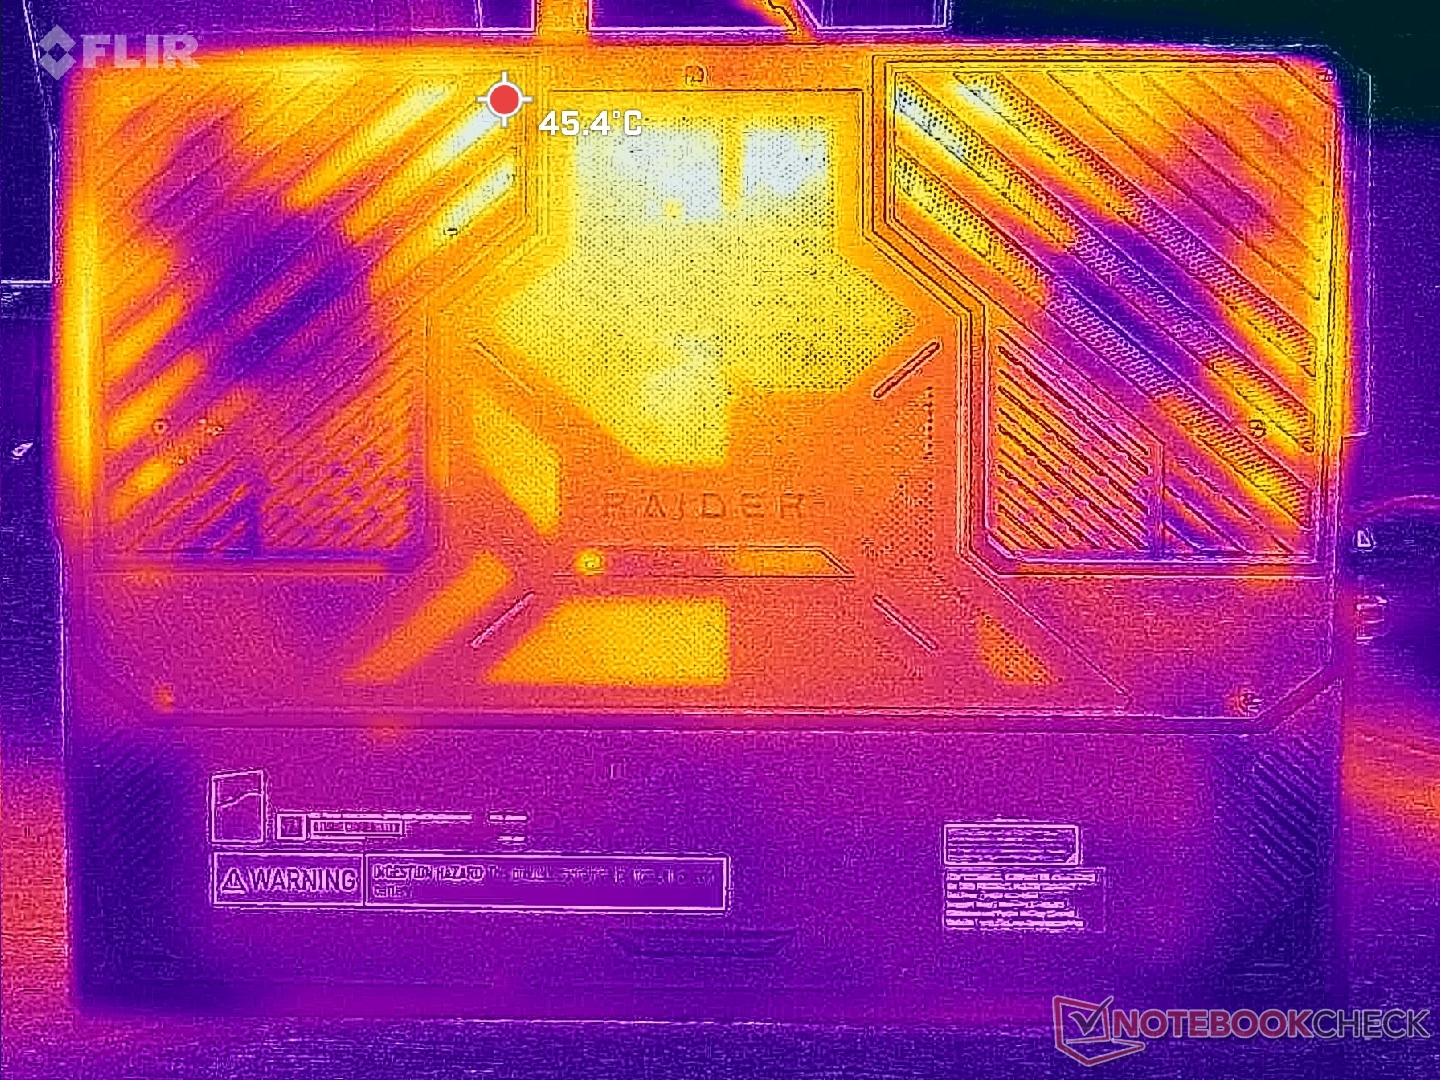
Temperatuur
Hete plekken kunnen tijdens het gamen oplopen tot net boven de 40 C, net als op de Titan 18 HX. De hetere gebieden bevinden zich in het midden van het toetsenbord, zodat de WASD-toetsen, numpad en palmsteunen veel koeler blijven en comfortabeler aanvoelen op de huid.
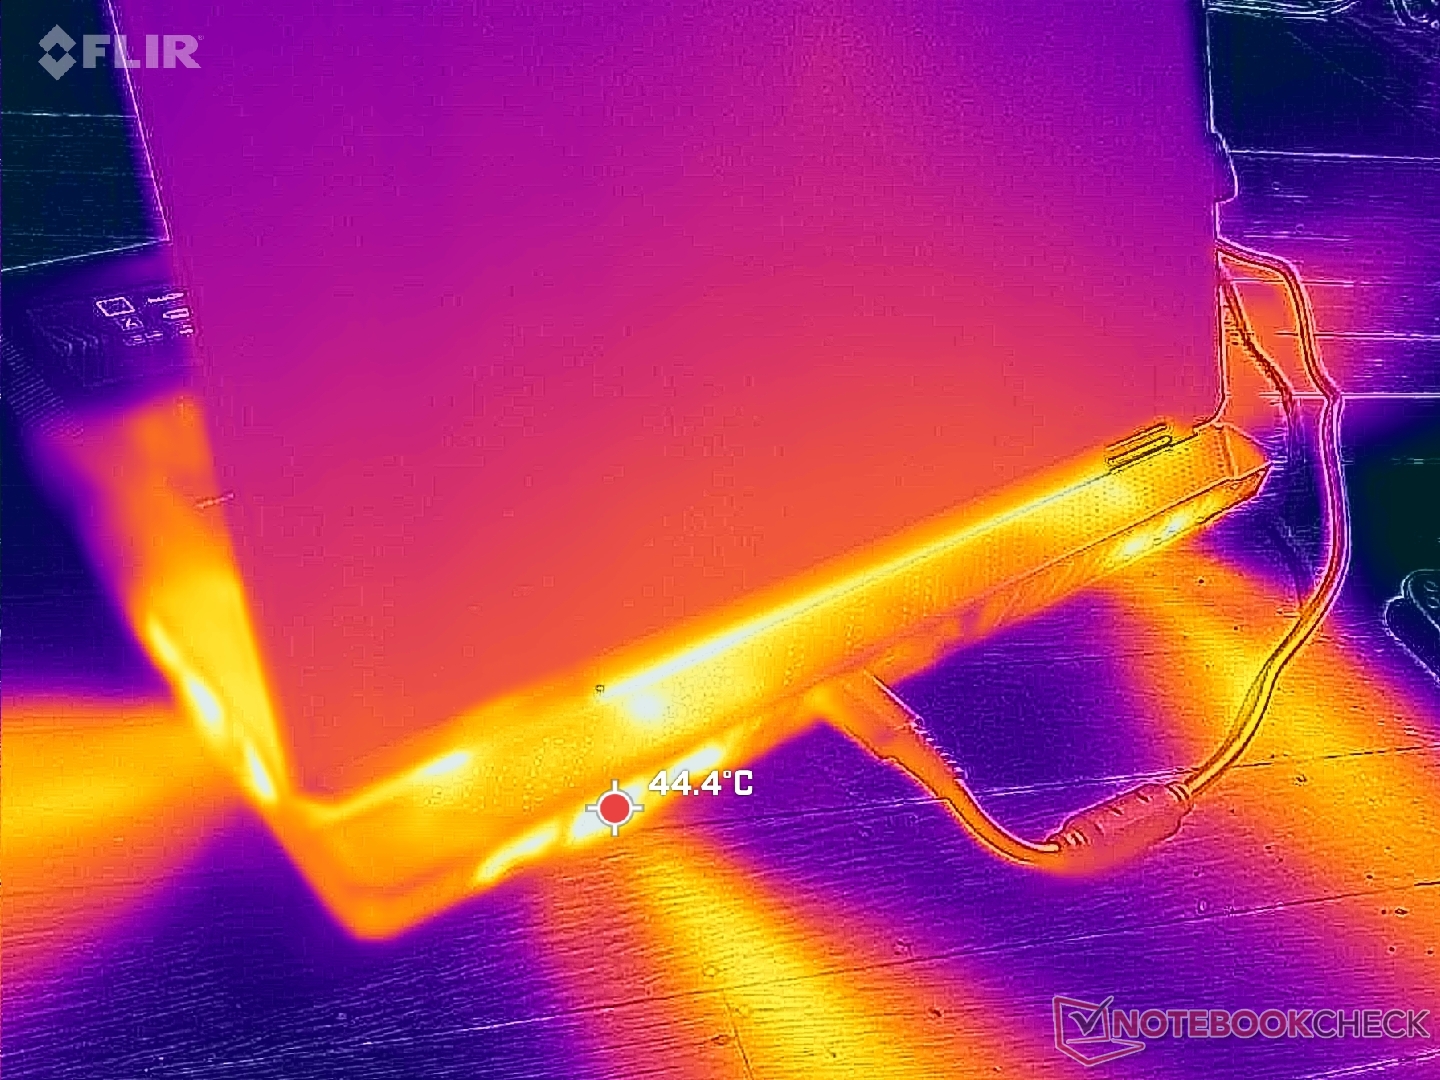
(±) De maximumtemperatuur aan de bovenzijde bedraagt 40.8 °C / 105 F, vergeleken met het gemiddelde van 40.4 °C / 105 F, variërend van 21.2 tot 68.8 °C voor de klasse Gaming.
(±) De bodem warmt op tot een maximum van 43.4 °C / 110 F, vergeleken met een gemiddelde van 43.2 °C / 110 F
(±) Bij onbelast gebruik bedraagt de gemiddelde temperatuur voor de bovenzijde 33.7 °C / 93 F, vergeleken met het apparaatgemiddelde van 33.9 °C / 93 F.
(±) 3: The average temperature for the upper side is 34.4 °C / 94 F, compared to the average of 33.9 °C / 93 F for the class Gaming.
(+) De handpalmsteunen en het touchpad bereiken maximaal de huidtemperatuur (32.6 °C / 90.7 F) en zijn dus niet heet.
(-) De gemiddelde temperatuur van de handpalmsteun van soortgelijke toestellen bedroeg 28.9 °C / 84 F (-3.7 °C / -6.7 F).
| MSI Raider 18 HX A14V Intel Core i9-14900HX, NVIDIA GeForce RTX 4080 Laptop GPU | Razer Blade 18 2024 RZ09-0509 Intel Core i9-14900HX, NVIDIA GeForce RTX 4090 Laptop GPU | Alienware m18 R2 Intel Core i9-14900HX, NVIDIA GeForce RTX 4090 Laptop GPU | MSI Titan 18 HX A14VIG Intel Core i9-14900HX, NVIDIA GeForce RTX 4090 Laptop GPU | Asus ROG Strix G18 G814JI Intel Core i7-13650HX, NVIDIA GeForce RTX 4070 Laptop GPU | Acer Predator Helios 18 PH18-72-98MW Intel Core i9-14900HX, NVIDIA GeForce RTX 4090 Laptop GPU | |
|---|---|---|---|---|---|---|
| Heat | -1% | -5% | 6% | 5% | -6% | |
| Maximum Upper Side * | 40.8 | 43.2 -6% | 41.2 -1% | 37.8 7% | 45 -10% | 43 -5% |
| Maximum Bottom * | 43.4 | 42.6 2% | 34.6 20% | 37.6 13% | 47 -8% | 59 -36% |
| Idle Upper Side * | 36.4 | 36 1% | 42.8 -18% | 34.8 4% | 28 23% | 32 12% |
| Idle Bottom * | 36.4 | 36.4 -0% | 43.6 -20% | 36 1% | 31 15% | 34 7% |
* ... kleiner is beter
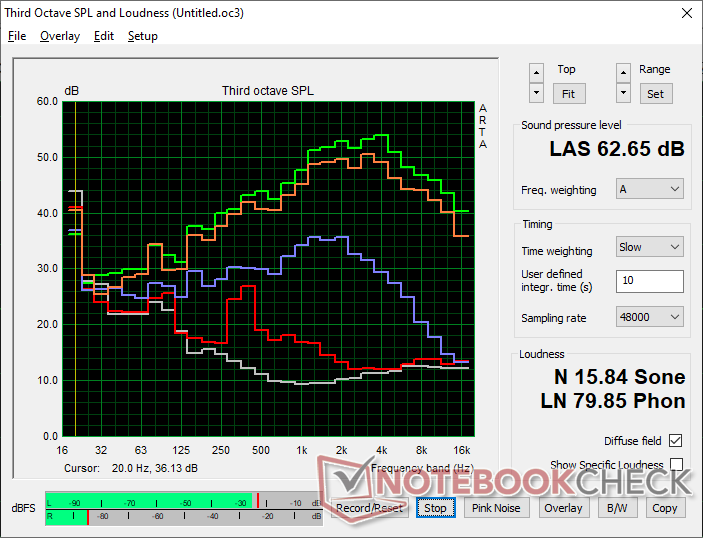
Luidsprekers
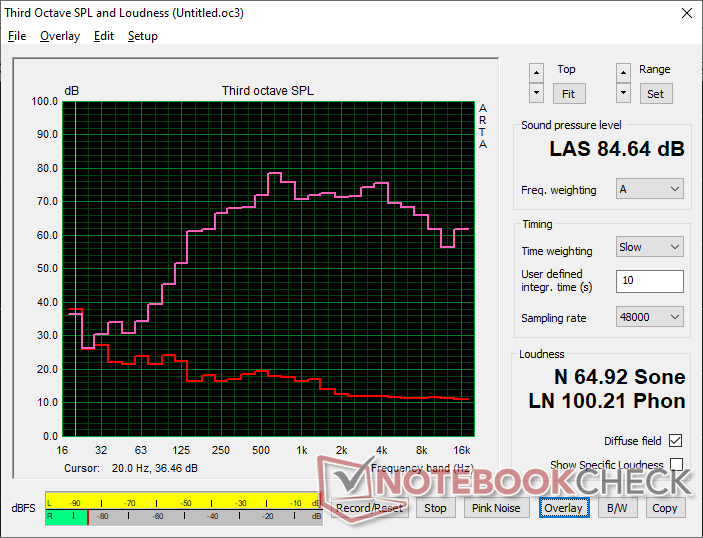
MSI Raider 18 HX A14V audioanalyse
(+) | luidsprekers kunnen relatief luid spelen (84.6 dB)
Bas 100 - 315 Hz
(±) | verminderde zeebaars - gemiddeld 9.2% lager dan de mediaan
(±) | lineariteit van de lage tonen is gemiddeld (9.2% delta ten opzichte van de vorige frequentie)
Midden 400 - 2000 Hz
(+) | evenwichtige middens - slechts 4.3% verwijderd van de mediaan
(+) | de middentonen zijn lineair (5.1% delta ten opzichte van de vorige frequentie)
Hoog 2 - 16 kHz
(+) | evenwichtige hoogtepunten - slechts 3.8% verwijderd van de mediaan
(+) | de hoge tonen zijn lineair (4.9% delta naar de vorige frequentie)
Algemeen 100 - 16.000 Hz
(+) | het totale geluid is lineair (11.9% verschil met de mediaan)
Vergeleken met dezelfde klasse
» 11% van alle geteste apparaten in deze klasse waren beter, 4% vergelijkbaar, 85% slechter
» De beste had een delta van 6%, het gemiddelde was 18%, de slechtste was 132%
Vergeleken met alle geteste toestellen
» 8% van alle geteste apparaten waren beter, 2% gelijk, 90% slechter
» De beste had een delta van 4%, het gemiddelde was 24%, de slechtste was 134%
Apple MacBook Pro 16 2021 M1 Pro audioanalyse
(+) | luidsprekers kunnen relatief luid spelen (84.7 dB)
Bas 100 - 315 Hz
(+) | goede baars - slechts 3.8% verwijderd van de mediaan
(+) | de lage tonen zijn lineair (5.2% delta naar de vorige frequentie)
Midden 400 - 2000 Hz
(+) | evenwichtige middens - slechts 1.3% verwijderd van de mediaan
(+) | de middentonen zijn lineair (2.1% delta ten opzichte van de vorige frequentie)
Hoog 2 - 16 kHz
(+) | evenwichtige hoogtepunten - slechts 1.9% verwijderd van de mediaan
(+) | de hoge tonen zijn lineair (2.7% delta naar de vorige frequentie)
Algemeen 100 - 16.000 Hz
(+) | het totale geluid is lineair (4.6% verschil met de mediaan)
Vergeleken met dezelfde klasse
» 0% van alle geteste apparaten in deze klasse waren beter, 0% vergelijkbaar, 100% slechter
» De beste had een delta van 5%, het gemiddelde was 18%, de slechtste was 45%
Vergeleken met alle geteste toestellen
» 0% van alle geteste apparaten waren beter, 0% gelijk, 100% slechter
» De beste had een delta van 4%, het gemiddelde was 24%, de slechtste was 134%
Energiebeheer
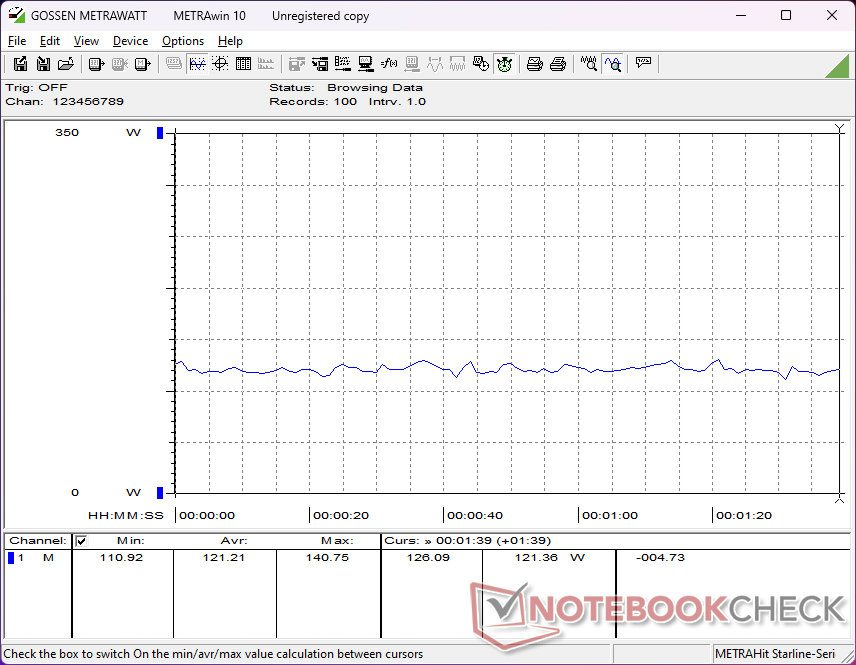
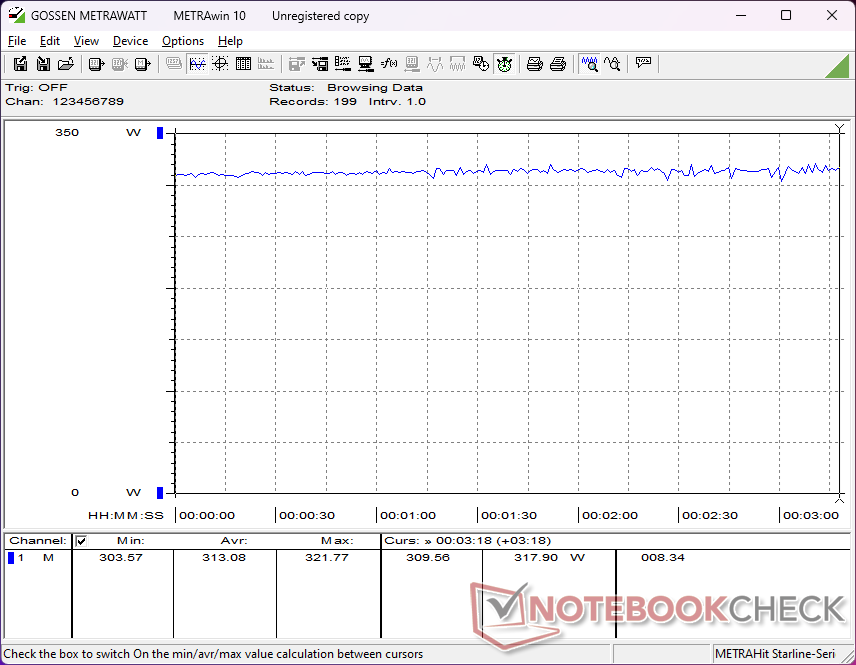
Stroomverbruik
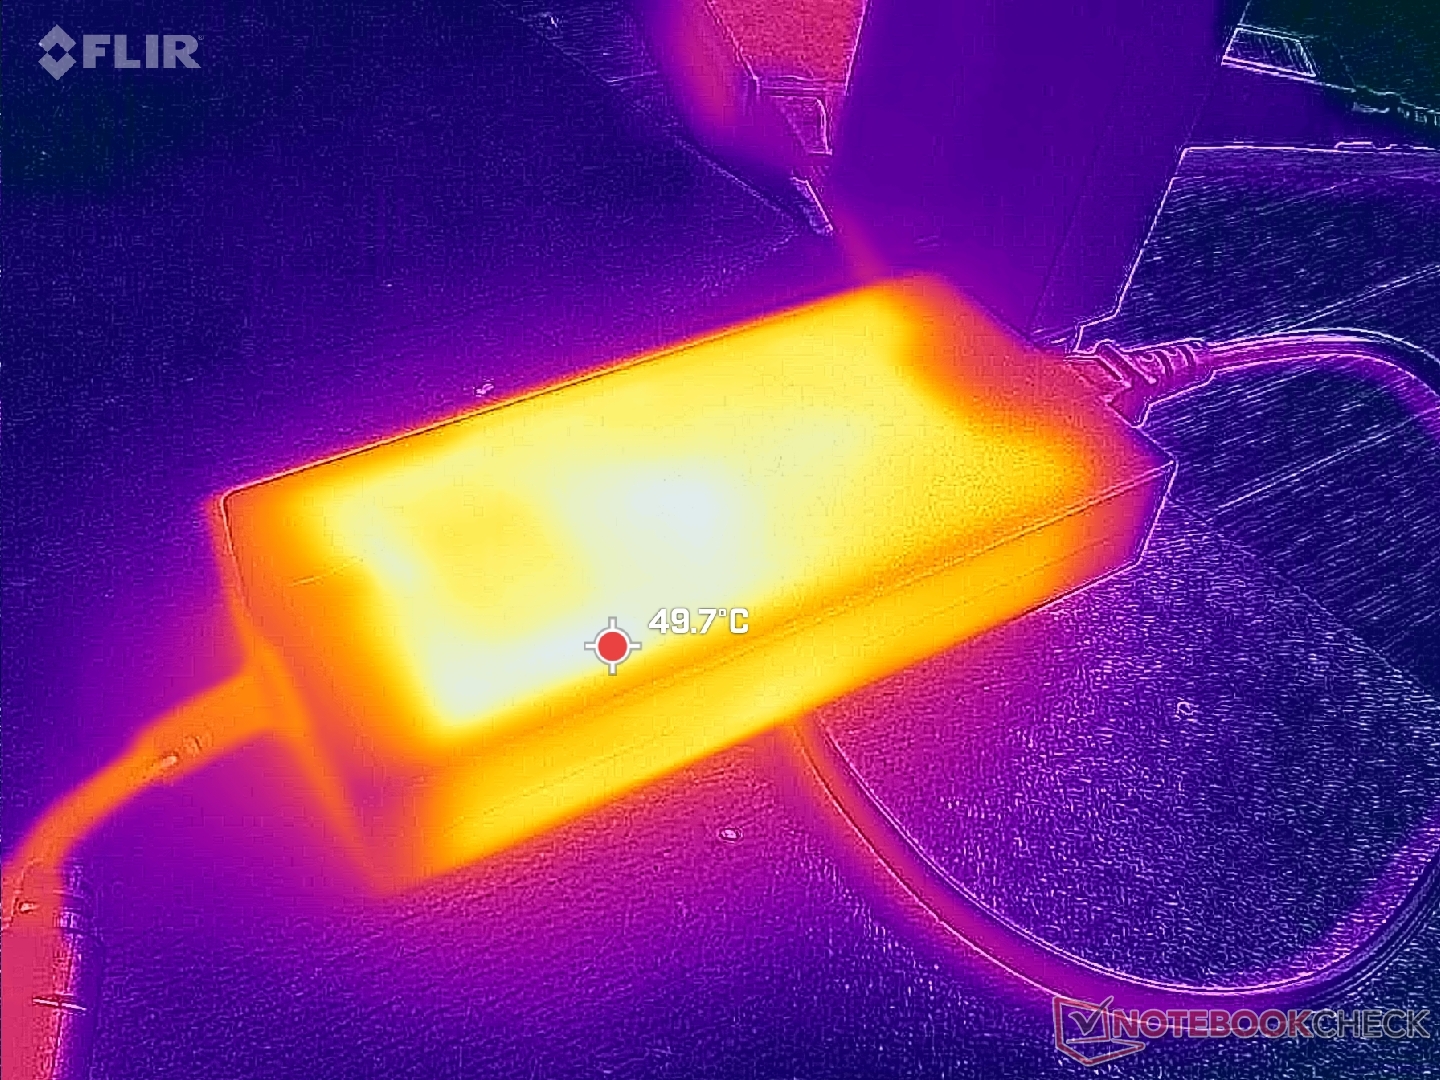
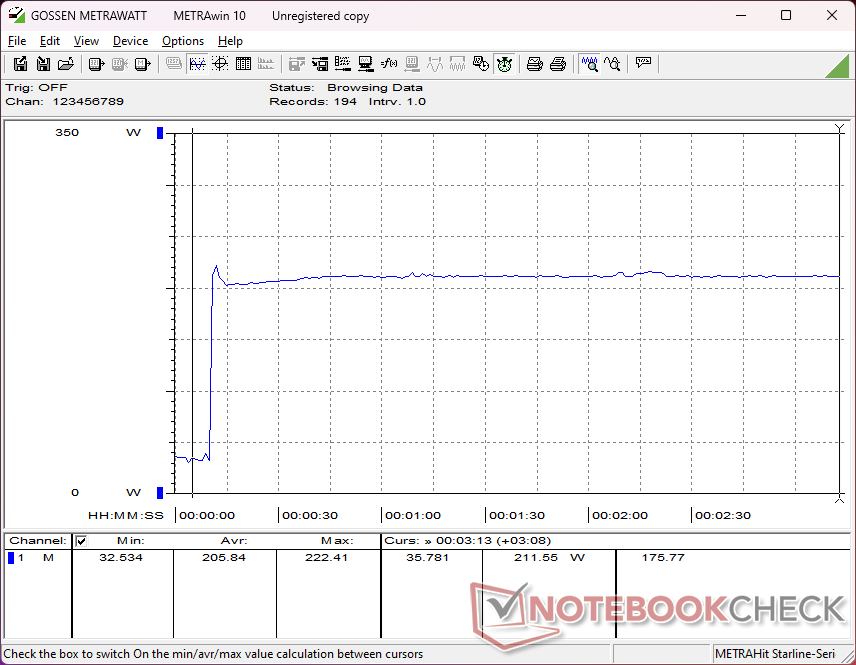
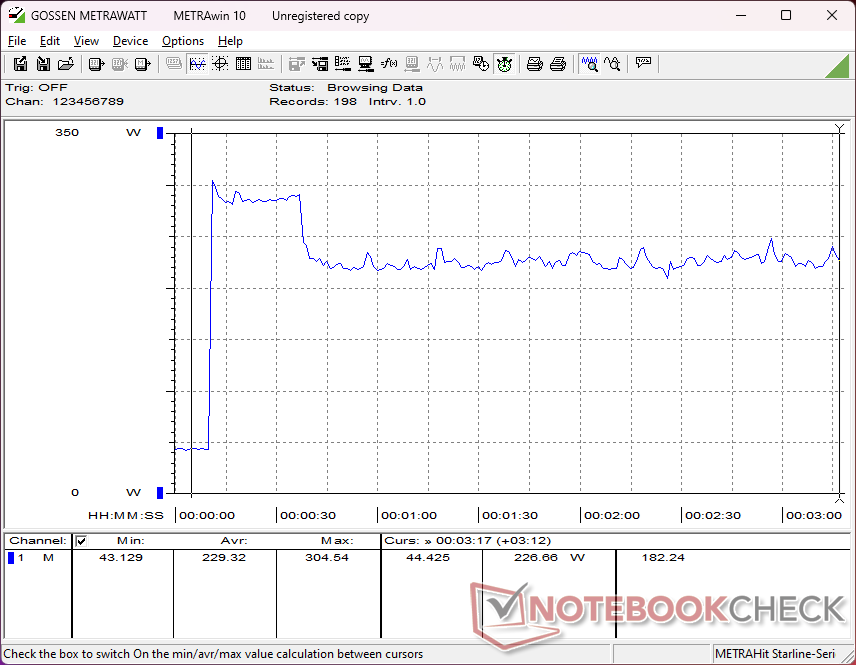
Het totale verbruik is erg hoog, zoals te verwachten van een 18-inch DTR met een veeleisend 4K mini-LED-paneel. Stationair draaien op de desktop verbruikt tussen 27 W en 48 W, afhankelijk van de helderheidsinstelling, GPU-instelling en de instelling van het energieprofiel. Gaming zou iets meer dan 300 W vergen, vergeleken met slechts 220 W op de Acer Predator Helios 18.
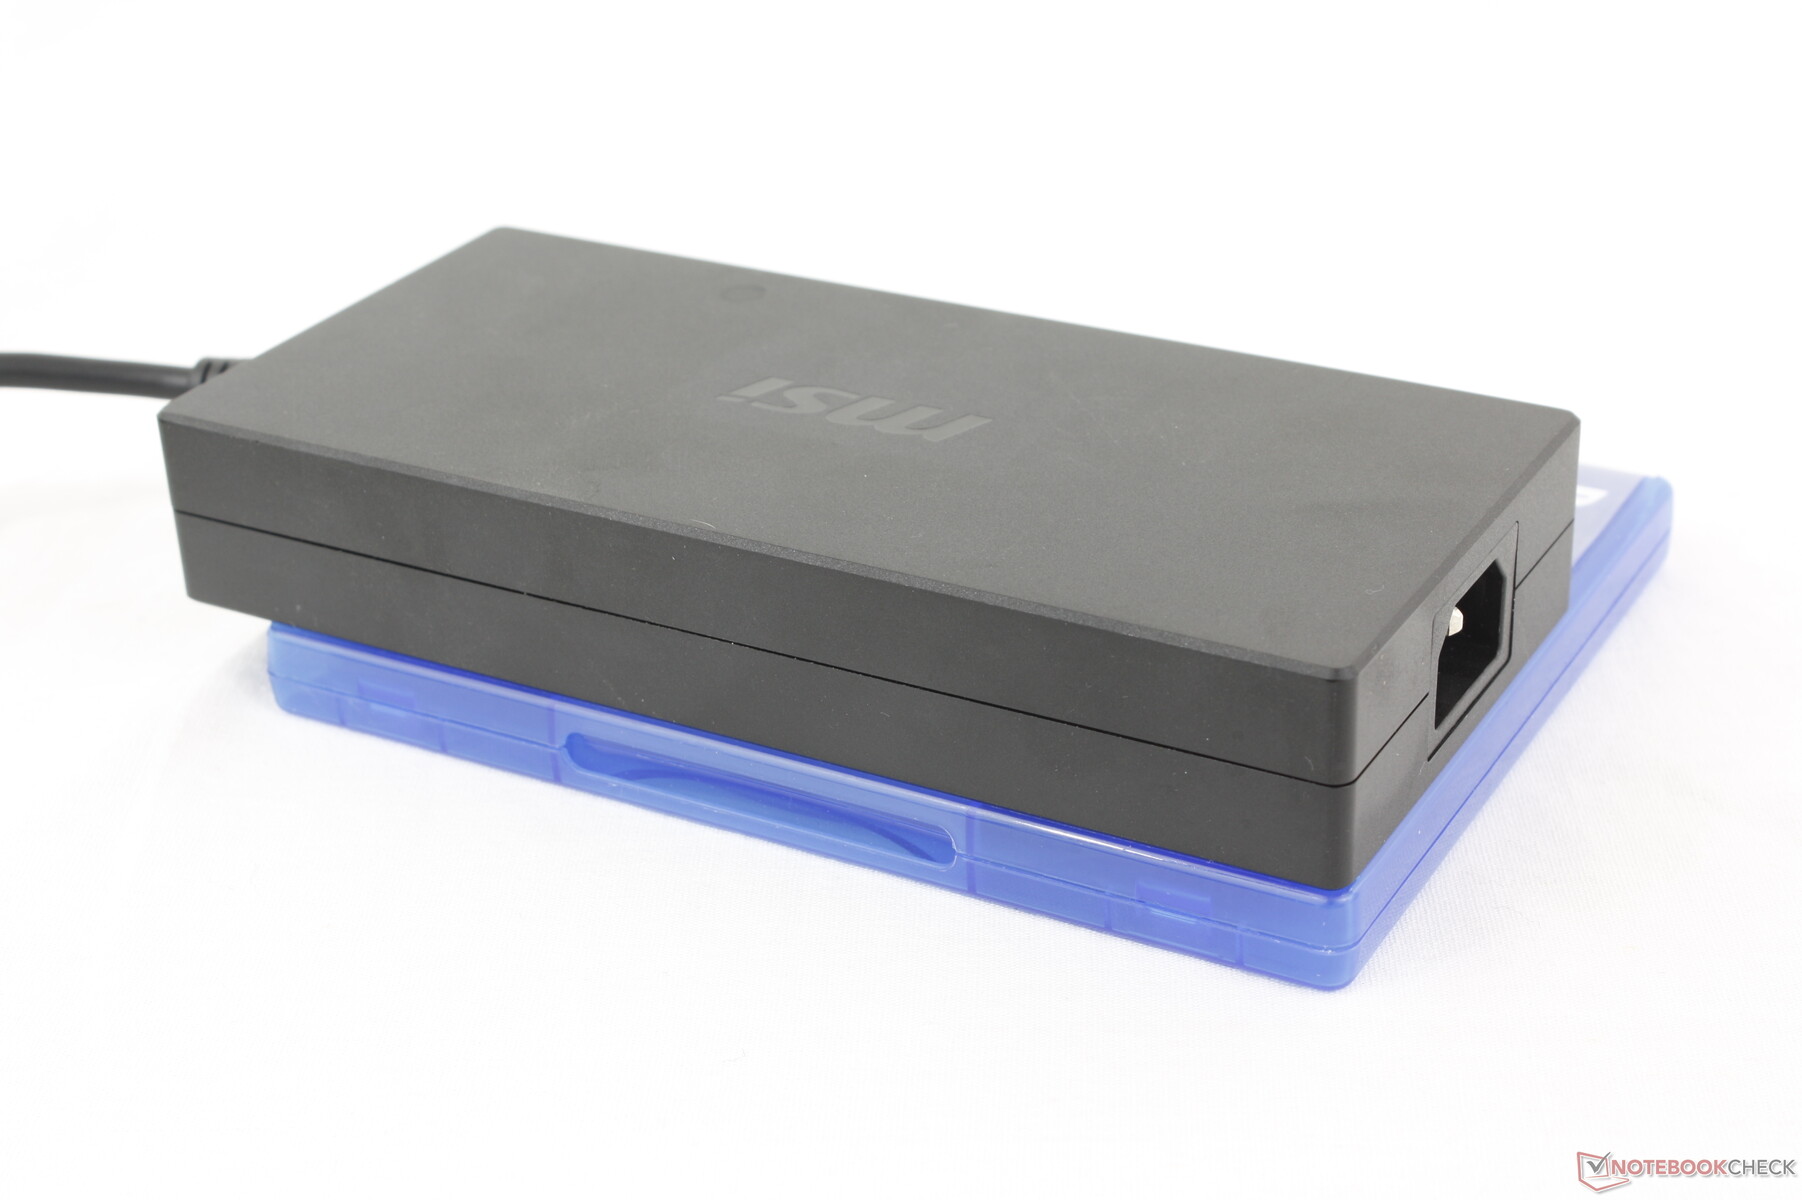
We hebben een verbruik tot 322 W geregistreerd met de grote 330 W netadapter. In vergelijking met de 400 W AC-adapter voor de Titan 18 HX, is de 330 W adapter iets kleiner (~18,4 x 8,4 x 3,1 cm vs. ~18,8 x 8,8 x 3,2 cm). Het verbruik bij het uitvoeren van CPU-intensieve taken is over het algemeen lager op de Raider 18 HX, ook al wordt deze geleverd met dezelfde CPU als de Titan 18 HX, wat overeenkomt met de iets langzamere CPU-prestaties zoals opgenomen in ons CineBench-gedeelte hierboven.
| Uit / Standby | |
| Inactief | |
| Belasting |
|
Key:
min: | |
| MSI Raider 18 HX A14V i9-14900HX, NVIDIA GeForce RTX 4080 Laptop GPU, Samsung PM9A1 MZVL22T0HBLB, Mini-LED, 3840x2400, 18" | Razer Blade 18 2024 RZ09-0509 i9-14900HX, NVIDIA GeForce RTX 4090 Laptop GPU, , Mini-LED, 2560x1600, 18" | Alienware m18 R2 i9-14900HX, NVIDIA GeForce RTX 4090 Laptop GPU, SK Hynix PC811 HFS002TEM9X152N, IPS, 2560x1600, 18" | MSI Titan 18 HX A14VIG i9-14900HX, NVIDIA GeForce RTX 4090 Laptop GPU, 2x Samsung PM9A1a MZVL22T0HDLB (RAID 0), Mini-LED, 3840x2400, 18" | Asus ROG Strix G18 G814JI i7-13650HX, NVIDIA GeForce RTX 4070 Laptop GPU, Micron 2400 MTFDKBA1T0QFM, IPS, 2560x1600, 18" | Acer Predator Helios 18 PH18-72-98MW i9-14900HX, NVIDIA GeForce RTX 4090 Laptop GPU, 2x SK Hynix HFS001TEJ9X115N (RAID 0), Mini-LED, 2560x1600, 18" | |
|---|---|---|---|---|---|---|
| Power Consumption | -2% | 8% | 5% | 42% | -2% | |
| Idle Minimum * | 27.7 | 25.4 8% | 10.6 62% | 13.2 52% | 8 71% | 31 -12% |
| Idle Average * | 38.3 | 37.7 2% | 20.9 45% | 25.4 34% | 15 61% | 35 9% |
| Idle Maximum * | 47.1 | 57.9 -23% | 40 15% | 53.5 -14% | 26 45% | 43 9% |
| Load Average * | 121.2 | 128.4 -6% | 201.1 -66% | 151.4 -25% | 102 16% | 144 -19% |
| Cyberpunk 2077 ultra * | 313 | |||||
| Cyberpunk 2077 ultra external monitor * | 306 | |||||
| Load Maximum * | 321.8 | 297.9 7% | 378.9 -18% | 395.2 -23% | 267 17% | 318 1% |
| Witcher 3 ultra * | 273.1 | 358 | 336 | 178.6 | 228 |
* ... kleiner is beter
Power Consumption Cyberpunk / Stress Test
Power Consumption external Monitor
Levensduur batterij
De looptijden zijn kort door de veeleisende hardware. We zijn in staat om iets meer dan 3 uur echt WLAN-gebruik op te nemen, zelfs wanneer deze is ingesteld op de Battery Saver-modus en iGPU-modus, terwijl de ROG Strix G18 het meer dan twee keer zo lang uithoudt met zijn IPS-scherm. De batterijcapaciteit zit al op het wettelijke maximum van 99,9 Wh.
Opladen van leeg naar vol duurt bijna 2,5 uur, wat iets langer is dan bij de meeste andere laptops. Opladen met USB-C AC-adapters van derden zal nog langzamer gaan.
| MSI Raider 18 HX A14V i9-14900HX, NVIDIA GeForce RTX 4080 Laptop GPU, 99.9 Wh | Razer Blade 18 2024 RZ09-0509 i9-14900HX, NVIDIA GeForce RTX 4090 Laptop GPU, 91.7 Wh | Alienware m18 R2 i9-14900HX, NVIDIA GeForce RTX 4090 Laptop GPU, 97 Wh | MSI Titan 18 HX A14VIG i9-14900HX, NVIDIA GeForce RTX 4090 Laptop GPU, 99.9 Wh | Asus ROG Strix G18 G814JI i7-13650HX, NVIDIA GeForce RTX 4070 Laptop GPU, 90 Wh | Acer Predator Helios 18 PH18-72-98MW i9-14900HX, NVIDIA GeForce RTX 4090 Laptop GPU, 90 Wh | |
|---|---|---|---|---|---|---|
| Batterijduur | 20% | 46% | 19% | 101% | -10% | |
| Reader / Idle | 264 | 395 50% | 353 34% | 702 166% | ||
| WiFi v1.3 | 198 | 263 33% | 290 46% | 252 27% | 484 144% | 192 -3% |
| Load | 76 | 58 -24% | 72 -5% | 71 -7% | 64 -16% |
Pro
Contra
Verdict - Een Titan in hart en nieren
Toen we de Titan 18 HX eerder dit jaar, prezen we de prestaties, maar waren we geschokt toen we hoorden over de vraagprijs van >$5000 USD. Het feit dat de CPU en GPU in feite niets nieuws waren, maakte het model alleen maar minder aantrekkelijk. De Raider 18 HX pakt de exorbitant hoge prijs van de Titan 18 HX aan door het vet weg te snijden, terwijl dezelfde CPU, GPU en beeldschermopties behouden blijven. Raider-eigenaars verliezen het verlichte clickpad, de dampkamer koeling, de mechanische toetsen en de tertiaire M.2 SSD ondersteuning, maar zulke luxe eigenschappen zijn gemakkelijk te missen als de spelervaring tussen de Raider en Titan verder precies hetzelfde is. Men kan zelfs stellen dat de Raider comfortabeler in het gebruik is, omdat het traditionele clickpad en het toetsenbord met membranen meer vertrouwd aanvoelen dan de atypische aanpak van de Titan.
De Raider 18 HX perst elk grammetje prestatie uit de Core i9 CPU en 175 W GPU, zelfs als hij groter, zwaarder en vaak luider moet zijn dan veel van zijn concurrenten.
In vergelijking met andere 18-inch gaming laptops biedt de Raider 18 HX een ruimere type-ervaring en vier SODIMM-sleuven, terwijl alternatieven zoals de Blade 18 of ROG Strix G18 helemaal geen numpad hebben of slechts twee SODIMM-modules ondersteunen. Het MSI systeem is echter nog steeds merkbaar groter en zwaarder dan de meeste concurrenten en het draait niet per se stiller om dit goed te maken. De CPU- en GPU-prestaties zijn misschien iets sneller, maar veel gebruikers zullen dit in de praktijk niet merken. In dit geval zult u de eenvoudiger onderhoud en 4K mini-LED opties van de Raider moeten waarderen om zijn gewicht te rechtvaardigen.
Prijs en beschikbaarheid
De MSI Raider 18 HX zoals geconfigureerd in onze review is nu verkrijgbaar bij Amazon voor $3190. Als alternatief is de IPS-versie ook verkrijgbaar voor $3290.
Opmerking: We hebben ons beoordelingssysteem onlangs bijgewerkt en de resultaten van versie 8 zijn niet vergelijkbaar met de resultaten van versie 7. Meer informatie is beschikbaar hier .
MSI Raider 18 HX A14V
- 03-09-2024 v8
Allen Ngo
 Total Sustainability Score:
 Transparantie
De selectie van te beoordelen apparaten wordt gemaakt door onze redactie. Het testexemplaar werd ten behoeve van deze beoordeling door de fabrikant of detailhandelaar in bruikleen aan de auteur verstrekt. De kredietverstrekker had geen invloed op deze recensie, noch ontving de fabrikant vóór publicatie een exemplaar van deze recensie. Er bestond geen verplichting om deze recensie te publiceren. Wij accepteren nooit een compensatie of betaling in ruil voor onze beoordelingen. Als onafhankelijk mediabedrijf is Notebookcheck niet onderworpen aan het gezag van fabrikanten, detailhandelaren of uitgevers.
[transparency_disclaimer]Dit is hoe Notebookcheck test
Elk jaar beoordeelt Notebookcheck onafhankelijk honderden laptops en smartphones met behulp van gestandaardiseerde procedures om ervoor te zorgen dat alle resultaten vergelijkbaar zijn. We hebben onze testmethoden al zo'n 20 jaar voortdurend ontwikkeld en daarbij de industriestandaard bepaald. In onze testlaboratoria wordt gebruik gemaakt van hoogwaardige meetapparatuur door ervaren technici en redacteuren. Deze tests omvatten een validatieproces in meerdere fasen. Ons complexe beoordelingssysteem is gebaseerd op honderden goed onderbouwde metingen en benchmarks, waardoor de objectiviteit behouden blijft. Meer informatie over onze testmethoden kunt u hier vinden.
Price comparison

