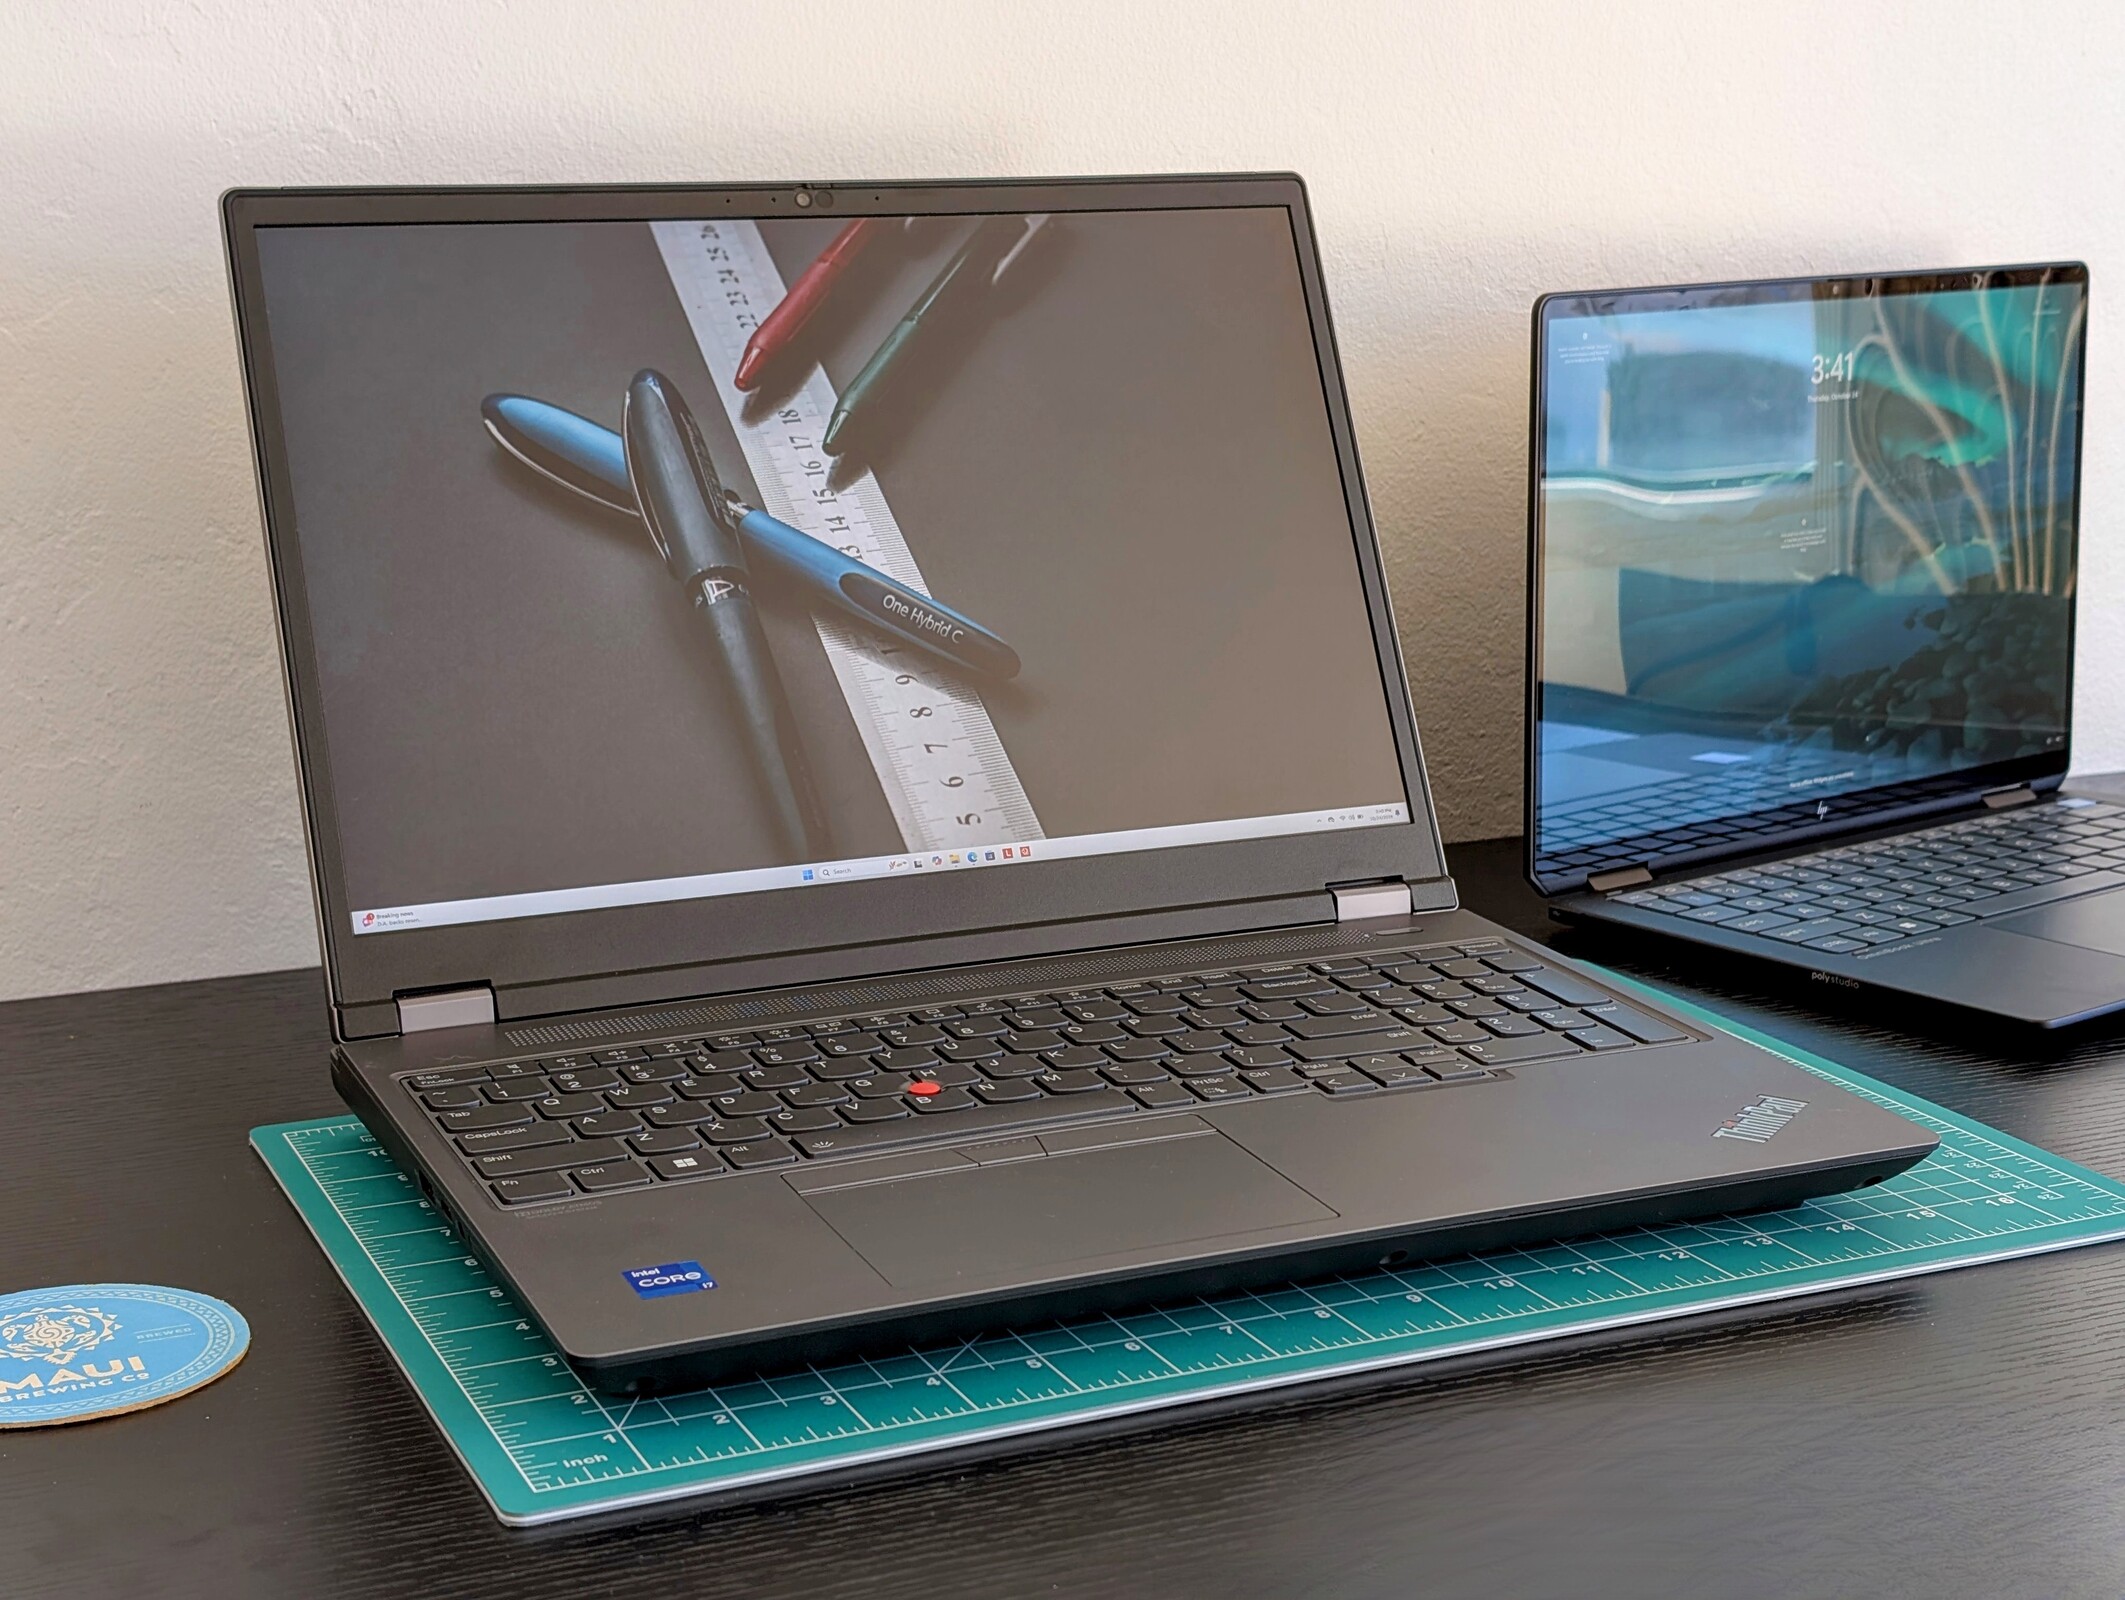
Lenovo ThinkPad P16 Gen 2 werkstation test: Zwaar met supercharged graphics
Nvidia RTX 4000 Ada debuteert met indrukwekkende cijfers.
De grafische optie van 130 W TGP maakt dit een van de snelste 16-inch werkstations in het portfolio van Lenovo. Aspecten als temperatuur en ventilatorgeluid zijn echter respectievelijk warmer en luidruchtiger dan gemiddeld, als gevolg van de veeleisende GPU.Allen Ngo (vertaald door DeepL / Ninh Duy) Gepubliceerd 🇺🇸 🇫🇷 ...
Verdict - Macht kost geld
De ThinkPad P16 Gen 2 geeft voorrang aan prestaties, zelfs als dit een groter, zwaarder, luider en warmer systeem betekent. Als u deze nadelen aankunt, zult u zien dat de 130 W RTX 4000 Ada een monster van een mobiel werkstation is.
De ThinkPad P16 Gen 2 kan veeleisende werklasten aan met zijn veeleisende 130 W TGP grafische processor, waarmee hij zich onderscheidt van de meeste andere 16-inch werkstations.
Het meest opvallende nadeel is misschien wel dat de GPU na een paar minuten belasting ongeveer 10 procent gas terugneemt, wat erop wijst dat de koeloplossing de volledige eisen van de GPU niet onbeperkt kan volhouden. De batterijduur is ook erg kort, hooguit een paar uur. Desondanks is de ThinkPad P16 Gen 2 nog steeds een van de snelste werkstations voor zijn 16-inch formaatklasse.
Pro
Contra
Prijs en beschikbaarheid
Lenovo levert de ThinkPad P16 Gen 2 nu rechtstreeks vanuit de online winkel vanaf $1850 of $3770 USD indien geconfigureerd met de RTX 4000. Een klein aantal SKU's is ook verkrijgbaar via Amazon.
Price comparison
Potentiële concurrenten in vergelijkings
Afbeelding | Model / recensie | Geizhals | Gewicht | Hoogte | Scherm |
|---|---|---|---|---|---|
1. 85.9%  | Lenovo ThinkPad P16 Gen 2 Intel Core i7-14700HX ⎘ NVIDIA RTX 4000 Ada Generation Laptop ⎘ 32 GB Geheugen, 1024 GB SSD | Listenpreis 3500 USD Geizhals Suche | 3.1 kg | 30.23 mm | 16.00" 2560x1600 189 PPI IPS |
2. 90.2% v7 (old)  | Lenovo ThinkPad P16 G2 21FA000FGE Intel Core i7-13700HX ⎘ NVIDIA RTX 2000 Ada Generation Laptop ⎘ 32 GB Geheugen, 1024 GB SSD | 3 kg | 30.23 mm | 16.00" 2560x1600 189 PPI IPS LED | |
3. 88.6% v7 (old)  | Lenovo ThinkPad P16s G2 21K9000CGE AMD Ryzen 7 PRO 7840U ⎘ AMD Radeon 780M ⎘ 32 GB Geheugen, 1024 GB SSD | 1.8 kg | 24.4 mm | 16.00" 3840x2400 283 PPI OLED | |
4. 91% v7 (old)  | Lenovo ThinkPad P16 G1 RTX A5500 Intel Core i9-12950HX ⎘ NVIDIA RTX A5500 Laptop GPU ⎘ 64 GB Geheugen, 2048 GB SSD | Listenpreis 9000 USD | 3 kg | 30.23 mm | 16.00" 3840x2400 283 PPI IPS |
5. 85.4%  | HP ZBook Power 16 G11 A AMD Ryzen 7 8845HS ⎘ NVIDIA RTX 2000 Ada Generation Laptop ⎘ 64 GB Geheugen, 2048 GB SSD | 2.2 kg | 22.9 mm | 16.00" 2560x1600 189 PPI IPS | |
6. 88.3% v7 (old)  | Dell Precision 5690 Intel Core Ultra 9 185H ⎘ NVIDIA RTX 5000 Ada Generation Laptop ⎘ 32 GB Geheugen, 2048 GB SSD | 2.3 kg | 22.17 mm | 16.00" 3840x2400 283 PPI OLED |
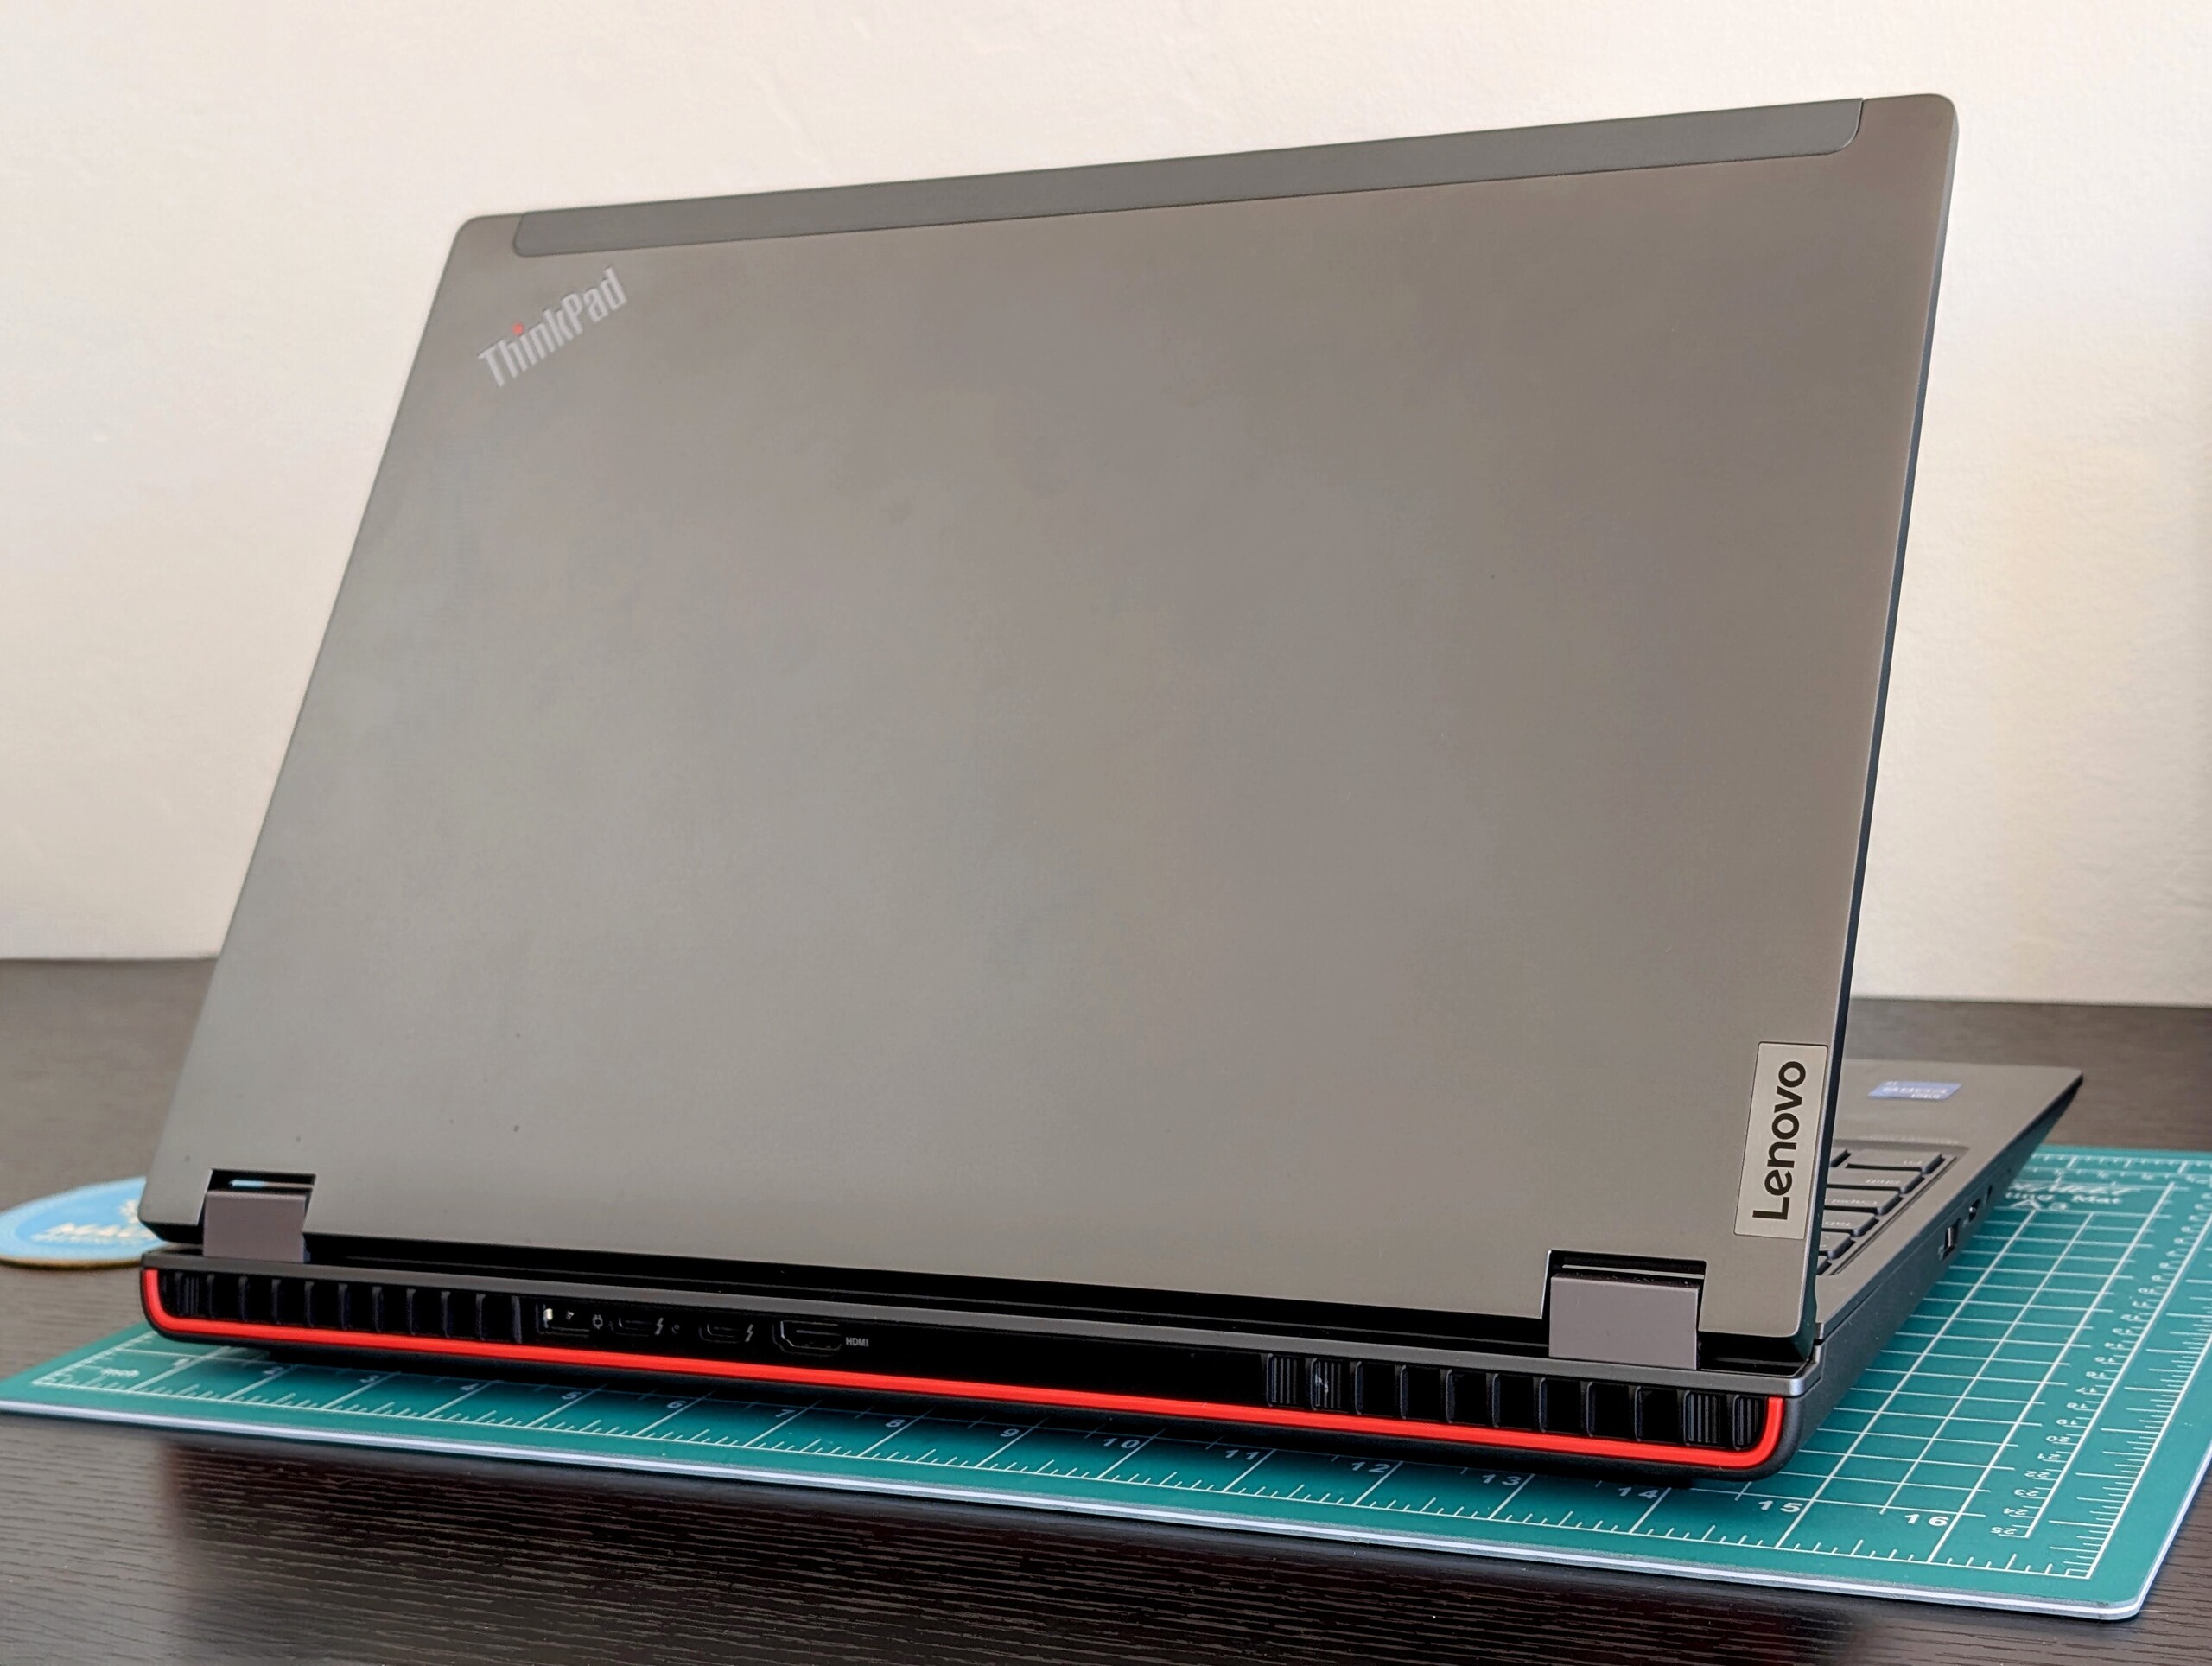
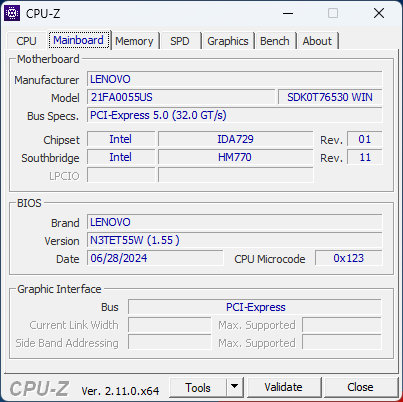
Lenovo werkt zijn hoogwaardige ThinkPad P16 Gen 2-lijn bij met nieuwere Raptor Lake-HX Refresh CPU's voor Q4 2024, ter vervanging van de originele Raptor Lake-HX opties die eerder dit jaar zijn uitgebracht. Het ontwerp van het chassis blijft verder ongewijzigd en dus zijn al onze indrukken op de originele ThinkPad P16 Gen 2 beoordeling ook hier van toepassing, inclusief de poorten.
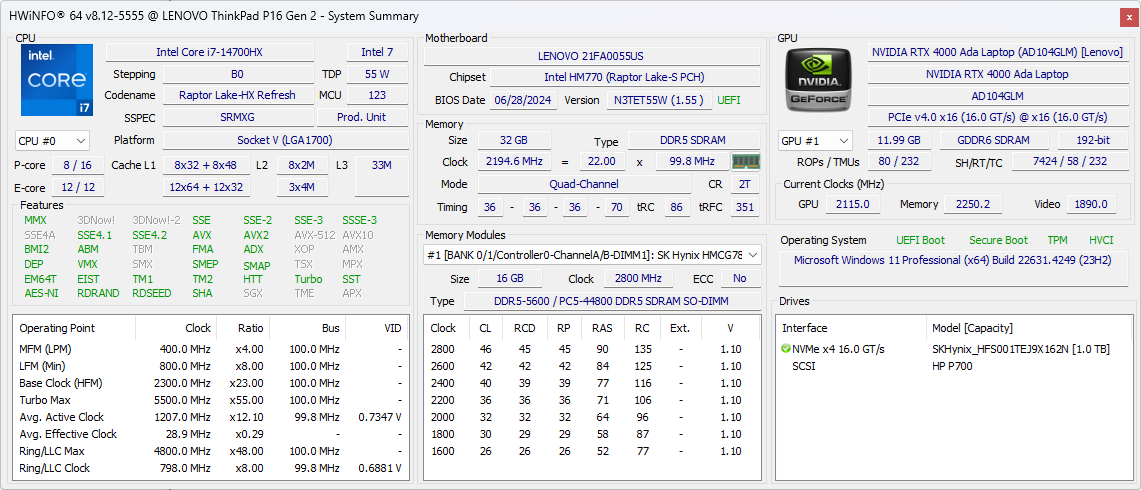
Onze testunit is uitgerust met de Core i7-14700HX CPU en 130 W Nvidia RTX 4000 Ada GPU, vergeleken met de Core i7-13700HX en 80 W RTX 2000 in onze eerste ThinkPad P16 Gen 2 review. De prestatieverhoging is aanzienlijk, zoals onze onderstaande gegevens zullen laten zien.
Concurrenten voor de ThinkPad P16 Gen 2 zijn andere krachtige 16-inch mobiele werkstations zoals de HP ZBook Power 16 G11 A of Dell Precision 5690.
Meer Lenovo beoordelingen:
Specificaties
Zaak
SD-kaartlezer
| SD Card Reader | |
| average JPG Copy Test (av. of 3 runs) | |
| HP ZBook Power 16 G11 A (Toshiba Exceria Pro SDXC 64 GB UHS-II) | |
| Lenovo ThinkPad P16 Gen 2 (Toshiba Exceria Pro SDXC 64 GB UHS-II) | |
| Lenovo ThinkPad P16 G1 RTX A5500 (Toshiba Exceria Pro SDXC 64 GB UHS-II) | |
| Lenovo ThinkPad P16 G2 21FA000FGE | |
| maximum AS SSD Seq Read Test (1GB) | |
| HP ZBook Power 16 G11 A (Toshiba Exceria Pro SDXC 64 GB UHS-II) | |
| Lenovo ThinkPad P16 Gen 2 (Toshiba Exceria Pro SDXC 64 GB UHS-II) | |
| Lenovo ThinkPad P16 G2 21FA000FGE | |
| Lenovo ThinkPad P16 G1 RTX A5500 (Toshiba Exceria Pro SDXC 64 GB UHS-II) | |
Communicatie
Webcam


Onderhoud
Duurzaamheid
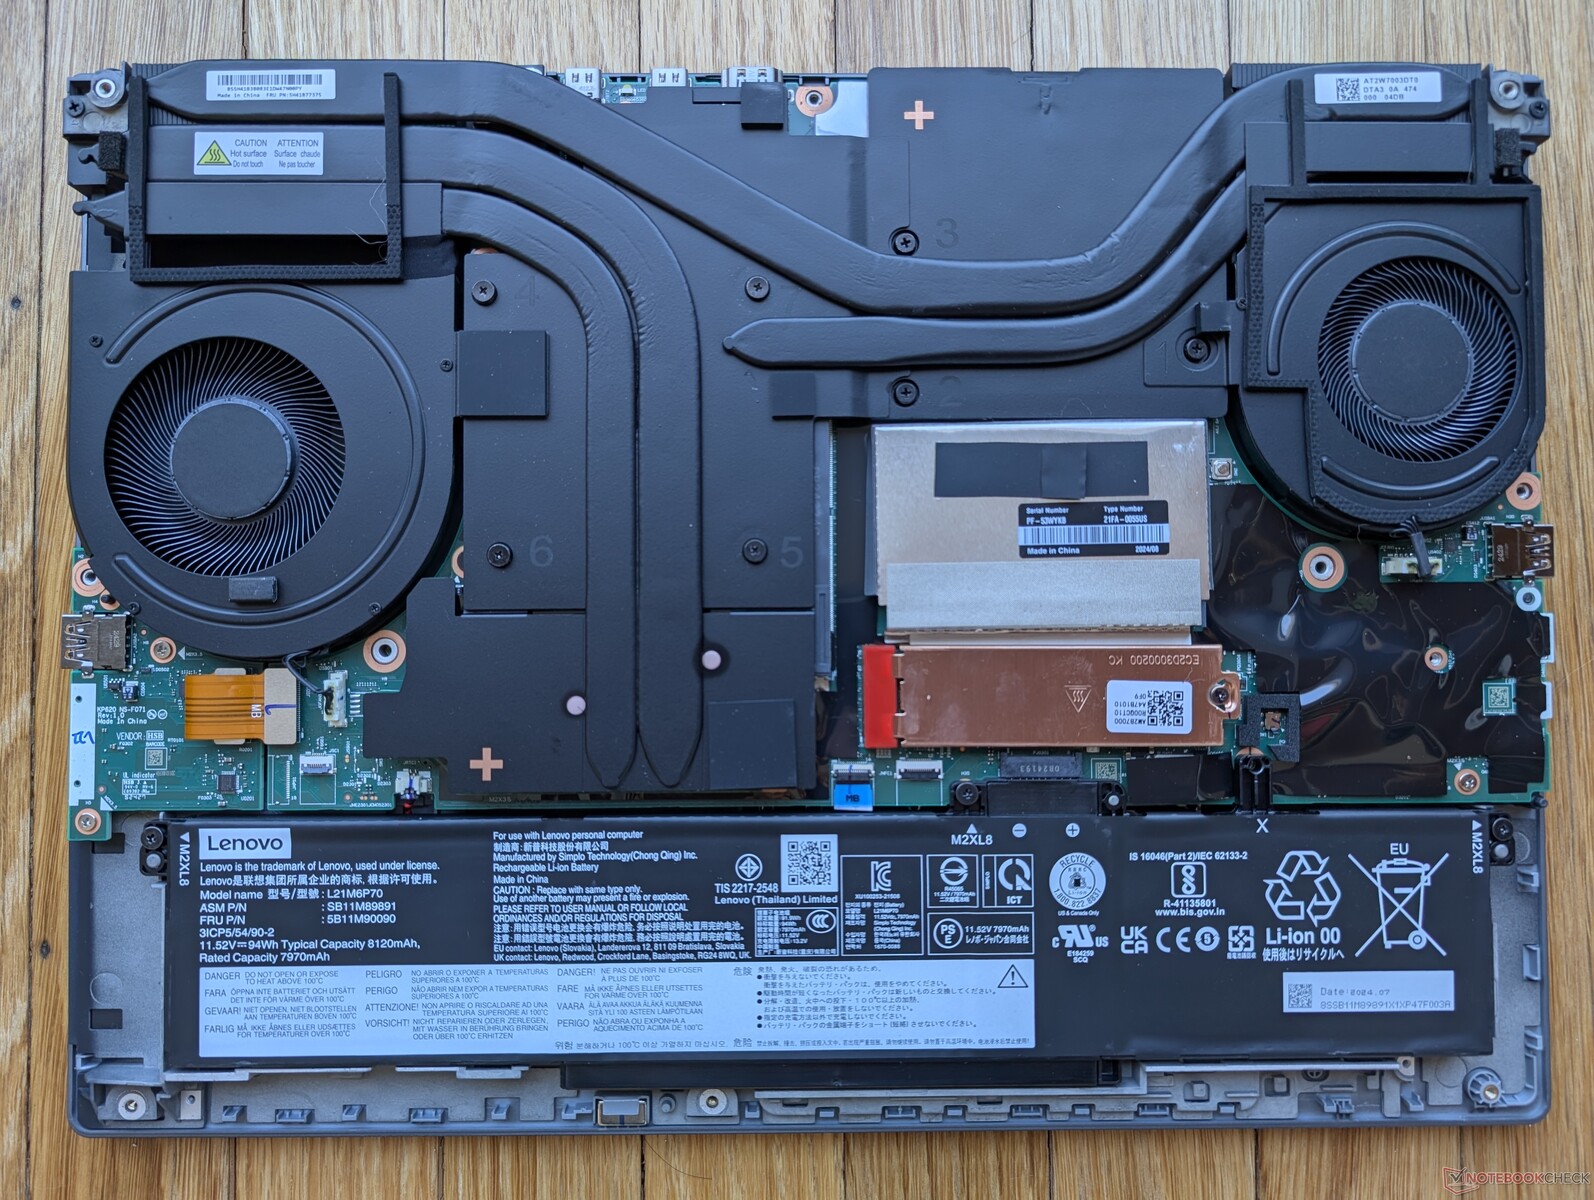
Lenovo gebruikt een aanzienlijke hoeveelheid gerecycled materiaal tijdens de productie, waaronder 50 procent gerecycled aluminium voor de buitenklep (A cover), 90 procent magnesium voor het toetsenbord (C cover), en >85 procent post-consumer content kunststoffen voor de toetskappen, batterij en luidsprekers.
De verpakking is plasticvrij en volledig recyclebaar.
Accessoires en garantie
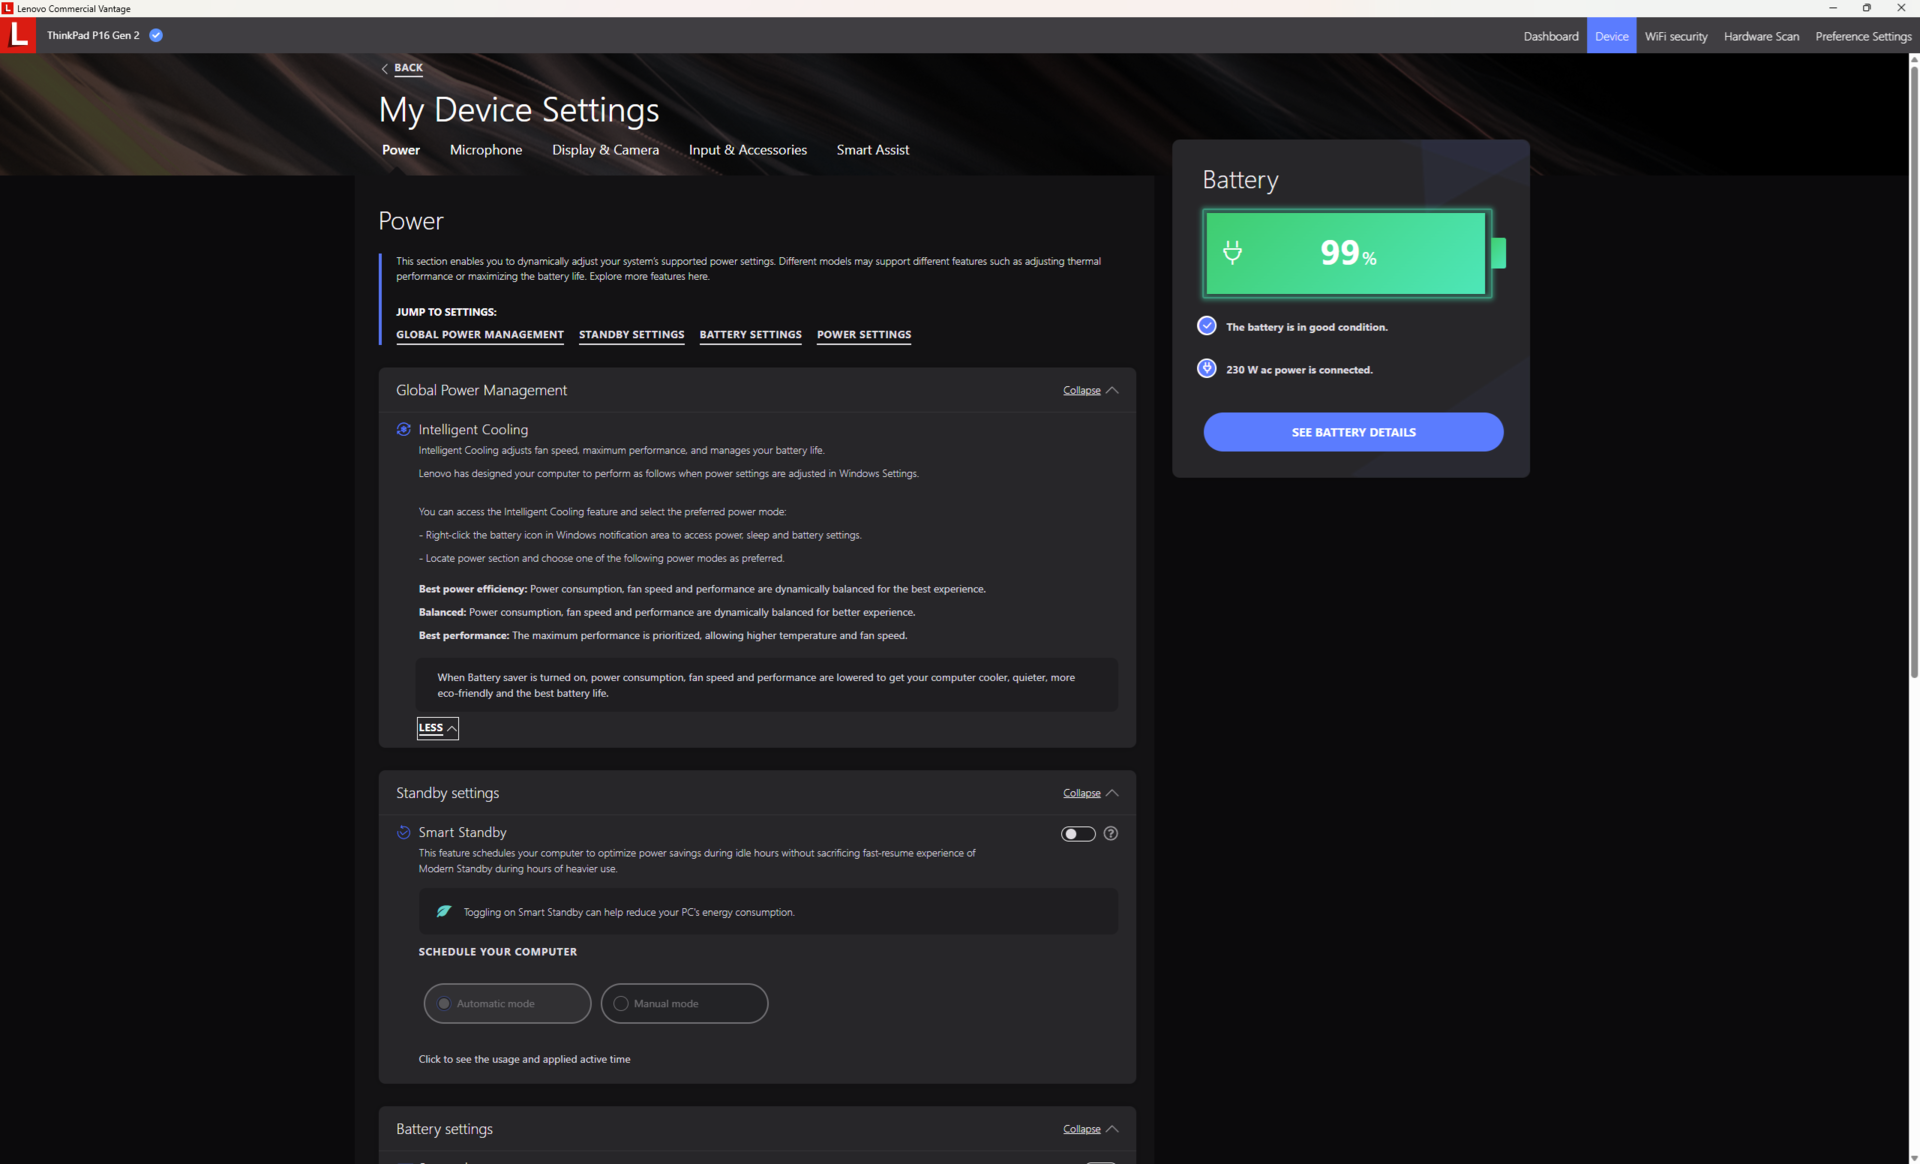
Er zitten geen extra's in de doos, behalve de AC-adapter en papierwerk. Er moet echter opgemerkt worden dat ons apparaat geleverd wordt met een grotere 230 W wisselstroomadapter in plaats van de 170 W adapter van onze eerste ThinkPad P16 Gen 2, vanwege onze veeleisendere RTX 4000 Ada GPU.
Standaard krijgt u drie jaar fabrieksgarantie.
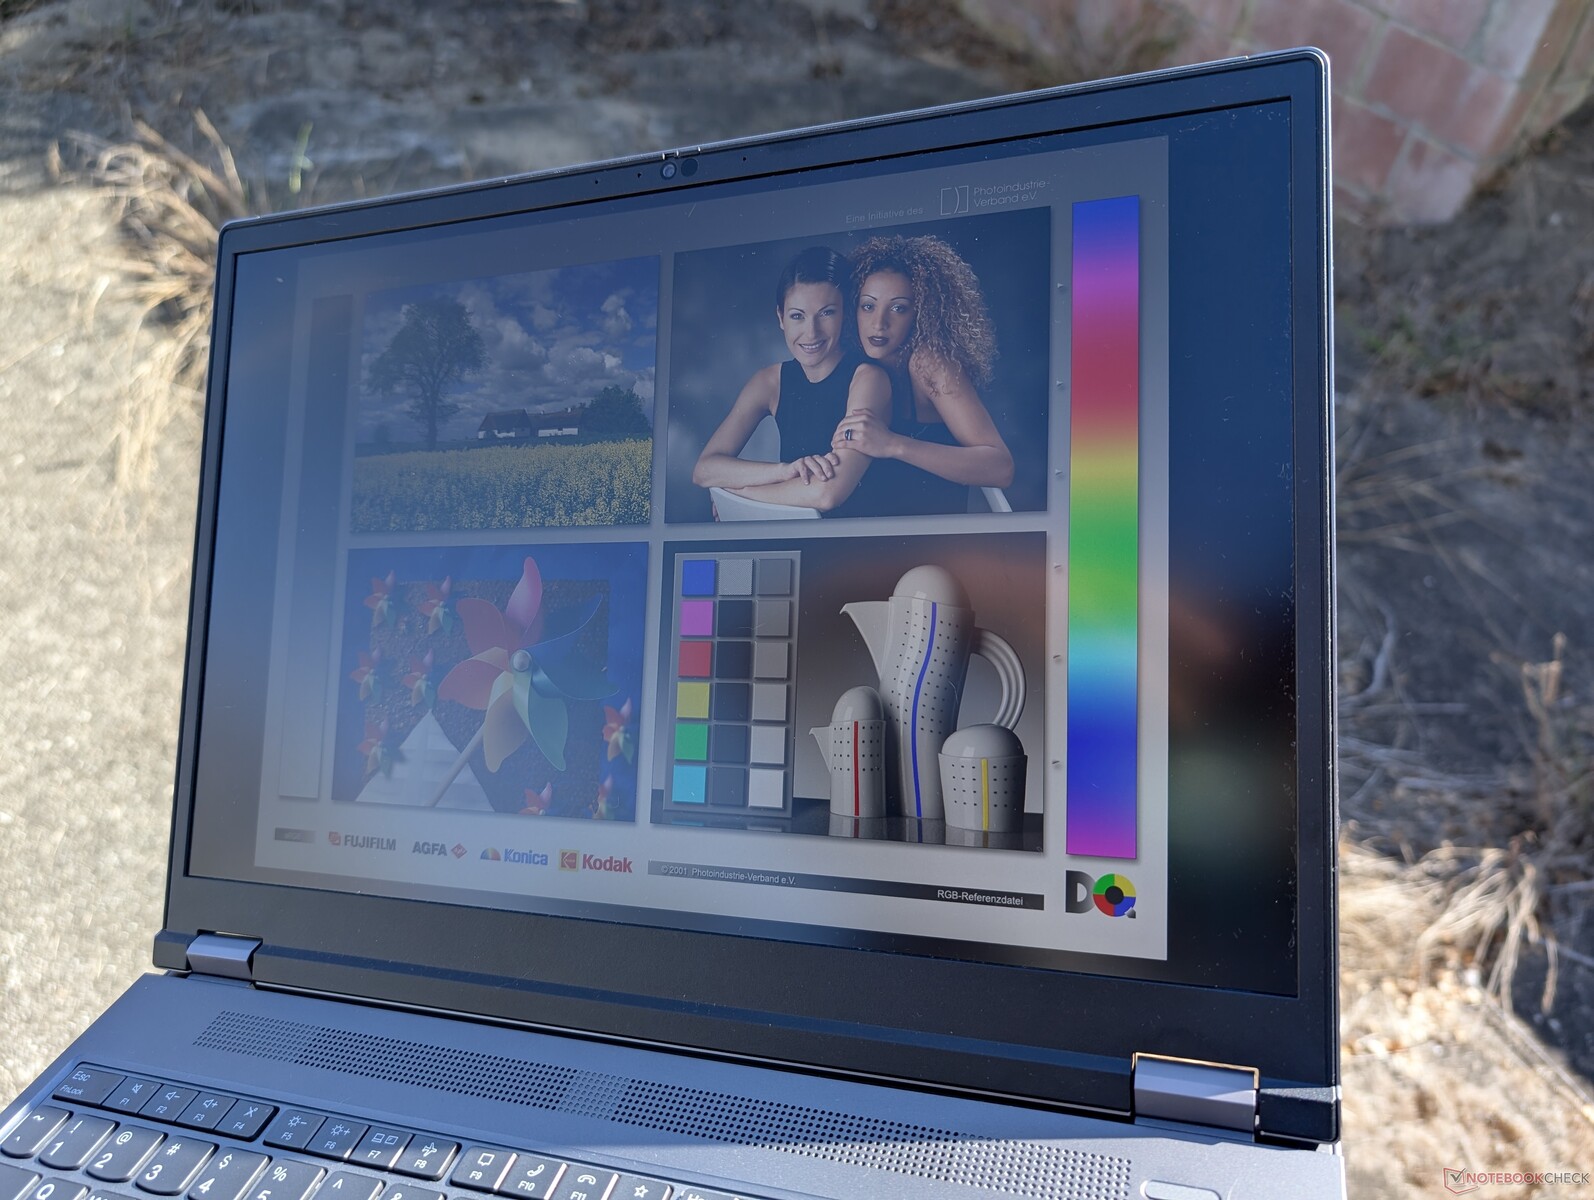
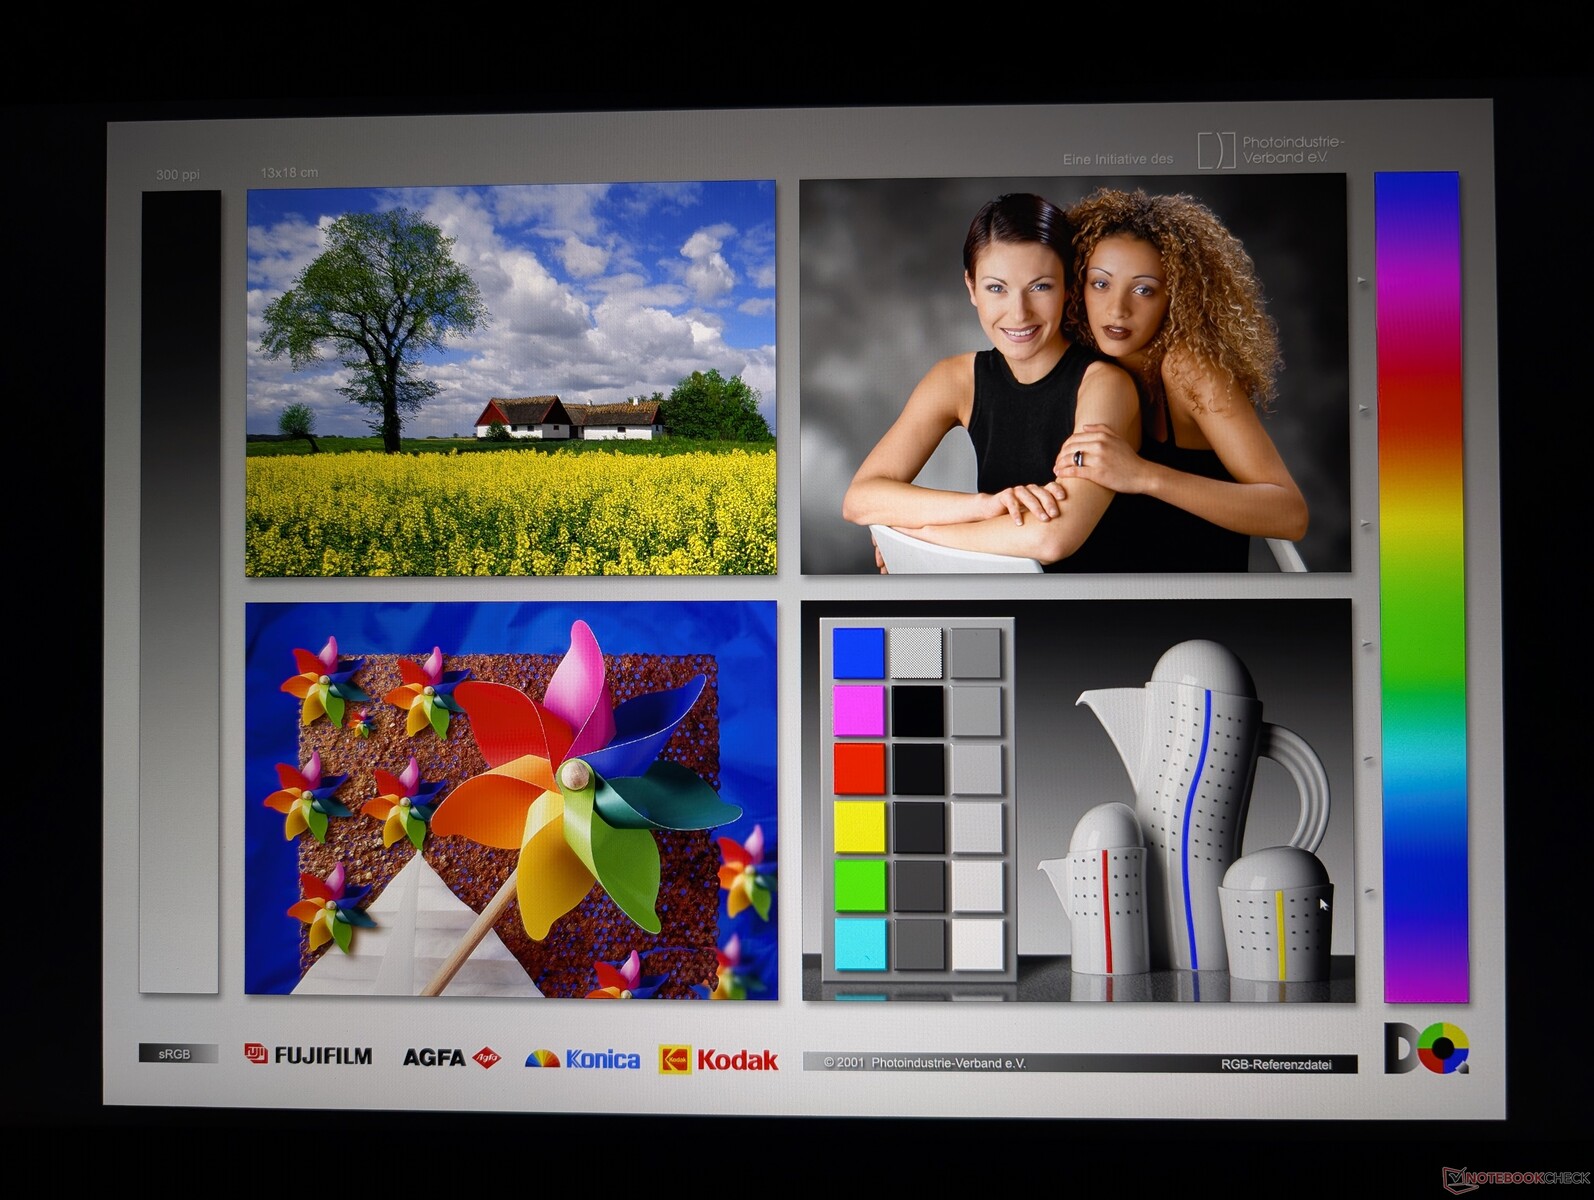
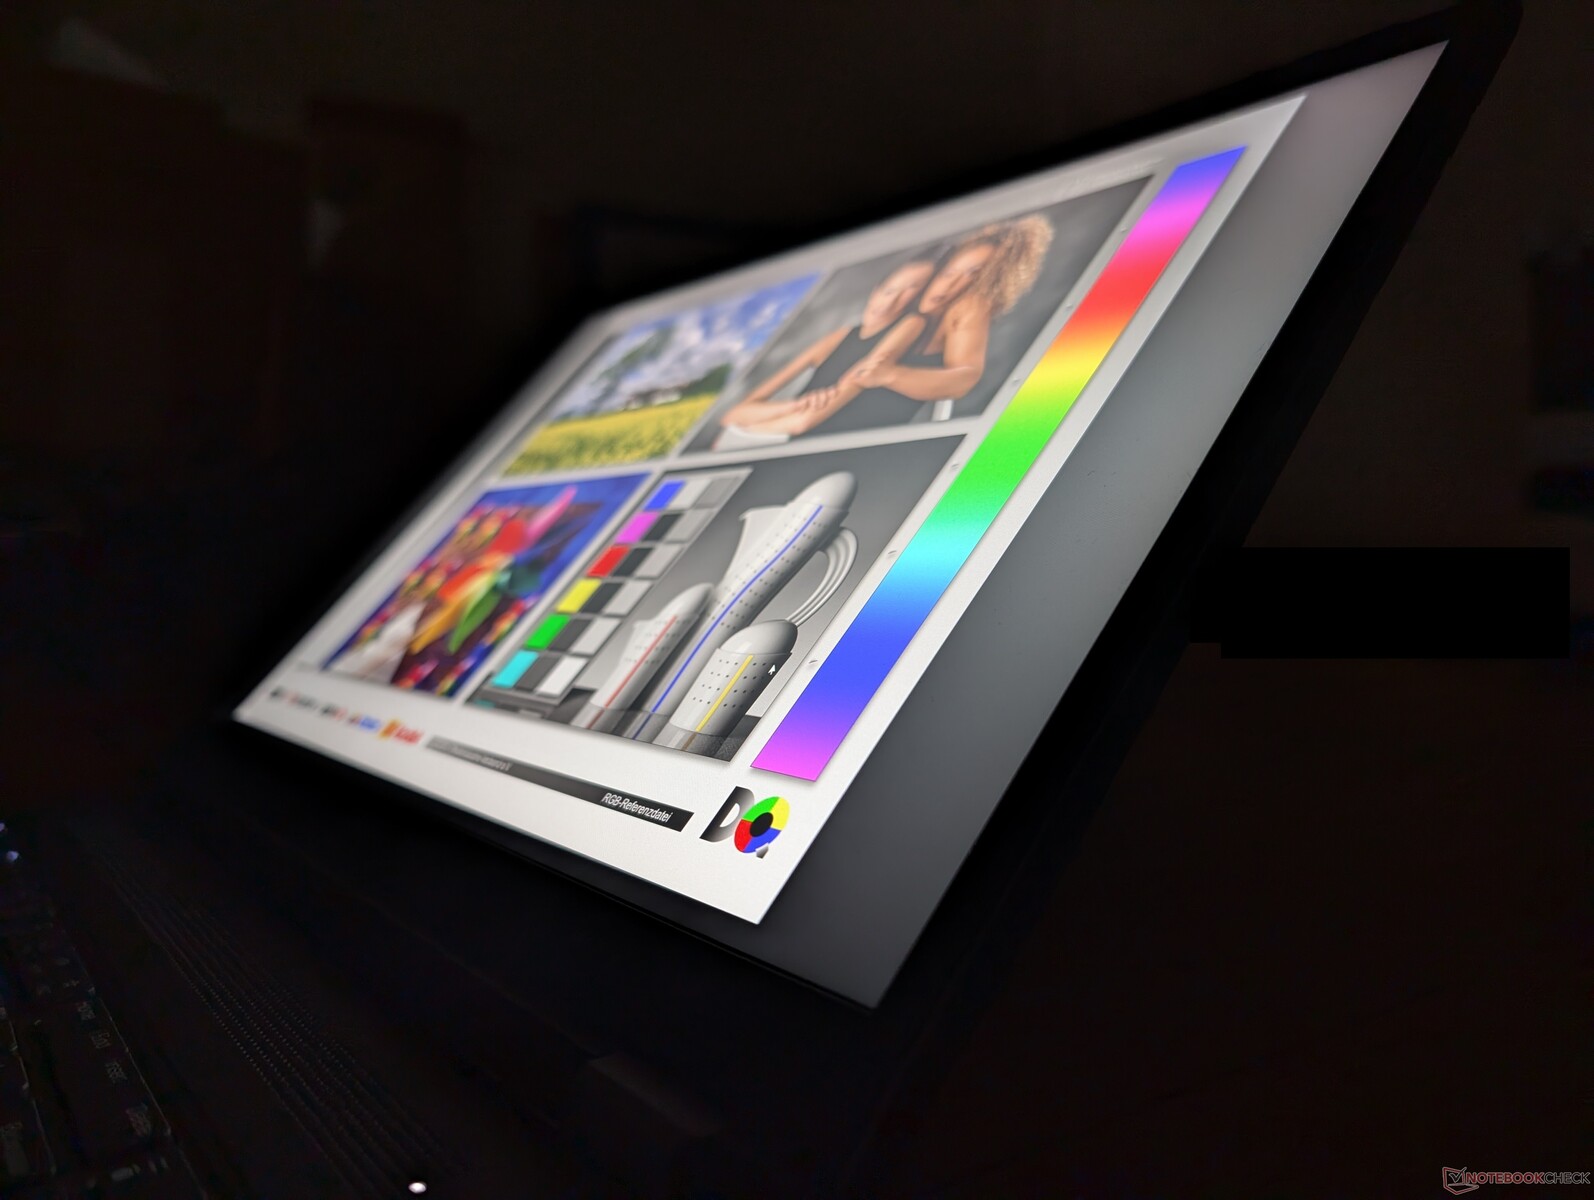
Weergave
Interessant is dat ons 1600p165 IPS-paneel van een andere fabrikant is dan het 1600p165 IPS-paneel op onze eerste ThinkPad P16 Gen 2 (NE160QDM-NY1 vs. MNG007DA1-9). De kerneigenschappen en helderheid zijn verder vrijwel identiek. Er zijn andere schermopties beschikbaar, waaronder 2400p OLED en 1200p IPS.


| |||||||||||||||||||||||||
Helderheidsverdeling: 89 %
Helderheid in Batterij-modus: 531.5 cd/m²
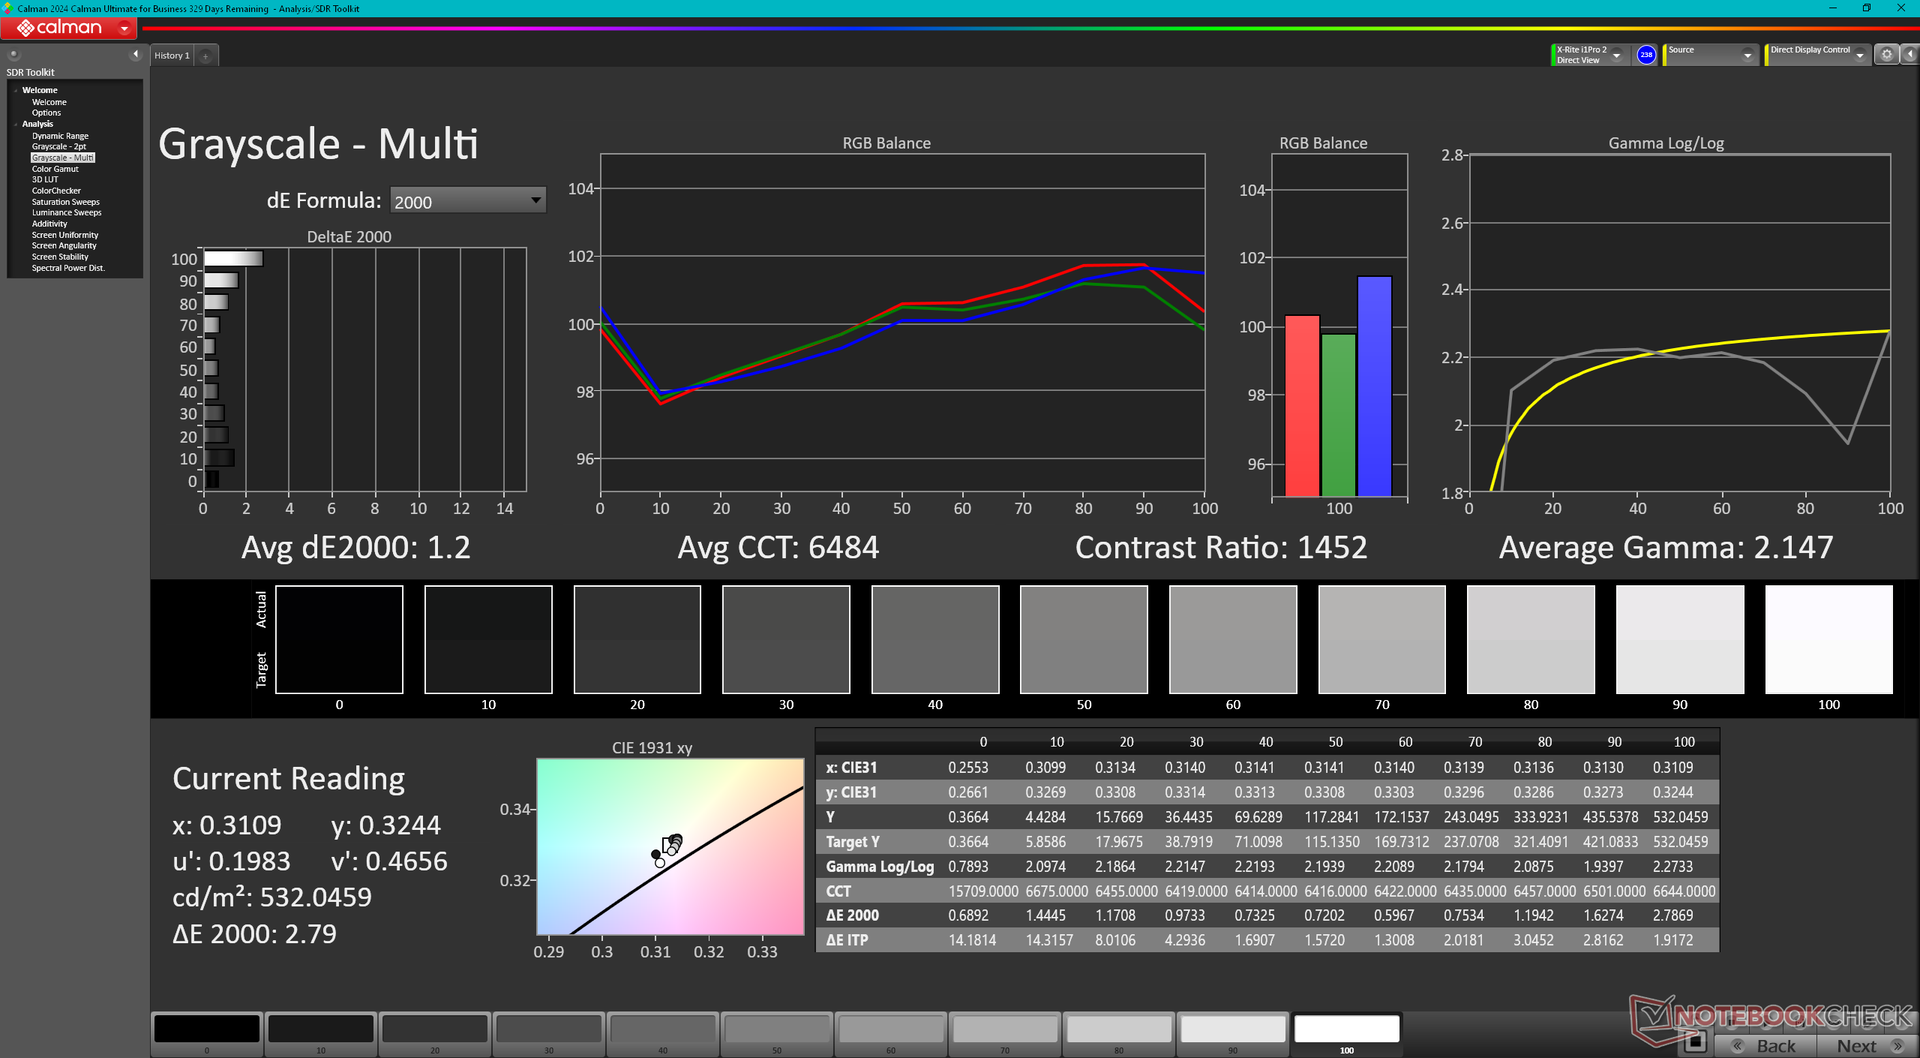
Contrast: 1399:1 (Zwart: 0.38 cd/m²)
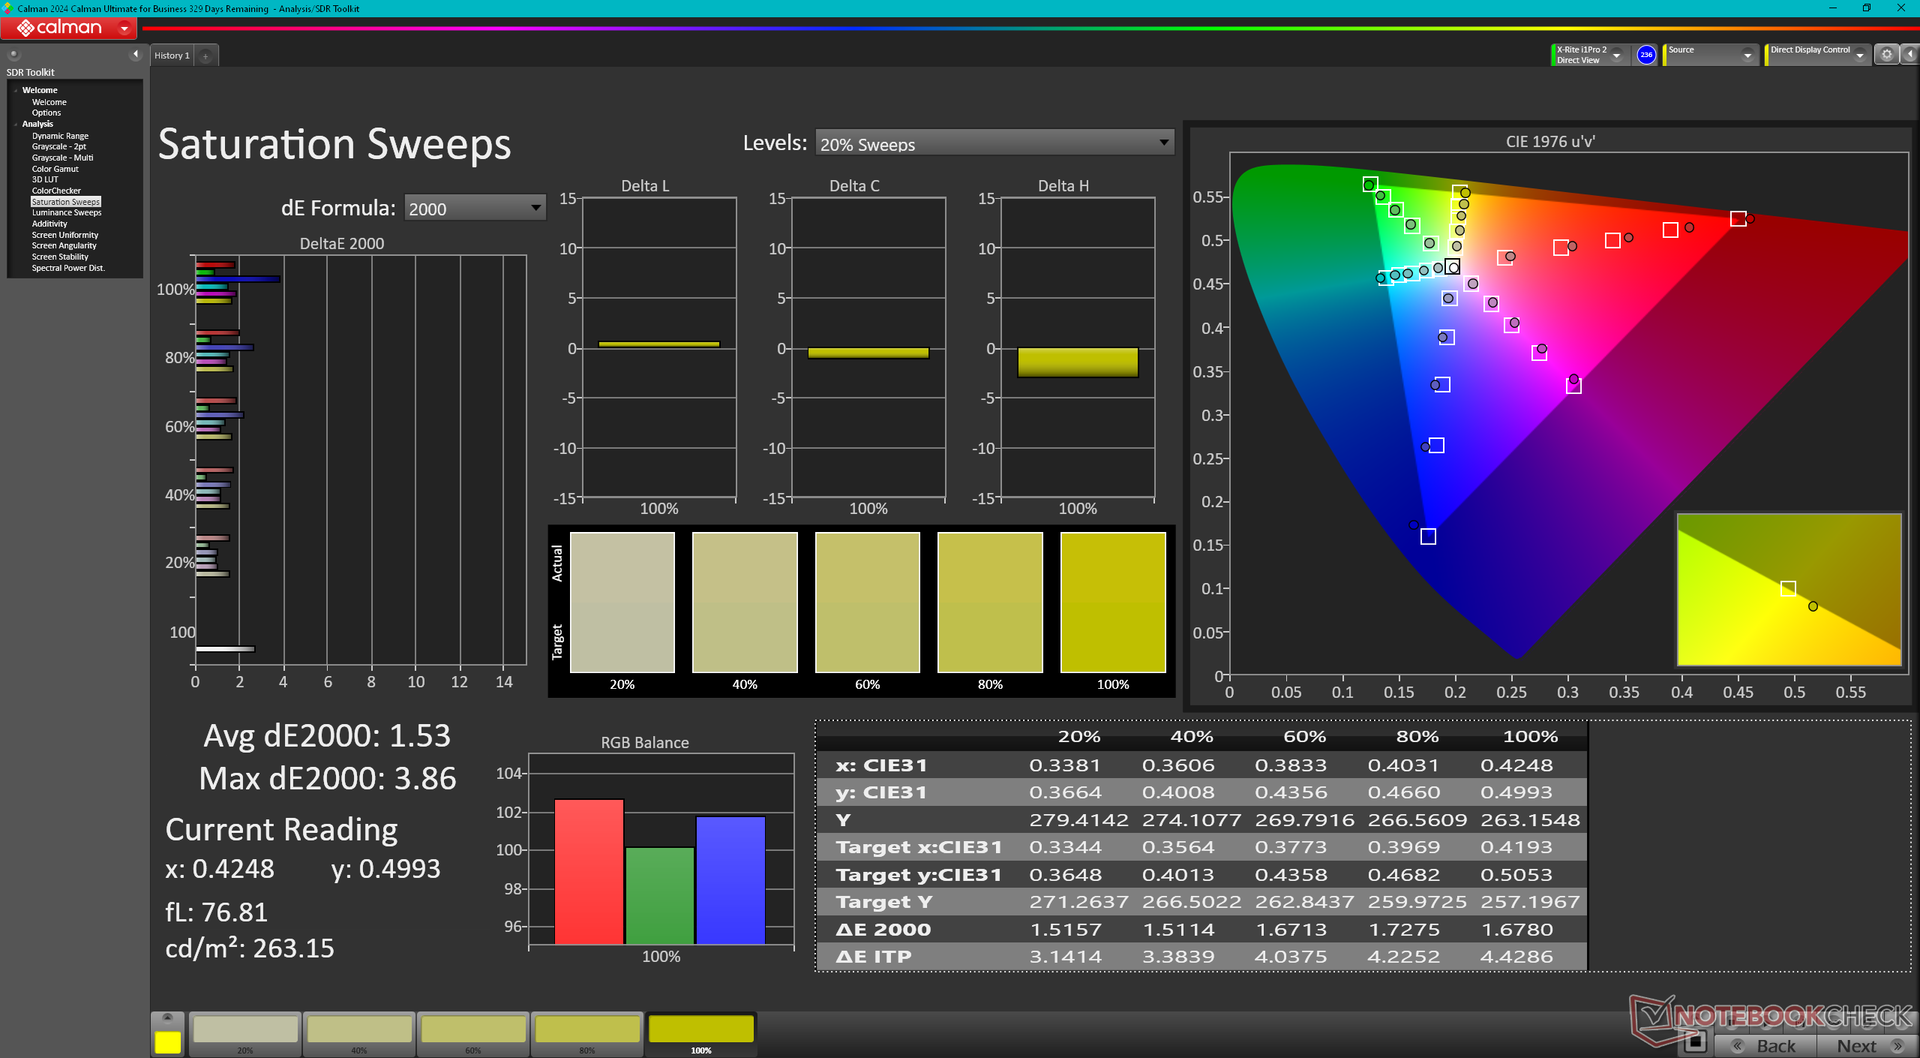
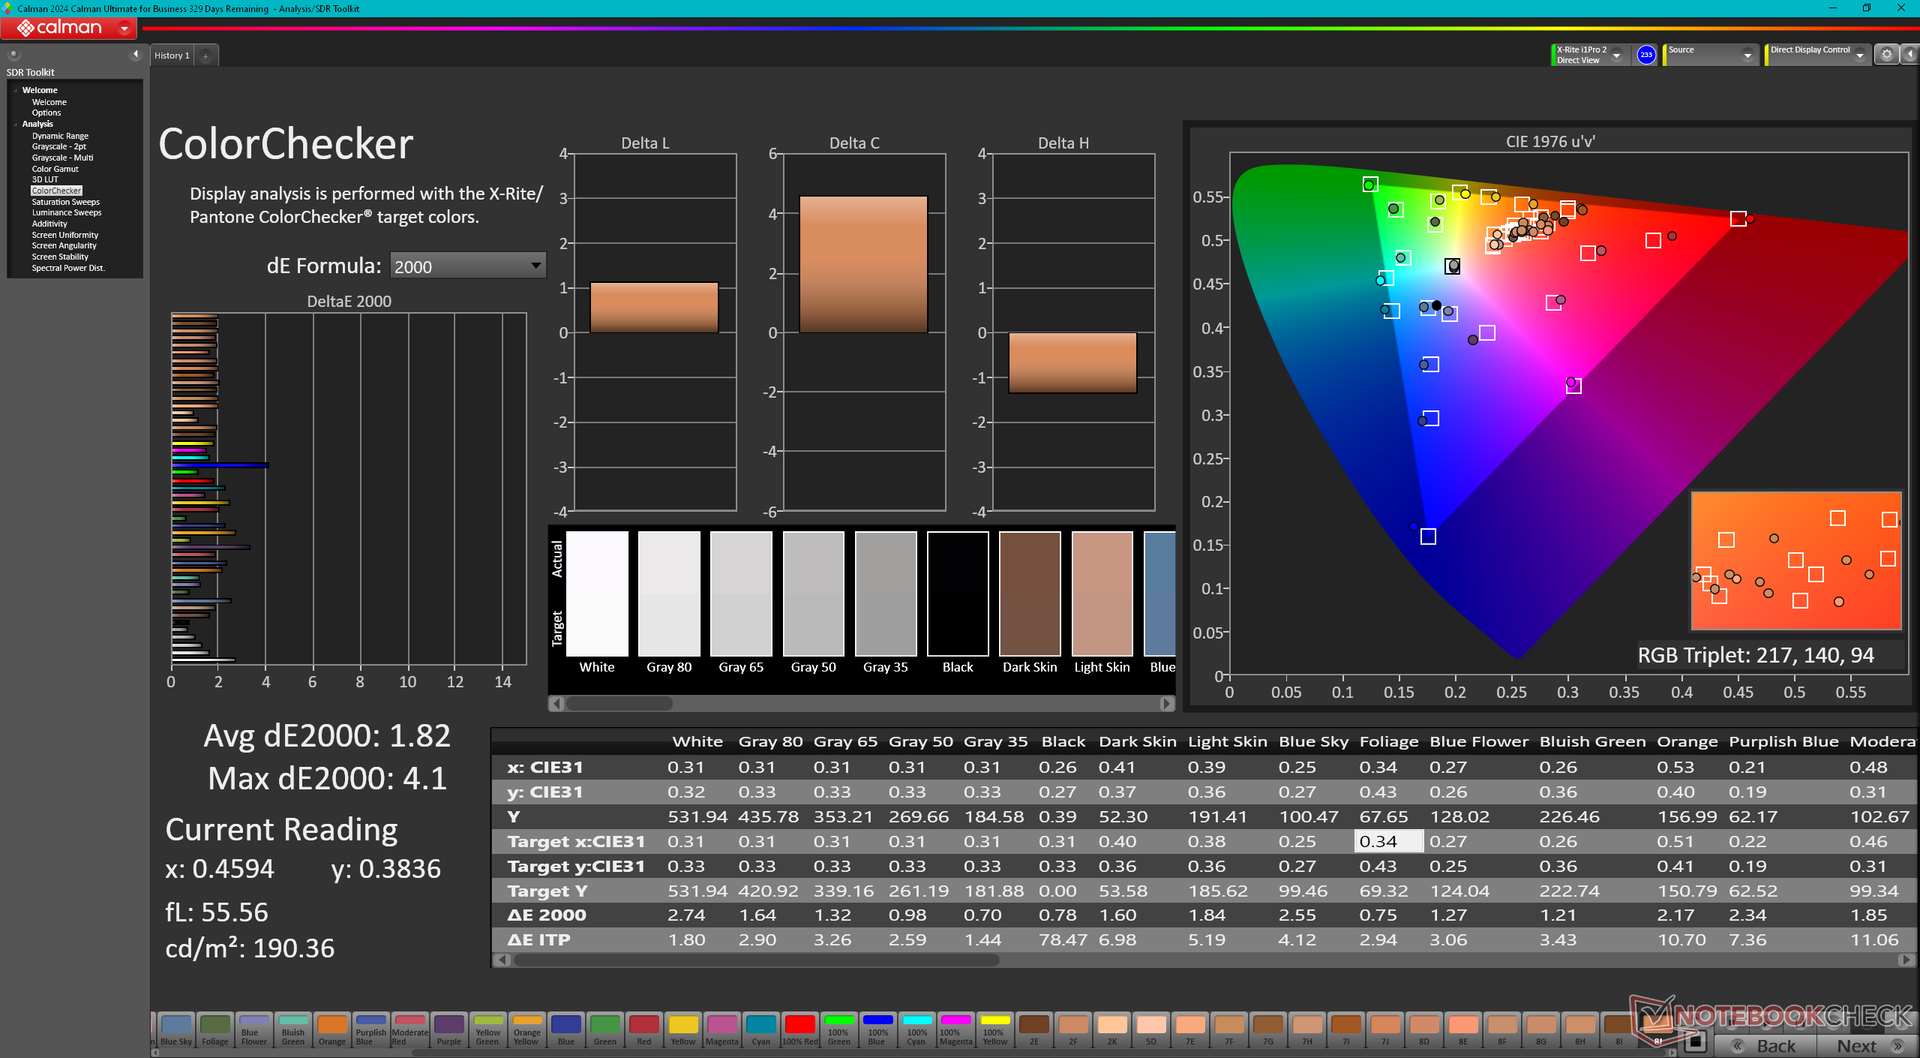
ΔE ColorChecker Calman: 1.82 | ∀{0.5-29.43 Ø4.72}
calibrated: 0.63
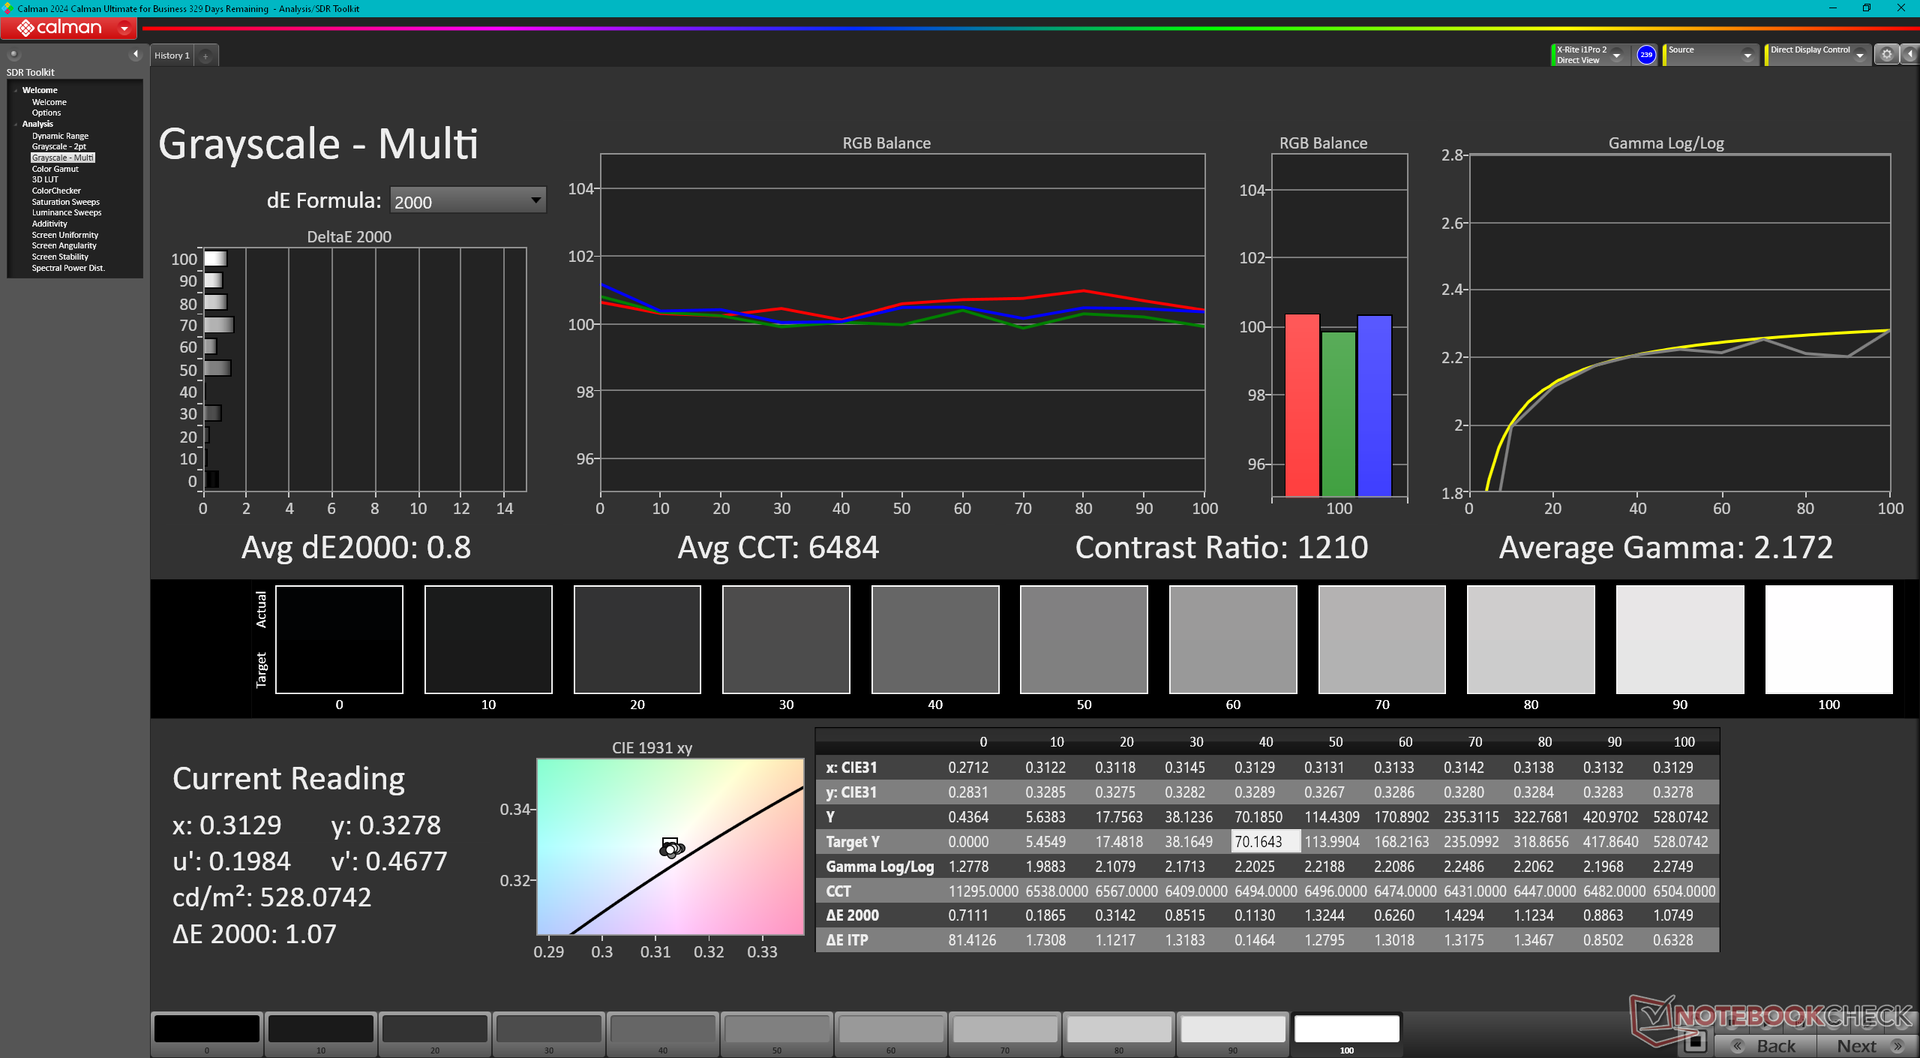
ΔE Greyscale Calman: 1.2 | ∀{0.09-98 Ø4.97}
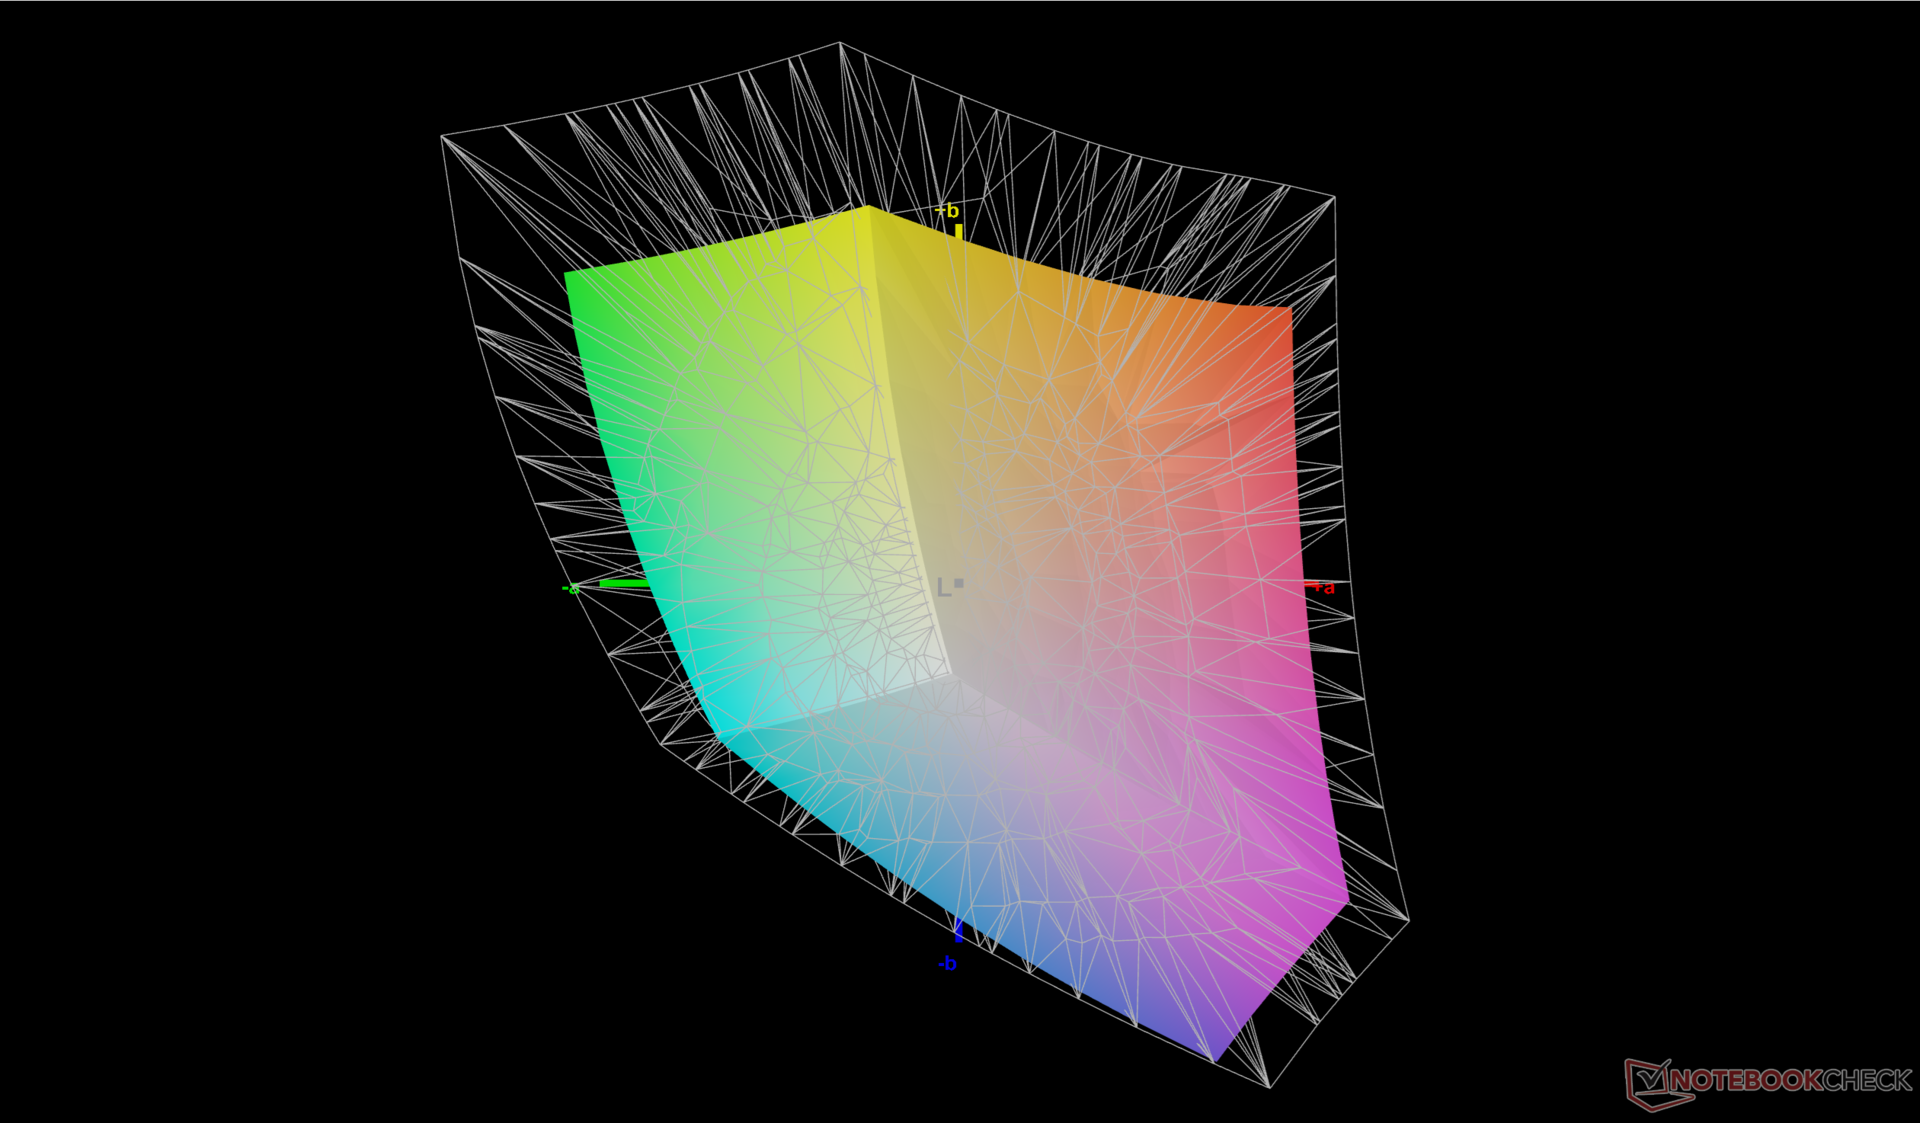
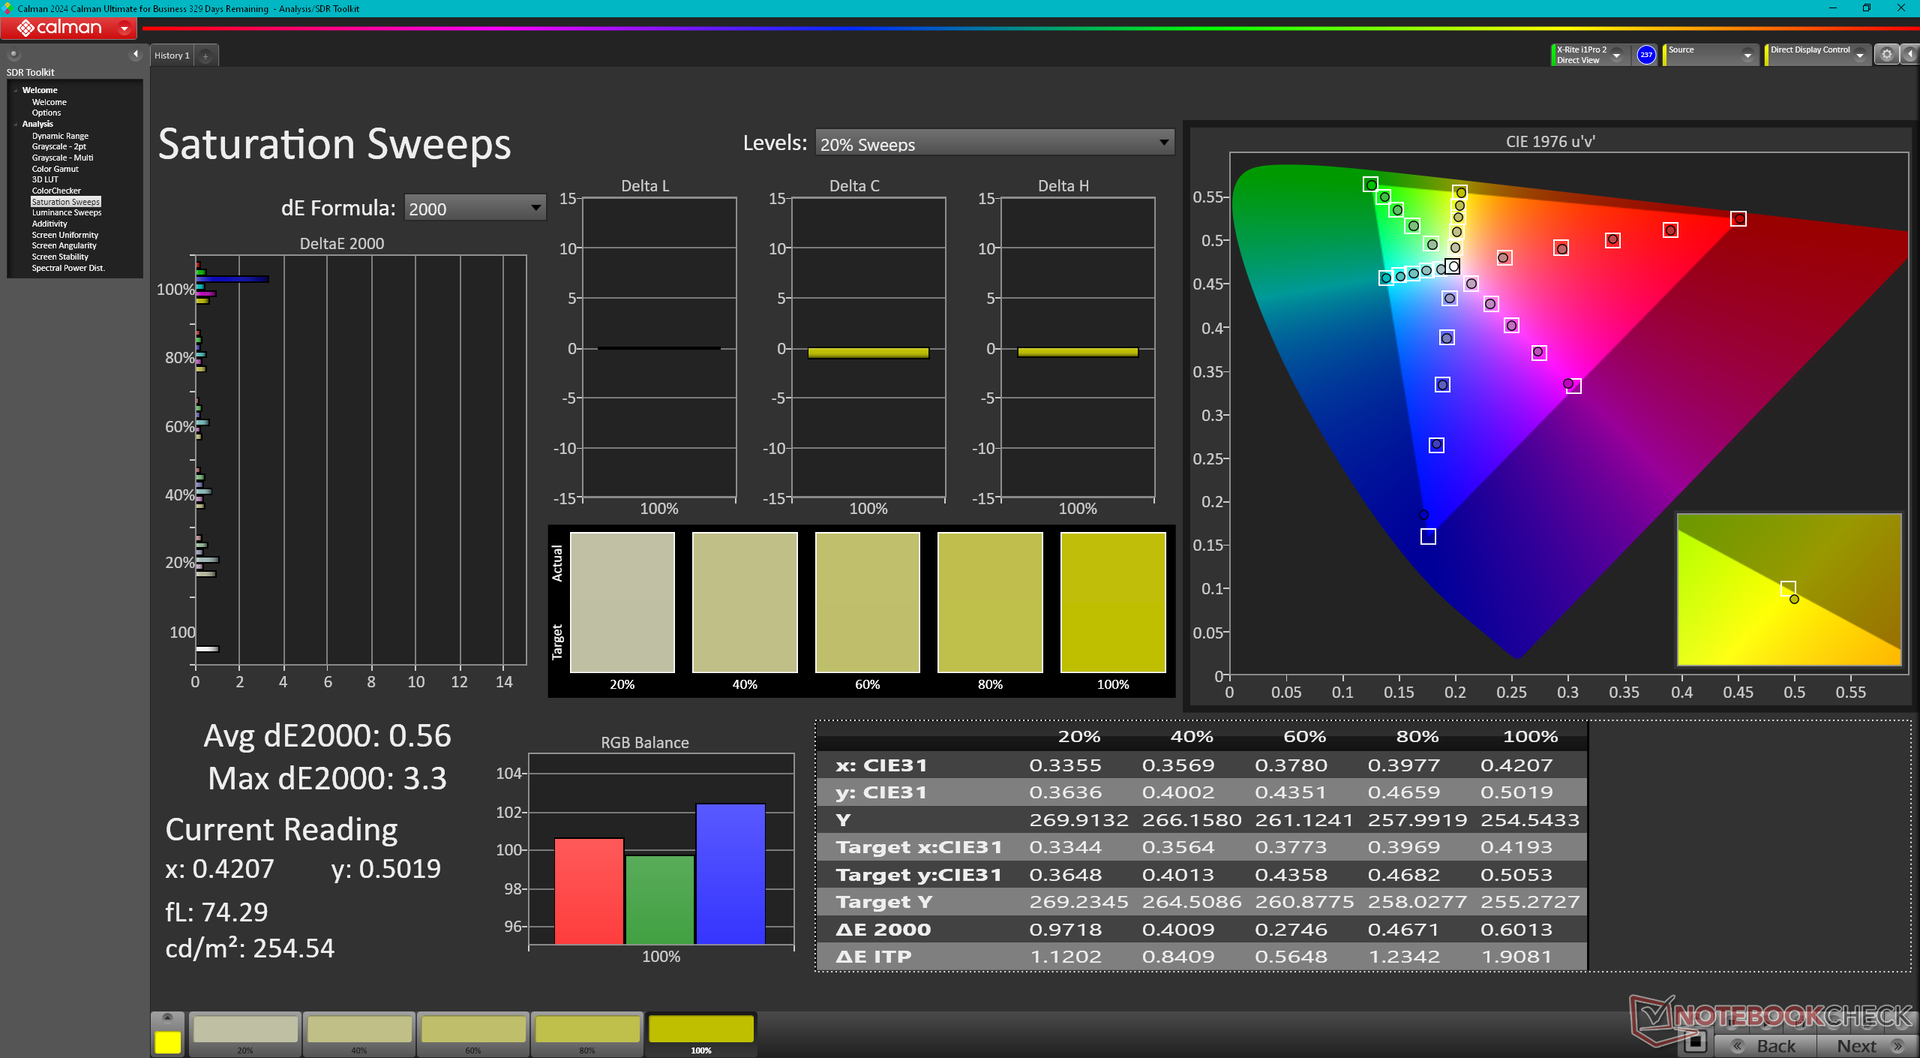
70.6% AdobeRGB 1998 (Argyll 3D)
96.9% sRGB (Argyll 3D)
68.4% Display P3 (Argyll 3D)
Gamma: 2.15
CCT: 6484 K
| Lenovo ThinkPad P16 Gen 2 NE160QDM-NY1, IPS, 2560x1600, 16", 165 Hz | Lenovo ThinkPad P16 G2 21FA000FGE MNG007DA1-9, IPS LED, 2560x1600, 16", 165 Hz | Lenovo ThinkPad P16s G2 21K9000CGE ATNA60YV04-0, OLED, 3840x2400, 16", 60 Hz | Lenovo ThinkPad P16 G1 RTX A5500 LP160UQ1-SPB1, IPS, 3840x2400, 16", 60 Hz | HP ZBook Power 16 G11 A AUOA0A9, IPS, 2560x1600, 16", 120 Hz | Dell Precision 5690 Samsung 160YV03, OLED, 3840x2400, 16", 60 Hz | |
|---|---|---|---|---|---|---|
| Display | 3% | 29% | 20% | 1% | 29% | |
| Display P3 Coverage (%) | 68.4 | 71 4% | 99.9 46% | 82.9 21% | 69.1 1% | 99.8 46% |
| sRGB Coverage (%) | 96.9 | 99.2 2% | 100 3% | 98.9 2% | 97.7 1% | 100 3% |
| AdobeRGB 1998 Coverage (%) | 70.6 | 73.2 4% | 96.9 37% | 95.9 36% | 71 1% | 96.6 37% |
| Response Times | 4% | 88% | -248% | 10% | 86% | |
| Response Time Grey 50% / Grey 80% * (ms) | 14.1 ? | 12.8 ? 9% | 1.5 ? 89% | 45.6 ? -223% | 13.6 ? 4% | 1.7 ? 88% |
| Response Time Black / White * (ms) | 9.9 ? | 10.1 ? -2% | 1.3 ? 87% | 36.8 ? -272% | 8.4 ? 15% | 1.7 ? 83% |
| PWM Frequency (Hz) | 60 | 60 ? | ||||
| Screen | -59% | -54% | -22% | -52% | -49% | |
| Brightness middle (cd/m²) | 531.5 | 510 -4% | 416 -22% | 601.9 13% | 470.7 -11% | 348.1 -35% |
| Brightness (cd/m²) | 499 | 517 4% | 421 -16% | 569 14% | 431 -14% | 351 -30% |
| Brightness Distribution (%) | 89 | 89 0% | 98 10% | 77 -13% | 88 -1% | 97 9% |
| Black Level * (cd/m²) | 0.38 | 0.37 3% | 0.47 -24% | 0.57 -50% | ||
| Contrast (:1) | 1399 | 1378 -2% | 1281 -8% | 826 -41% | ||
| Colorchecker dE 2000 * | 1.82 | 2.6 -43% | 1.3 29% | 2.45 -35% | 2.16 -19% | 4.18 -130% |
| Colorchecker dE 2000 max. * | 4.1 | 5.2 -27% | 2.8 32% | 4.46 -9% | 4.39 -7% | 6.68 -63% |
| Colorchecker dE 2000 calibrated * | 0.63 | 2.3 -265% | 2.9 -360% | 1.37 -117% | 0.97 -54% | |
| Greyscale dE 2000 * | 1.2 | 3.6 -200% | 1.8 -50% | 2.6 -117% | 3.7 -208% | 1.7 -42% |
| Gamma | 2.15 102% | 2.26 97% | 2.25 98% | 2.3 96% | 2.38 92% | 2.2 100% |
| CCT | 6484 100% | 5969 109% | 6574 99% | 6805 96% | 6765 96% | 6198 105% |
| Totaal Gemiddelde (Programma / Instellingen) | -17% /
-37% | 21% /
-10% | -83% /
-47% | -14% /
-32% | 22% /
-7% |
* ... kleiner is beter
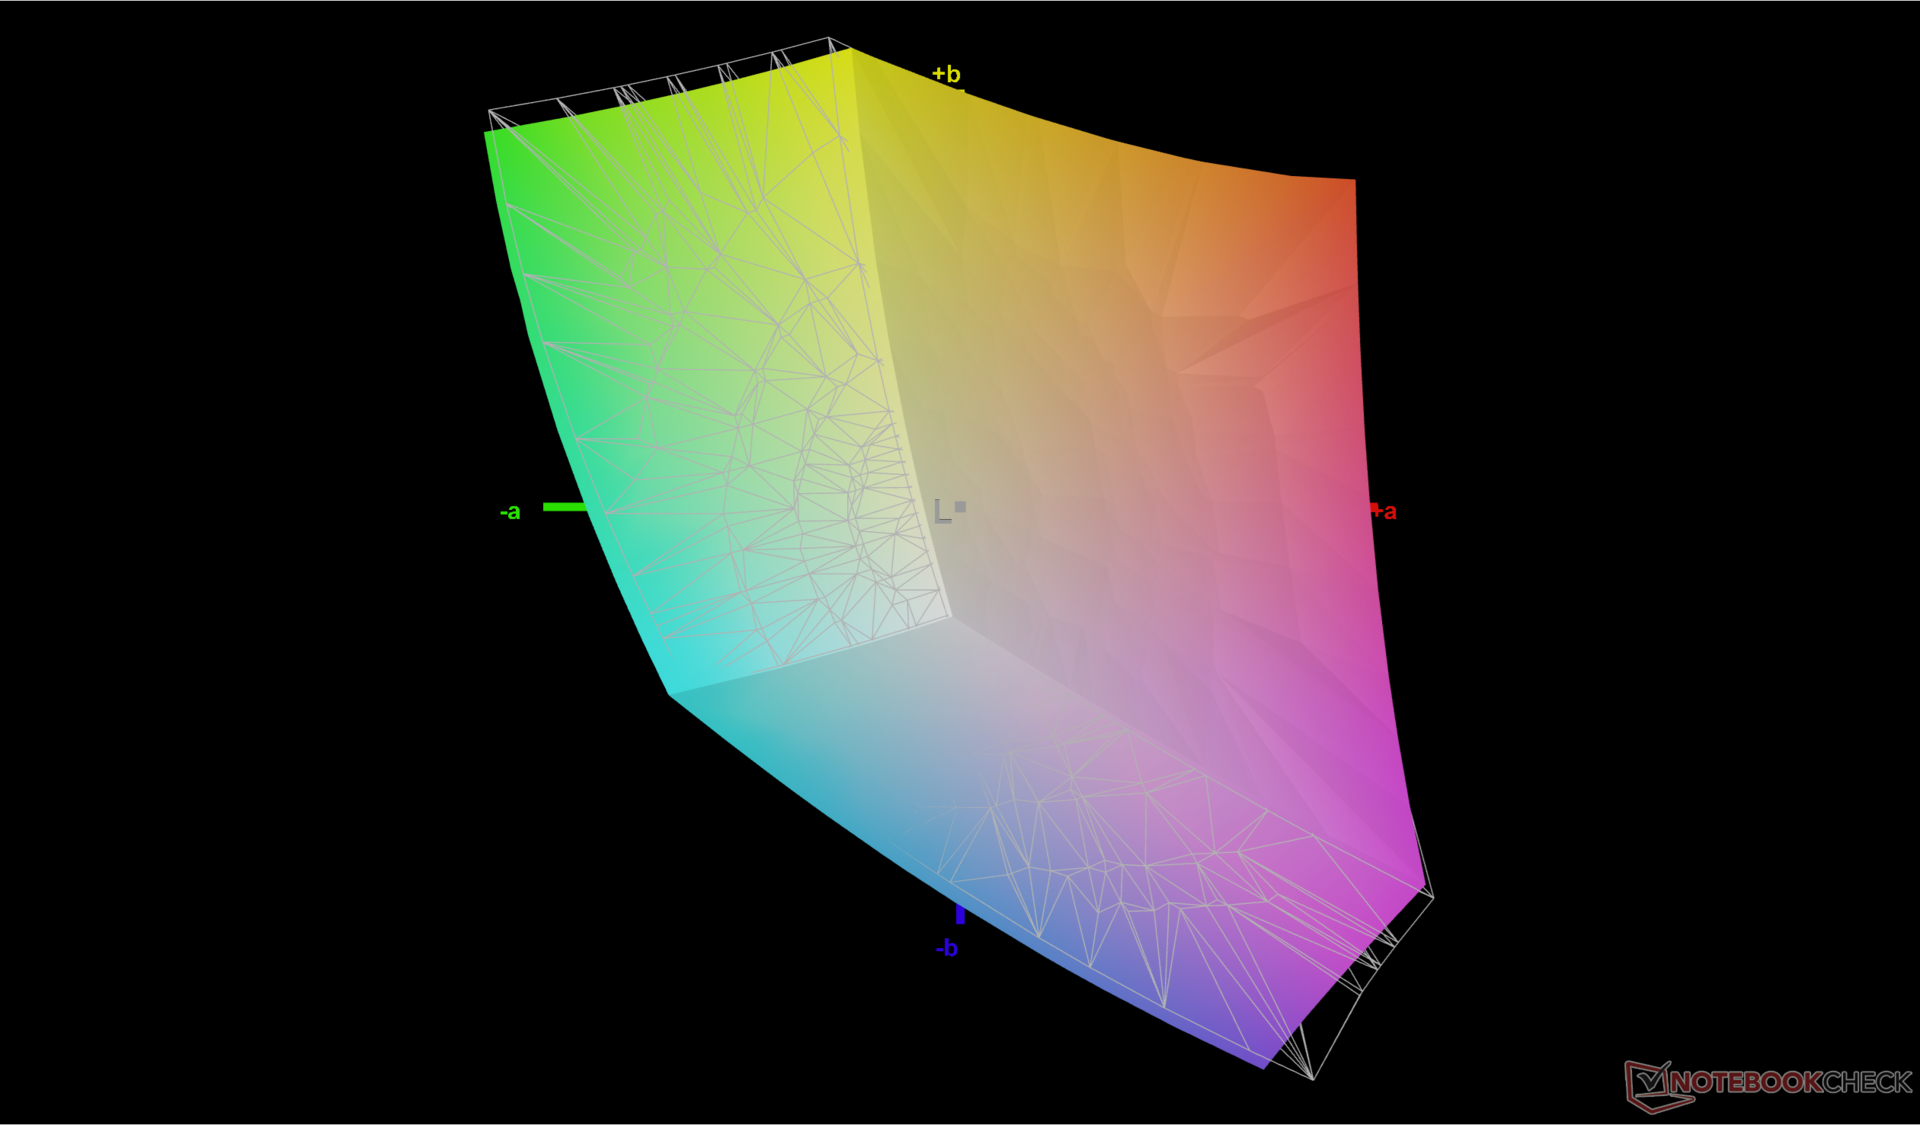
Het beeldscherm is vooraf gekalibreerd ten opzichte van de sRGB-standaard met gemiddelde grijswaarden deltaE-waarden van slechts 1,2 respectievelijk 1,82. Een kalibratie door de eindgebruiker is daarom voor de meesten niet nodig.

Responstijd Scherm
| ↔ Responstijd Zwart naar Wit | ||
|---|---|---|
| 9.9 ms ... stijging ↗ en daling ↘ gecombineerd | ↗ 5 ms stijging | 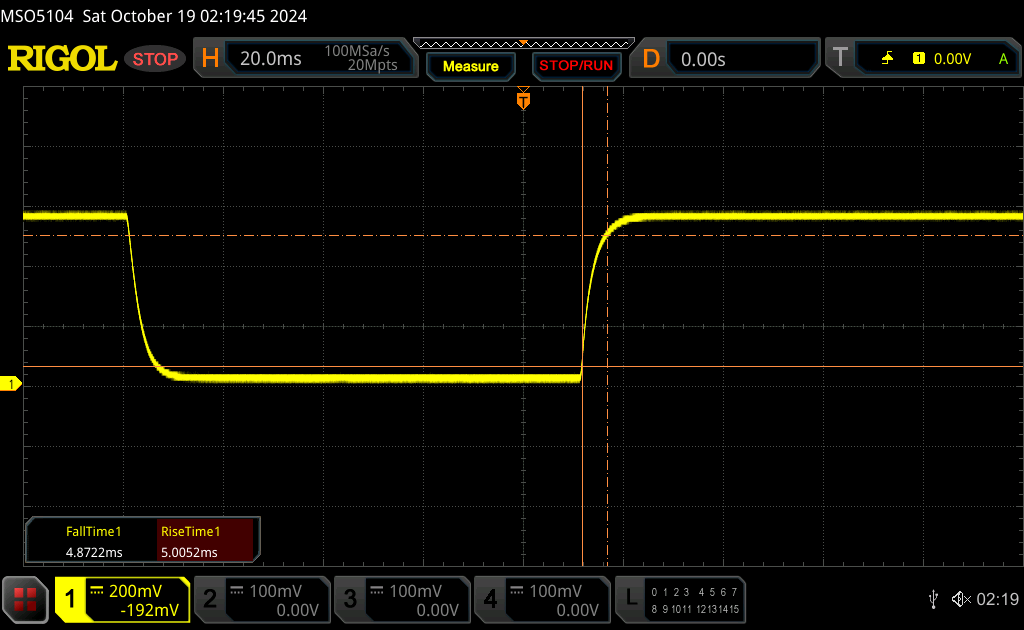 |
| ↘ 4.9 ms daling | ||
| Het scherm vertoonde snelle responstijden in onze tests en zou geschikt moeten zijn voor games. Ter vergelijking: alle testtoestellen variëren van 0.1 (minimum) tot 240 (maximum) ms. » 27 % van alle toestellen zijn beter. Dit betekent dat de gemeten responstijd beter is dan het gemiddelde (19.8 ms) van alle geteste toestellen. | ||
| ↔ Responstijd 50% Grijs naar 80% Grijs | ||
| 14.1 ms ... stijging ↗ en daling ↘ gecombineerd | ↗ 6.7 ms stijging | 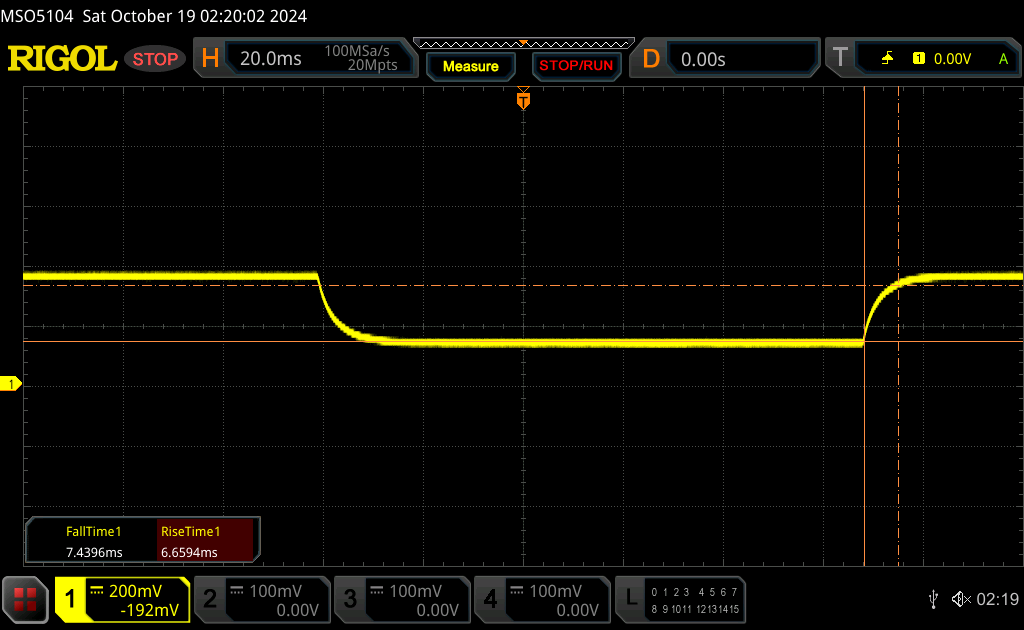 |
| ↘ 7.4 ms daling | ||
| Het scherm vertoonde prima responstijden in onze tests maar is misschien wat te traag voor competitieve games. Ter vergelijking: alle testtoestellen variëren van 0.165 (minimum) tot 636 (maximum) ms. » 28 % van alle toestellen zijn beter. Dit betekent dat de gemeten responstijd beter is dan het gemiddelde (31 ms) van alle geteste toestellen. | ||
Screen Flickering / PWM (Pulse-Width Modulation)
| Screen flickering / PWM niet waargenomen | 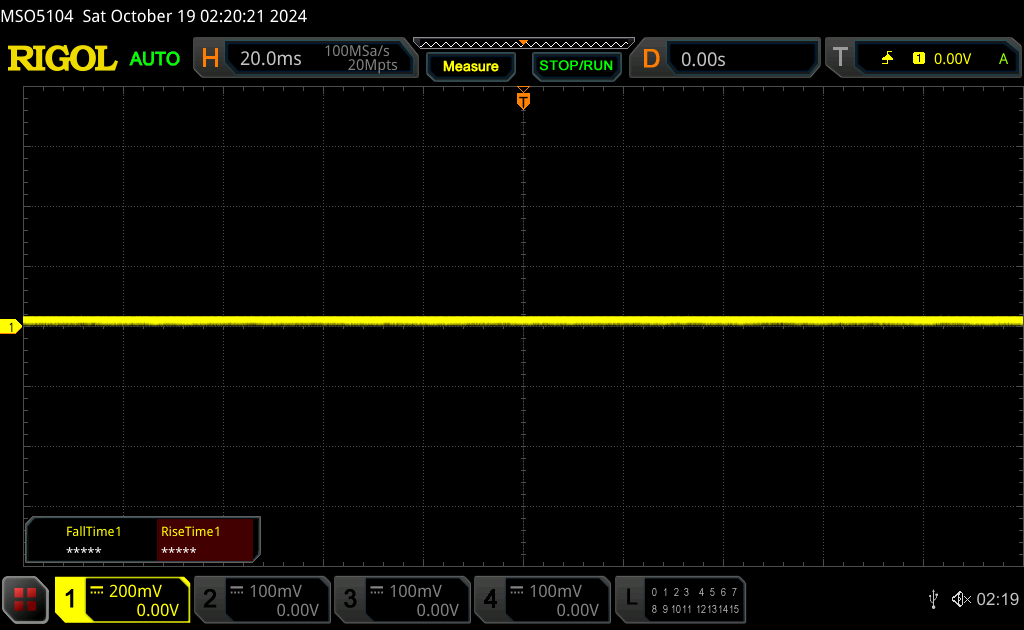 | ||
Ter vergelijking: 52 % van alle geteste toestellen maakten geen gebruik van PWM om de schermhelderheid te verlagen. Als het wel werd gebruikt, werd een gemiddelde van 7763 (minimum: 5 - maximum: 343500) Hz waargenomen. | |||

Prestaties
Testomstandigheden
We hebben Windows ingesteld op de modus Prestaties en de GPU op de modus Discreet voordat we de onderstaande benchmarks uitvoerden. Het systeem ondersteunt Advanced Optimus niet volgens het configuratiescherm van Nvidia.
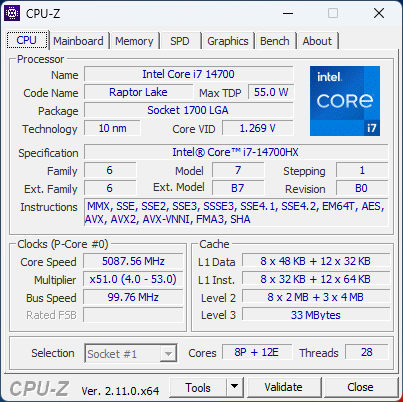
Processor
De Core i7-14700HX is een gezonde verbetering ten opzichte van de Core i7-13700HX met een toename van 20 tot 25 procent in multi-thread prestaties. SKU's met de Core i9-13980HX zijn nog steeds beschikbaar, die zelfs nog snellere prestaties kunnen leveren dan onze Core I7-14700HX, ondanks het feit dat het een oudere processor is.
De duurzaamheid van de prestaties is goed, maar zou beter kunnen. Als we bijvoorbeeld CineBench R15 xT in een loop draaiden, daalde onze oorspronkelijke score van 3930 punten al na een paar loops met 10 procent.
Cinebench R15 Multi Loop
Cinebench R23: Multi Core | Single Core
Cinebench R20: CPU (Multi Core) | CPU (Single Core)
Cinebench R15: CPU Multi 64Bit | CPU Single 64Bit
Blender: v2.79 BMW27 CPU
7-Zip 18.03: 7z b 4 | 7z b 4 -mmt1
Geekbench 6.7: Multi-Core | Single-Core
Geekbench 5.5: Multi-Core | Single-Core
HWBOT x265 Benchmark v2.2: 4k Preset
LibreOffice : 20 Documents To PDF
R Benchmark 2.5: Overall mean
| CPU Performance rating | |
| HP ZBook Fury 16 G11 | |
| Lenovo ThinkPad P16 Gen 2 | |
| Gemiddelde van klas Workstation | |
| Gemiddeld Intel Core i7-14700HX | |
| Lenovo ThinkPad P16 G1 RTX A5500 -2! | |
| Lenovo ThinkPad P1 G6 21FV001KUS | |
| Lenovo ThinkPad P16 G2 21FA000FGE -2! | |
| Dell Precision 5690 | |
| Lenovo ThinkPad P1 G6-21FV000DGE | |
| Lenovo ThinkPad P1 Gen 7 21KV001SGE | |
| HP ZBook Fury 16 G9 -2! | |
| HP ZBook Power 16 G11 A | |
| MSI CreatorPro Z16P B12UKST -2! | |
| Lenovo ThinkPad P16v G1 AMD | |
| Lenovo ThinkPad P16s G2 21K9000CGE | |
| HP ZBook Firefly 16 G9-6B897EA -2! | |
| Geekbench 6.7 / Multi-Core | |
| Lenovo ThinkPad P16 Gen 2 | |
| Gemiddelde van klas Workstation (12721 - 20887, n=24, laatste 2 jaar) | |
| Gemiddeld Intel Core i7-14700HX (14163 - 17562, n=9) | |
| HP ZBook Fury 16 G11 | |
| Dell Precision 5690 | |
| Lenovo ThinkPad P1 Gen 7 21KV001SGE | |
| Lenovo ThinkPad P1 G6 21FV001KUS | |
| HP ZBook Power 16 G11 A | |
| Lenovo ThinkPad P1 G6-21FV000DGE | |
| Lenovo ThinkPad P16s G2 21K9000CGE | |
| Lenovo ThinkPad P16v G1 AMD | |
| Geekbench 6.7 / Single-Core | |
| HP ZBook Fury 16 G11 | |
| Lenovo ThinkPad P16 Gen 2 | |
| Gemiddelde van klas Workstation (2389 - 3065, n=24, laatste 2 jaar) | |
| Gemiddeld Intel Core i7-14700HX (2378 - 2975, n=9) | |
| Lenovo ThinkPad P1 G6 21FV001KUS | |
| Lenovo ThinkPad P1 G6-21FV000DGE | |
| HP ZBook Power 16 G11 A | |
| Lenovo ThinkPad P16v G1 AMD | |
| Dell Precision 5690 | |
| Lenovo ThinkPad P16s G2 21K9000CGE | |
| Lenovo ThinkPad P1 Gen 7 21KV001SGE | |
Cinebench R23: Multi Core | Single Core
Cinebench R20: CPU (Multi Core) | CPU (Single Core)
Cinebench R15: CPU Multi 64Bit | CPU Single 64Bit
Blender: v2.79 BMW27 CPU
7-Zip 18.03: 7z b 4 | 7z b 4 -mmt1
Geekbench 6.7: Multi-Core | Single-Core
Geekbench 5.5: Multi-Core | Single-Core
HWBOT x265 Benchmark v2.2: 4k Preset
LibreOffice : 20 Documents To PDF
R Benchmark 2.5: Overall mean
* ... kleiner is beter
AIDA64: FP32 Ray-Trace | FPU Julia | CPU SHA3 | CPU Queen | FPU SinJulia | FPU Mandel | CPU AES | CPU ZLib | FP64 Ray-Trace | CPU PhotoWorxx
| Performance rating | |
| Lenovo ThinkPad P16 Gen 2 | |
| HP ZBook Power 16 G11 A | |
| Gemiddeld Intel Core i7-14700HX | |
| Lenovo ThinkPad P16s G2 21K9000CGE | |
| Dell Precision 5690 | |
| Lenovo ThinkPad P16 G1 RTX A5500 | |
| Lenovo ThinkPad P16 G2 21FA000FGE | |
| AIDA64 / FP32 Ray-Trace | |
| HP ZBook Power 16 G11 A | |
| Lenovo ThinkPad P16s G2 21K9000CGE | |
| Lenovo ThinkPad P16 Gen 2 | |
| Gemiddeld Intel Core i7-14700HX (14147 - 23676, n=9) | |
| Dell Precision 5690 | |
| Lenovo ThinkPad P16 G2 21FA000FGE | |
| Lenovo ThinkPad P16 G1 RTX A5500 | |
| AIDA64 / FPU Julia | |
| HP ZBook Power 16 G11 A | |
| Lenovo ThinkPad P16 Gen 2 | |
| Gemiddeld Intel Core i7-14700HX (71875 - 116556, n=9) | |
| Lenovo ThinkPad P16s G2 21K9000CGE | |
| Dell Precision 5690 | |
| Lenovo ThinkPad P16 G2 21FA000FGE | |
| Lenovo ThinkPad P16 G1 RTX A5500 | |
| AIDA64 / CPU SHA3 | |
| Lenovo ThinkPad P16 Gen 2 | |
| Gemiddeld Intel Core i7-14700HX (3388 - 5567, n=9) | |
| HP ZBook Power 16 G11 A | |
| Lenovo ThinkPad P16s G2 21K9000CGE | |
| Dell Precision 5690 | |
| Lenovo ThinkPad P16 G2 21FA000FGE | |
| Lenovo ThinkPad P16 G1 RTX A5500 | |
| AIDA64 / CPU Queen | |
| Lenovo ThinkPad P16 Gen 2 | |
| Gemiddeld Intel Core i7-14700HX (129134 - 152200, n=9) | |
| HP ZBook Power 16 G11 A | |
| Lenovo ThinkPad P16 G2 21FA000FGE | |
| Lenovo ThinkPad P16 G1 RTX A5500 | |
| Lenovo ThinkPad P16s G2 21K9000CGE | |
| Dell Precision 5690 | |
| AIDA64 / FPU SinJulia | |
| HP ZBook Power 16 G11 A | |
| Lenovo ThinkPad P16s G2 21K9000CGE | |
| Lenovo ThinkPad P16 Gen 2 | |
| Gemiddeld Intel Core i7-14700HX (10266 - 14434, n=9) | |
| Lenovo ThinkPad P16 G1 RTX A5500 | |
| Lenovo ThinkPad P16 G2 21FA000FGE | |
| Dell Precision 5690 | |
| AIDA64 / FPU Mandel | |
| HP ZBook Power 16 G11 A | |
| Lenovo ThinkPad P16s G2 21K9000CGE | |
| Lenovo ThinkPad P16 Gen 2 | |
| Gemiddeld Intel Core i7-14700HX (35155 - 58380, n=9) | |
| Dell Precision 5690 | |
| Lenovo ThinkPad P16 G1 RTX A5500 | |
| Lenovo ThinkPad P16 G2 21FA000FGE | |
| AIDA64 / CPU AES | |
| Lenovo ThinkPad P16 Gen 2 | |
| Gemiddeld Intel Core i7-14700HX (68616 - 113157, n=9) | |
| Dell Precision 5690 | |
| Lenovo ThinkPad P16 G2 21FA000FGE | |
| Lenovo ThinkPad P16 G1 RTX A5500 | |
| HP ZBook Power 16 G11 A | |
| Lenovo ThinkPad P16s G2 21K9000CGE | |
| AIDA64 / CPU ZLib | |
| Lenovo ThinkPad P16 Gen 2 | |
| Gemiddeld Intel Core i7-14700HX (1003 - 1682, n=9) | |
| Dell Precision 5690 | |
| Lenovo ThinkPad P16 G1 RTX A5500 | |
| Lenovo ThinkPad P16 G2 21FA000FGE | |
| HP ZBook Power 16 G11 A | |
| Lenovo ThinkPad P16s G2 21K9000CGE | |
| AIDA64 / FP64 Ray-Trace | |
| HP ZBook Power 16 G11 A | |
| Lenovo ThinkPad P16s G2 21K9000CGE | |
| Lenovo ThinkPad P16 Gen 2 | |
| Gemiddeld Intel Core i7-14700HX (7585 - 12928, n=9) | |
| Lenovo ThinkPad P16 G1 RTX A5500 | |
| Lenovo ThinkPad P16 G2 21FA000FGE | |
| Dell Precision 5690 | |
| AIDA64 / CPU PhotoWorxx | |
| Dell Precision 5690 | |
| Gemiddeld Intel Core i7-14700HX (24276 - 49671, n=9) | |
| Lenovo ThinkPad P16 G1 RTX A5500 | |
| HP ZBook Power 16 G11 A | |
| Lenovo ThinkPad P16 Gen 2 | |
| Lenovo ThinkPad P16s G2 21K9000CGE | |
| Lenovo ThinkPad P16 G2 21FA000FGE | |
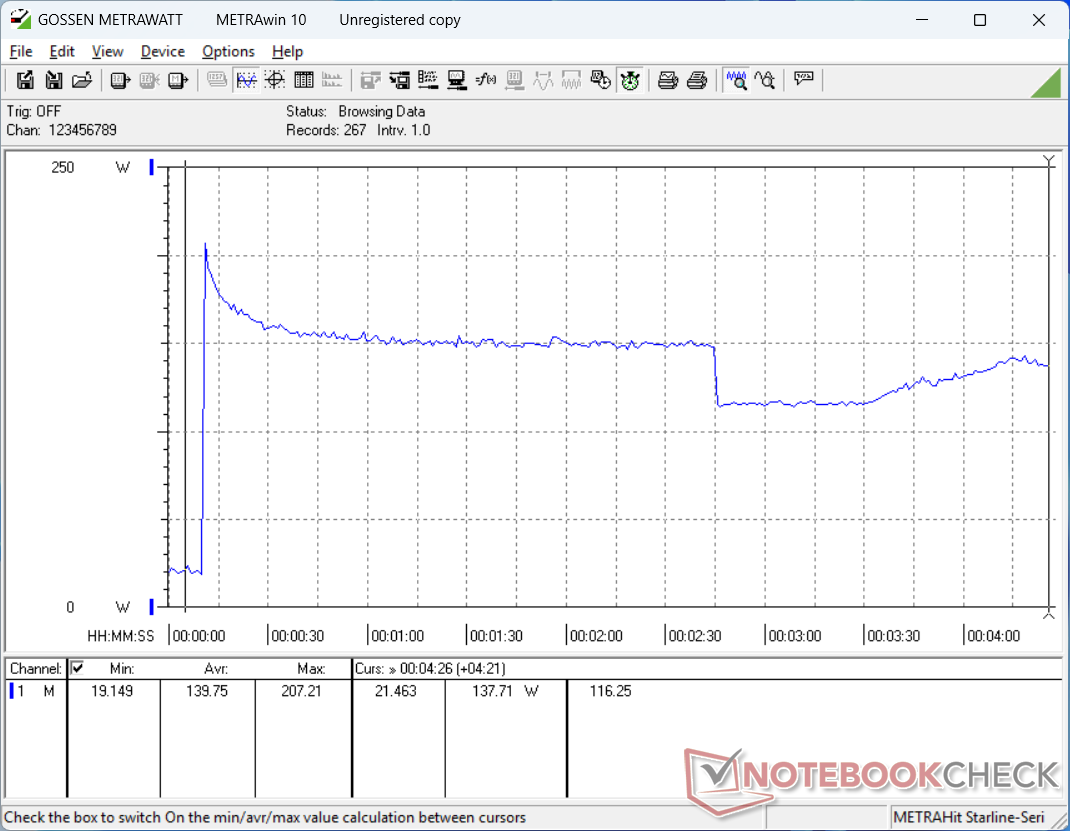
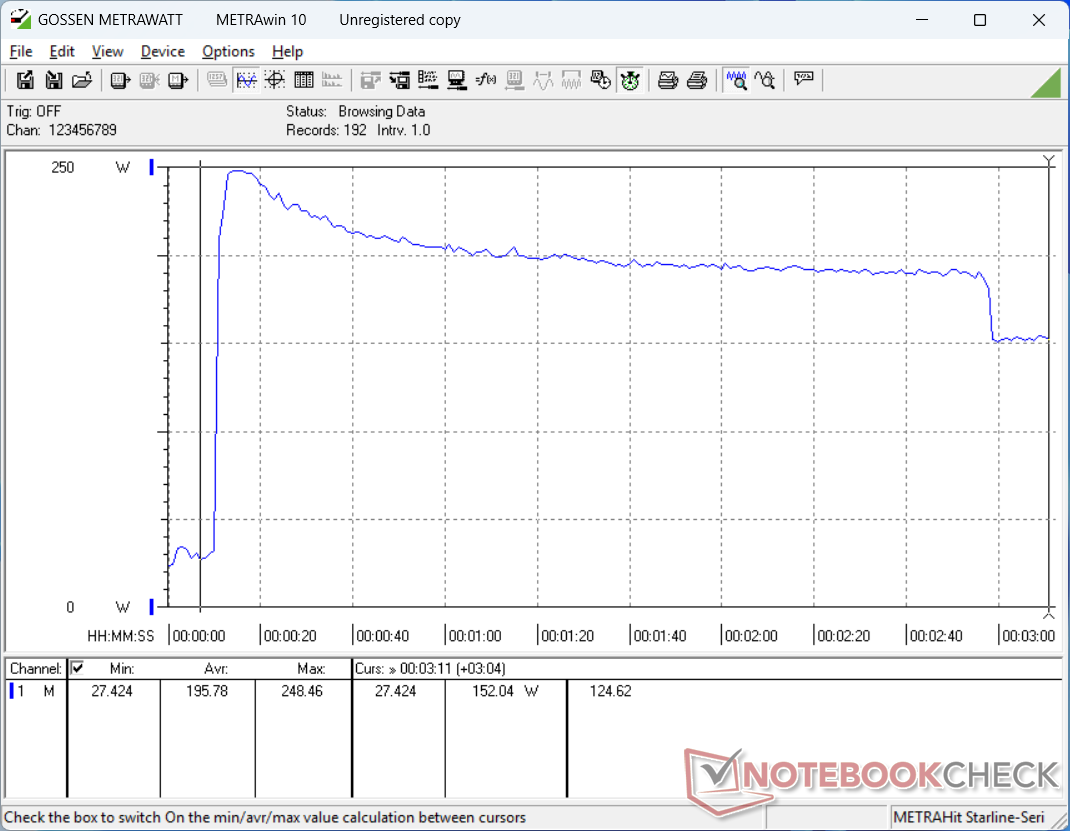
Stresstest
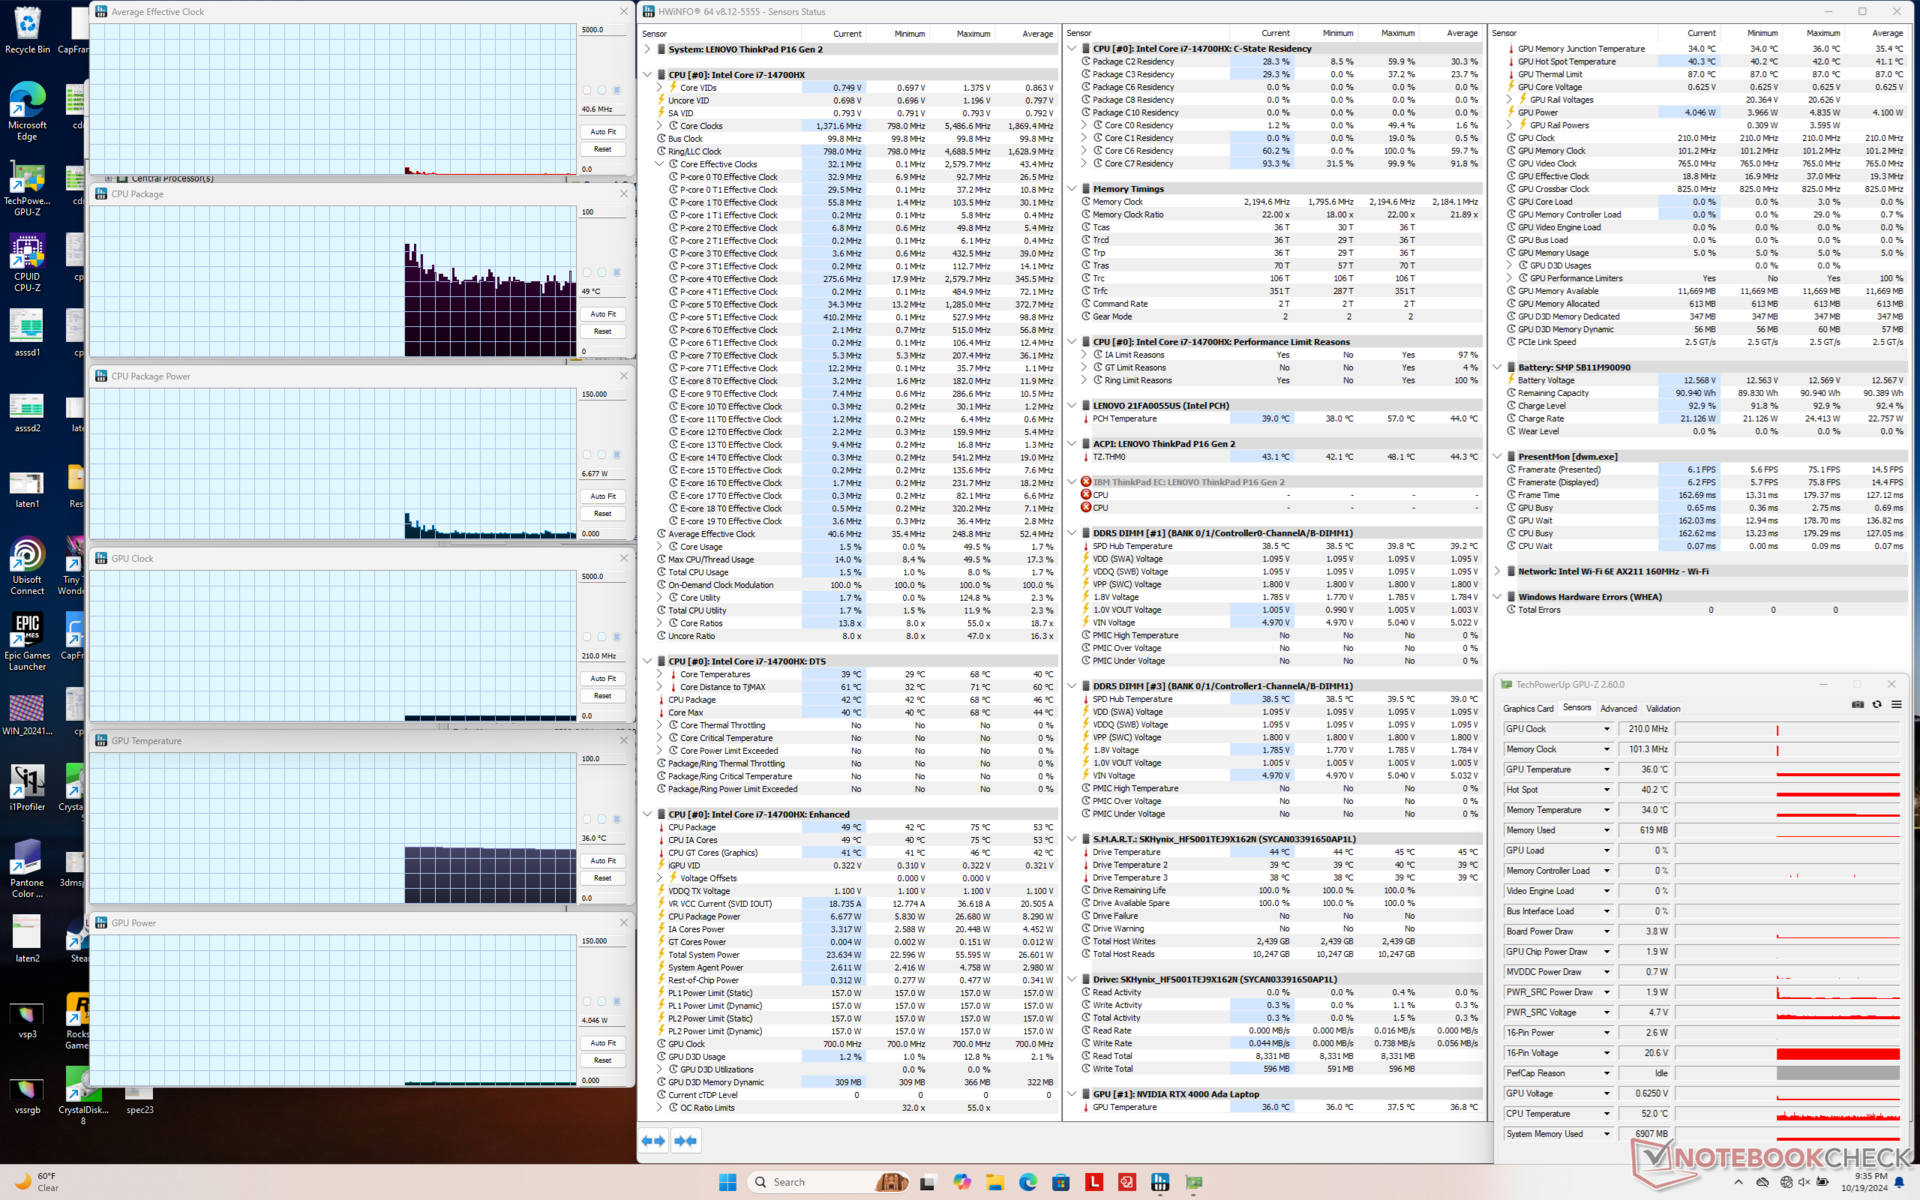
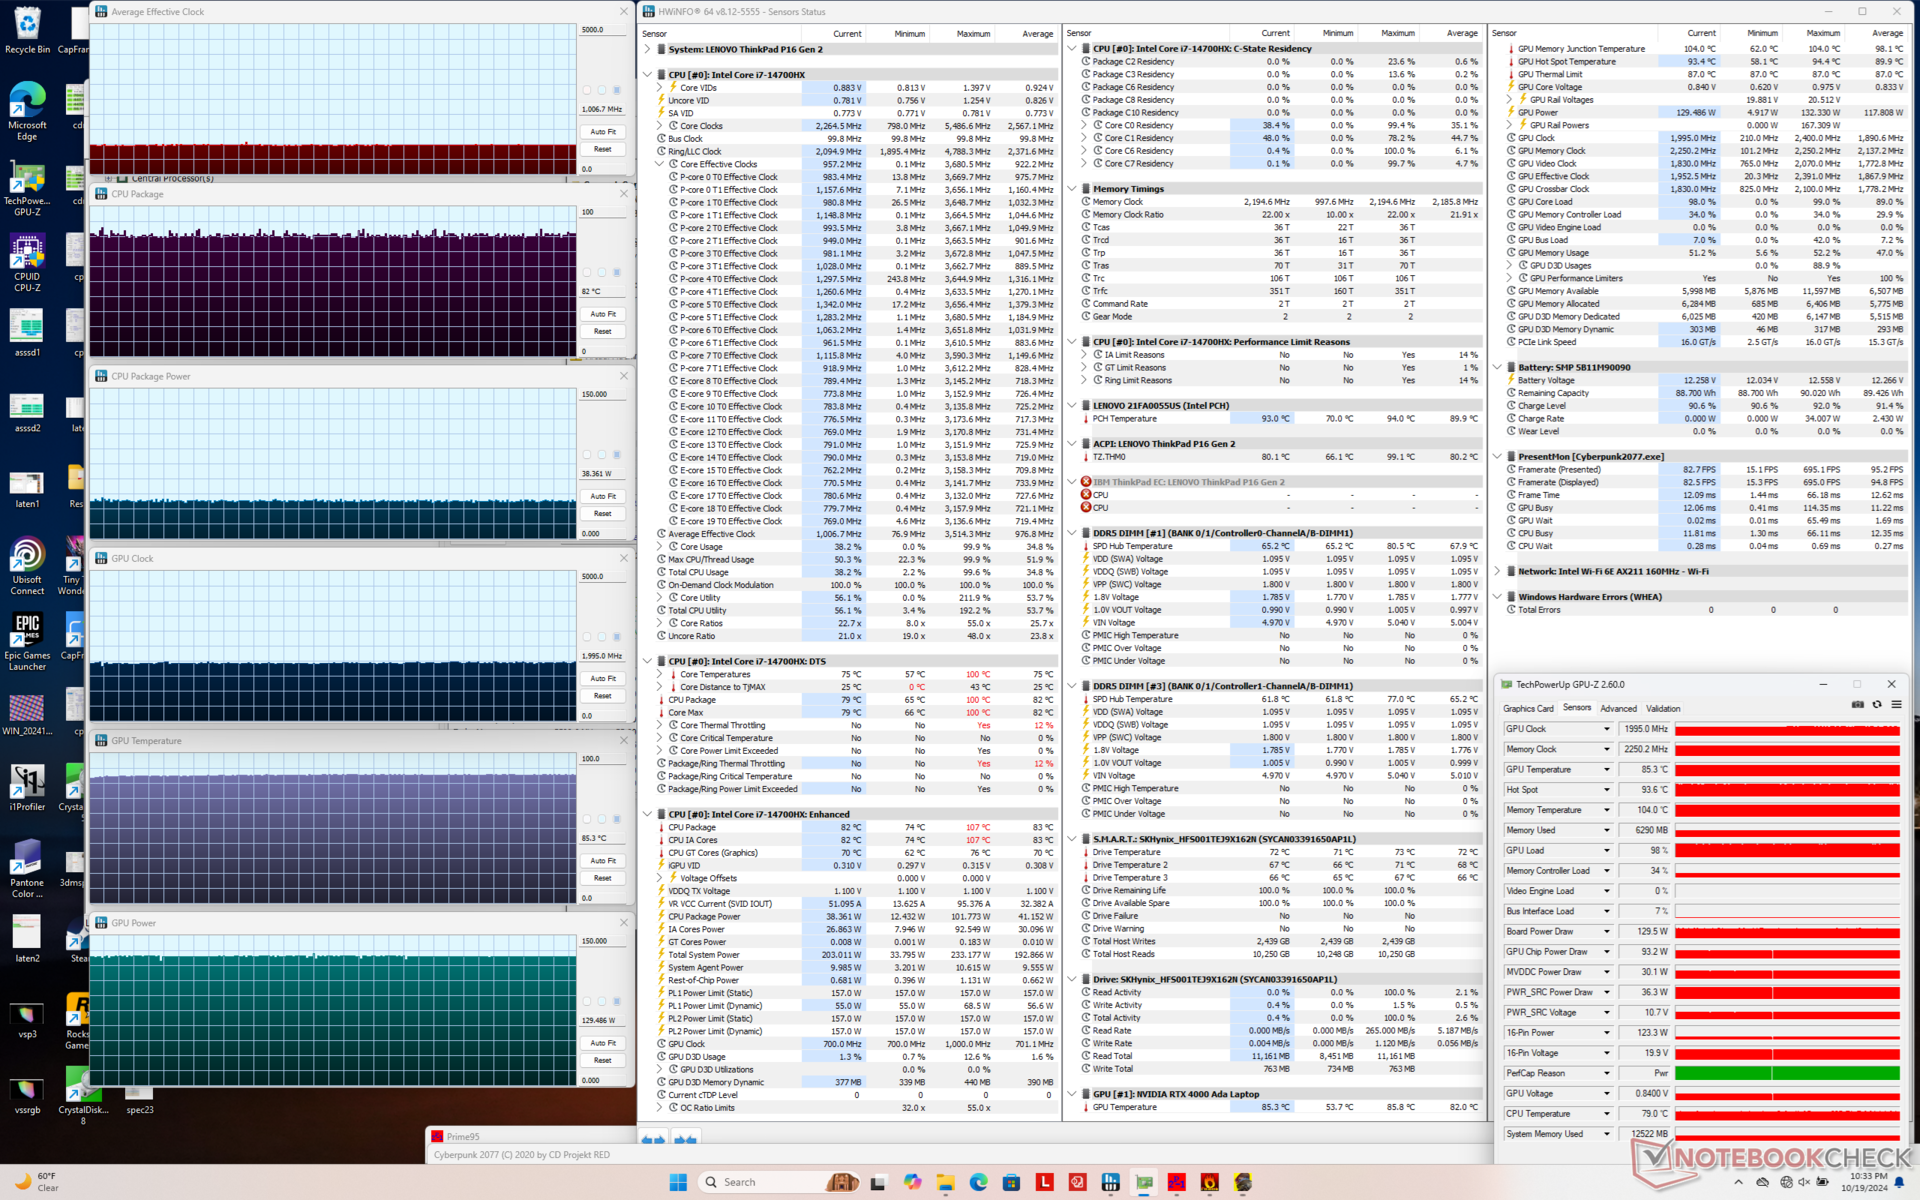
De kerntemperaturen zijn vrij hoog wanneer het systeem onder druk staat, wat leidt tot zeer warme oppervlaktetemperaturen, zoals aangegeven in het gedeelte Temperatuur hieronder. Wanneer bijvoorbeeld Prime95 of Cyberpunk 2077 wordt uitgevoerd, bereikt de CPU meer dan 80 C en soms zelfs 100 C. De stroomopname van het pakket en daarmee de kloksnelheid schommelt tussen 66 W en 90 W om de temperaturen onder controle te houden, zoals onze screenshots hieronder laten zien.
De stroomopname van de GPU-kaart kan de volle 130 W bereiken, zoals geadverteerd, wanneer Cyberpunk 2077 in de modus Prestaties wordt uitgevoerd. De GPU-temperatuur zal echter relatief hoog zijn (meer dan 85 C), waardoor de framerates uiteindelijk zullen dalen, zoals vermeld in het gedeelte over GPU-prestaties. De kernklok, geheugenklok en stroomopname op het bord zouden zelfs nog verder dalen als u in plaats daarvan in de modus Balanced zou gamen.
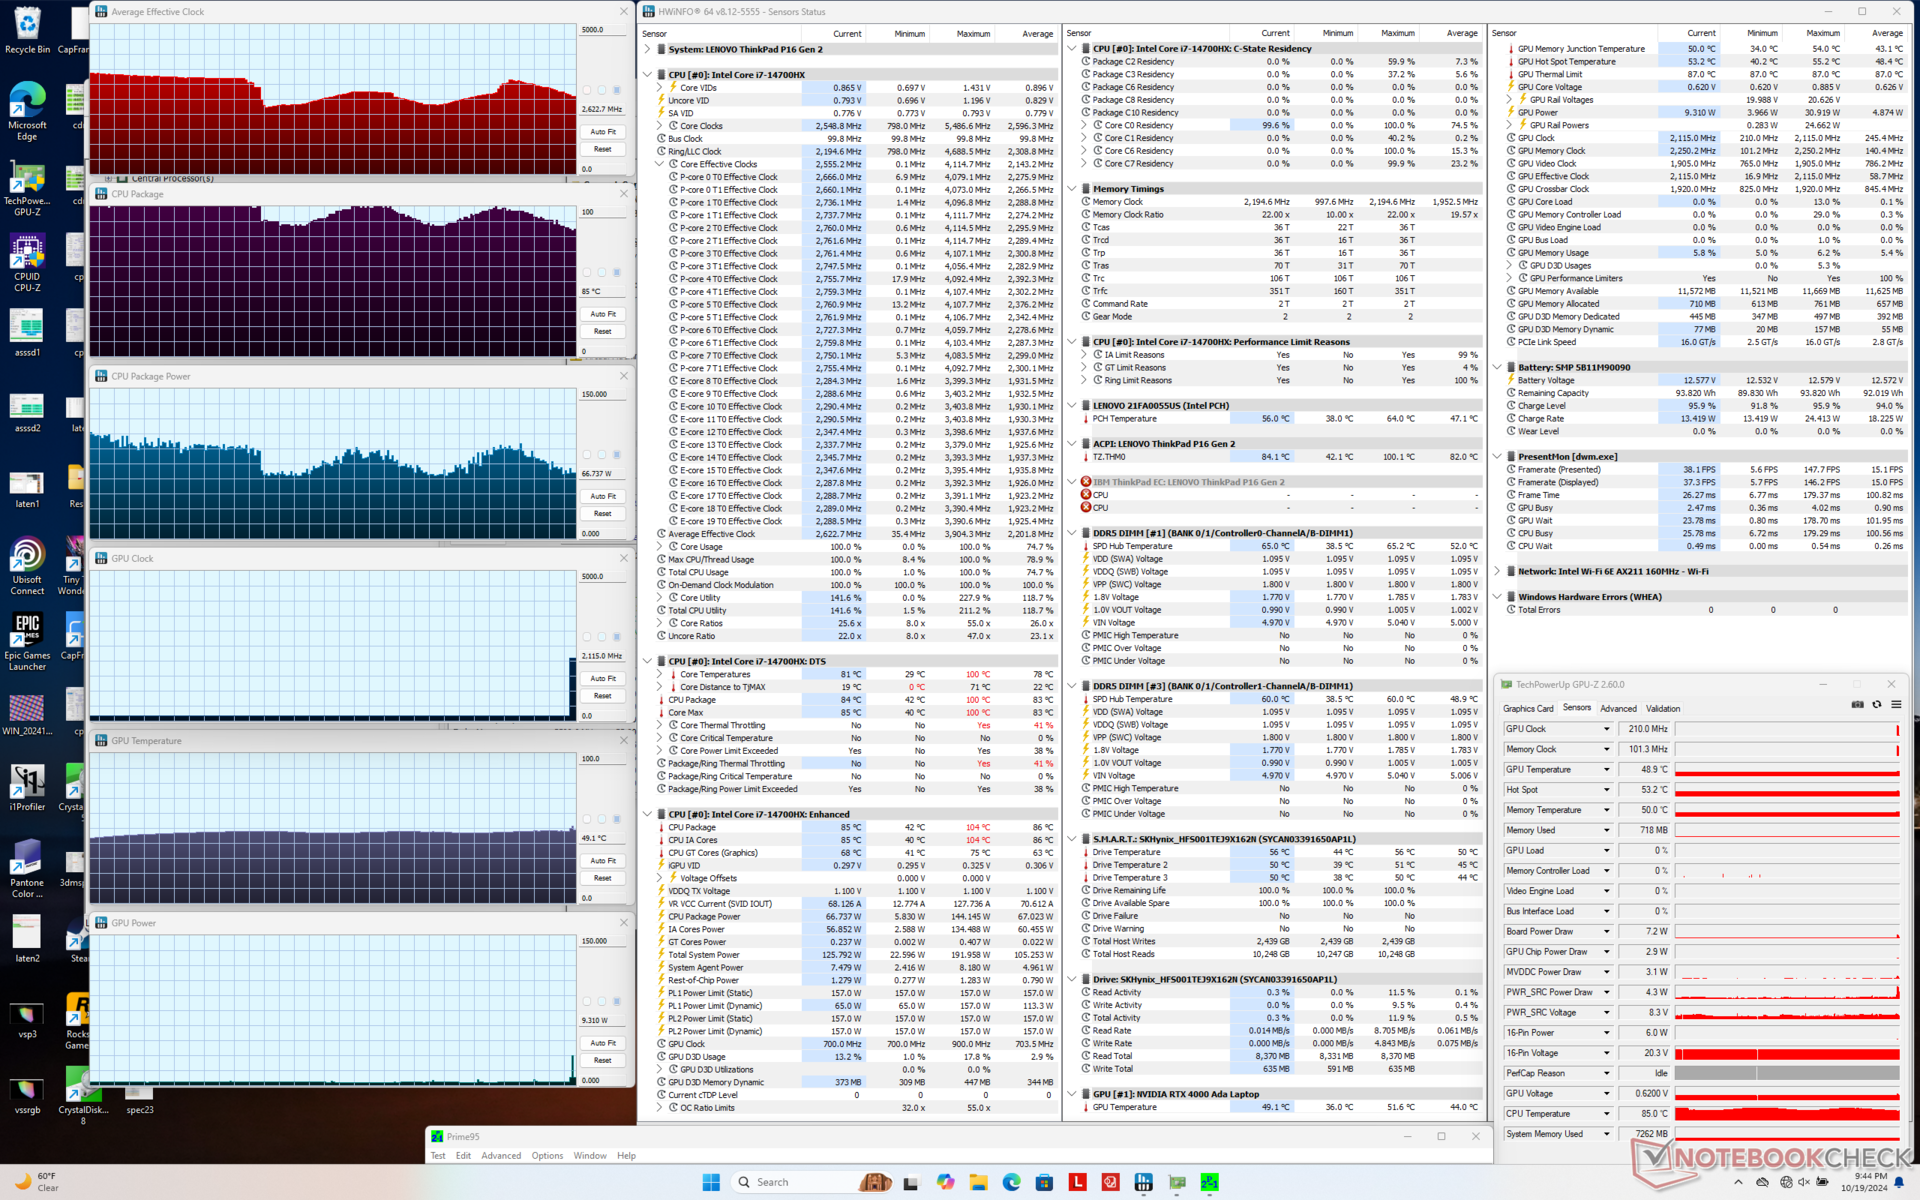
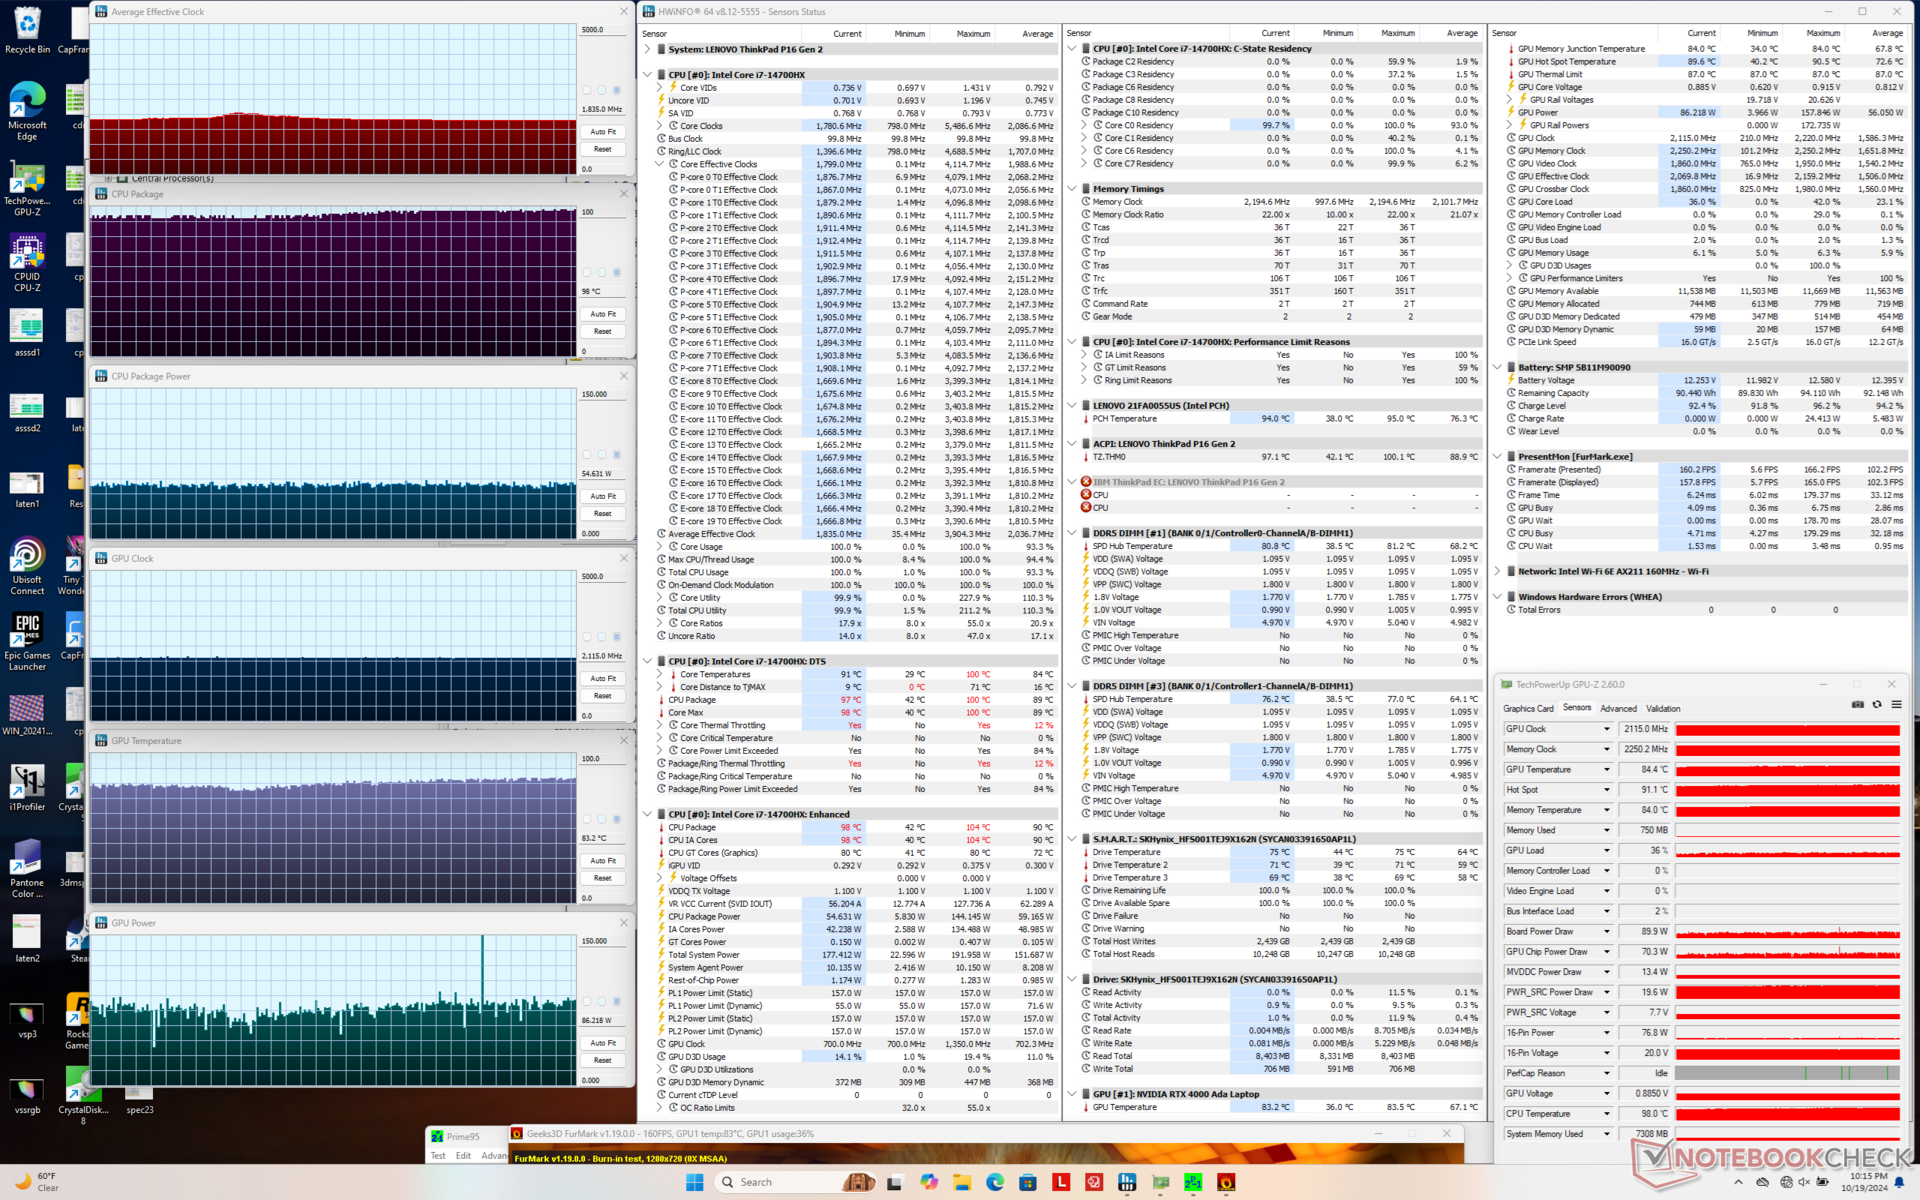
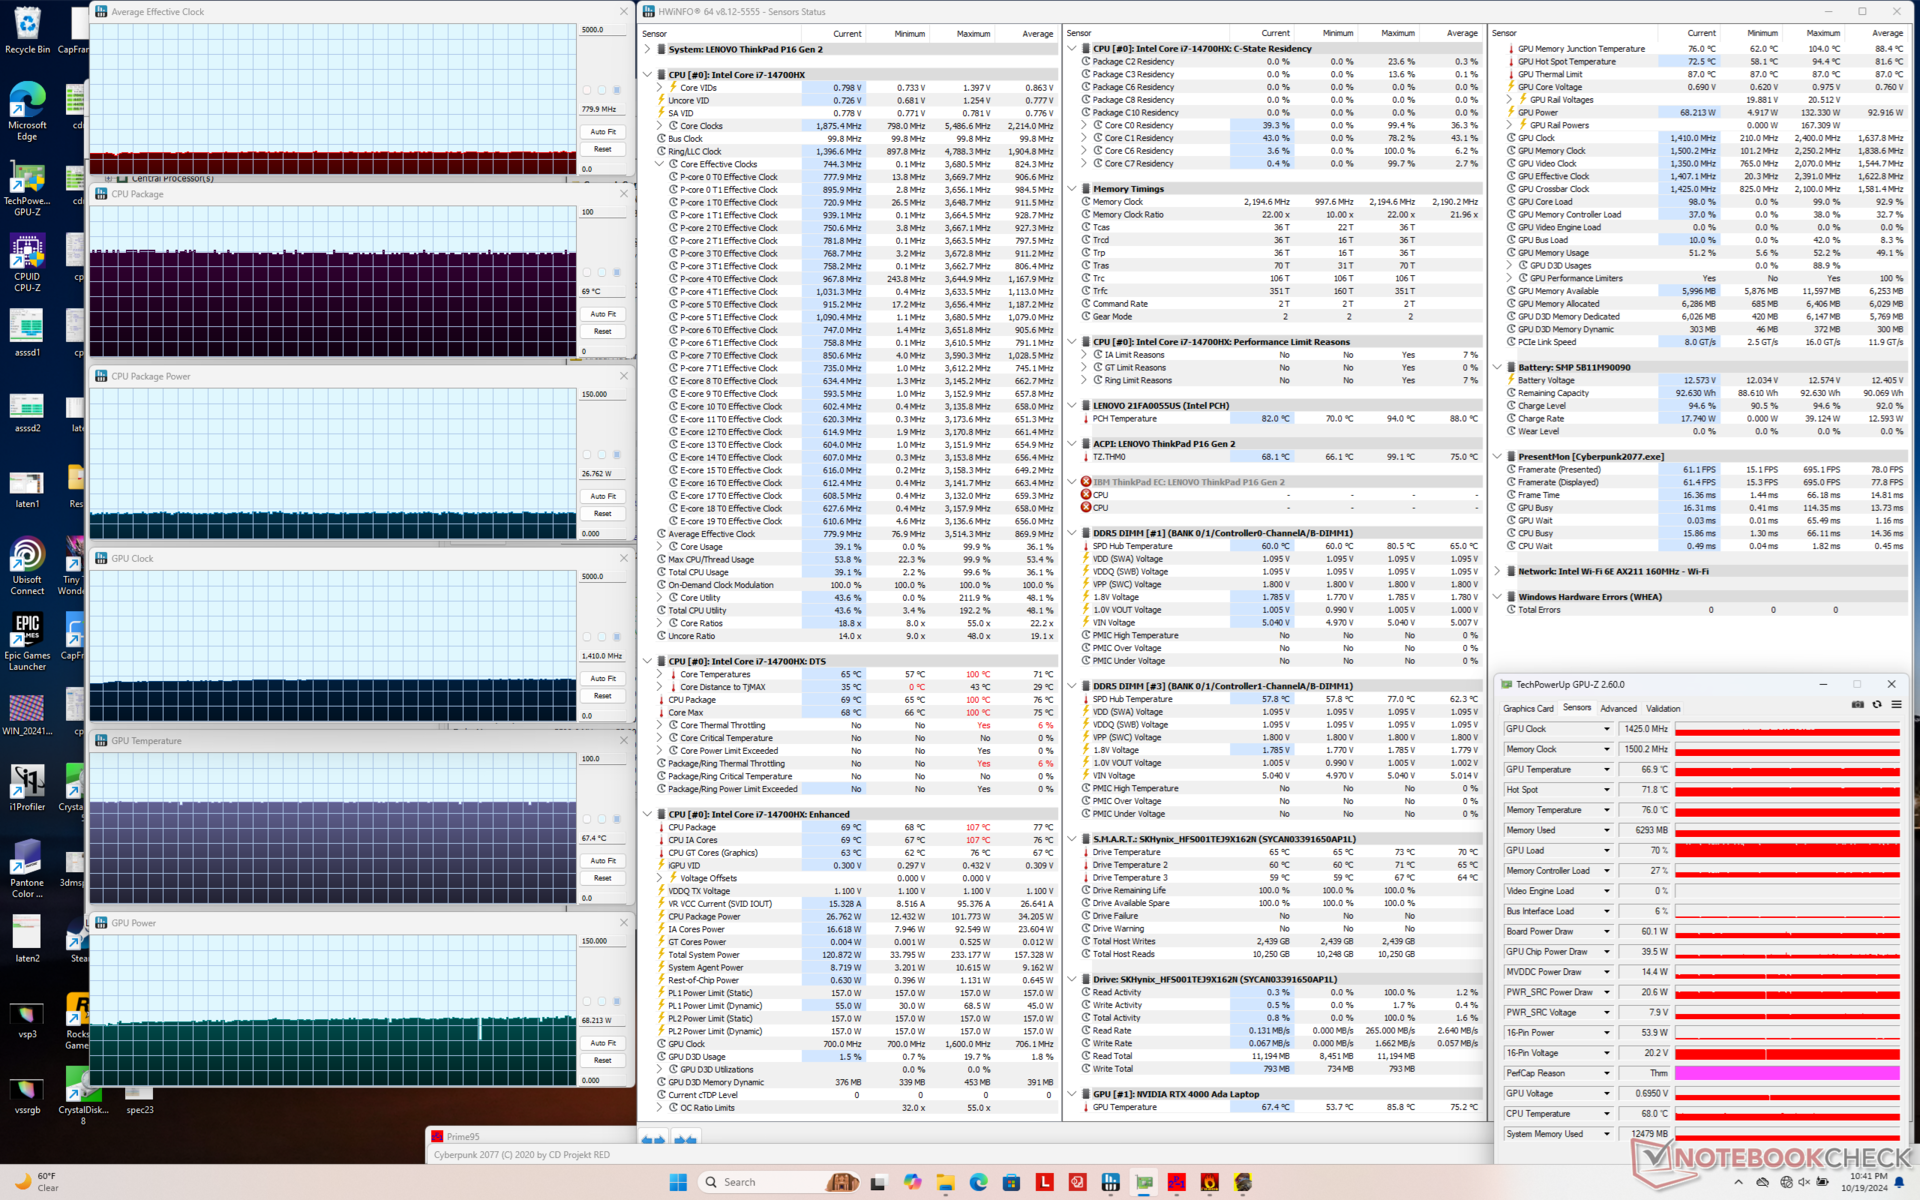
| CPU-klok (GHz) | GPU-klok (MHz) | Gemiddelde CPU-temperatuur (°C) | Gemiddelde GPU-temperatuur (°C) | |
| Systeem inactief | -- | -- | 49 | 36 |
| Prime95 Stress | 2.6 - 3.1 | -- | 85 - 100 | 49 |
| Prime95 + FurMark Stress | 1.8 | 2115 | 98 | 83 |
| Cyberpunk 2077 Stress (evenwichtige modus) | 0.8 | 1425 | 69 | 67 |
| Cyberpunk 2077 Stress (prestatiemodus) | 1.0 | 1995 | 82 | 85 |
Systeemprestaties
CrossMark: Overall | Productivity | Creativity | Responsiveness
WebXPRT 3: Overall
WebXPRT 4: Overall
Mozilla Kraken 1.1: Total
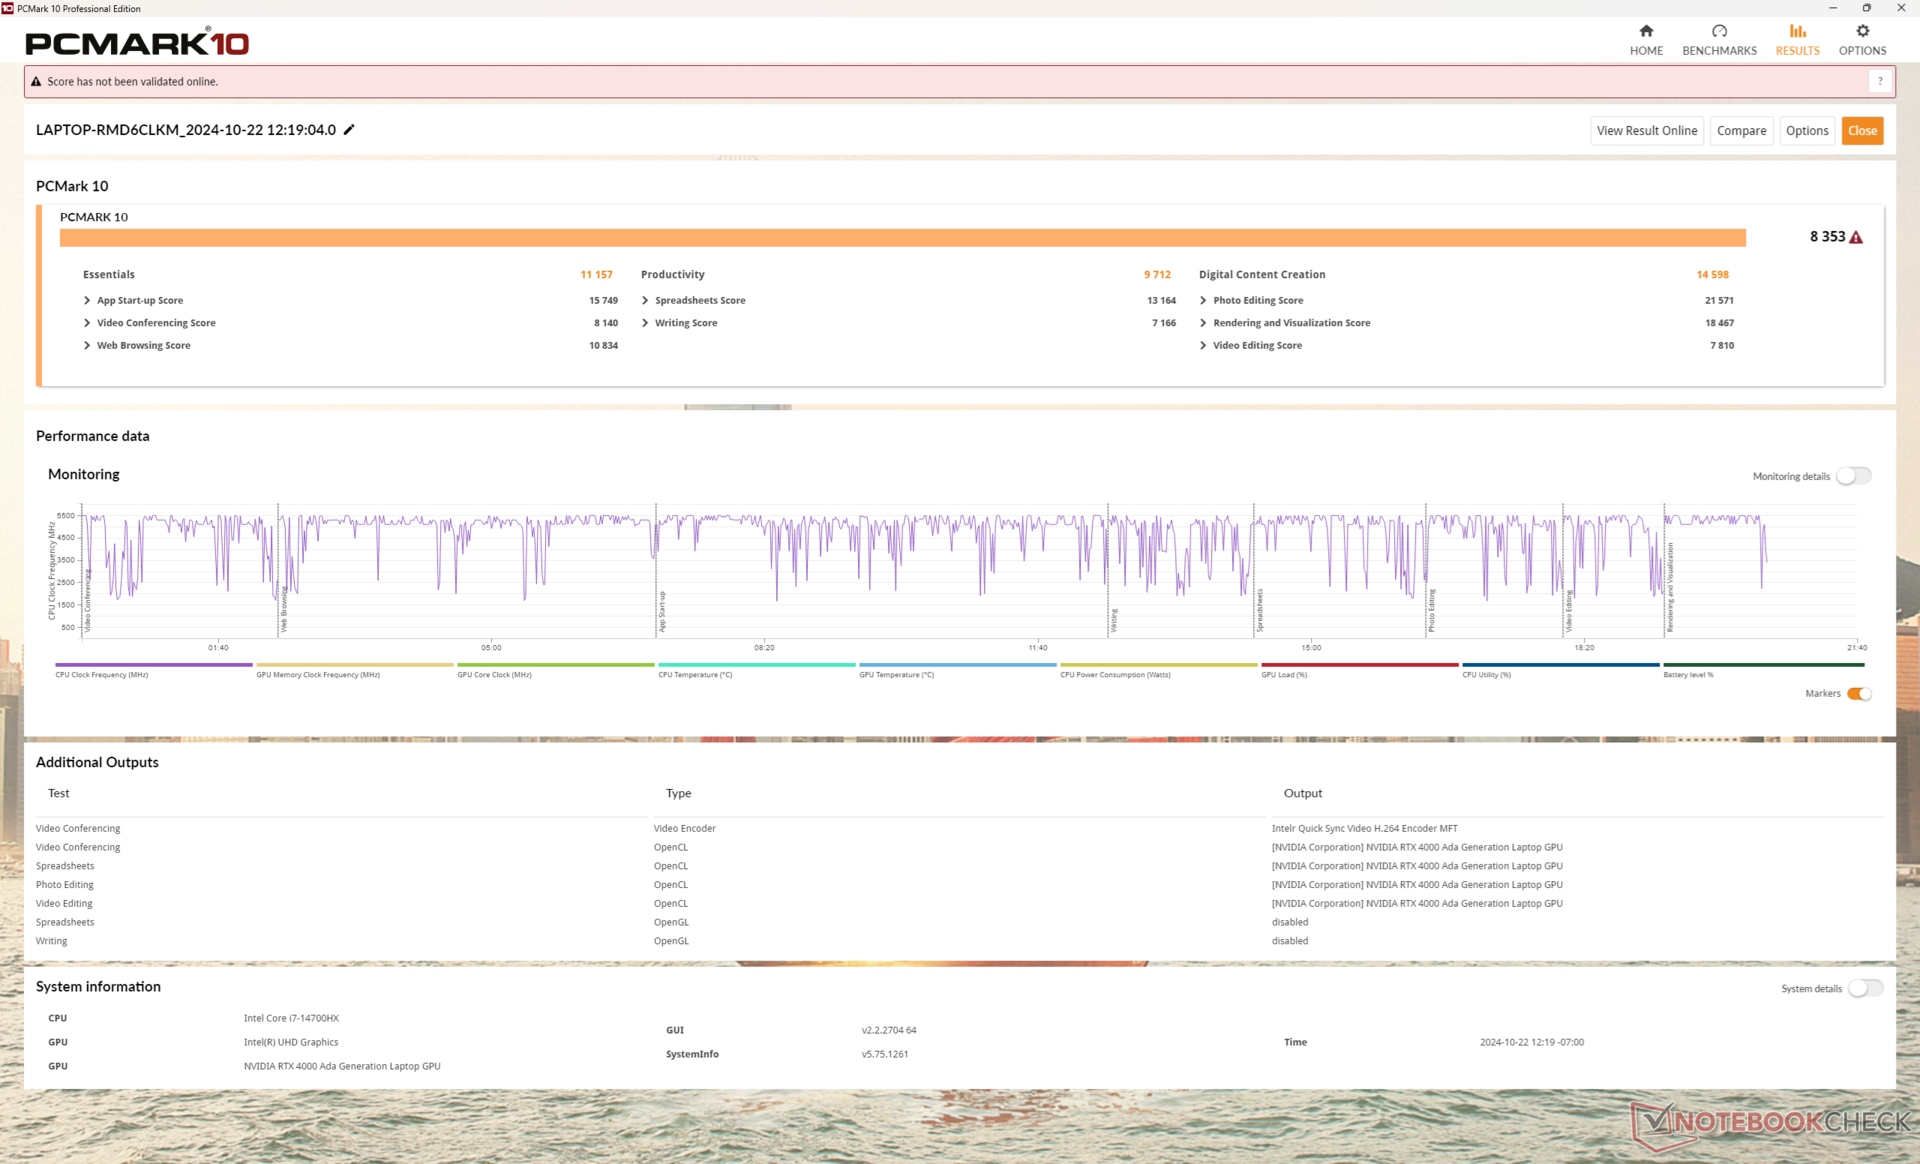
| PCMark 10 / Score | |
| Lenovo ThinkPad P16 Gen 2 | |
| Gemiddeld Intel Core i7-14700HX, NVIDIA RTX 4000 Ada Generation Laptop (n=1) | |
| Dell Precision 5690 | |
| HP ZBook Power 16 G11 A | |
| Lenovo ThinkPad P16 G1 RTX A5500 | |
| Lenovo ThinkPad P16 G2 21FA000FGE | |
| Lenovo ThinkPad P16s G2 21K9000CGE | |
| PCMark 10 / Essentials | |
| Lenovo ThinkPad P16 Gen 2 | |
| Gemiddeld Intel Core i7-14700HX, NVIDIA RTX 4000 Ada Generation Laptop (n=1) | |
| Dell Precision 5690 | |
| Lenovo ThinkPad P16 G2 21FA000FGE | |
| Lenovo ThinkPad P16 G1 RTX A5500 | |
| HP ZBook Power 16 G11 A | |
| Lenovo ThinkPad P16s G2 21K9000CGE | |
| PCMark 10 / Productivity | |
| Dell Precision 5690 | |
| Lenovo ThinkPad P16 Gen 2 | |
| Gemiddeld Intel Core i7-14700HX, NVIDIA RTX 4000 Ada Generation Laptop (n=1) | |
| HP ZBook Power 16 G11 A | |
| Lenovo ThinkPad P16 G1 RTX A5500 | |
| Lenovo ThinkPad P16 G2 21FA000FGE | |
| Lenovo ThinkPad P16s G2 21K9000CGE | |
| PCMark 10 / Digital Content Creation | |
| Lenovo ThinkPad P16 Gen 2 | |
| Gemiddeld Intel Core i7-14700HX, NVIDIA RTX 4000 Ada Generation Laptop (n=1) | |
| Dell Precision 5690 | |
| HP ZBook Power 16 G11 A | |
| Lenovo ThinkPad P16 G1 RTX A5500 | |
| Lenovo ThinkPad P16 G2 21FA000FGE | |
| Lenovo ThinkPad P16s G2 21K9000CGE | |
| CrossMark / Overall | |
| Lenovo ThinkPad P16 Gen 2 | |
| Gemiddeld Intel Core i7-14700HX, NVIDIA RTX 4000 Ada Generation Laptop (n=1) | |
| Lenovo ThinkPad P16 G1 RTX A5500 | |
| Lenovo ThinkPad P16 G2 21FA000FGE | |
| Dell Precision 5690 | |
| HP ZBook Power 16 G11 A | |
| Lenovo ThinkPad P16s G2 21K9000CGE | |
| CrossMark / Productivity | |
| Lenovo ThinkPad P16 Gen 2 | |
| Gemiddeld Intel Core i7-14700HX, NVIDIA RTX 4000 Ada Generation Laptop (n=1) | |
| Lenovo ThinkPad P16 G1 RTX A5500 | |
| Dell Precision 5690 | |
| Lenovo ThinkPad P16 G2 21FA000FGE | |
| HP ZBook Power 16 G11 A | |
| Lenovo ThinkPad P16s G2 21K9000CGE | |
| CrossMark / Creativity | |
| Lenovo ThinkPad P16 Gen 2 | |
| Gemiddeld Intel Core i7-14700HX, NVIDIA RTX 4000 Ada Generation Laptop (n=1) | |
| Lenovo ThinkPad P16 G1 RTX A5500 | |
| Lenovo ThinkPad P16 G2 21FA000FGE | |
| HP ZBook Power 16 G11 A | |
| Dell Precision 5690 | |
| Lenovo ThinkPad P16s G2 21K9000CGE | |
| CrossMark / Responsiveness | |
| Lenovo ThinkPad P16 Gen 2 | |
| Gemiddeld Intel Core i7-14700HX, NVIDIA RTX 4000 Ada Generation Laptop (n=1) | |
| Dell Precision 5690 | |
| Lenovo ThinkPad P16 G1 RTX A5500 | |
| Lenovo ThinkPad P16 G2 21FA000FGE | |
| HP ZBook Power 16 G11 A | |
| Lenovo ThinkPad P16s G2 21K9000CGE | |
| WebXPRT 3 / Overall | |
| Lenovo ThinkPad P16 Gen 2 | |
| Gemiddeld Intel Core i7-14700HX, NVIDIA RTX 4000 Ada Generation Laptop (n=1) | |
| Lenovo ThinkPad P16 G2 21FA000FGE | |
| Lenovo ThinkPad P16 G1 RTX A5500 | |
| HP ZBook Power 16 G11 A | |
| Dell Precision 5690 | |
| Lenovo ThinkPad P16s G2 21K9000CGE | |
| WebXPRT 4 / Overall | |
| Lenovo ThinkPad P16 Gen 2 | |
| Gemiddeld Intel Core i7-14700HX, NVIDIA RTX 4000 Ada Generation Laptop (n=1) | |
| Lenovo ThinkPad P16 G1 RTX A5500 | |
| Dell Precision 5690 | |
| HP ZBook Power 16 G11 A | |
| Mozilla Kraken 1.1 / Total | |
| Lenovo ThinkPad P16s G2 21K9000CGE | |
| HP ZBook Power 16 G11 A | |
| Dell Precision 5690 | |
| Lenovo ThinkPad P16 G1 RTX A5500 | |
| Lenovo ThinkPad P16 G2 21FA000FGE | |
| Lenovo ThinkPad P16 Gen 2 | |
| Gemiddeld Intel Core i7-14700HX, NVIDIA RTX 4000 Ada Generation Laptop (n=1) | |
* ... kleiner is beter
| PCMark 10 Score | 8353 punten | |
Help | ||
| AIDA64 / Memory Copy | |
| Dell Precision 5690 | |
| Gemiddeld Intel Core i7-14700HX (41617 - 78742, n=9) | |
| Lenovo ThinkPad P16s G2 21K9000CGE | |
| Lenovo ThinkPad P16 Gen 2 | |
| Lenovo ThinkPad P16 G1 RTX A5500 | |
| HP ZBook Power 16 G11 A | |
| Lenovo ThinkPad P16 G2 21FA000FGE | |
| AIDA64 / Memory Read | |
| Dell Precision 5690 | |
| Gemiddeld Intel Core i7-14700HX (46627 - 86175, n=9) | |
| Lenovo ThinkPad P16 Gen 2 | |
| Lenovo ThinkPad P16 G1 RTX A5500 | |
| HP ZBook Power 16 G11 A | |
| Lenovo ThinkPad P16 G2 21FA000FGE | |
| Lenovo ThinkPad P16s G2 21K9000CGE | |
| AIDA64 / Memory Write | |
| Lenovo ThinkPad P16s G2 21K9000CGE | |
| HP ZBook Power 16 G11 A | |
| Dell Precision 5690 | |
| Gemiddeld Intel Core i7-14700HX (39155 - 76976, n=9) | |
| Lenovo ThinkPad P16 Gen 2 | |
| Lenovo ThinkPad P16 G1 RTX A5500 | |
| Lenovo ThinkPad P16 G2 21FA000FGE | |
| AIDA64 / Memory Latency | |
| Dell Precision 5690 | |
| Lenovo ThinkPad P16s G2 21K9000CGE | |
| Lenovo ThinkPad P16 G2 21FA000FGE | |
| HP ZBook Power 16 G11 A | |
| Lenovo ThinkPad P16 Gen 2 | |
| Lenovo ThinkPad P16 G1 RTX A5500 | |
| Gemiddeld Intel Core i7-14700HX (82.7 - 96.4, n=9) | |
* ... kleiner is beter
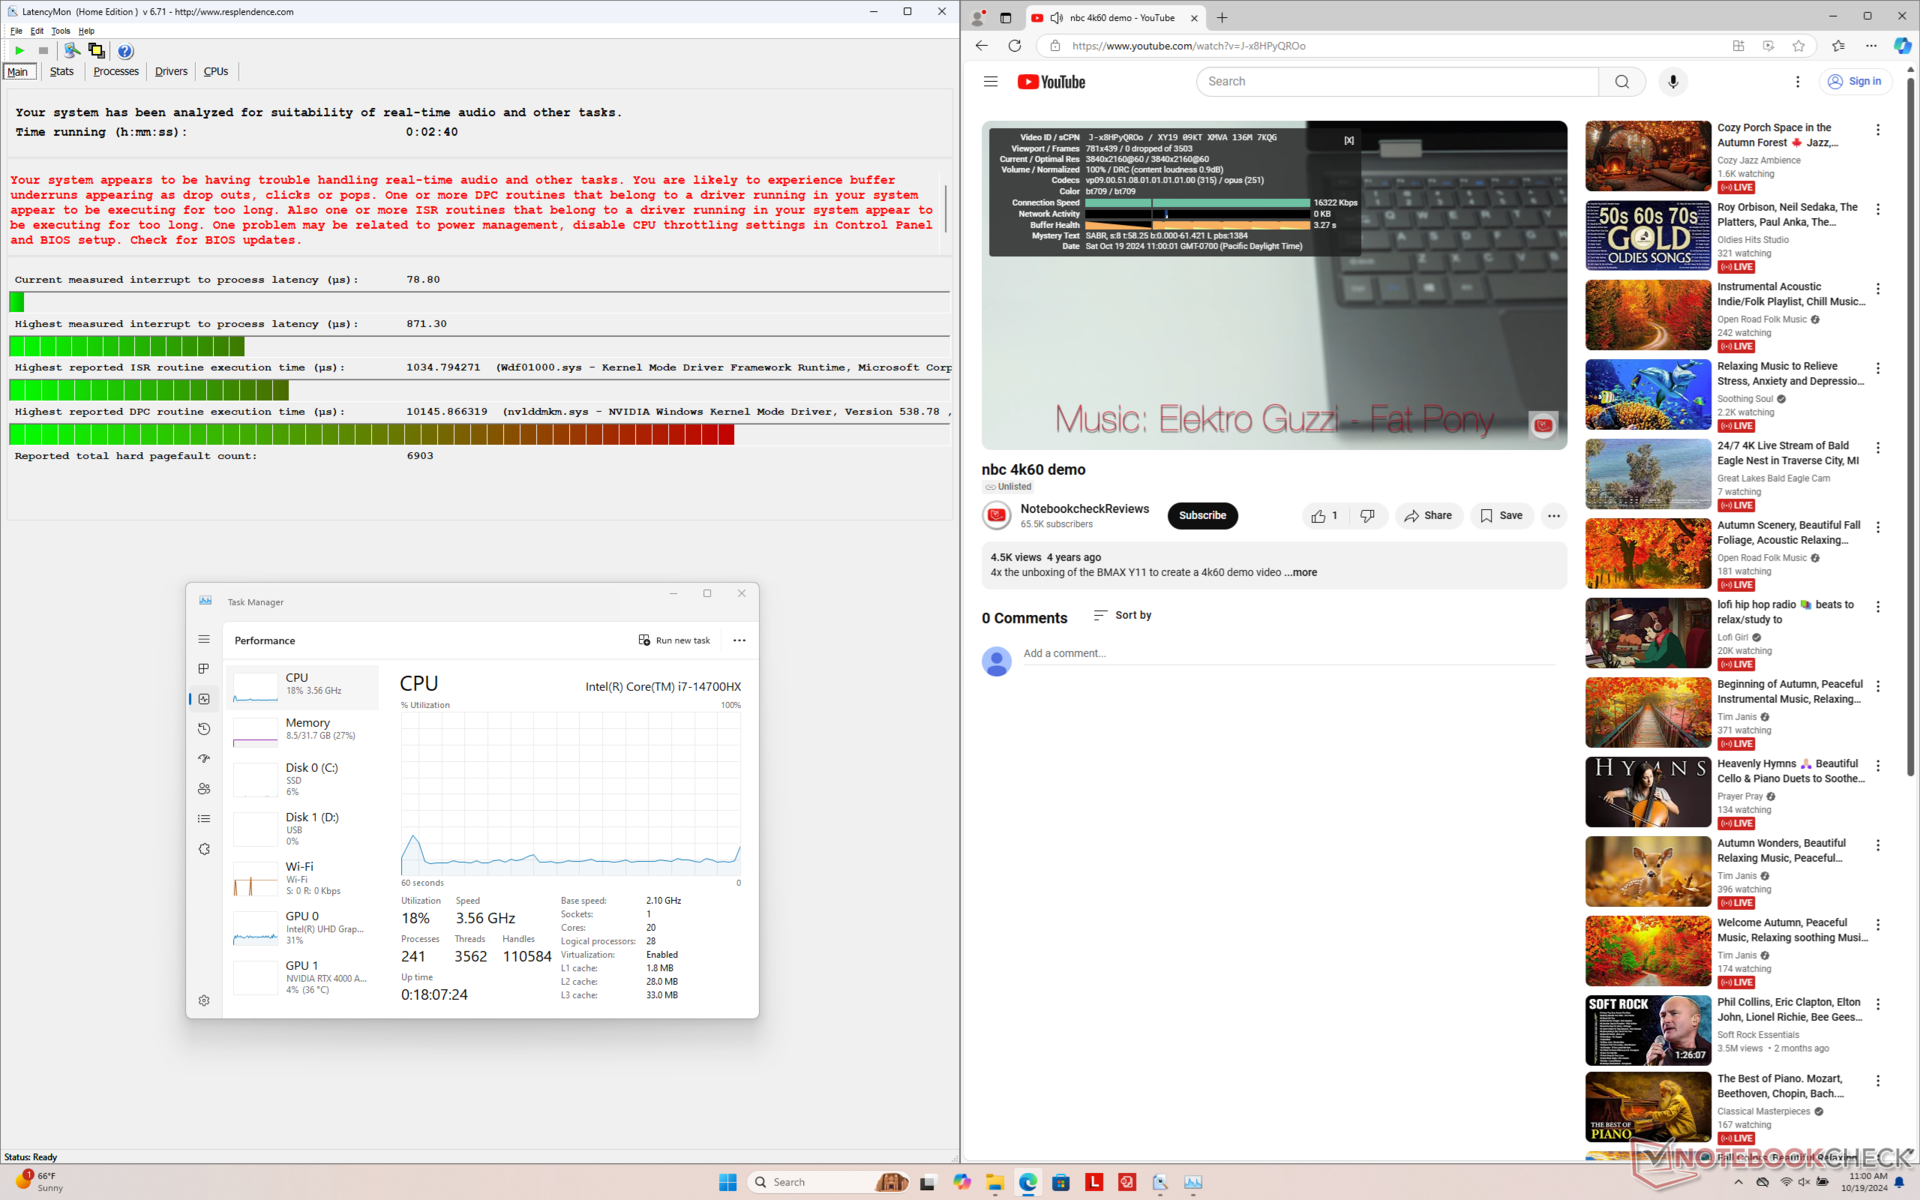
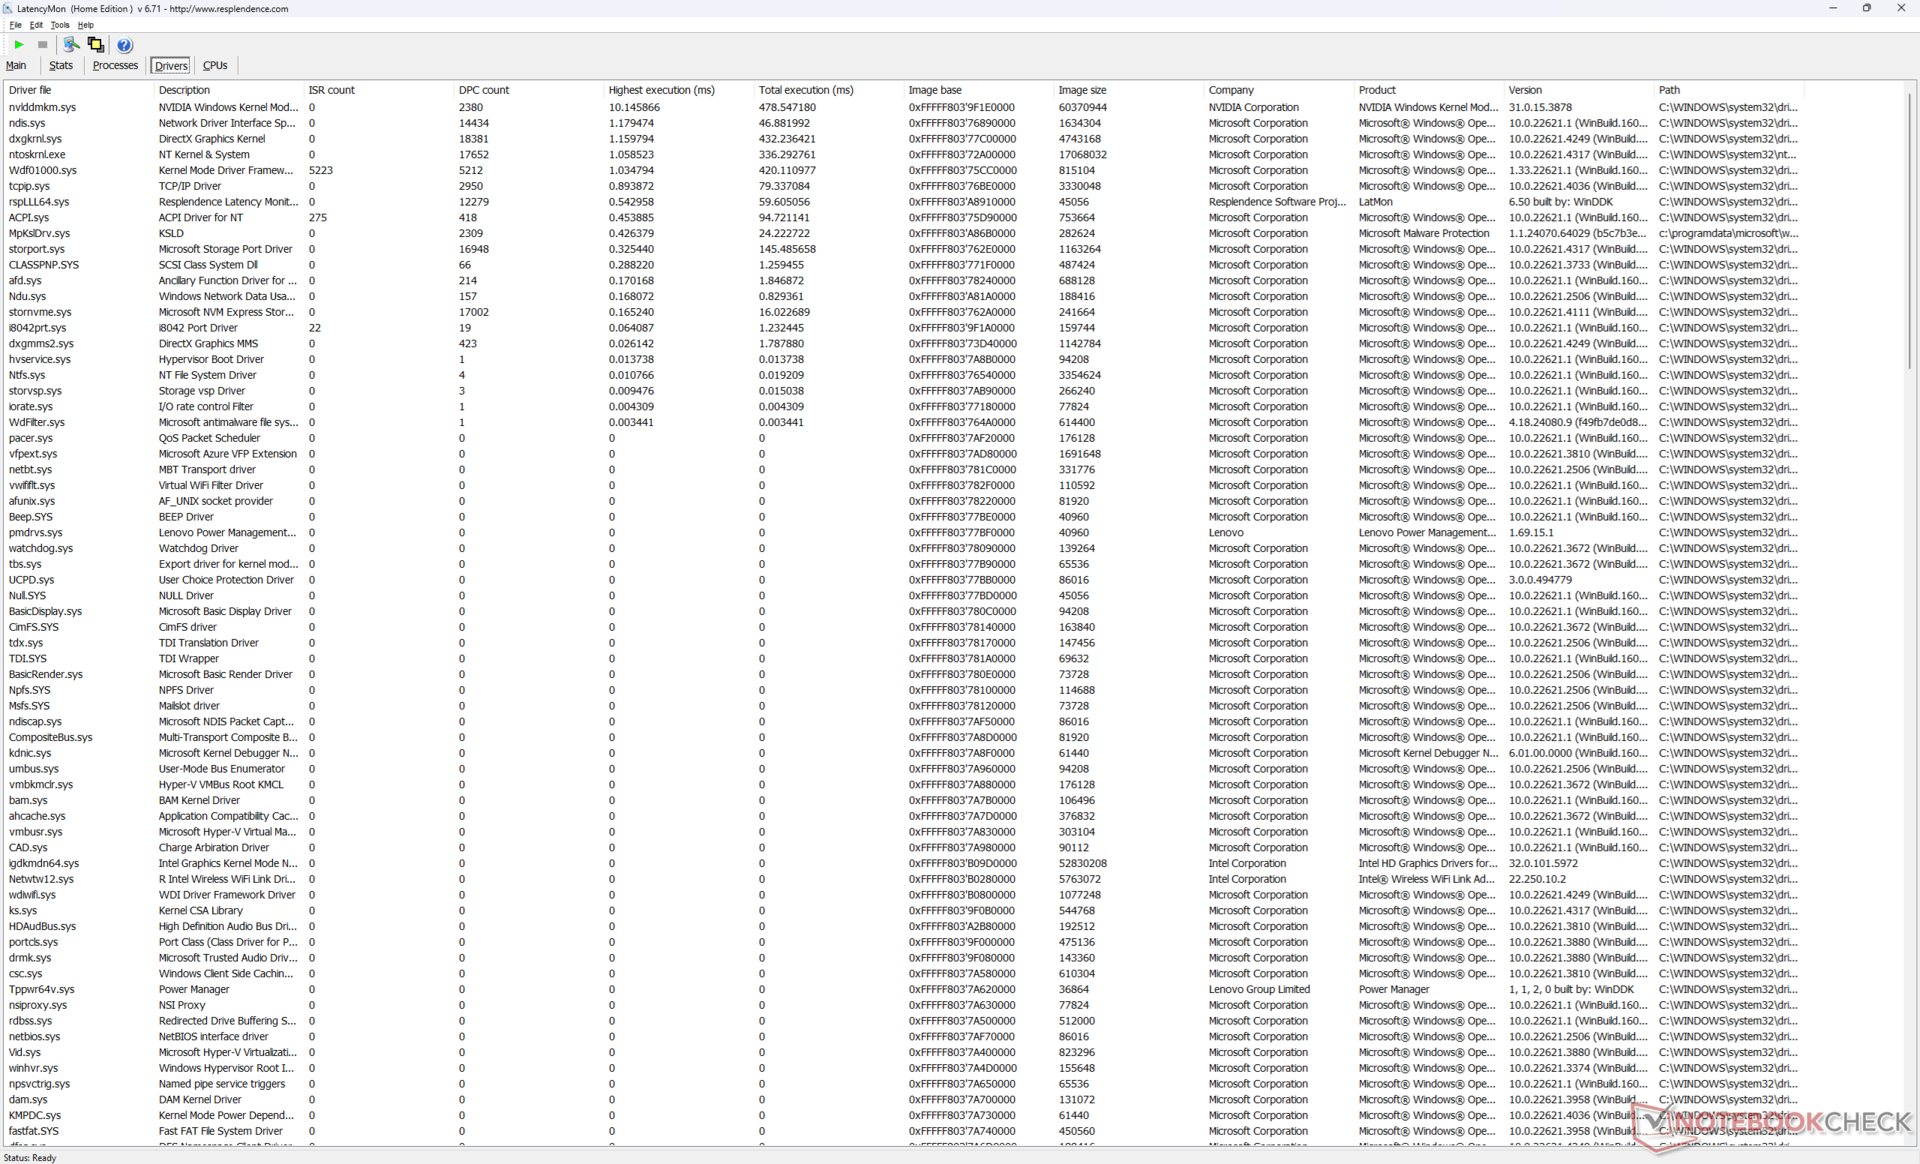
DPC latentie
LatencyMon laat lichte DPC-problemen zien bij het openen van meerdere browsertabbladen van onze startpagina. het afspelen van 4K-video's met 60 FPS verloopt verder perfect, zonder dropped frames.
| DPC Latencies / LatencyMon - interrupt to process latency (max), Web, Youtube, Prime95 | |
| HP ZBook Power 16 G11 A | |
| Lenovo ThinkPad P16 G1 RTX A5500 | |
| Lenovo ThinkPad P16s G2 21K9000CGE | |
| Lenovo ThinkPad P16 G2 21FA000FGE | |
| Lenovo ThinkPad P16 Gen 2 | |
| Dell Precision 5690 | |
* ... kleiner is beter
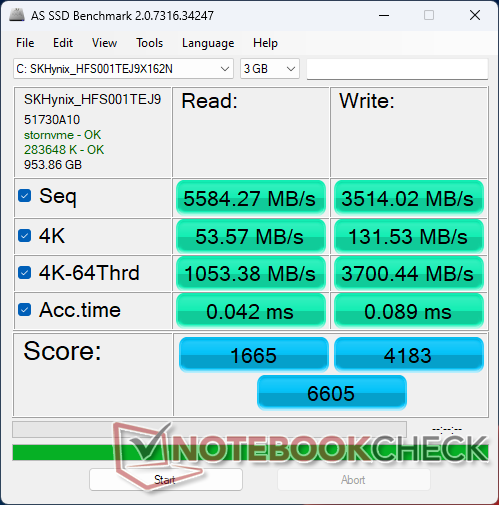
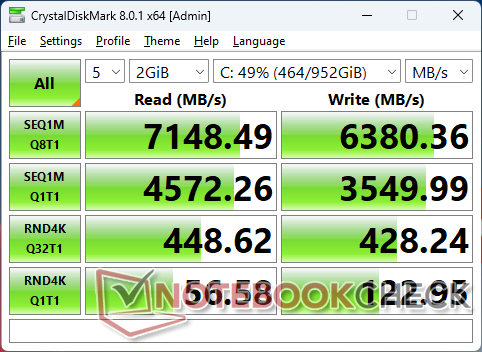
Opslagapparaten
Tussen onze twee ThinkPad P16 Gen 2-testunits zijn geen wijzigingen in de opslagopties of SSD-prestaties waargenomen.

* ... kleiner is beter
Disk Throttling: DiskSpd Read Loop, Queue Depth 8
GPU-prestaties
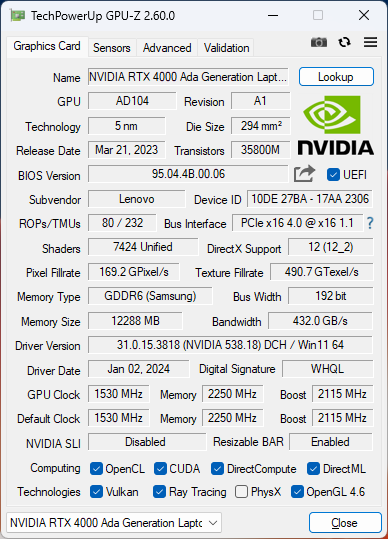
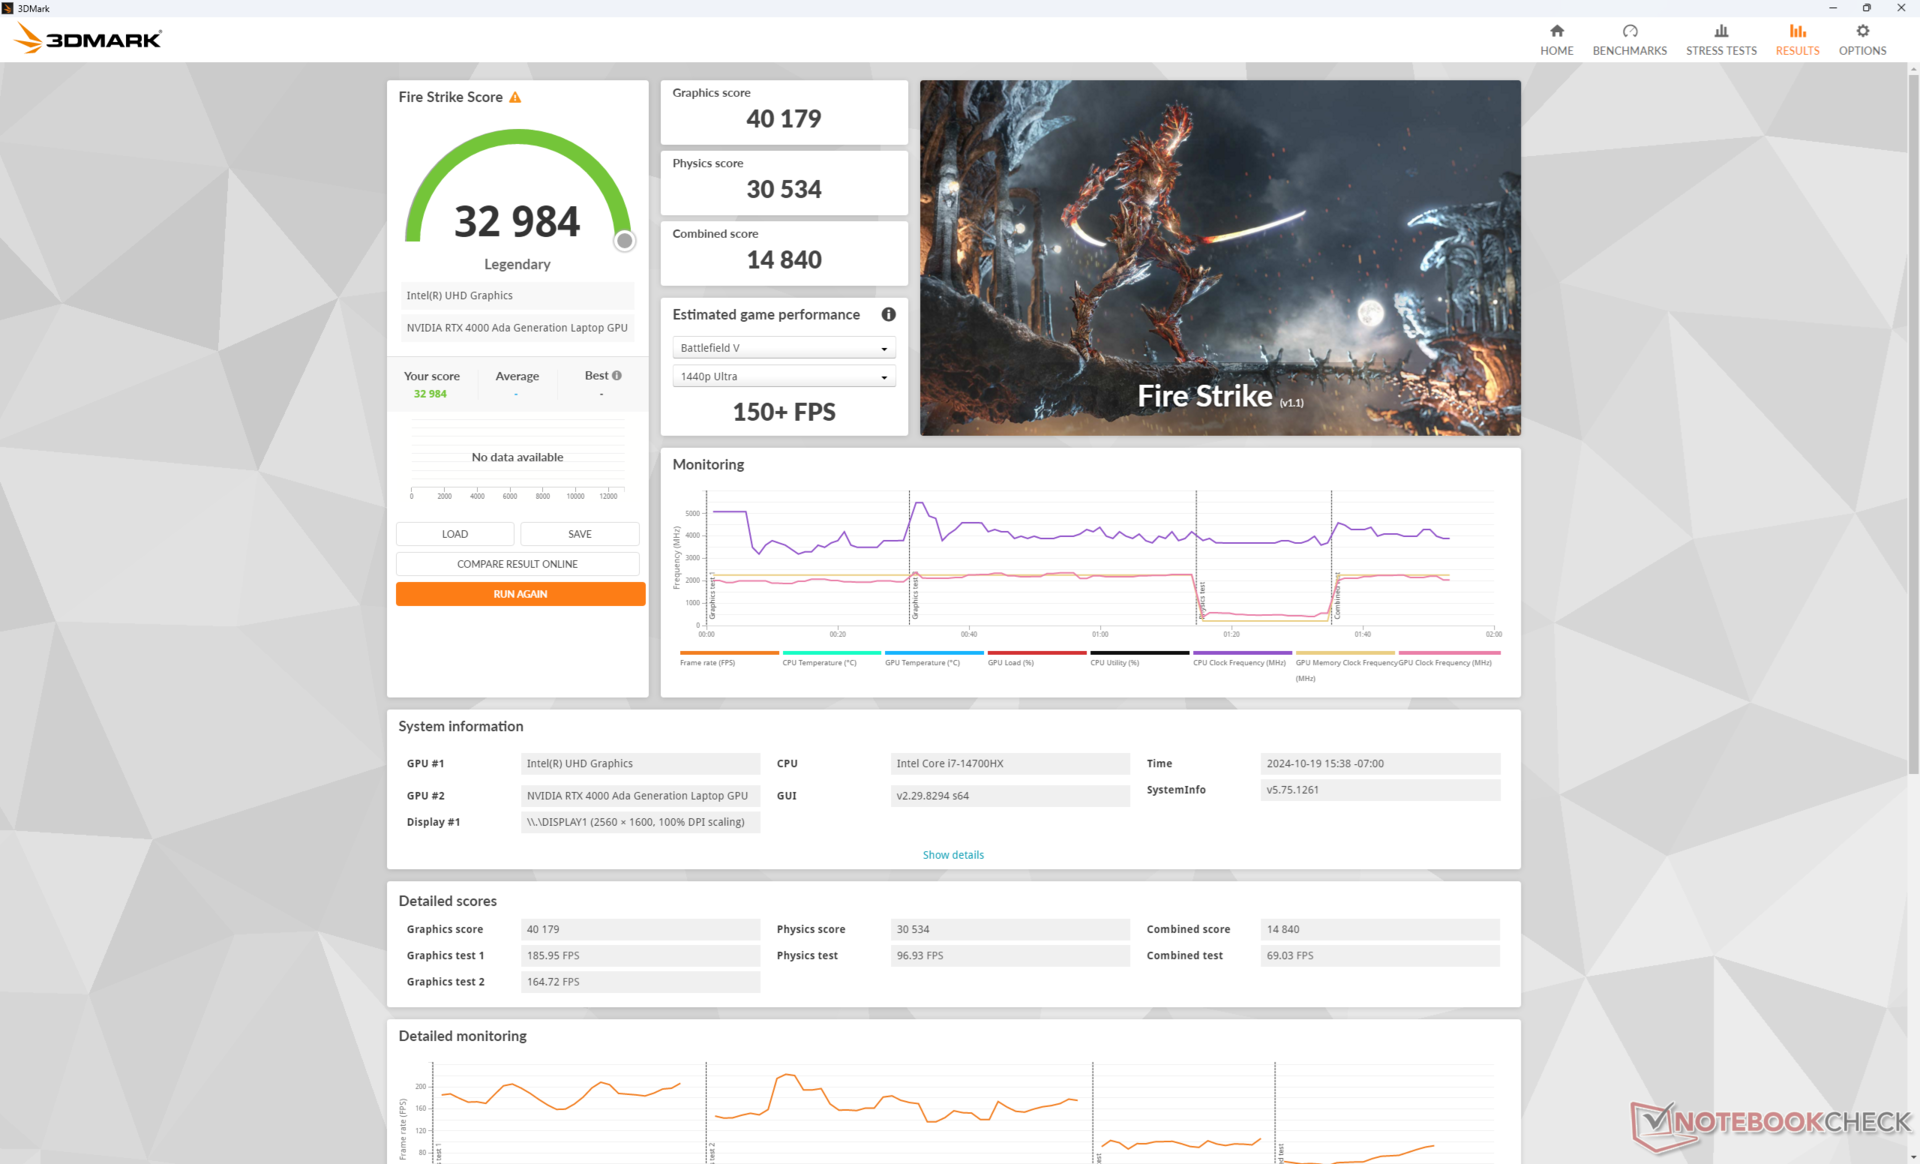
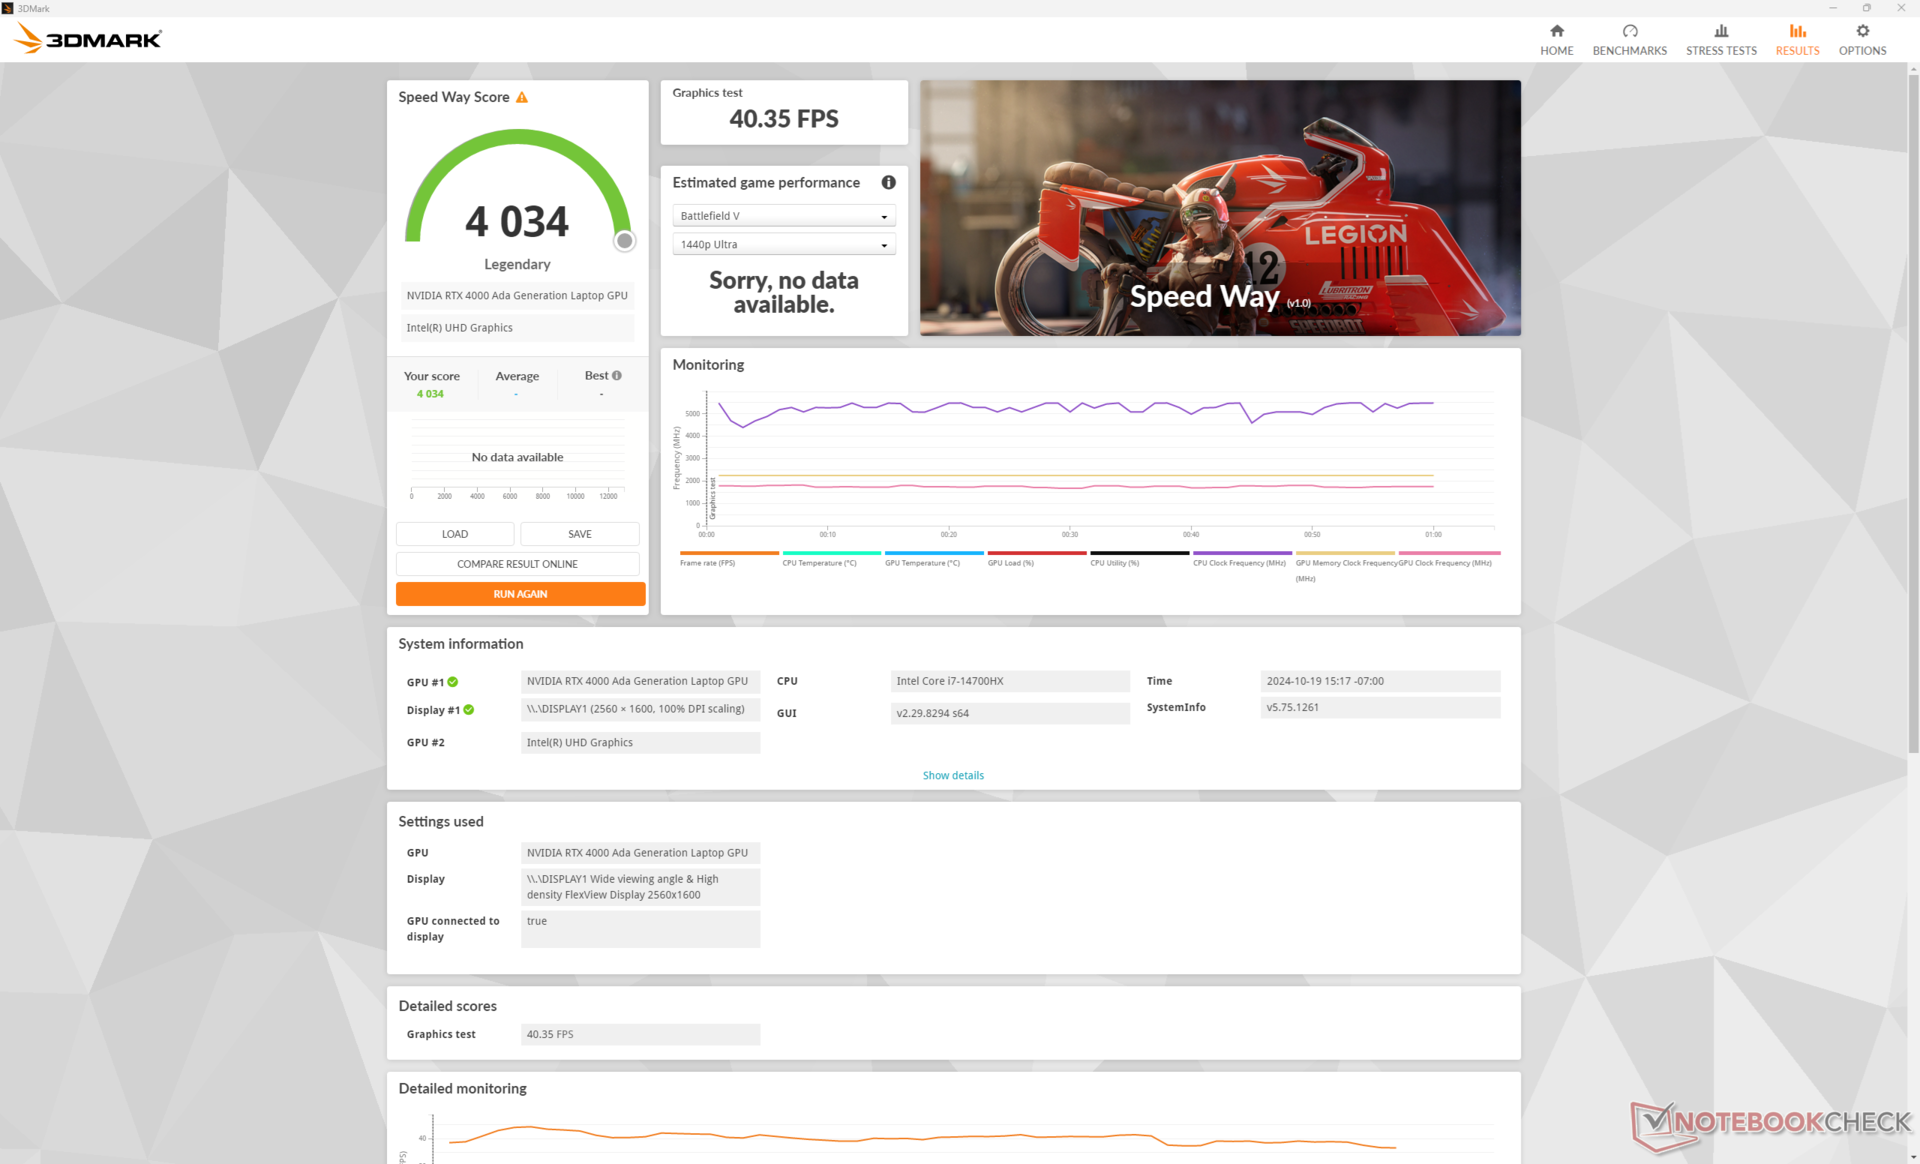
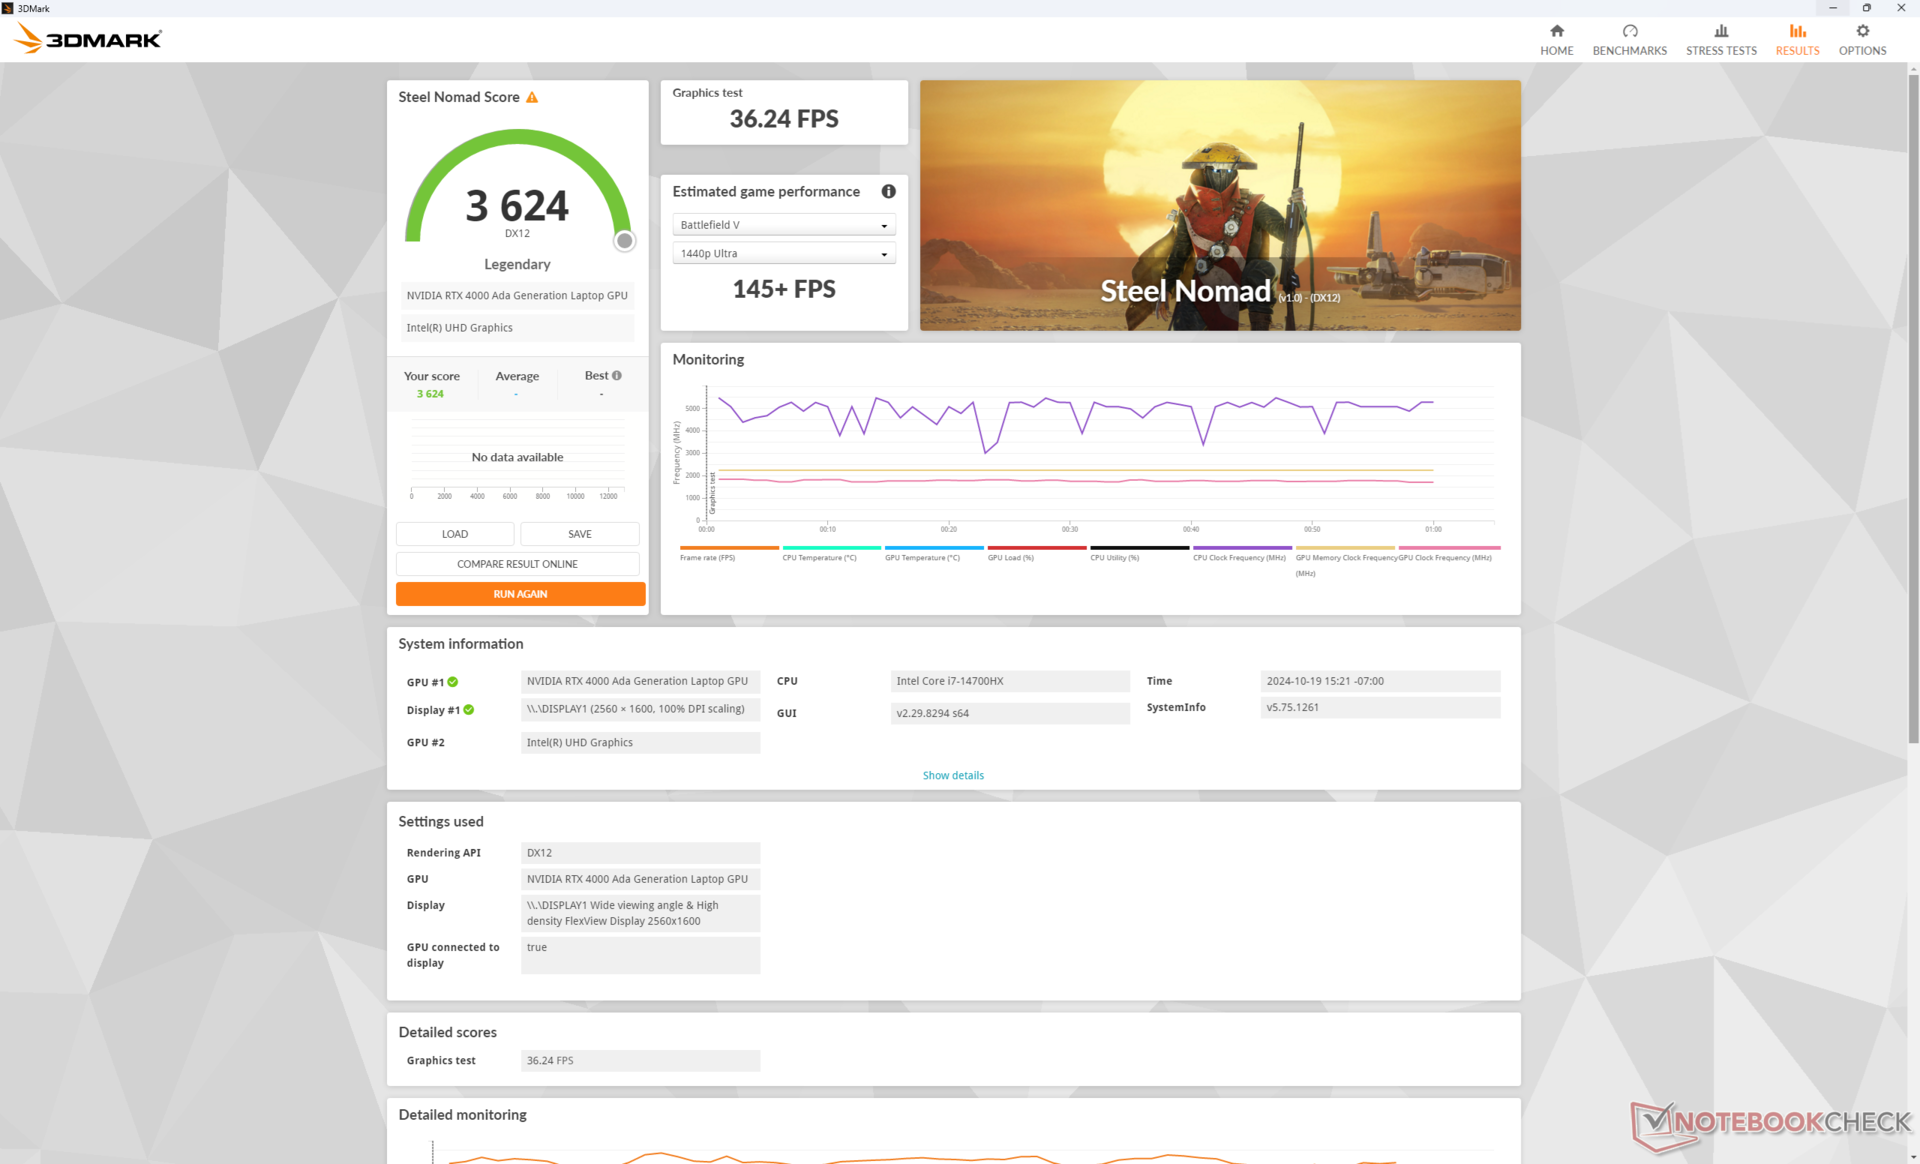
De 130 W RTX 4000 Ada in onze Lenovo is zeer krachtig voor een mobiele GPU die zelfs de 95 W RTX 5000 Ada in de Precision 5690 met gezonde marges. 3DMark-resultaten zijn bijvoorbeeld 10 tot 40 procent hoger en soortgelijke resultaten kunnen worden verkregen bij het uitvoeren van SpecViewPerf.
| Vermogen | Grafische Score | Fysieke Score | Gecombineerde Score |
| Prestatiemodus | 40179 | 30534 | 14840 |
| Evenwichtige modus | 32889 (-18%) | 29923 (-2%) | 13007 (-12%) |
| Batterij-modus | 23401 (-42%) | 27793 (-9%) | 8510 (-42%) |
Het terugschakelen van de modus Prestaties naar de modus Gebalanceerd heeft een enigszins significante invloed op de grafische prestaties, zoals onze bovenstaande tabel met Fire Strike resultaten laat zien.
| 3DMark Performance rating - Percent | |
| Lenovo ThinkPad P16 Gen 2 -3! | |
| Gemiddeld NVIDIA RTX 4000 Ada Generation Laptop -3! | |
| Dell Precision 5690 -3! | |
| HP ZBook Fury 16 G11 | |
| HP ZBook Fury 16 G9 -3! | |
| Dell Precision 5000 5490 -3! | |
| MSI CreatorPro Z16P B12UKST -19! | |
| HP ZBook Power 15 G10 -11! | |
| Asus ExpertBook B6 Flip B6602FC2 -19! | |
| Lenovo ThinkPad P16v G1 AMD -18! | |
| Lenovo ThinkPad P1 G4-20Y4Z9DVUS -19! | |
| Lenovo ThinkPad P16s G2 21K9000CGE -19! | |
| HP ZBook Firefly 16 G9-6B897EA -19! | |
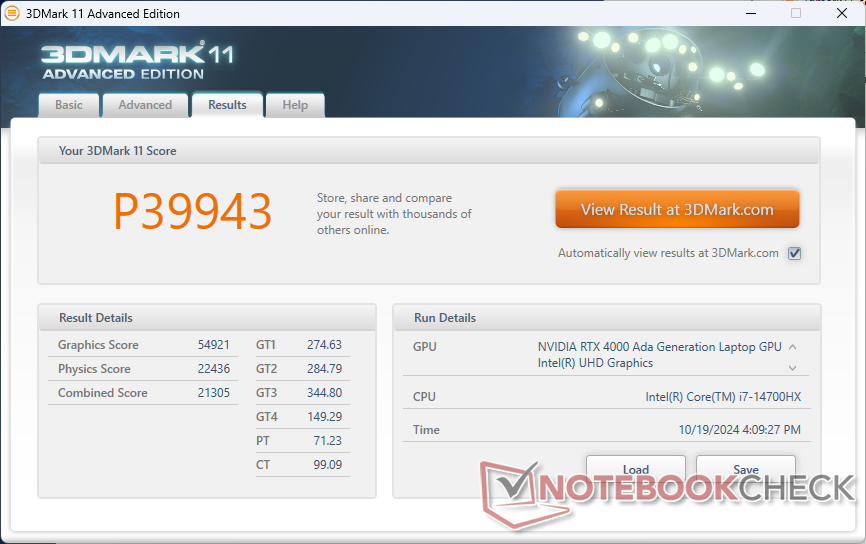
| 3DMark 11 Performance | 39943 punten | |
| 3DMark Cloud Gate Standard Score | 61459 punten | |
| 3DMark Fire Strike Score | 32984 punten | |
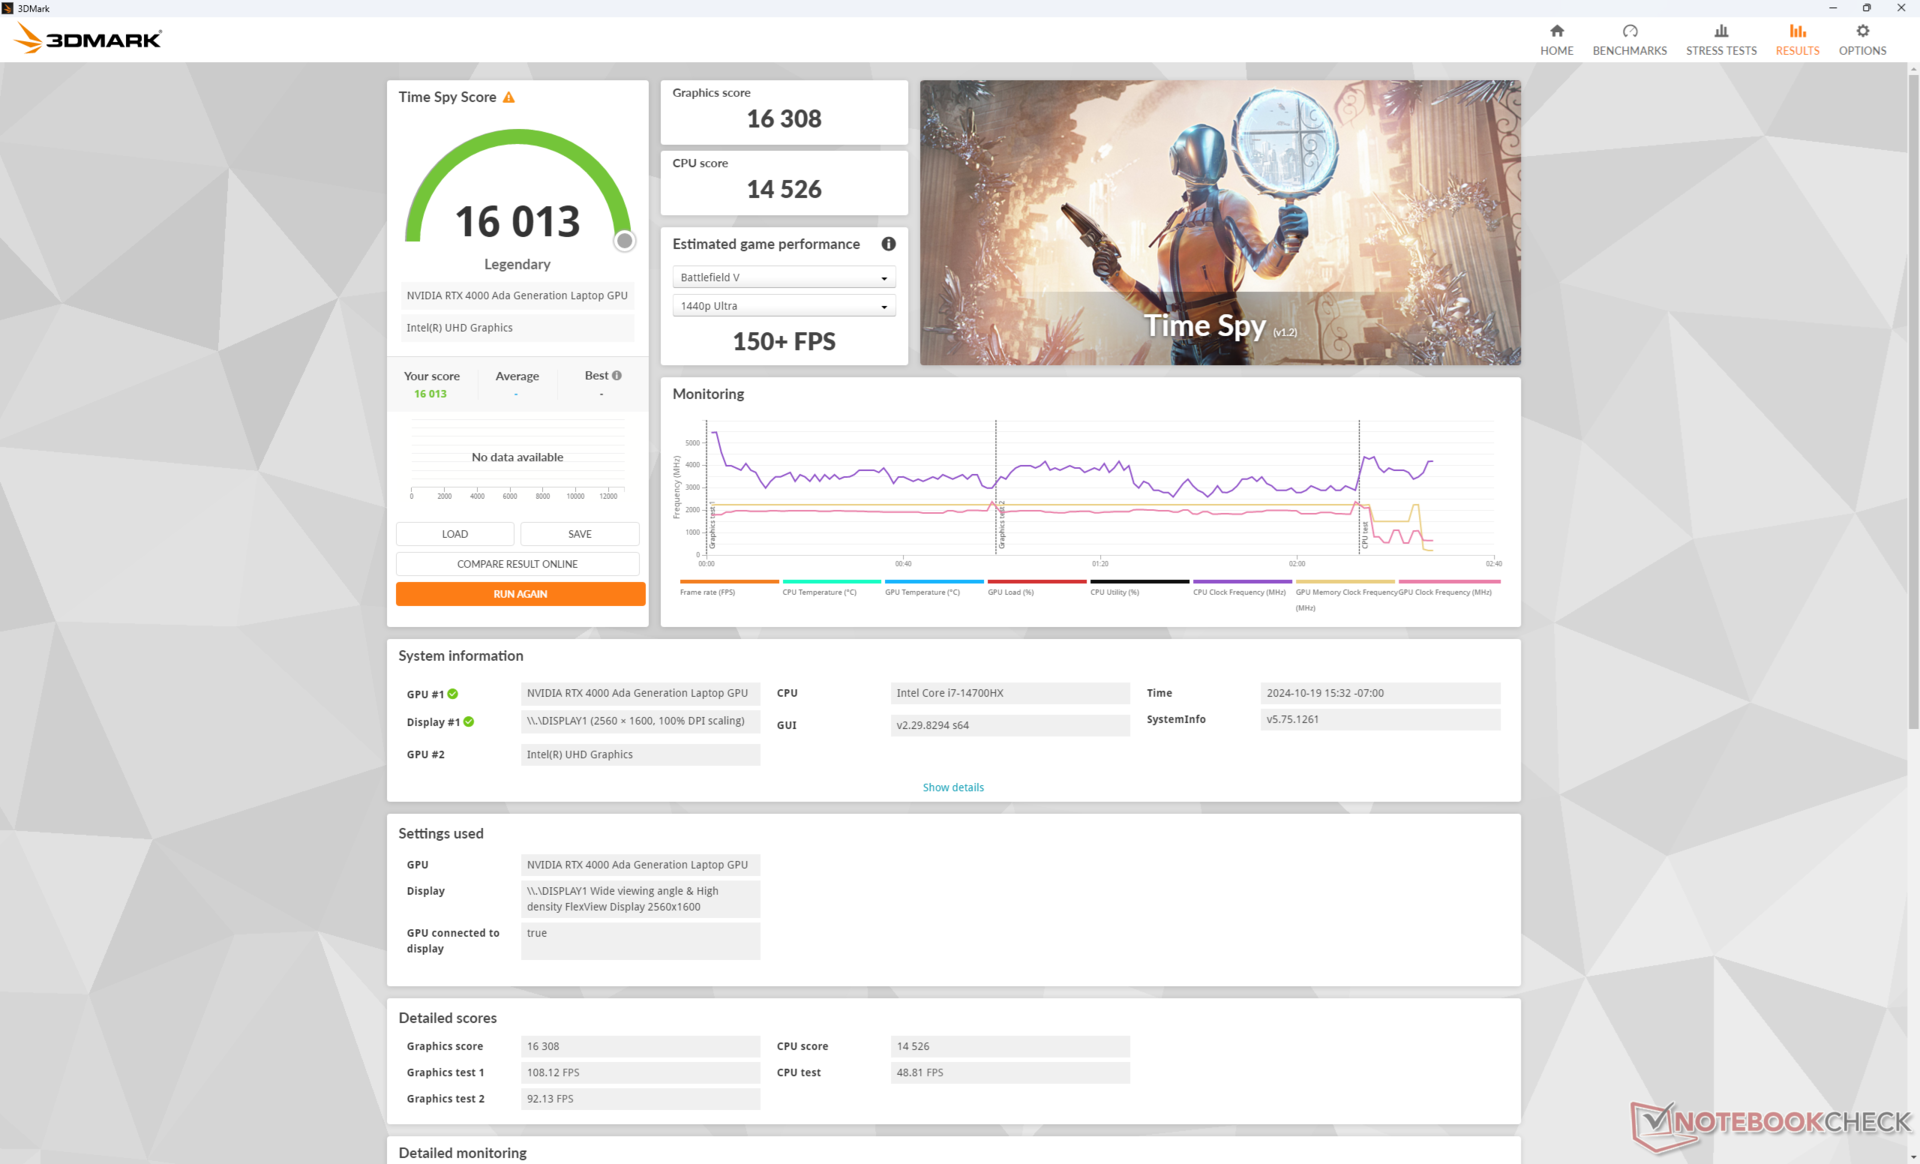
| 3DMark Time Spy Score | 16013 punten | |
| 3DMark Steel Nomad Score | 3624 punten | |
Help | ||
* ... kleiner is beter
Gaming prestaties
Hoewel de RTX 4000 Ada niet geoptimaliseerd is voor gamen, is het toch een krachtpatser, zeker gezien het TGP-plafond van 130 W. De gamingprestaties komen het meest overeen met die van een high-end gaminglaptop die draait op de mobiele GeForce RTX 4080.
| Performance rating - Percent | |
| Lenovo ThinkPad P16 Gen 2 | |
| Dell Precision 5690 -1! | |
| Lenovo ThinkPad P16 G1 RTX A5500 -1! | |
| Lenovo ThinkPad P16 G2 21FA000FGE -1! | |
| HP ZBook Power 16 G11 A | |
| Lenovo ThinkPad P16s G2 21K9000CGE -1! | |
| Baldur's Gate 3 - 1920x1080 Ultra Preset AA:T | |
| Lenovo ThinkPad P16 Gen 2 | |
| Dell Precision 5690 | |
| HP ZBook Power 16 G11 A | |
| GTA V - 1920x1080 Highest AA:4xMSAA + FX AF:16x | |
| Lenovo ThinkPad P16 Gen 2 | |
| Lenovo ThinkPad P16 G1 RTX A5500 | |
| Lenovo ThinkPad P16 G2 21FA000FGE | |
| HP ZBook Power 16 G11 A | |
| Lenovo ThinkPad P16s G2 21K9000CGE | |
| Final Fantasy XV Benchmark - 1920x1080 High Quality | |
| Lenovo ThinkPad P16 Gen 2 | |
| Dell Precision 5690 | |
| Lenovo ThinkPad P16 G1 RTX A5500 | |
| Lenovo ThinkPad P16 G2 21FA000FGE | |
| HP ZBook Power 16 G11 A | |
| Lenovo ThinkPad P16s G2 21K9000CGE | |
| Strange Brigade - 1920x1080 ultra AA:ultra AF:16 | |
| Lenovo ThinkPad P16 Gen 2 | |
| Dell Precision 5690 | |
| Lenovo ThinkPad P16 G1 RTX A5500 | |
| Lenovo ThinkPad P16 G2 21FA000FGE | |
| HP ZBook Power 16 G11 A | |
| Lenovo ThinkPad P16s G2 21K9000CGE | |
| Dota 2 Reborn - 1920x1080 ultra (3/3) best looking | |
| Lenovo ThinkPad P16 Gen 2 | |
| Lenovo ThinkPad P16 G1 RTX A5500 | |
| Lenovo ThinkPad P16 G2 21FA000FGE | |
| Dell Precision 5690 | |
| HP ZBook Power 16 G11 A | |
| Lenovo ThinkPad P16s G2 21K9000CGE | |
| Baldur's Gate 3 | |
| 1920x1080 High Preset AA:T | |
| Lenovo ThinkPad P16 Gen 2 | |
| Gemiddeld NVIDIA RTX 4000 Ada Generation Laptop (n=1) | |
| Dell Precision 5690 | |
| HP ZBook Fury 16 G11 | |
| Dell Precision 5000 5490 | |
| 1920x1080 Ultra Preset AA:T | |
| Lenovo ThinkPad P16 Gen 2 | |
| Gemiddeld NVIDIA RTX 4000 Ada Generation Laptop (n=1) | |
| Dell Precision 5690 | |
| HP ZBook Fury 16 G11 | |
| Dell Precision 5000 5490 | |
| 2560x1440 Ultra Preset AA:T | |
| Dell Precision 5690 | |
| Lenovo ThinkPad P16 Gen 2 | |
| Gemiddeld NVIDIA RTX 4000 Ada Generation Laptop (n=1) | |
| HP ZBook Fury 16 G11 | |
Helaas is er een licht prestatieverlies bij het uitvoeren van Cyberpunk 2077. De framerates daalden van ~103 naar ~96 na slechts een paar minuten stationair draaien in het spel en de resultaten verbeterden niet na herhaalde tests. Dit suggereert dat de GPU mogelijk baat zou hebben gehad bij een betere koeling.
Cyberpunk 2077 ultra FPS Chart
| lage | gem. | hoge | ultra | QHD | |
|---|---|---|---|---|---|
| GTA V (2015) | 185.8 | 183.9 | 179.4 | 125.6 | 118.7 |
| Dota 2 Reborn (2015) | 215.4 | 189.7 | 185.2 | 164.4 | |
| Final Fantasy XV Benchmark (2018) | 207 | 185.3 | 150 | 119.5 | |
| X-Plane 11.11 (2018) | 166.8 | 144 | 113.1 | ||
| Far Cry 5 (2018) | 168 | 148 | 138 | 128 | 125 |
| Strange Brigade (2018) | 452 | 372 | 323 | 292 | 210 |
| Tiny Tina's Wonderlands (2022) | 275.4 | 232.6 | 171.4 | 137.1 | 92 |
| F1 22 (2022) | 275 | 264 | 238 | 95.5 | 65.7 |
| Baldur's Gate 3 (2023) | 178.3 | 160.6 | 141.6 | 137 | 90.7 |
| Cyberpunk 2077 (2023) | 129.3 | 115.1 | 108.4 | 98.3 | 68.5 |
Uitstoot - Luid en krachtig
Systeemgeluid
De ventilatoren in onze eenheid hebben de neiging om sneller in RPM en geluid te stijgen in vergelijking met onze mindere RTX 2000 Ada configuratie. Eigenaars kunnen dus meer pulserende ventilatoren en veranderingen in het ventilatorgeluid verwachten bij verschillende soorten belastingen. Veeleisende belastingen zoals games zorgen voor een ventilatorgeluid van 53 dB(A), een van de luidste 16-inch werkstations die we getest hebben.
Door Cyberpunk 2077 in de modus Balanced te draaien in plaats van in de modus Performance, zou het ventilatorgeluid merkbaar afnemen van 52,8 dB(A) tot 47,9 dB(A). Dit gaat echter ten koste van de prestaties, zoals hierboven in het gedeelte over GPU-prestaties is aangegeven.
Geluidsniveau
| Onbelast |
| 29.1 / 29.1 / 29.1 dB (A) |
| Belasting |
| 41 / 52.9 dB (A) |
 | ||
30 dB stil 40 dB(A) hoorbaar 50 dB(A) luid |
||
min: | ||
| Lenovo ThinkPad P16 Gen 2 RTX 4000 Ada Generation Laptop, i7-14700HX, SK hynix PC801 HFS001TEJ9X162N | Lenovo ThinkPad P16 G2 21FA000FGE RTX 2000 Ada Generation Laptop, i7-13700HX, SK hynix PC801 HFS001TEJ9X162N | Lenovo ThinkPad P16s G2 21K9000CGE Radeon 780M, R7 PRO 7840U, SK hynix PC801 HFS001TEJ9X162N | Lenovo ThinkPad P16 G1 RTX A5500 RTX A5500 Laptop GPU, i9-12950HX, WDC PC SN810 2TB | HP ZBook Power 16 G11 A RTX 2000 Ada Generation Laptop, R7 8845HS, Samsung PM9A1 MZVL22T0HBLB | Dell Precision 5690 RTX 5000 Ada Generation Laptop, Ultra 9 185H, 2x Samsung PM9A1 1TB (RAID 0) | |
|---|---|---|---|---|---|---|
| Noise | 6% | 17% | 17% | 18% | 5% | |
| uit / omgeving * (dB) | 23.9 | 23.5 2% | 22.6 5% | 23.1 3% | 23.5 2% | 23.4 2% |
| Idle Minimum * (dB) | 29.1 | 23.5 19% | 22.6 22% | 23.1 21% | 23.8 18% | 23.6 19% |
| Idle Average * (dB) | 29.1 | 29.2 -0% | 22.6 22% | 23.1 21% | 24.2 17% | 24.9 14% |
| Idle Maximum * (dB) | 29.1 | 29.5 -1% | 22.6 22% | 23.1 21% | 24.2 17% | 30.9 -6% |
| Load Average * (dB) | 41 | 32.7 20% | 37.8 8% | 28.9 30% | 25.4 38% | 40.4 1% |
| Cyberpunk 2077 ultra * (dB) | 52.8 | 43 19% | ||||
| Load Maximum * (dB) | 52.9 | 56.6 -7% | 40.5 23% | 51.4 3% | 45 15% | 51.9 2% |
| Witcher 3 ultra * (dB) | 50.6 | 40.3 | 51.6 | 48.3 |
* ... kleiner is beter
Temperatuur
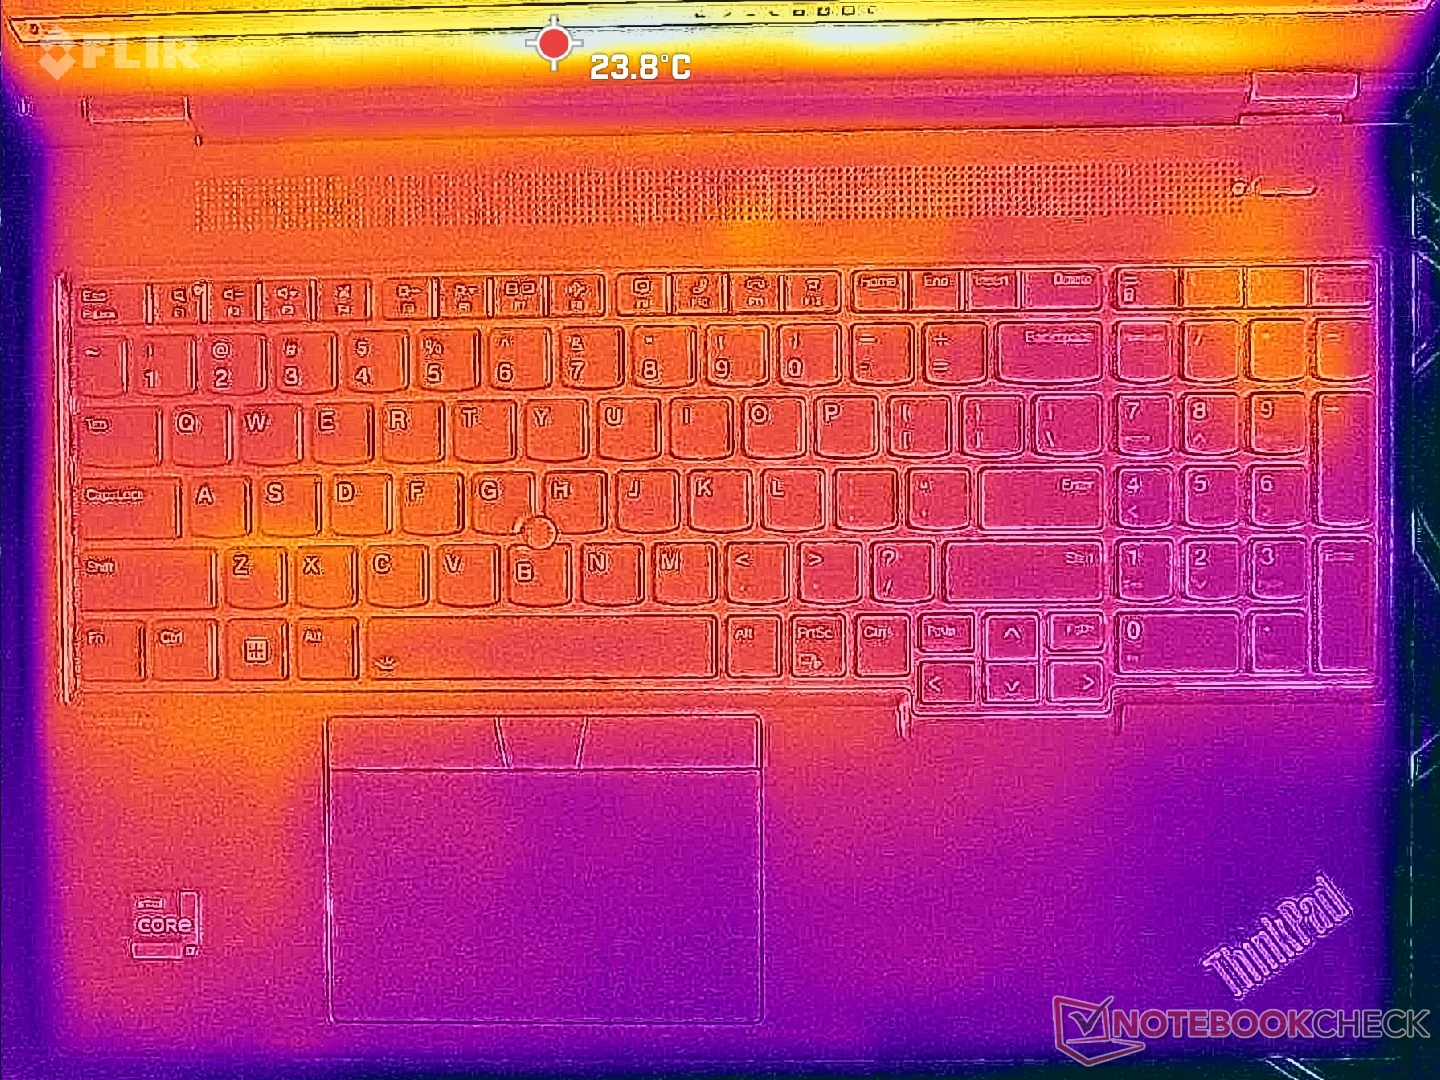
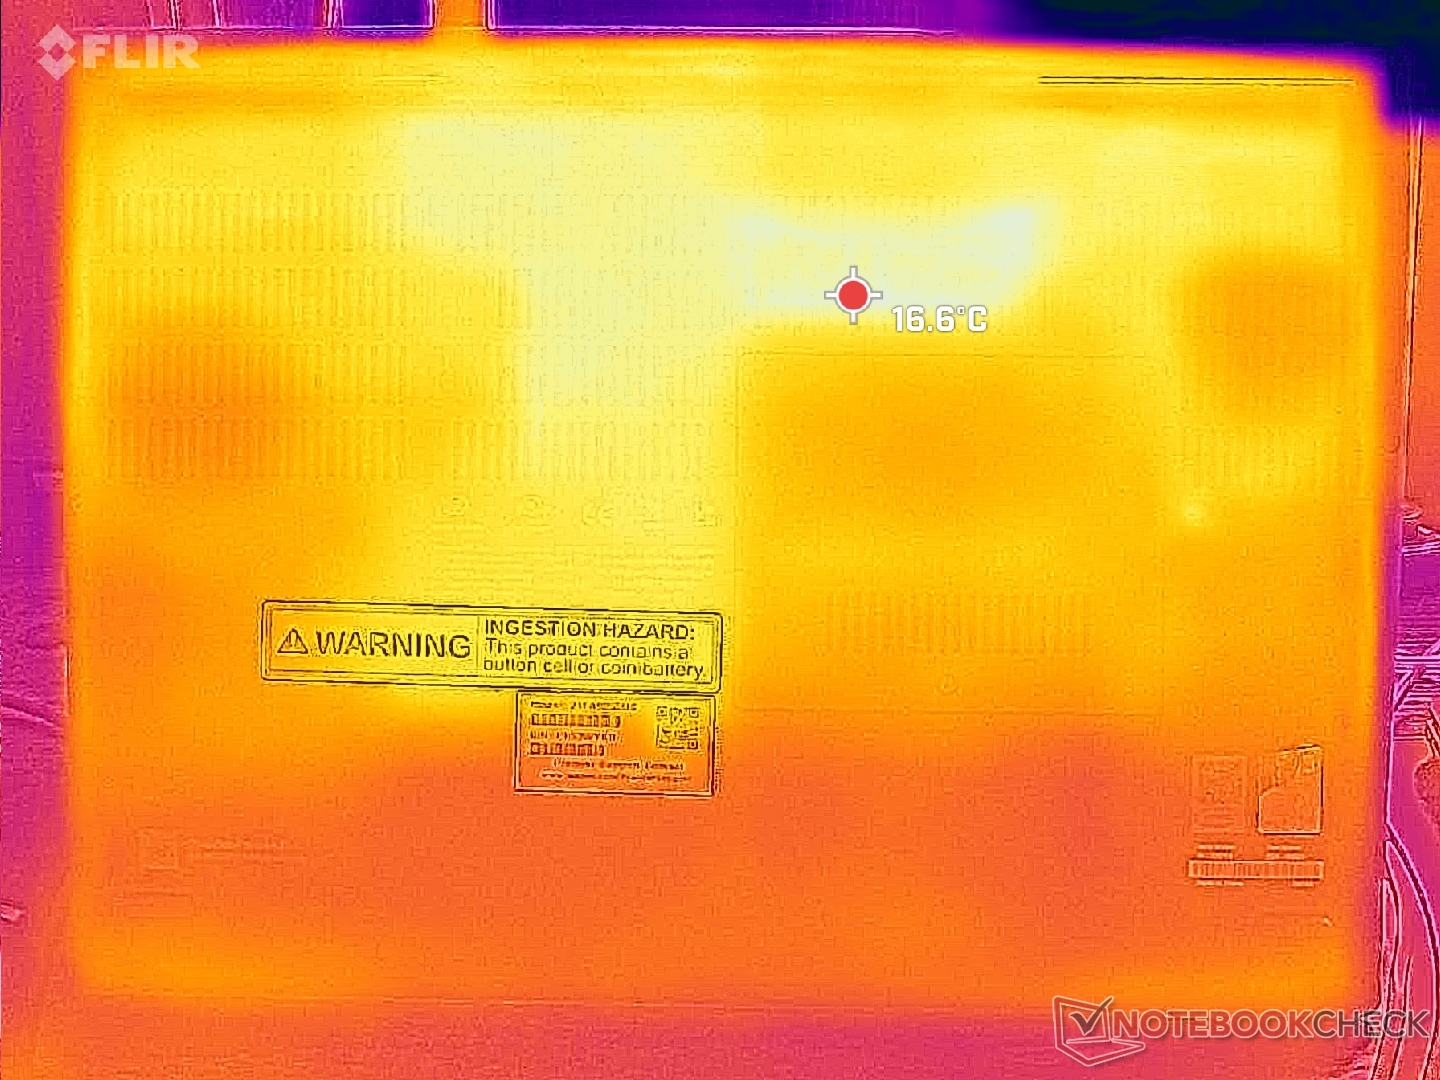
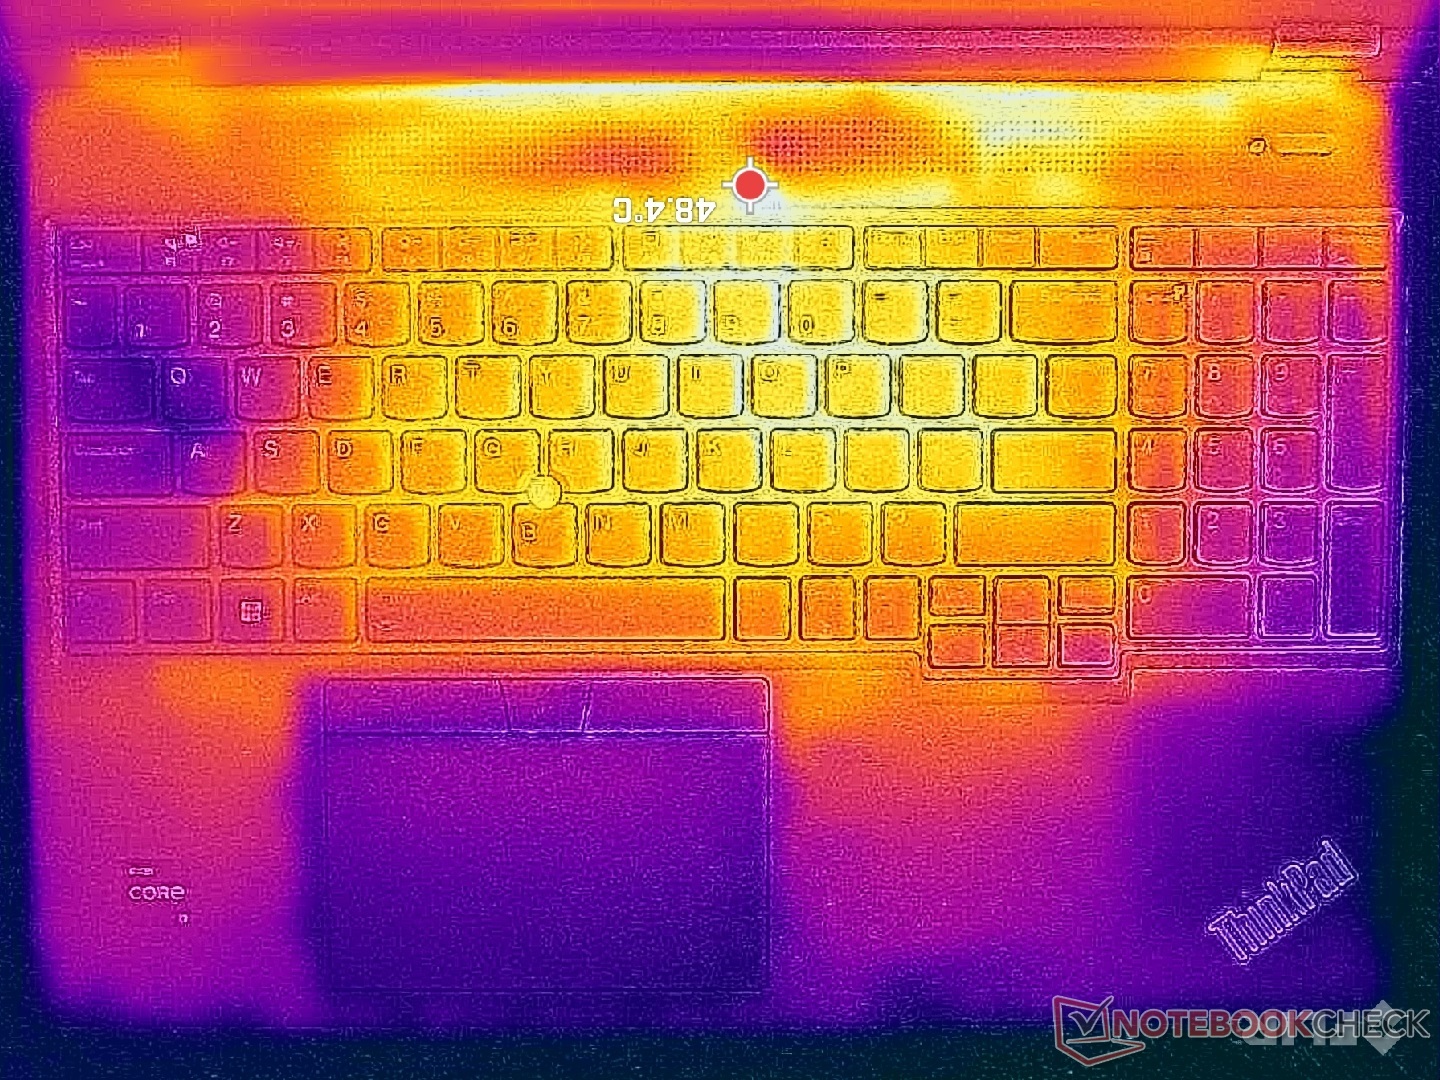
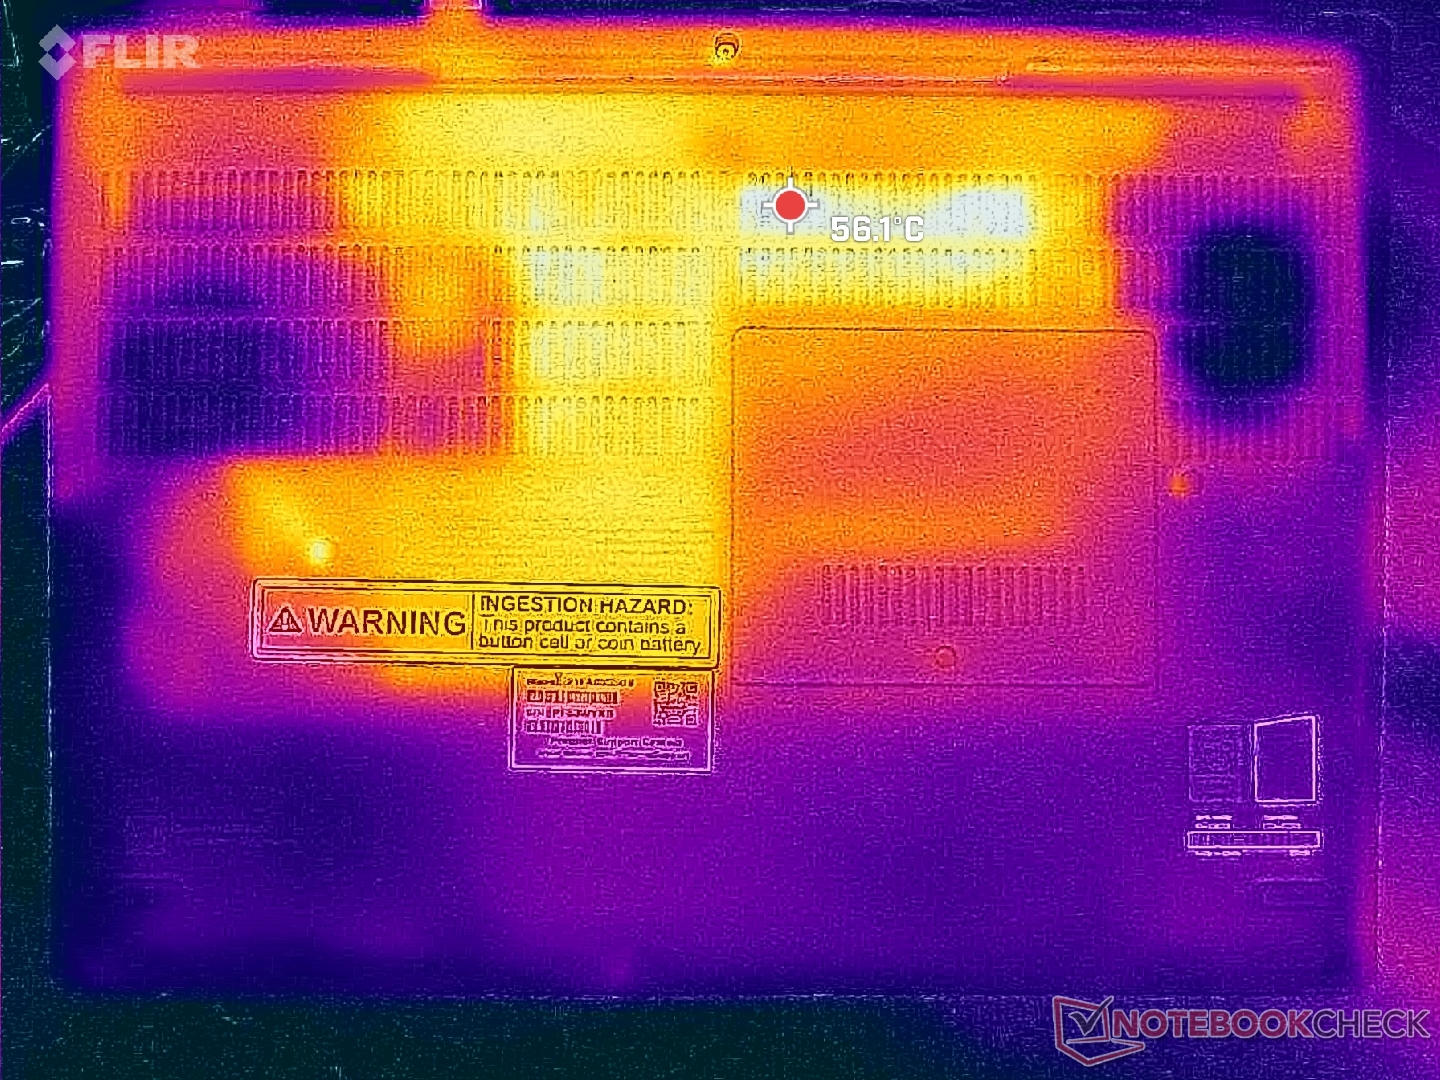
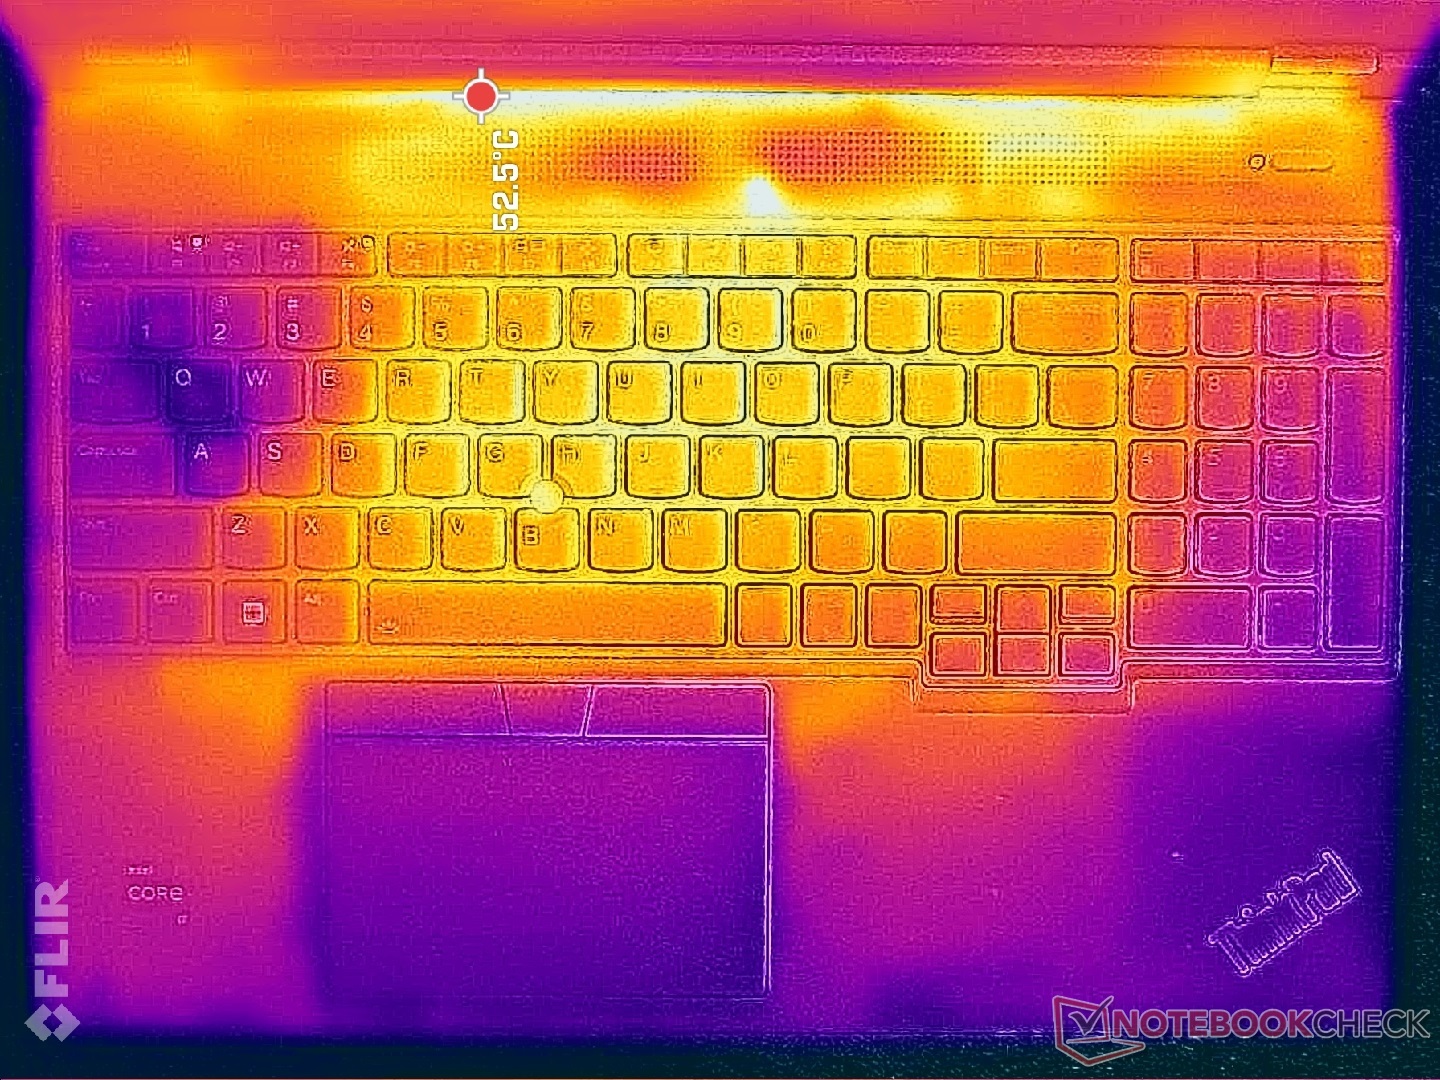
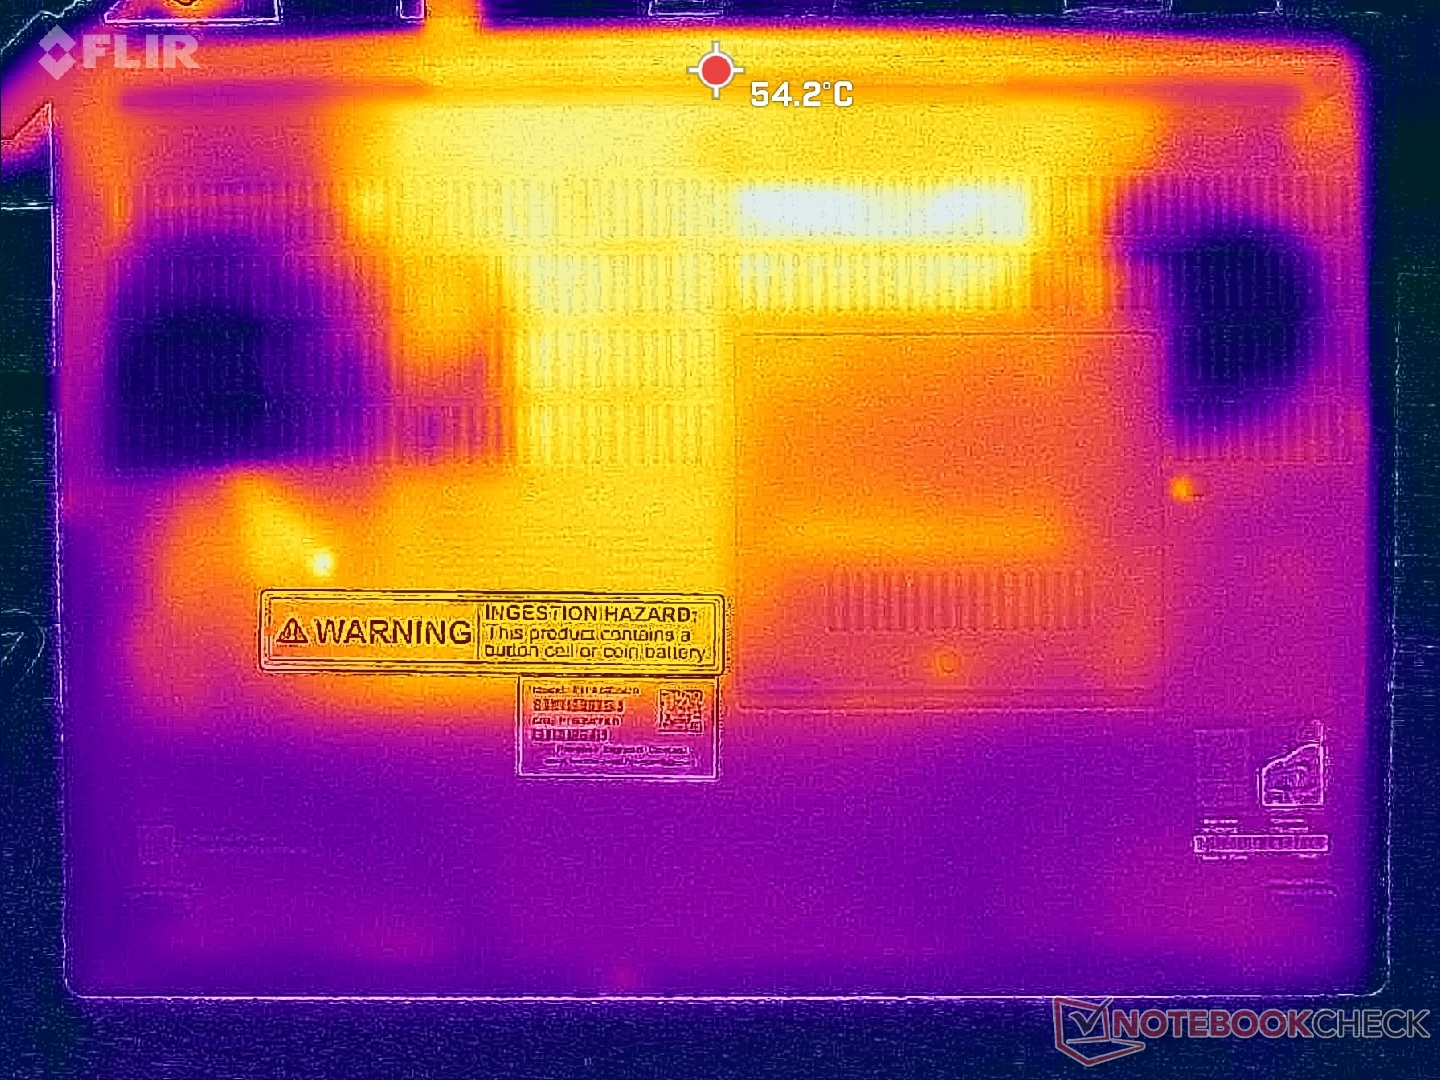
De oppervlaktetemperaturen zijn naar verwachting warmer dan op onze eerste ThinkPad P16 Gen 2-testunit vanwege onze meer veeleisende 130 W RTX 4000 Ada GPU, maar het verschil is groter dan verwacht. De gemiddelde temperatuur op de C- en D-laag kan oplopen tot 43 C, vergeleken met slechts 32 C op onze minder goed uitgeruste configuratie bij zware belastingen.
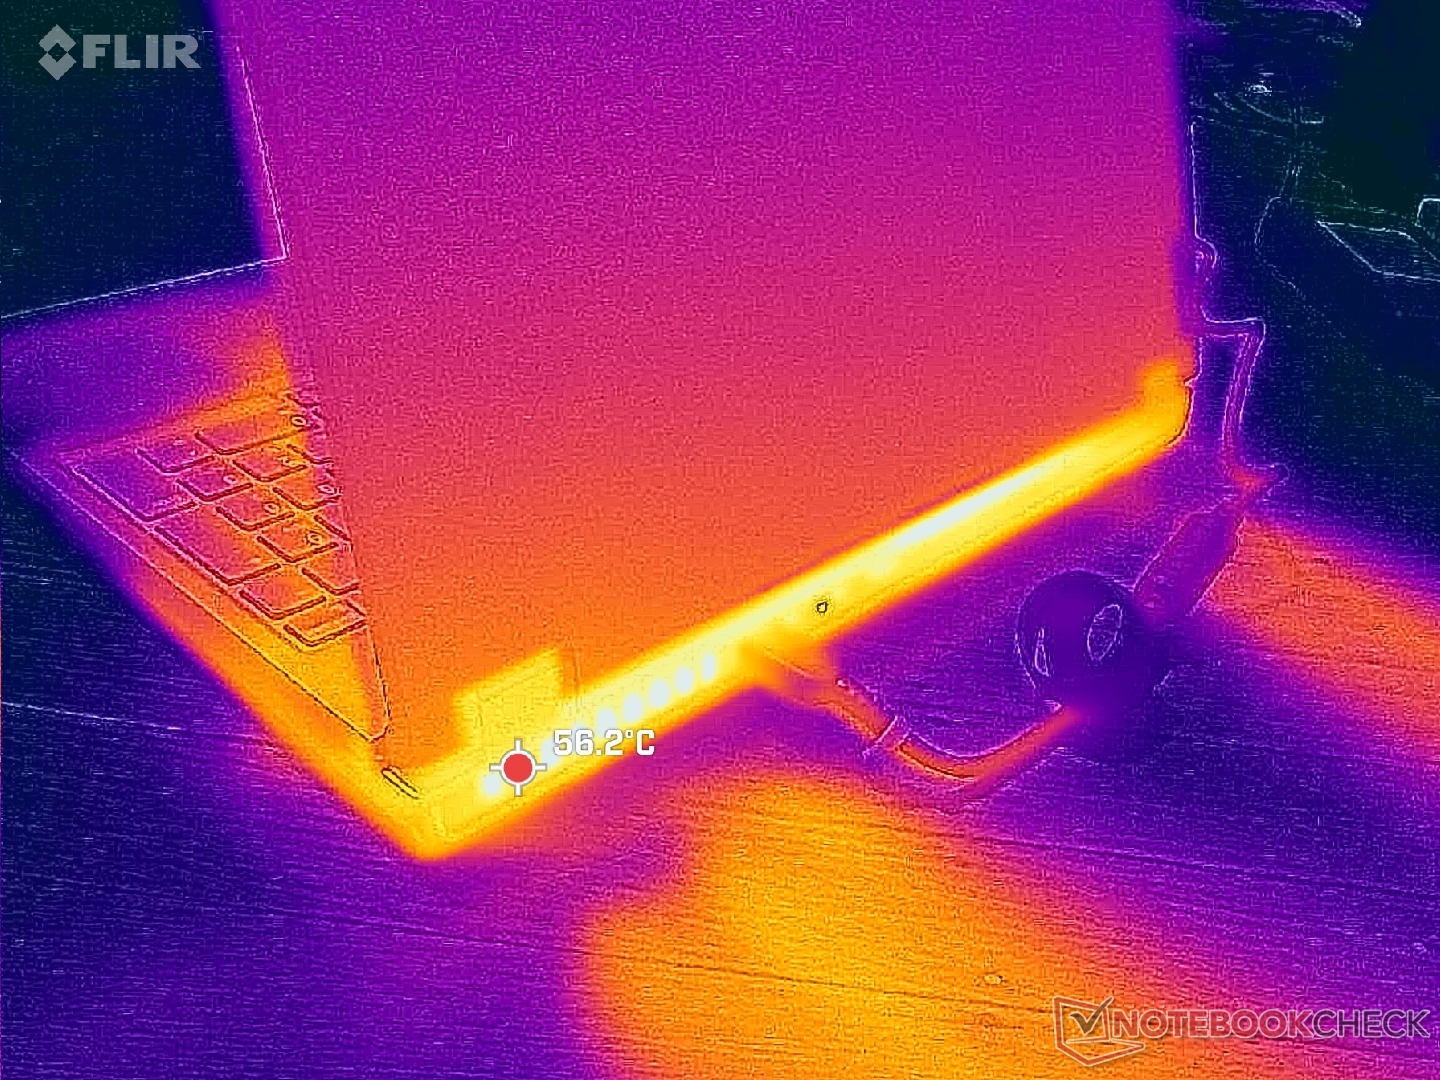
(-) De maximumtemperatuur aan de bovenzijde bedraagt 46.6 °C / 116 F, vergeleken met het gemiddelde van 38.2 °C / 101 F, variërend van 22.2 tot 69.8 °C voor de klasse Workstation.
(-) De bodem warmt op tot een maximum van 51 °C / 124 F, vergeleken met een gemiddelde van 41.1 °C / 106 F
(+) Bij onbelast gebruik bedraagt de gemiddelde temperatuur voor de bovenzijde 23.9 °C / 75 F, vergeleken met het apparaatgemiddelde van 32 °C / 90 F.
(-) 3: The average temperature for the upper side is 39.6 °C / 103 F, compared to the average of 32 °C / 90 F for the class Workstation.
(+) De handpalmsteunen en het touchpad bereiken maximaal de huidtemperatuur (35.6 °C / 96.1 F) en zijn dus niet heet.
(-) De gemiddelde temperatuur van de handpalmsteun van soortgelijke toestellen bedroeg 27.8 °C / 82 F (-7.8 °C / -14.1 F).
| Lenovo ThinkPad P16 Gen 2 Intel Core i7-14700HX, NVIDIA RTX 4000 Ada Generation Laptop | Lenovo ThinkPad P16 G2 21FA000FGE Intel Core i7-13700HX, NVIDIA RTX 2000 Ada Generation Laptop | Lenovo ThinkPad P16s G2 21K9000CGE AMD Ryzen 7 PRO 7840U, AMD Radeon 780M | Lenovo ThinkPad P16 G1 RTX A5500 Intel Core i9-12950HX, NVIDIA RTX A5500 Laptop GPU | HP ZBook Power 16 G11 A AMD Ryzen 7 8845HS, NVIDIA RTX 2000 Ada Generation Laptop | Dell Precision 5690 Intel Core Ultra 9 185H, NVIDIA RTX 5000 Ada Generation Laptop | |
|---|---|---|---|---|---|---|
| Heat | 3% | -2% | -17% | 6% | -3% | |
| Maximum Upper Side * (°C) | 46.6 | 47.2 -1% | 42.7 8% | 44.8 4% | 40.6 13% | 46.6 -0% |
| Maximum Bottom * (°C) | 51 | 39.5 23% | 47.2 7% | 49.8 2% | 40.6 20% | 33 35% |
| Idle Upper Side * (°C) | 24.8 | 28.1 -13% | 27.8 -12% | 30.6 -23% | 26 -5% | 32.4 -31% |
| Idle Bottom * (°C) | 25.6 | 25.3 1% | 28.4 -11% | 38.6 -51% | 26.6 -4% | 29.4 -15% |
* ... kleiner is beter
Luidsprekers
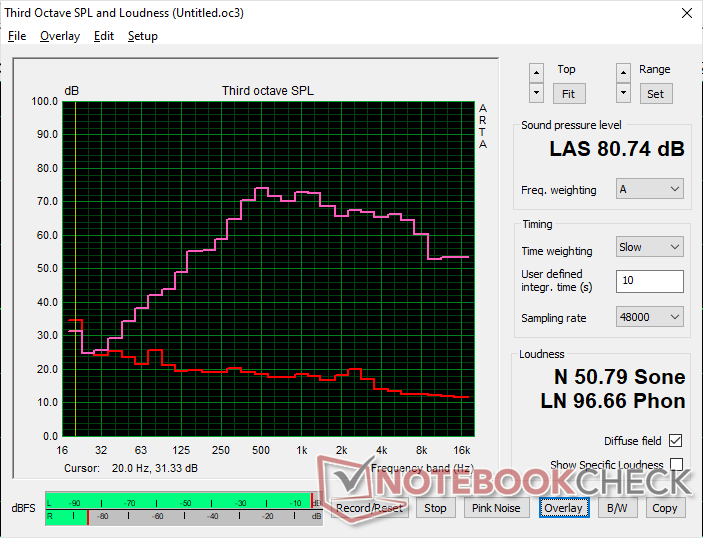
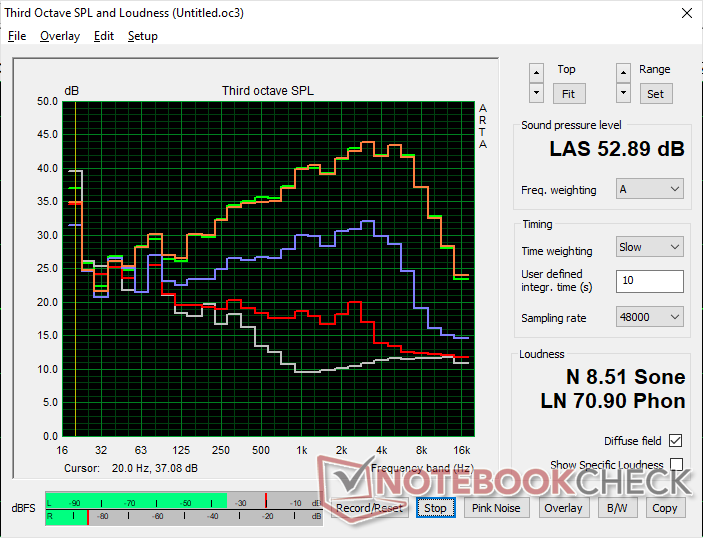
Lenovo ThinkPad P16 Gen 2 audioanalyse
(±) | luidspreker luidheid is gemiddeld maar goed (80.7 dB)
Bas 100 - 315 Hz
(±) | verminderde zeebaars - gemiddeld 10.8% lager dan de mediaan
(±) | lineariteit van de lage tonen is gemiddeld (8% delta ten opzichte van de vorige frequentie)
Midden 400 - 2000 Hz
(±) | hogere middens - gemiddeld 5.4% hoger dan de mediaan
(+) | de middentonen zijn lineair (6.2% delta ten opzichte van de vorige frequentie)
Hoog 2 - 16 kHz
(+) | evenwichtige hoogtepunten - slechts 3.3% verwijderd van de mediaan
(+) | de hoge tonen zijn lineair (5.5% delta naar de vorige frequentie)
Algemeen 100 - 16.000 Hz
(±) | lineariteit van het totale geluid is gemiddeld (15.6% verschil met de mediaan)
Vergeleken met dezelfde klasse
» 35% van alle geteste apparaten in deze klasse waren beter, 11% vergelijkbaar, 54% slechter
» De beste had een delta van 7%, het gemiddelde was 17%, de slechtste was 35%
Vergeleken met alle geteste toestellen
» 23% van alle geteste apparaten waren beter, 5% gelijk, 72% slechter
» De beste had een delta van 4%, het gemiddelde was 24%, de slechtste was 134%
Apple MacBook Pro 16 2021 M1 Pro audioanalyse
(+) | luidsprekers kunnen relatief luid spelen (84.7 dB)
Bas 100 - 315 Hz
(+) | goede baars - slechts 3.8% verwijderd van de mediaan
(+) | de lage tonen zijn lineair (5.2% delta naar de vorige frequentie)
Midden 400 - 2000 Hz
(+) | evenwichtige middens - slechts 1.3% verwijderd van de mediaan
(+) | de middentonen zijn lineair (2.1% delta ten opzichte van de vorige frequentie)
Hoog 2 - 16 kHz
(+) | evenwichtige hoogtepunten - slechts 1.9% verwijderd van de mediaan
(+) | de hoge tonen zijn lineair (2.7% delta naar de vorige frequentie)
Algemeen 100 - 16.000 Hz
(+) | het totale geluid is lineair (4.6% verschil met de mediaan)
Vergeleken met dezelfde klasse
» 0% van alle geteste apparaten in deze klasse waren beter, 0% vergelijkbaar, 100% slechter
» De beste had een delta van 5%, het gemiddelde was 17%, de slechtste was 45%
Vergeleken met alle geteste toestellen
» 0% van alle geteste apparaten waren beter, 0% gelijk, 100% slechter
» De beste had een delta van 4%, het gemiddelde was 24%, de slechtste was 134%
Energiebeheer
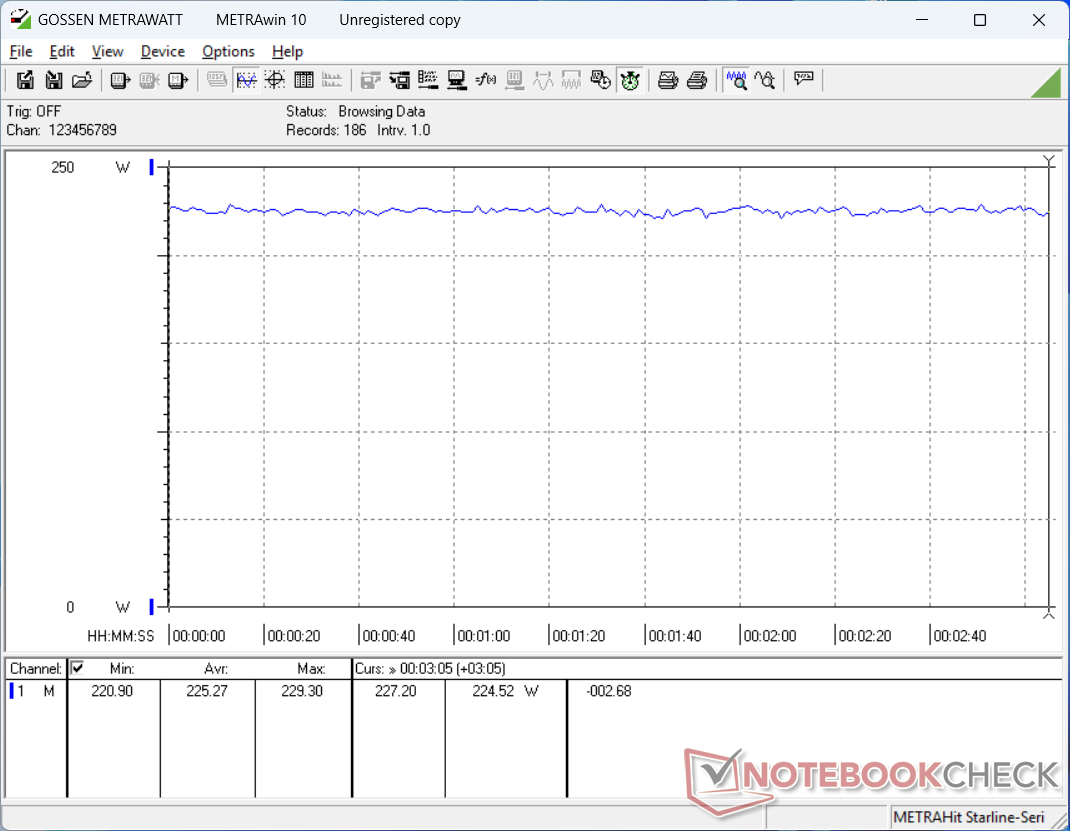
Stroomverbruik
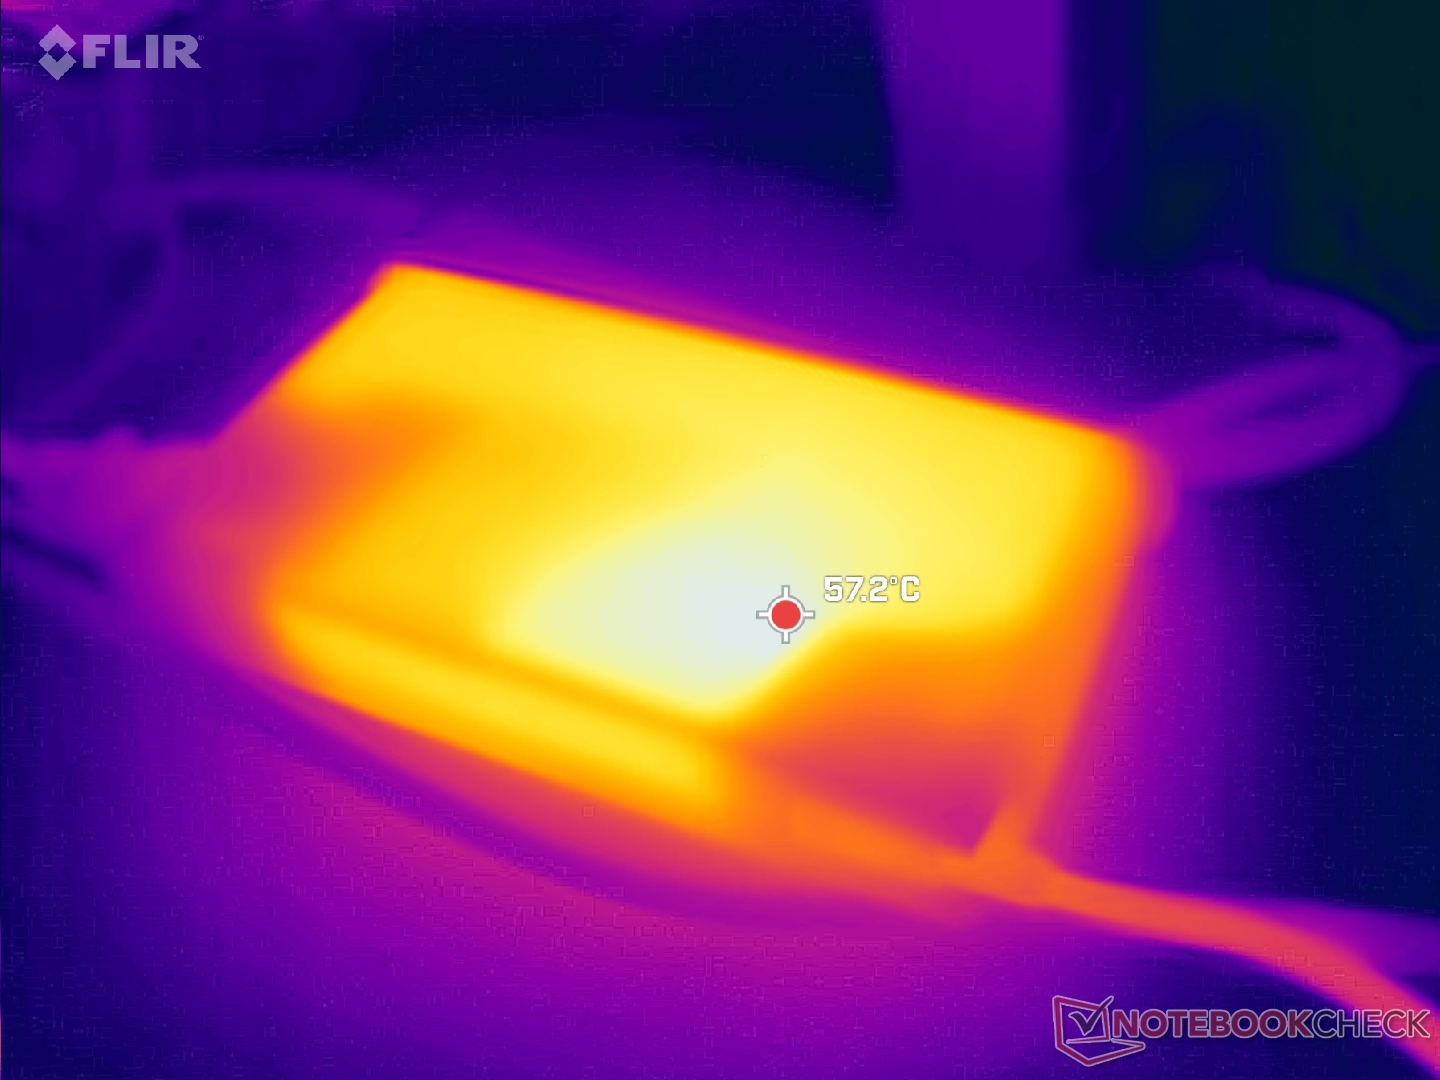
Stationair draaien op een desktop kan wel 25 W vergen, vergeleken met slechts 16 W op de minder goed uitgeruste RTX 2000-configuratie. Bij veeleisende belastingen, zoals games, kan het verschil oplopen tot 80 W, wat neerkomt op een toename van 55 procent in het verbruik. Zorg ervoor dat u de geschiktere 230 W AC-adapter gebruikt om het maximale uit de RTX 4000 configuratie te halen.
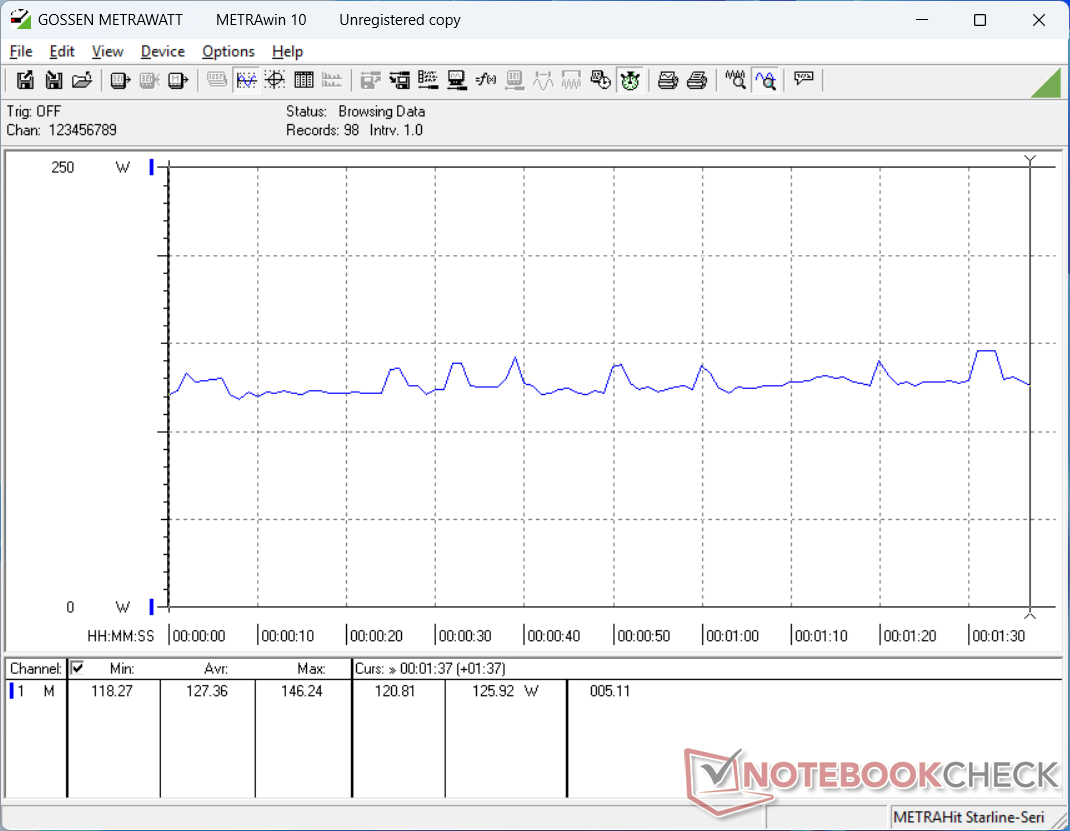
| Uit / Standby | |
| Inactief | |
| Belasting |
|
Key:
min: | |
| Lenovo ThinkPad P16 Gen 2 i7-14700HX, RTX 4000 Ada Generation Laptop, SK hynix PC801 HFS001TEJ9X162N, IPS, 2560x1600, 16" | Lenovo ThinkPad P16 G2 21FA000FGE i7-13700HX, RTX 2000 Ada Generation Laptop, SK hynix PC801 HFS001TEJ9X162N, IPS LED, 2560x1600, 16" | Lenovo ThinkPad P16s G2 21K9000CGE R7 PRO 7840U, Radeon 780M, SK hynix PC801 HFS001TEJ9X162N, OLED, 3840x2400, 16" | Lenovo ThinkPad P16 G1 RTX A5500 i9-12950HX, RTX A5500 Laptop GPU, WDC PC SN810 2TB, IPS, 3840x2400, 16" | HP ZBook Power 16 G11 A R7 8845HS, RTX 2000 Ada Generation Laptop, Samsung PM9A1 MZVL22T0HBLB, IPS, 2560x1600, 16" | Dell Precision 5690 Ultra 9 185H, RTX 5000 Ada Generation Laptop, 2x Samsung PM9A1 1TB (RAID 0), OLED, 3840x2400, 16" | |
|---|---|---|---|---|---|---|
| Power Consumption | 7% | 55% | -27% | 47% | 8% | |
| Idle Minimum * (Watt) | 7.9 | 9.3 -18% | 6.1 23% | 7.5 5% | 4.6 42% | 7.9 -0% |
| Idle Average * (Watt) | 13.1 | 14.1 -8% | 6.5 50% | 20.1 -53% | 10 24% | 12 8% |
| Idle Maximum * (Watt) | 24.2 | 15.5 36% | 7 71% | 40 -65% | 10.6 56% | 28.6 -18% |
| Load Average * (Watt) | 127.4 | 133.6 -5% | 56.6 56% | 137 -8% | 60.9 52% | 98.8 22% |
| Cyberpunk 2077 ultra external monitor * (Watt) | 219 | 92.8 58% | ||||
| Cyberpunk 2077 ultra * (Watt) | 225 | 96.8 57% | ||||
| Load Maximum * (Watt) | 248.5 | 179.6 28% | 68.3 73% | 285.9 -15% | 154.8 38% | 174.8 30% |
| Witcher 3 ultra * (Watt) | 144.9 | 61.2 | 208 | 144.5 |
* ... kleiner is beter
Power Consumption Cyberpunk / Stress Test
Power Consumption external Monitor
Levensduur batterij
De looptijden zijn meer dan de helft korter dan wat we op de mindere ThinkPad P16 Gen 2 configuratie vastlegden, zelfs wanneer deze op Balanced modus en 150 nit helderheid was ingesteld. Het verschil kan voornamelijk worden toegeschreven aan het ontbreken van Advanced Optimus ondersteuning op onze RTX 4000 Ada, waardoor de discrete GPU nooit volledig wordt uitgeschakeld.
Het duurt ongeveer 130 minuten om op te laden van leeg naar vol, zelfs met Lenovo Quick Charge ingeschakeld.
| Lenovo ThinkPad P16 Gen 2 i7-14700HX, RTX 4000 Ada Generation Laptop, 94 Wh | Lenovo ThinkPad P16 G2 21FA000FGE i7-13700HX, RTX 2000 Ada Generation Laptop, 94 Wh | Lenovo ThinkPad P16s G2 21K9000CGE R7 PRO 7840U, Radeon 780M, 84 Wh | Lenovo ThinkPad P16 G1 RTX A5500 i9-12950HX, RTX A5500 Laptop GPU, 94 Wh | HP ZBook Power 16 G11 A R7 8845HS, RTX 2000 Ada Generation Laptop, 83 Wh | Dell Precision 5690 Ultra 9 185H, RTX 5000 Ada Generation Laptop, 98 Wh | |
|---|---|---|---|---|---|---|
| Batterijduur | 244% | 324% | 132% | 288% | 268% | |
| WiFi v1.3 (h) | 2.5 | 8.6 244% | 10.6 324% | 5.8 132% | 9.7 288% | 9.2 268% |
| H.264 (h) | 13.3 | |||||
| Load (h) | 1.5 | 1.7 | ||||
| Reader / Idle (h) | 26.1 |
Lenovo ThinkPad P16 Gen 2
- 25-10-2024 v8
Allen Ngo
 Total Sustainability Score:
 Transparantie
De selectie van te beoordelen apparaten wordt gemaakt door onze redactie. Het testexemplaar werd ten behoeve van deze beoordeling door de fabrikant of detailhandelaar in bruikleen aan de auteur verstrekt. De kredietverstrekker had geen invloed op deze recensie, noch ontving de fabrikant vóór publicatie een exemplaar van deze recensie. Er bestond geen verplichting om deze recensie te publiceren. Als onafhankelijk mediabedrijf is Notebookcheck niet onderworpen aan het gezag van fabrikanten, detailhandelaren of uitgevers.
[transparency_disclaimer]Dit is hoe Notebookcheck test
Elk jaar beoordeelt Notebookcheck onafhankelijk honderden laptops en smartphones met behulp van gestandaardiseerde procedures om ervoor te zorgen dat alle resultaten vergelijkbaar zijn. We hebben onze testmethoden al zo'n 20 jaar voortdurend ontwikkeld en daarbij de industriestandaard bepaald. In onze testlaboratoria wordt gebruik gemaakt van hoogwaardige meetapparatuur door ervaren technici en redacteuren. Deze tests omvatten een validatieproces in meerdere fasen. Ons complexe beoordelingssysteem is gebaseerd op honderden goed onderbouwde metingen en benchmarks, waardoor de objectiviteit behouden blijft. Meer informatie over onze testmethoden kunt u hier vinden.

