

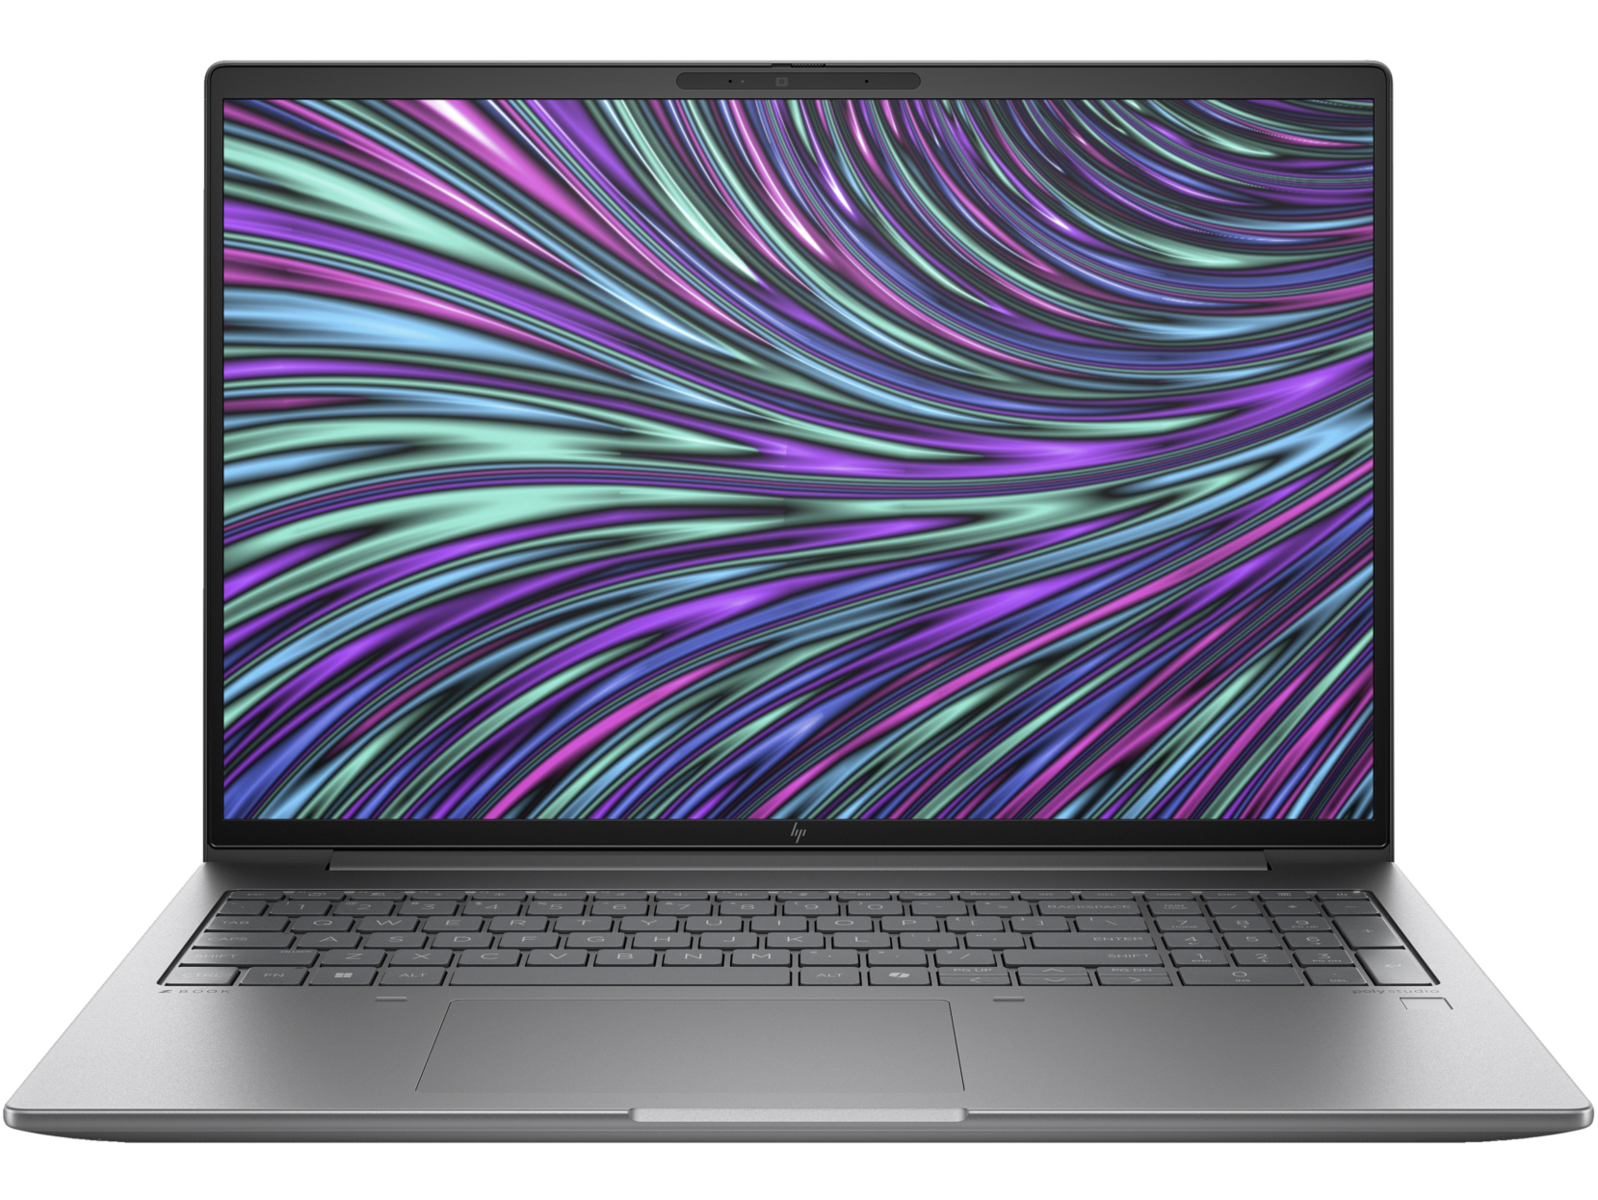
HP ZBook Power 16 G11 A recensie: Krachtig werkstation met AMD Zen 4

De ZBook Power 16 G11 volgt de oudere ZBook Power 15 G10 op met zowel nieuwe interne processors als nieuwe externe veranderingen. Zoals de naam al aangeeft, moderniseert de ZBook Power 16 G11 de serie door de oude 15,6-inch vormfactor te vervangen door een 16-inch ontwerp. Qua prestaties zit hij tussen de goedkopere ZBook Firefly en de duurdere ZBook Fury in. Gebruikers kunnen configureren met Meteor Lake Intel Core Ultra CPU's of AMD Ryzen Zen 4 CPU's en Nvidia RTX graphics.
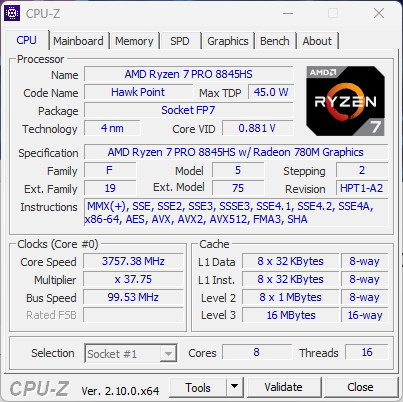
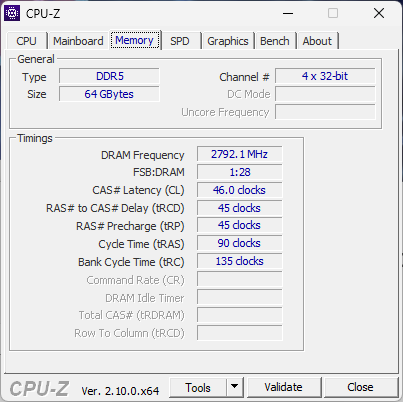
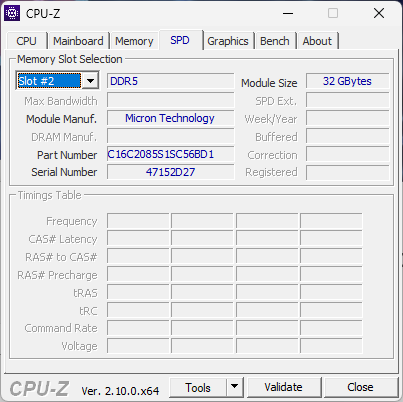
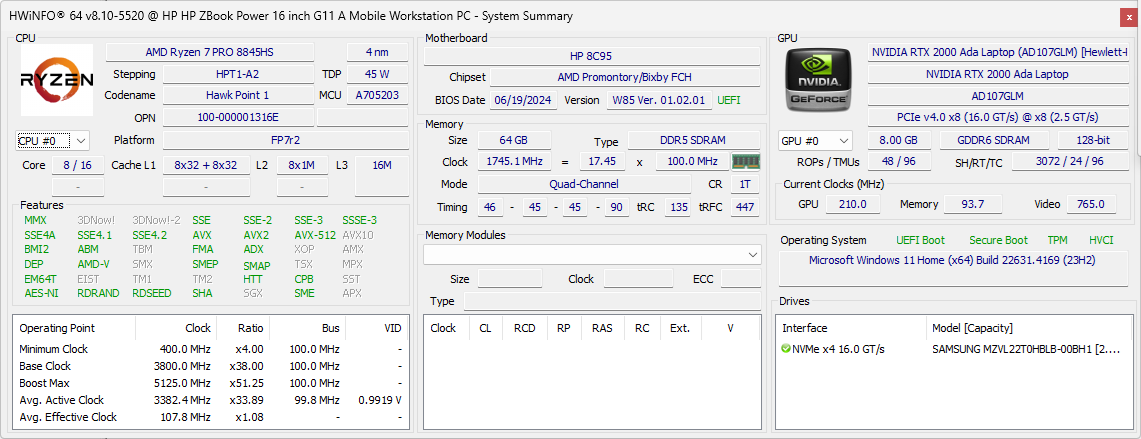
Ons apparaat is een AMD-configuratie uit het hogere segment (ZBook Power 16 G11 A) met de Ryzen 7 8845HS CPU, RTX 2000 Ada GPU en een 120Hz 2560 x 1600p IPS-scherm voor ongeveer $2100. De opties zijn zeer uitgebreid, van de Ryzen 5 8645HS tot de Ryzen 9 8945HS met 1200p beeldscherm en RTX 1000, RTX 2000 of RTX 3000 grafische weergave. Gebruikers kunnen ook kiezen voor helemaal geen discrete graphics.
Concurrenten op dit gebied zijn onder andere 16-inch werkstations zoals de Dell Precision 5690, MSI CreatorPro Z16Pof de Lenovo ThinkPad P16s G2.
Meer HP beoordelingen:
Potentiële concurrenten in vergelijkings
Evaluatie | Versie | Datum | Model | Gewicht | Hoogte | Formaat | Resolutie | Beste prijs |
|---|---|---|---|---|---|---|---|---|
| 85.4 % | v8 | 10-2024 | HP ZBook Power 16 G11 A R7 8845HS, NVIDIA RTX 2000 Ada Generation Laptop GPU | 2.2 kg | 22.9 mm | 16.00" | 2560x1600 | |
| 88.9 % v7 (old) | v7 (old) | 12-2023 | HP ZBook Power 15 G10 R7 PRO 7840HS, NVIDIA RTX 2000 Ada Generation Laptop GPU | 2 kg | 22.9 mm | 15.60" | 2560x1440 | |
| 85.9 % | v8 | 08-2024 | HP ZBook Fury 16 G11 i9-14900HX, NVIDIA RTX 3500 Ada Generation Laptop GPU | 2.6 kg | 28.5 mm | 16.00" | 3840x2400 | |
| 83.5 % | v8 | 10-2024 | Lenovo ThinkPad P1 Gen 7 21KV001SGE Ultra 7 155H, NVIDIA GeForce RTX 4060 Laptop GPU | 2 kg | 20.5 mm | 16.00" | 2560x1600 | |
| 88.6 % v7 (old) | v7 (old) | 01-2024 | Lenovo ThinkPad P16s G2 21K9000CGE R7 PRO 7840U, Radeon 780M | 1.8 kg | 24.4 mm | 16.00" | 3840x2400 | |
| 88.3 % v7 (old) | v7 (old) | 05-2024 | Dell Precision 5690 Ultra 9 185H, NVIDIA RTX 5000 Ada Generation Laptop GPU | 2.3 kg | 22.17 mm | 16.00" | 3840x2400 |
Opmerking: We hebben ons beoordelingssysteem onlangs bijgewerkt en de resultaten van versie 8 zijn niet vergelijkbaar met de resultaten van versie 7. Meer informatie is beschikbaar hier .
Behuizing - MIL-STD 810 gecertificeerd
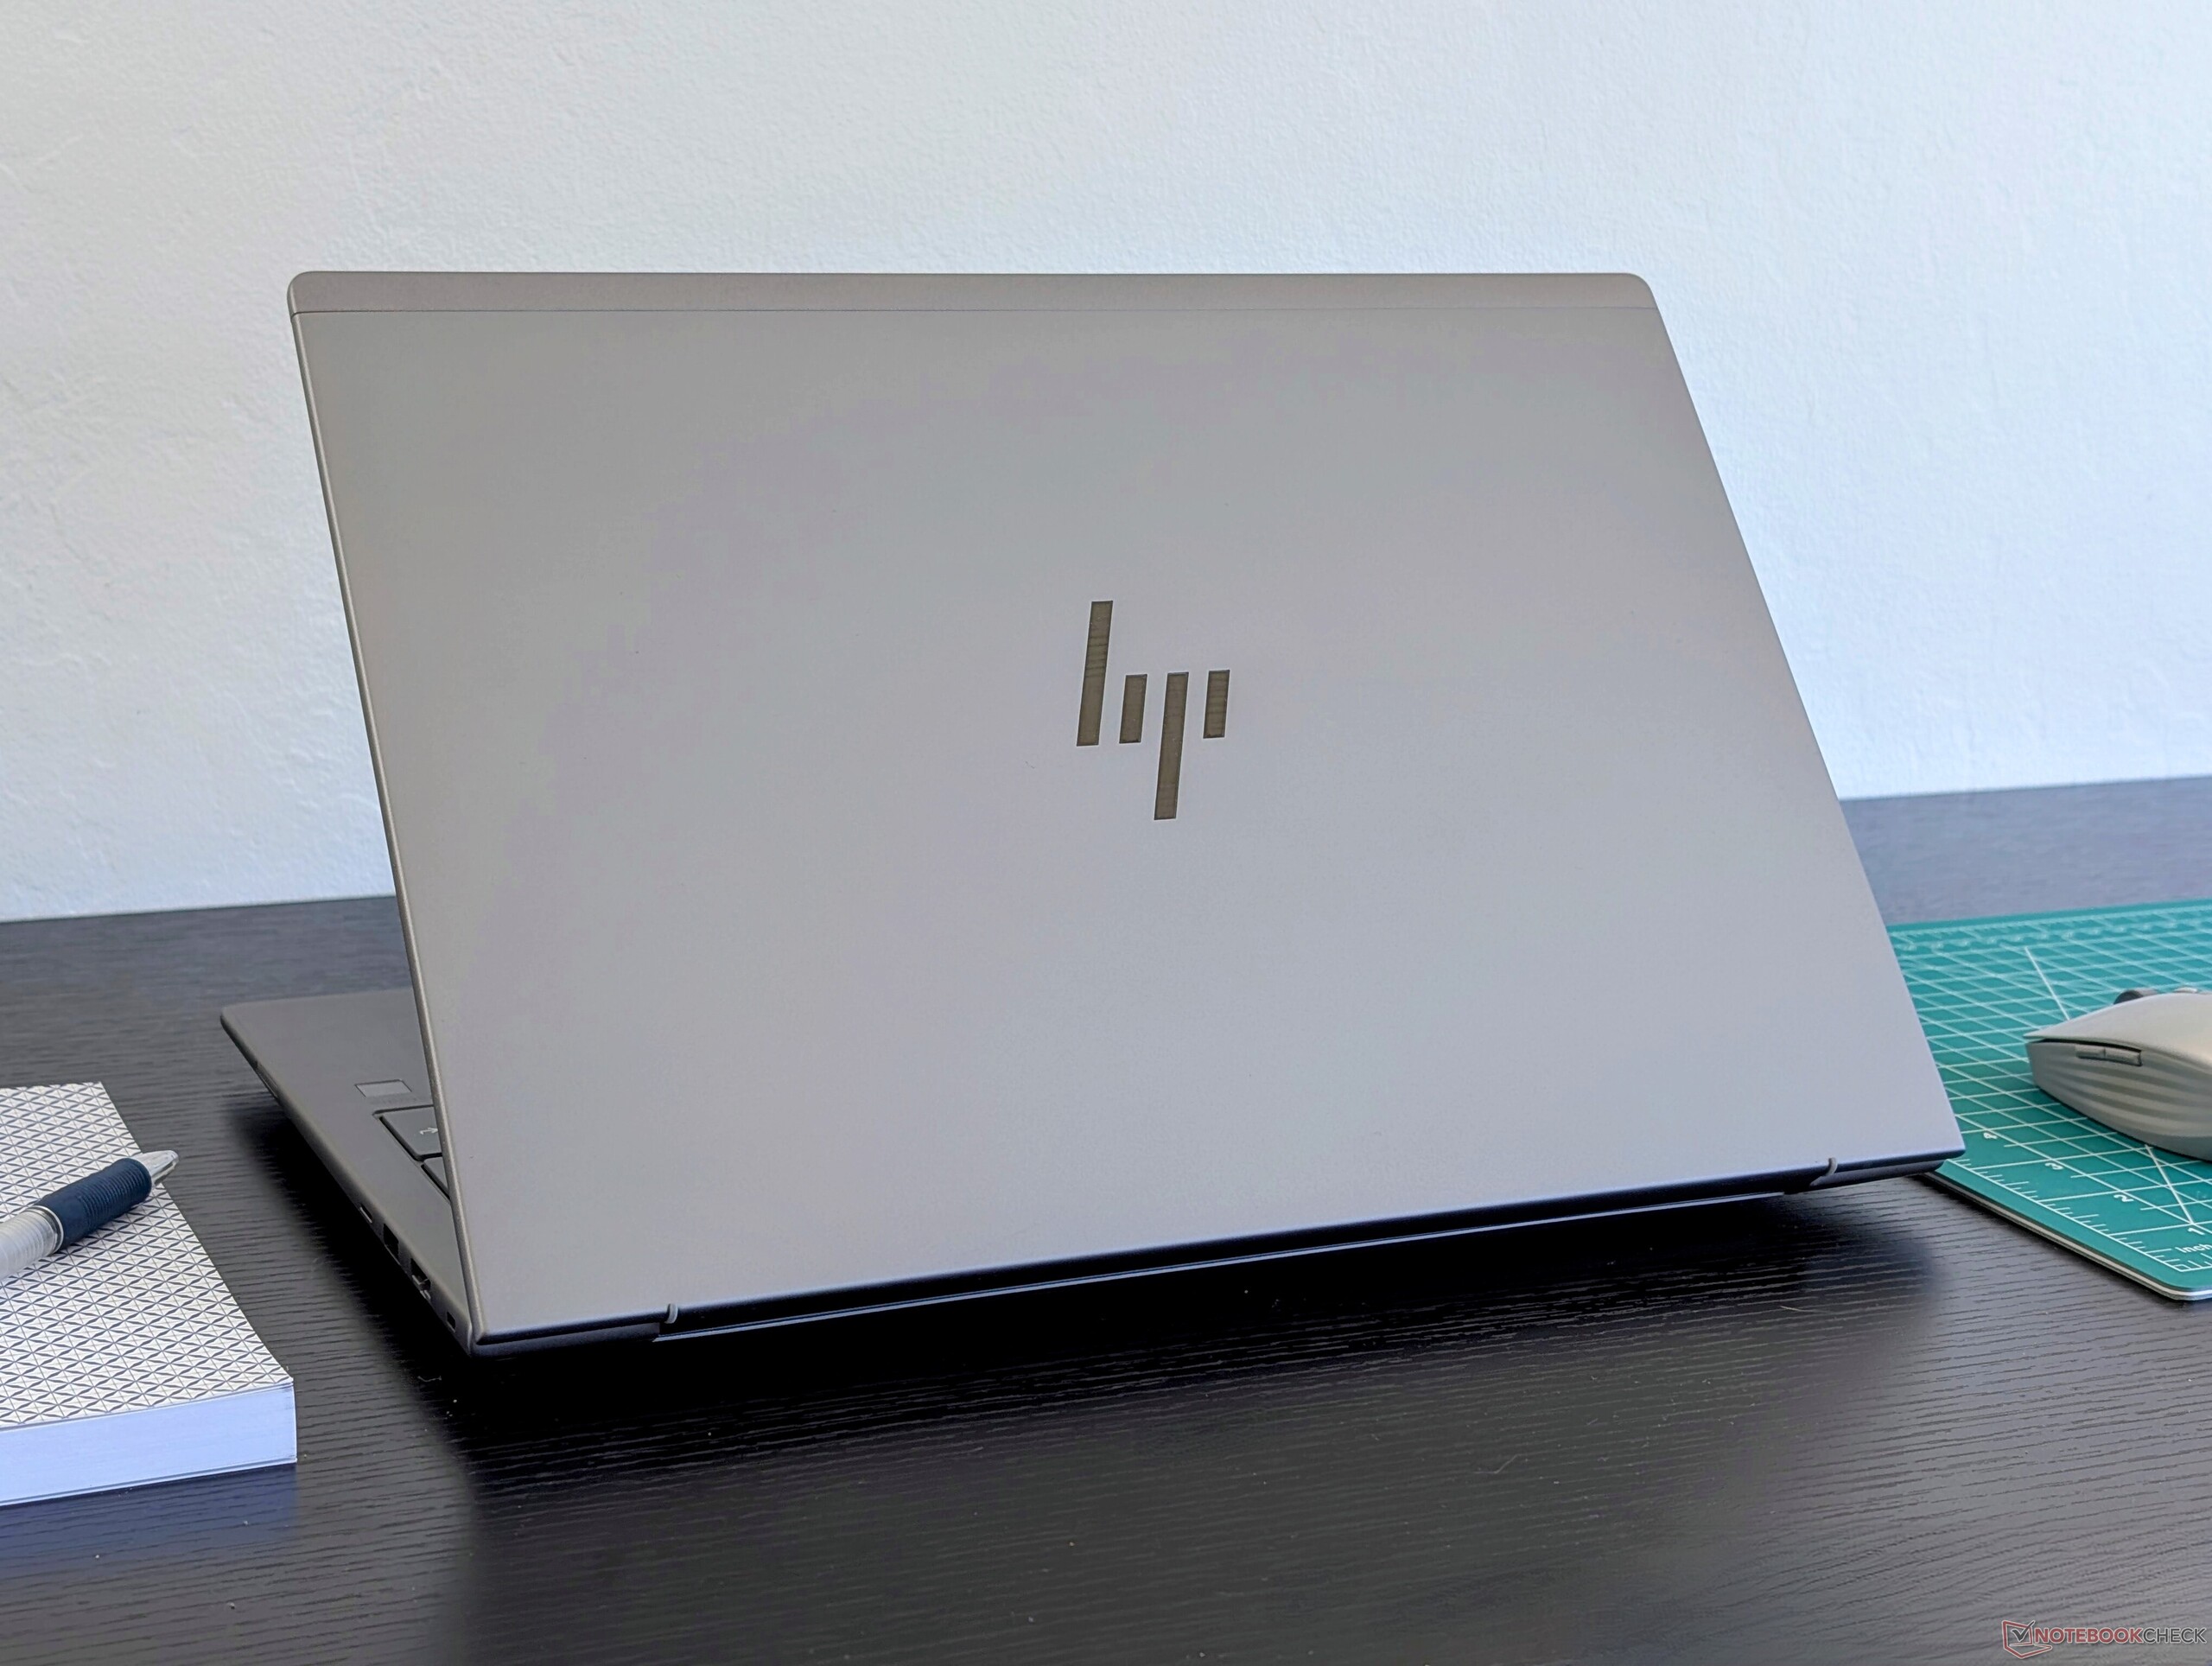
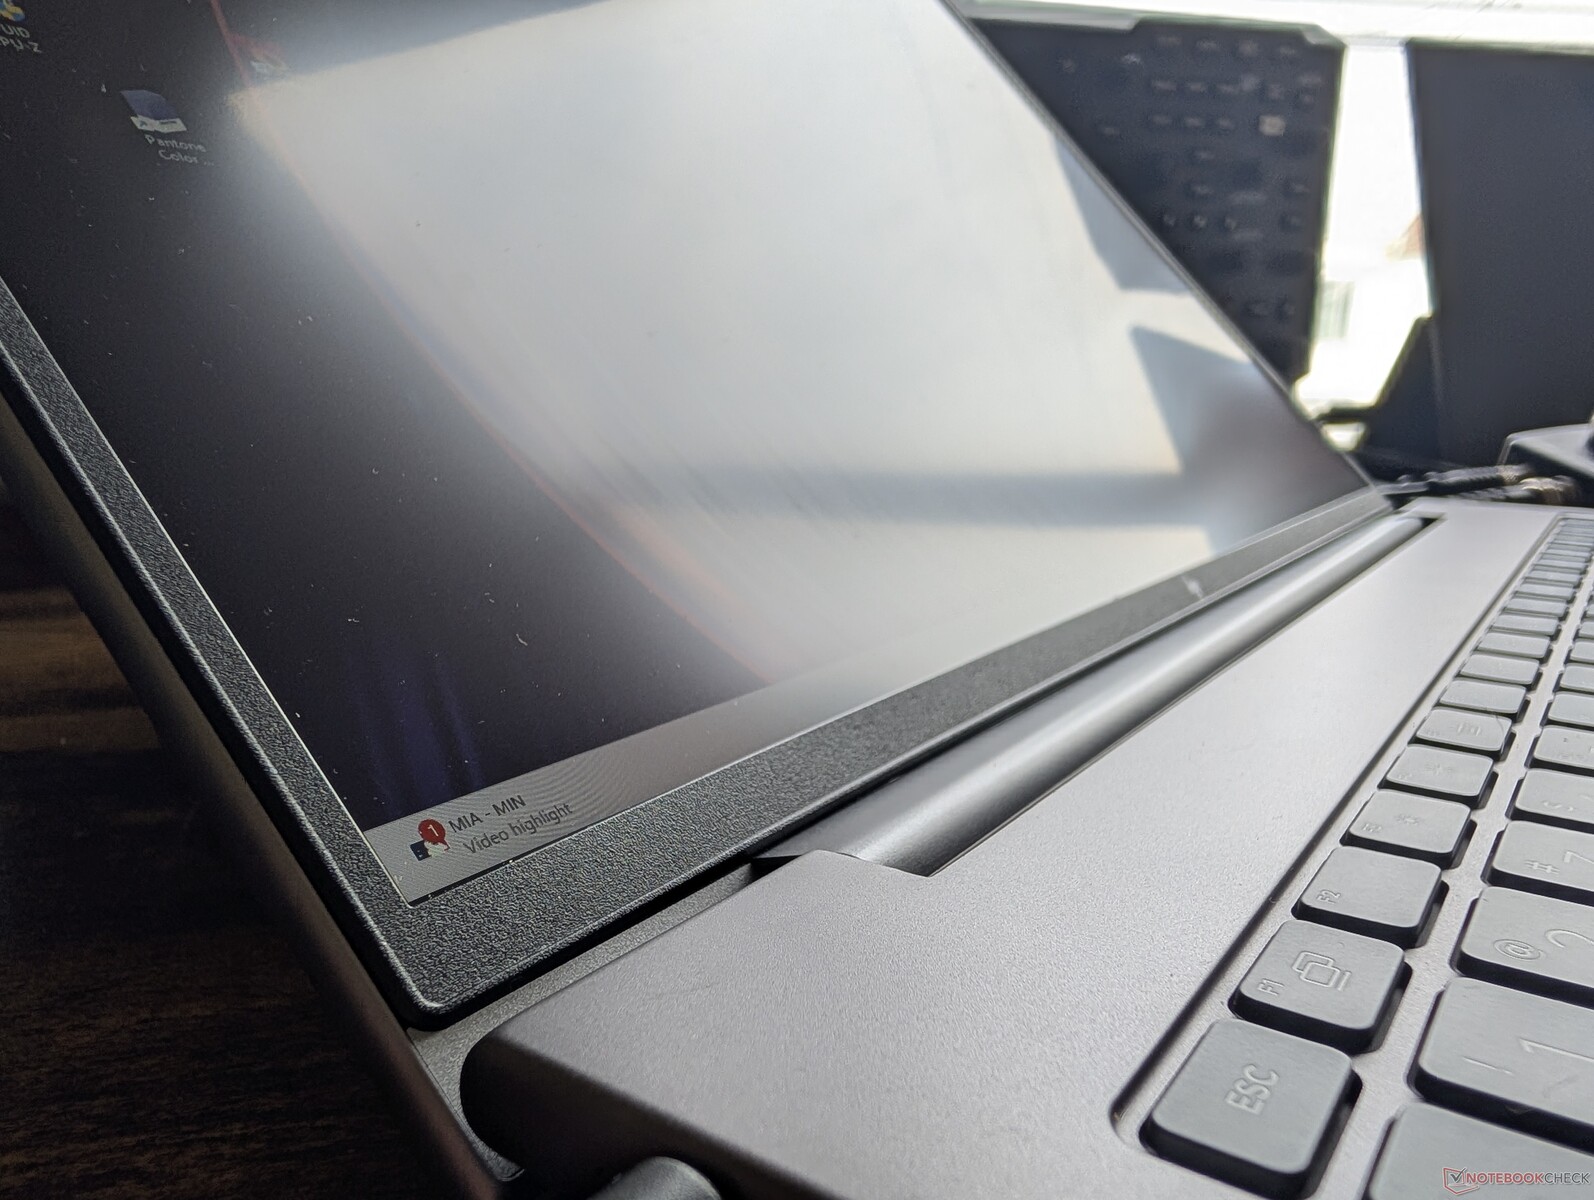
HP gebruikt voor bijna al zijn ZBook-modellen dezelfde grijze materialen van aluminiumlegering voor een gevoel van consistentie binnen de hele familie. In dit geval heeft de ZBook Power 16 G11 dezelfde gladde matte metalen textuur als de ZBook Power 15 G10, maar met oppervlakkige veranderingen aan de randen van het toetsenbord, de buitenste rand van de deksel en het bodempaneel.
De stevigheid van het chassis is uitstekend met minimale buigingen en indrukkingen wanneer u probeert de onderkant te draaien. De scharnieren en klep hadden echter stijver kunnen zijn, vooral omdat de klep bijna 180 graden kan openen, in tegenstelling tot de Precision 5690.
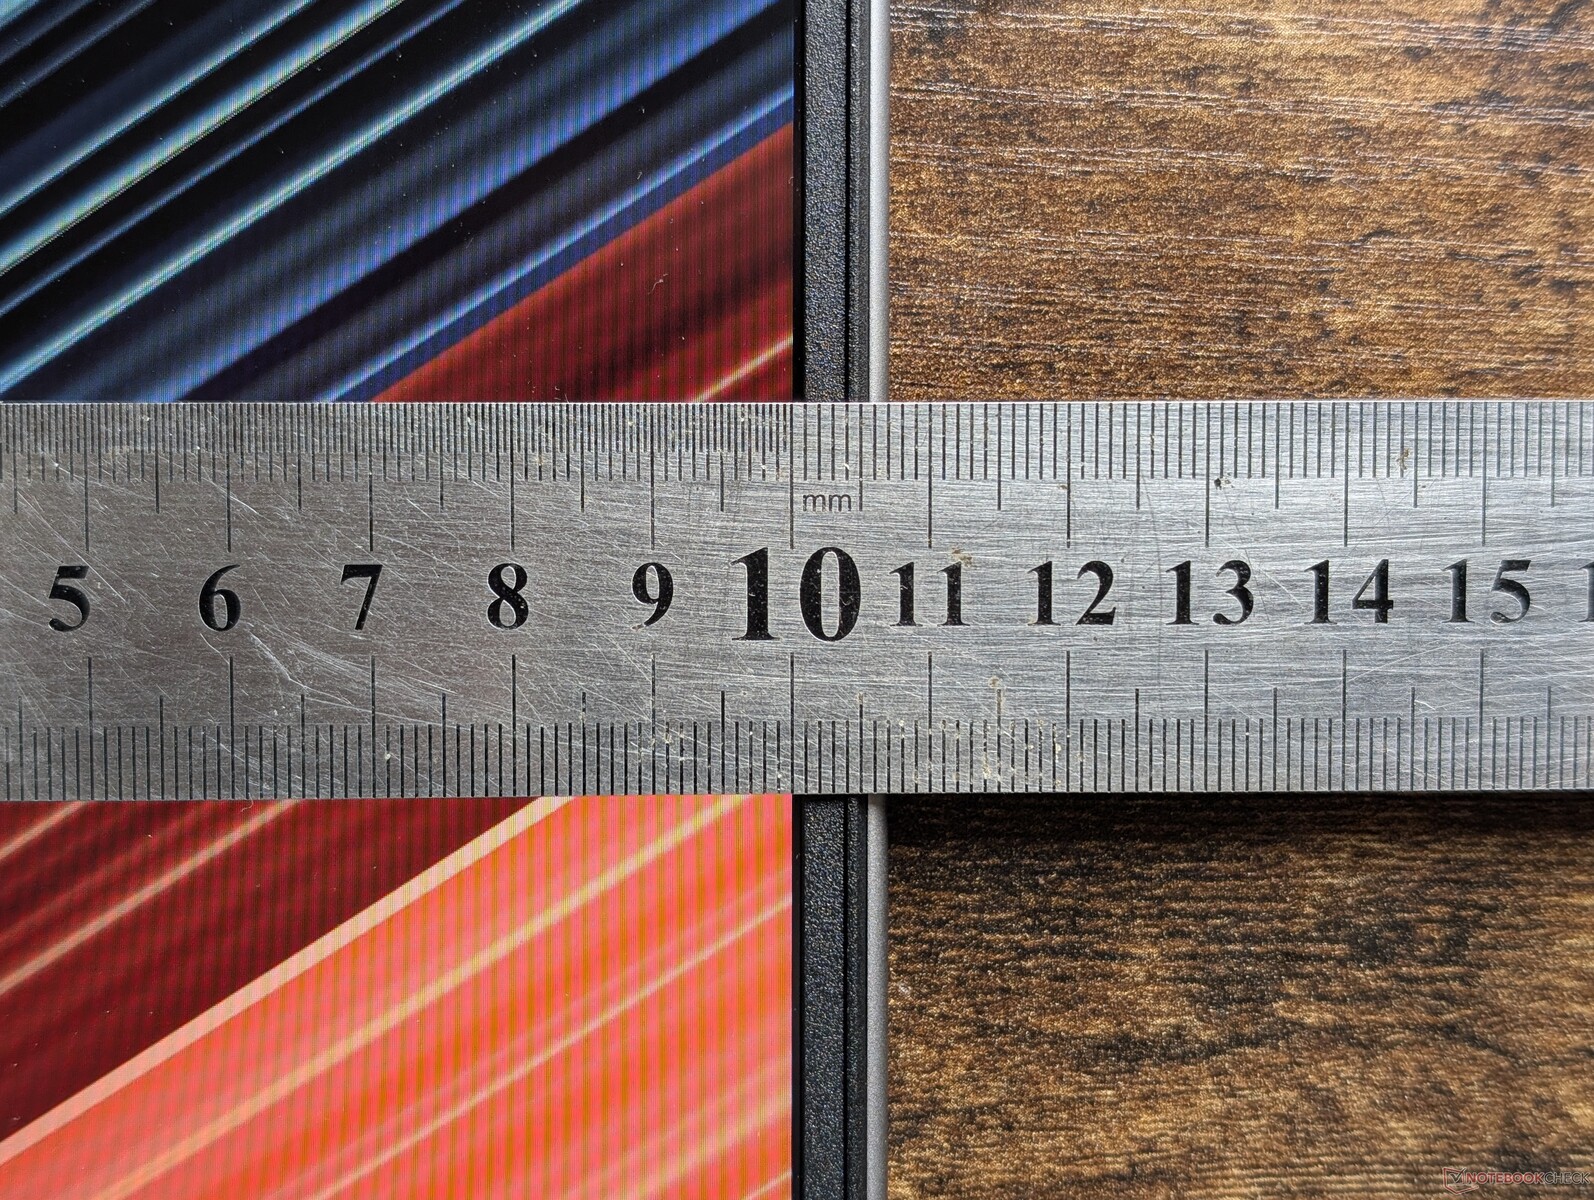
Het nieuwe 16-inch ontwerp is ongeveer 10 procent zwaarder en 7 procent groter dan het uitgaande 15-inch model. Hij is met name niet dunner en dat is jammer, want hij is al dikker dan sommige concurrenten zoals de ThinkPad P1 Gen 7. De ZBook Fury 16 G11 is nog zwaarder en dikker, maar heeft snellere CPU- en GPU-opties om dit te compenseren. HP biedt de slankere ZBook Firefly 16 serie als gebruikers een meer draagbare optie willen.
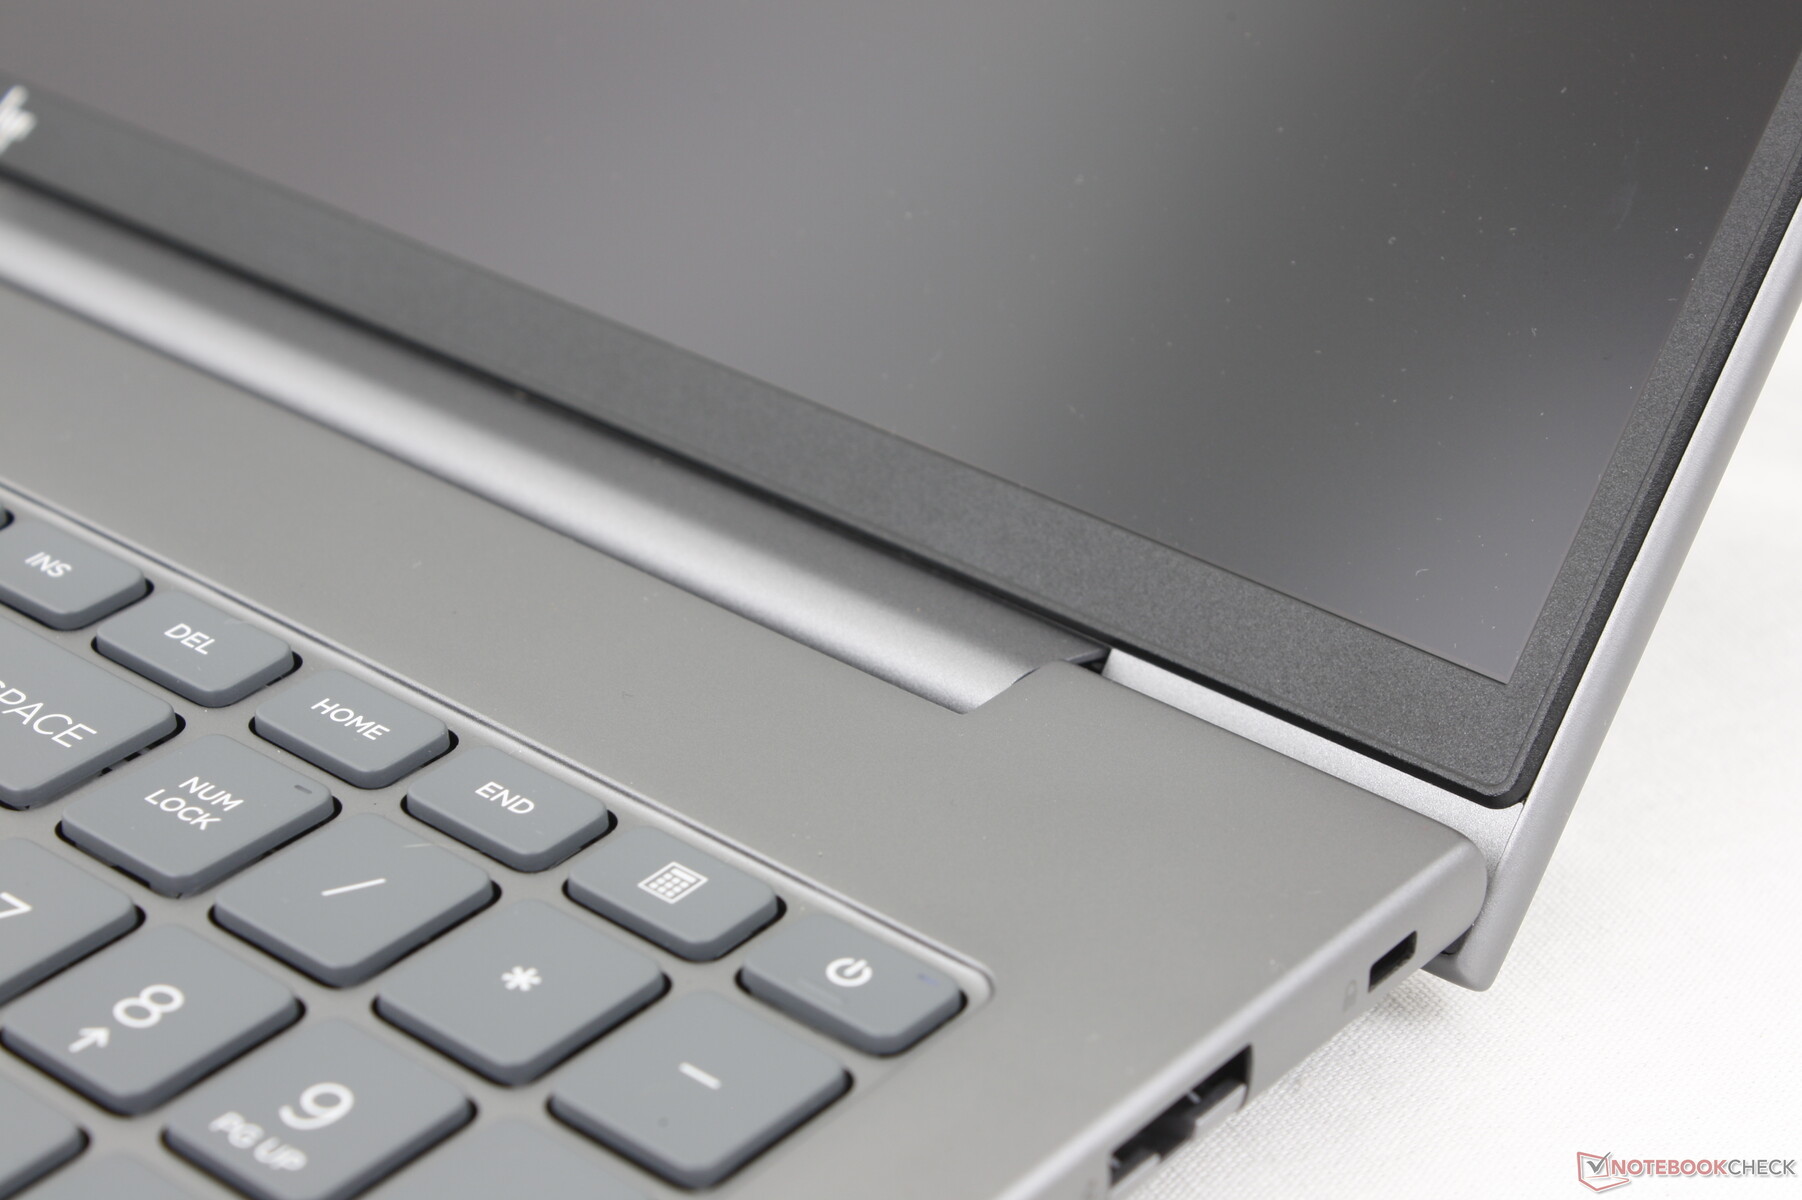
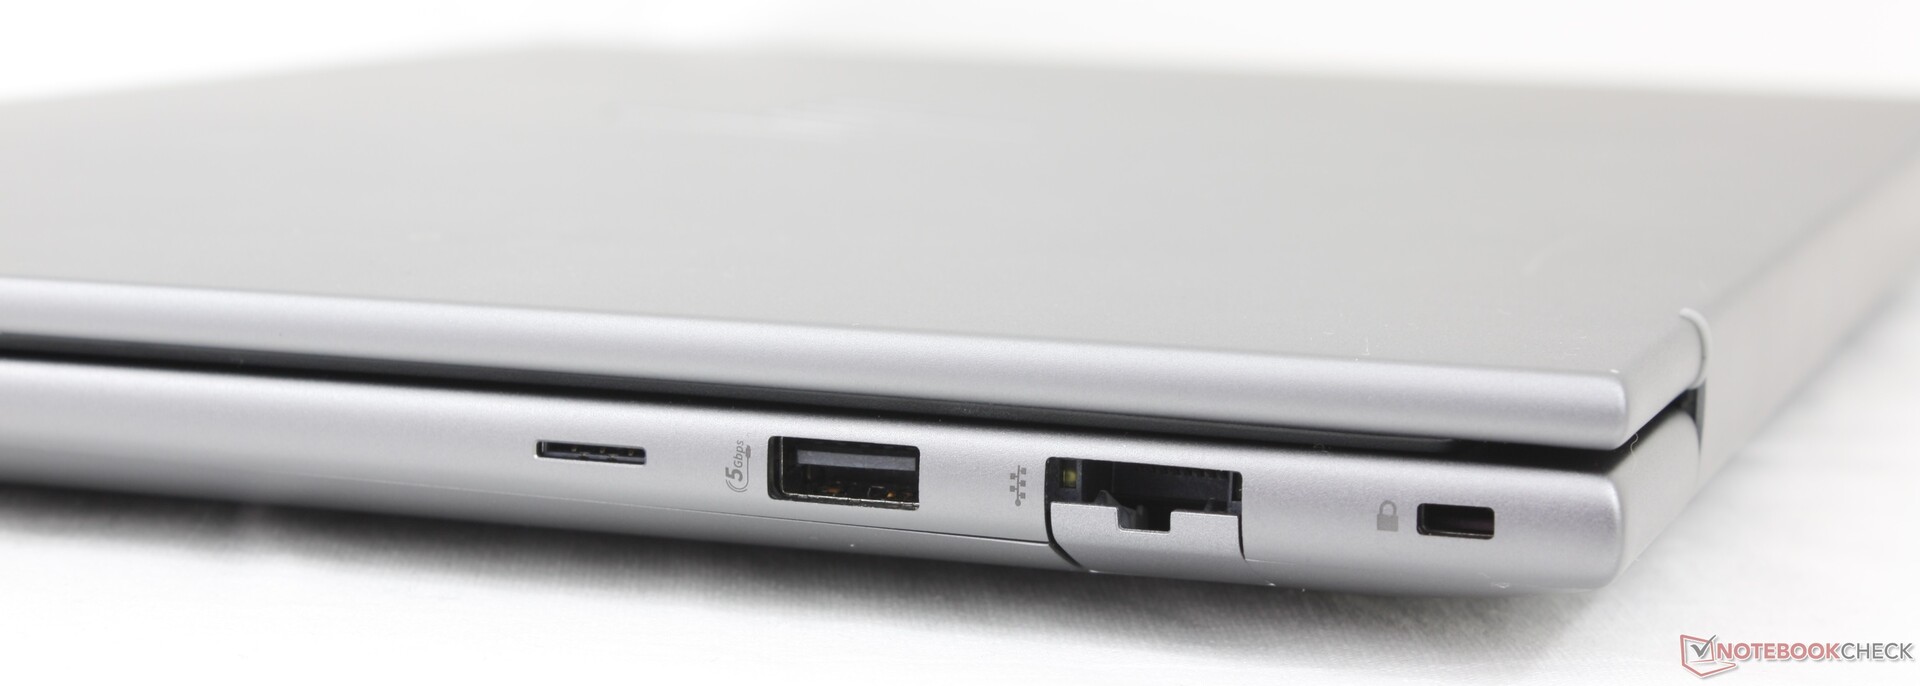
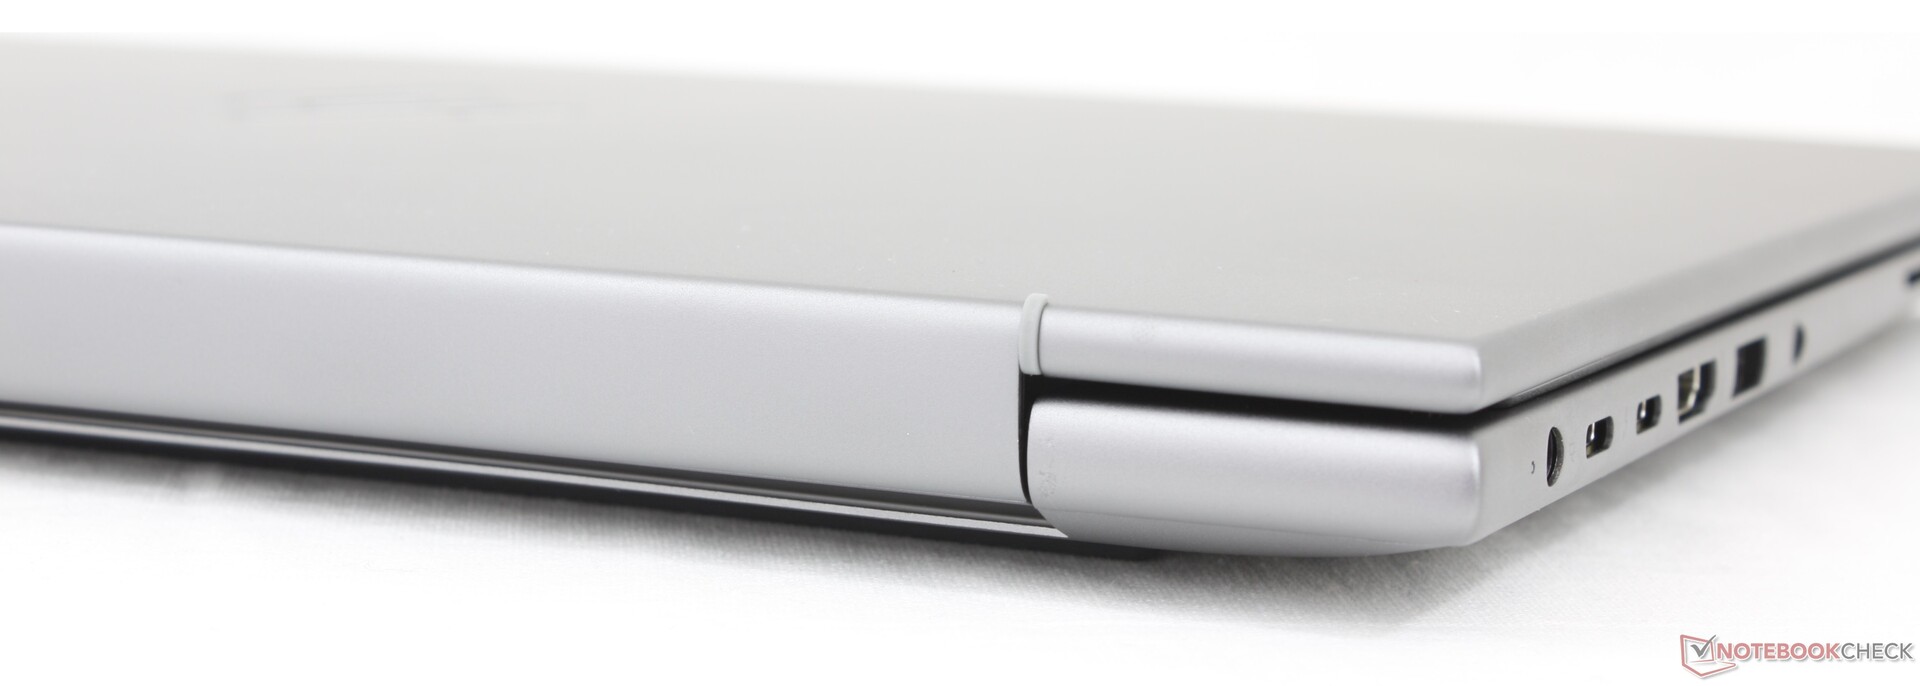
Connectiviteit - Thunderbolt 4 poorten
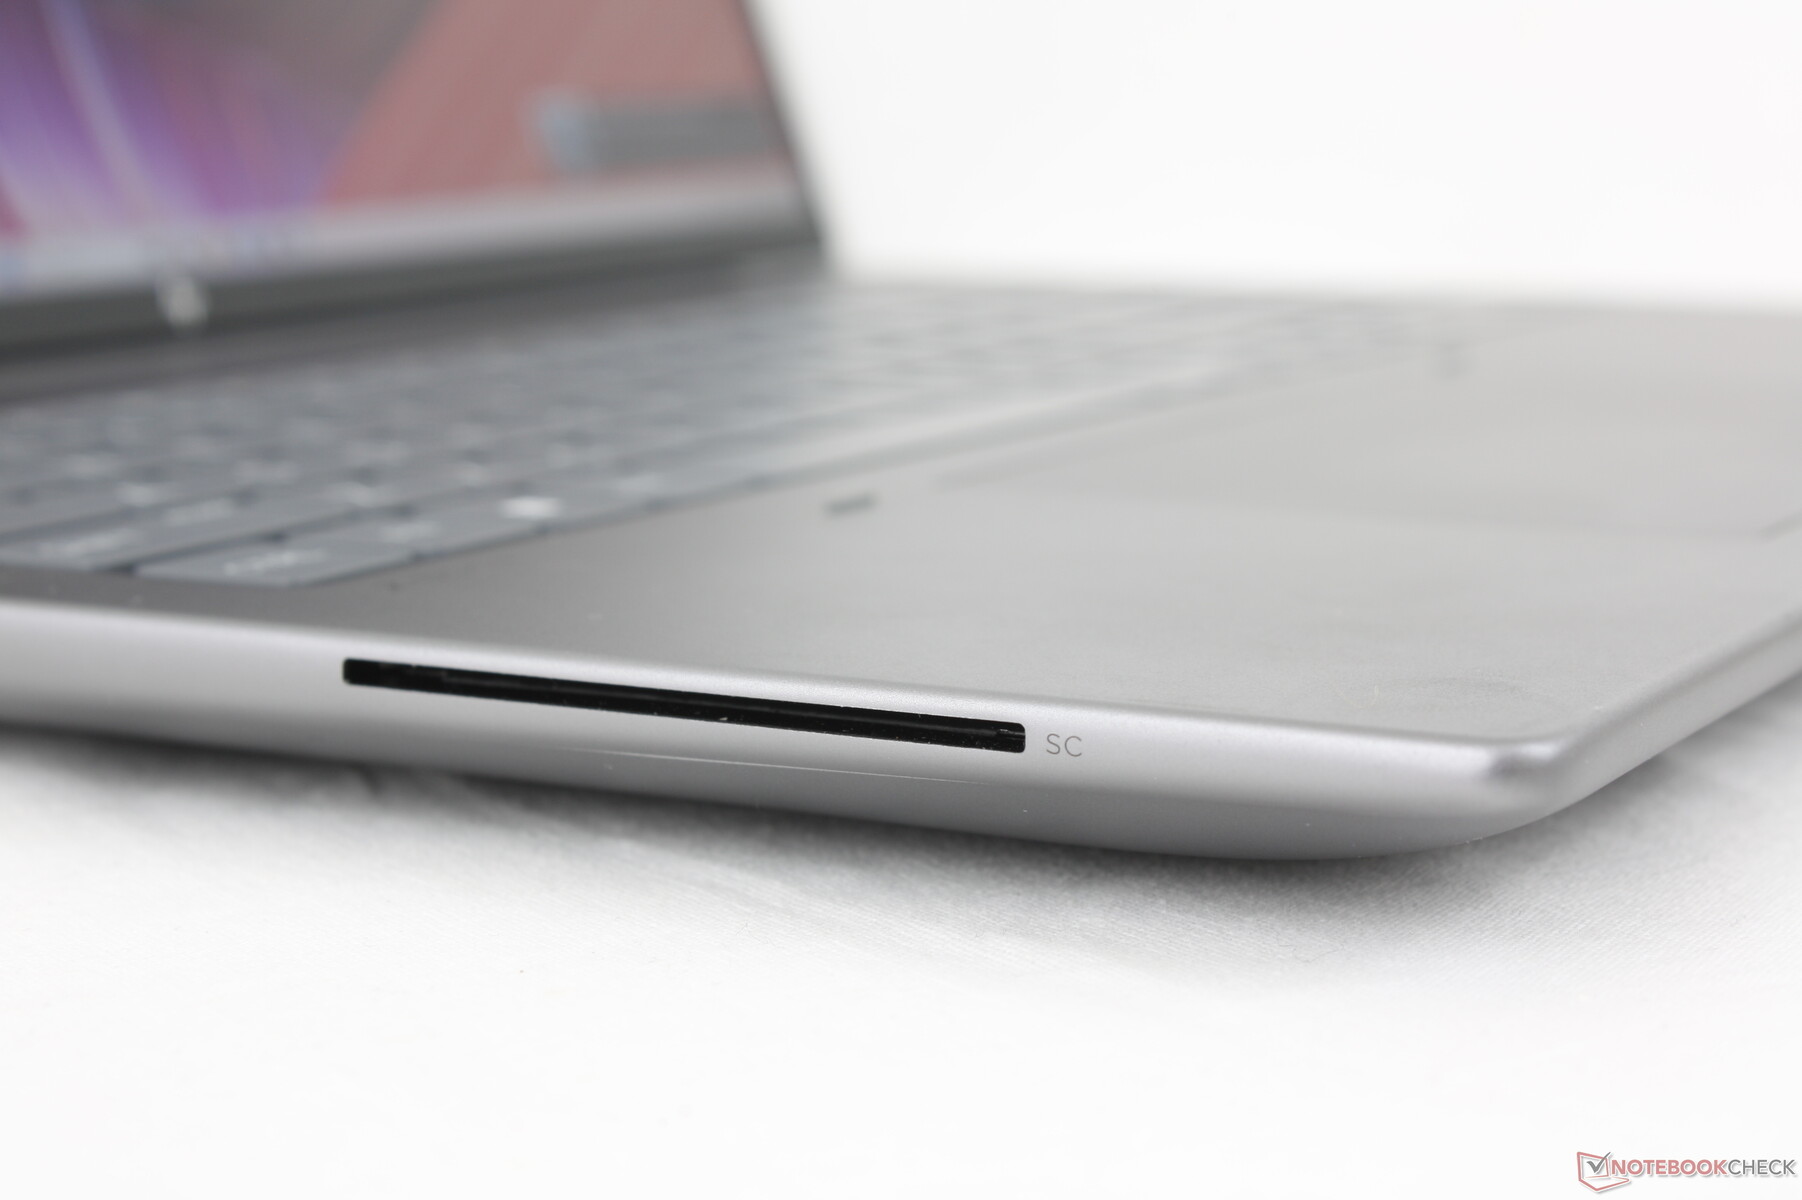
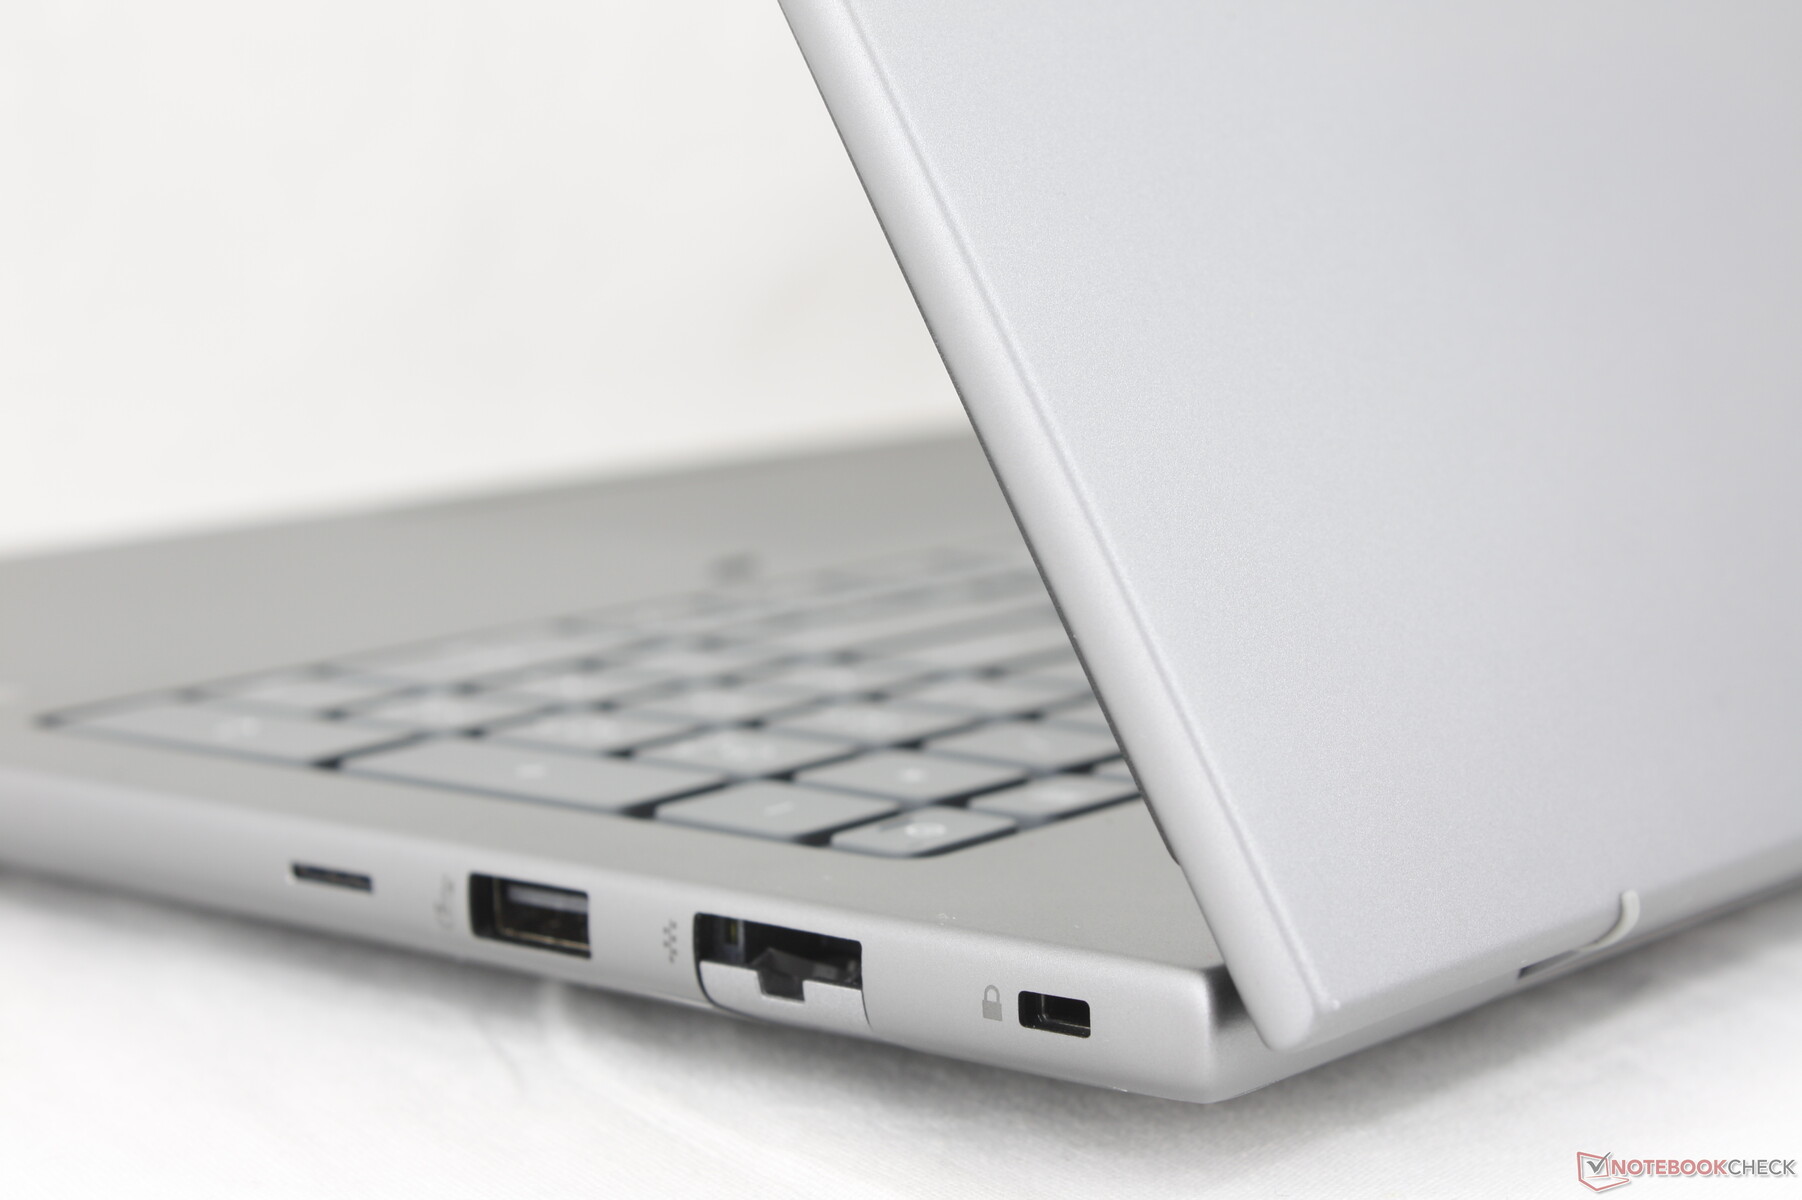
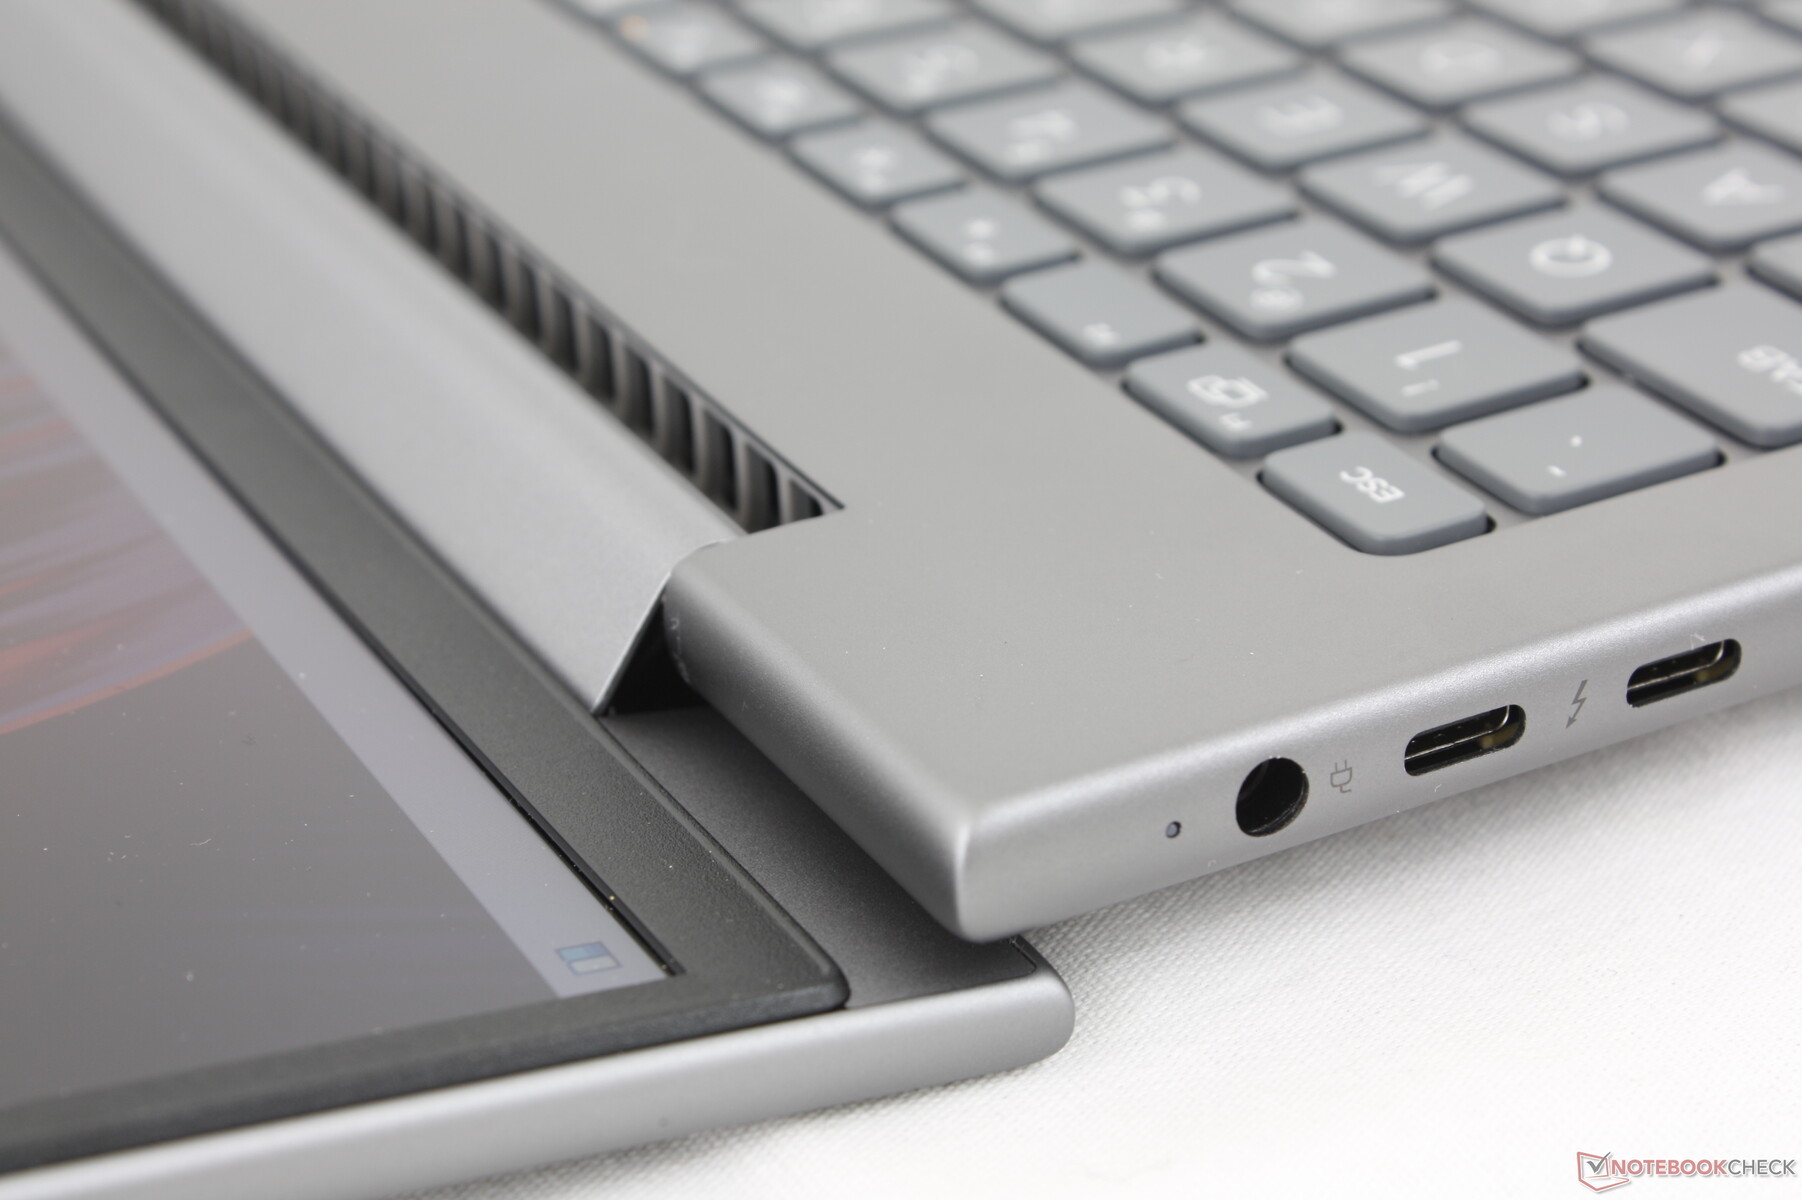
Het model heeft minder USB-A poorten dan de ZBook Power 15 G10 van vorig jaar. Al het andere is terug, inclusief de Smart Card-lezer en dubbele USB-C Thunderbolt 4-poorten, zij het anders gerangschikt. Vooral de poorten langs de linkerrand zijn veel te druk en hadden wat meer gespreid kunnen worden.
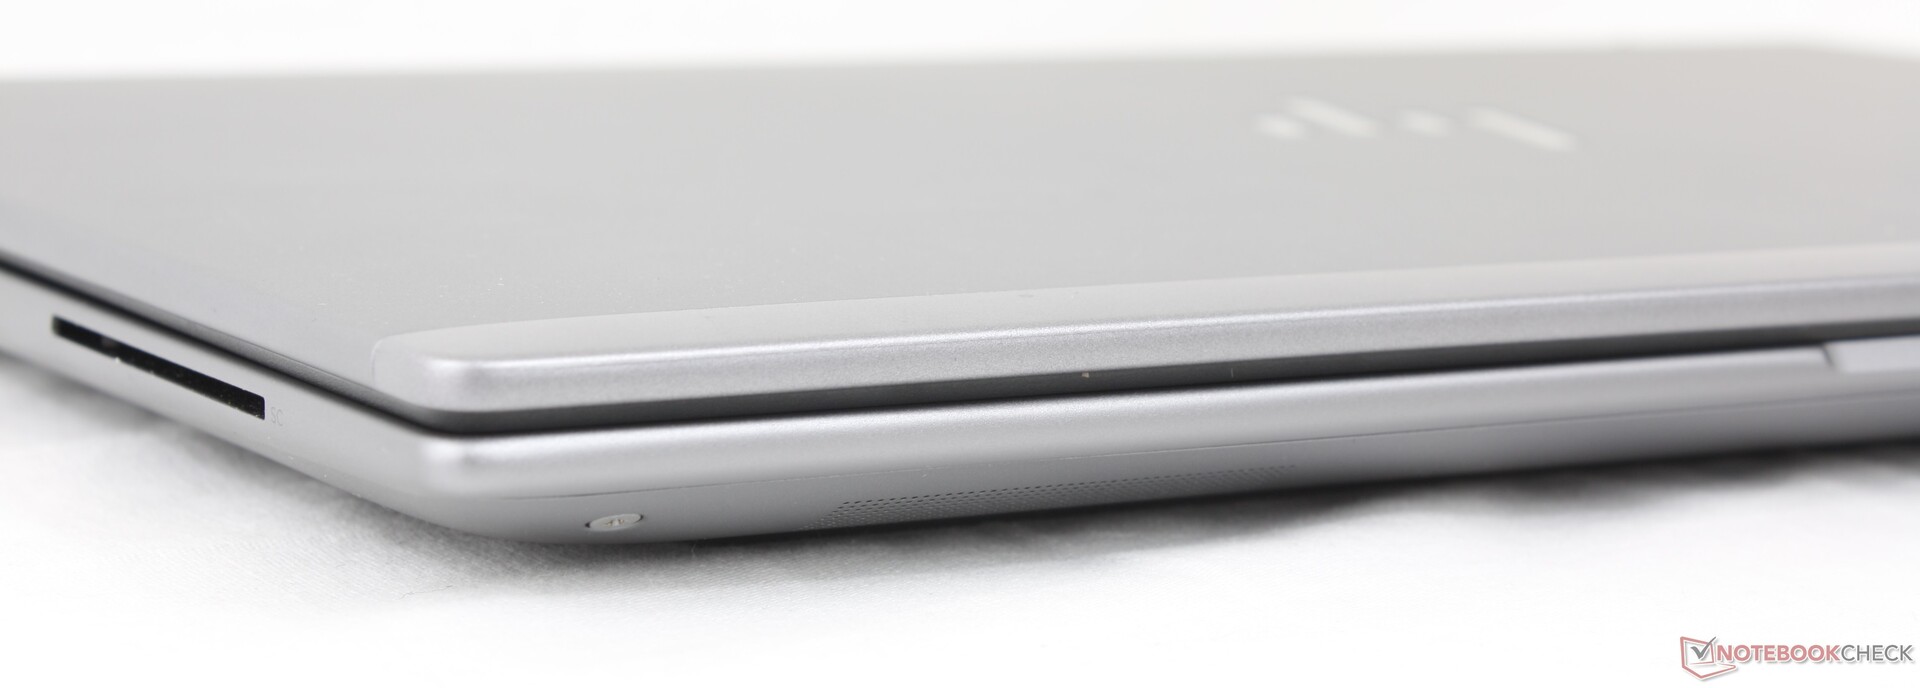

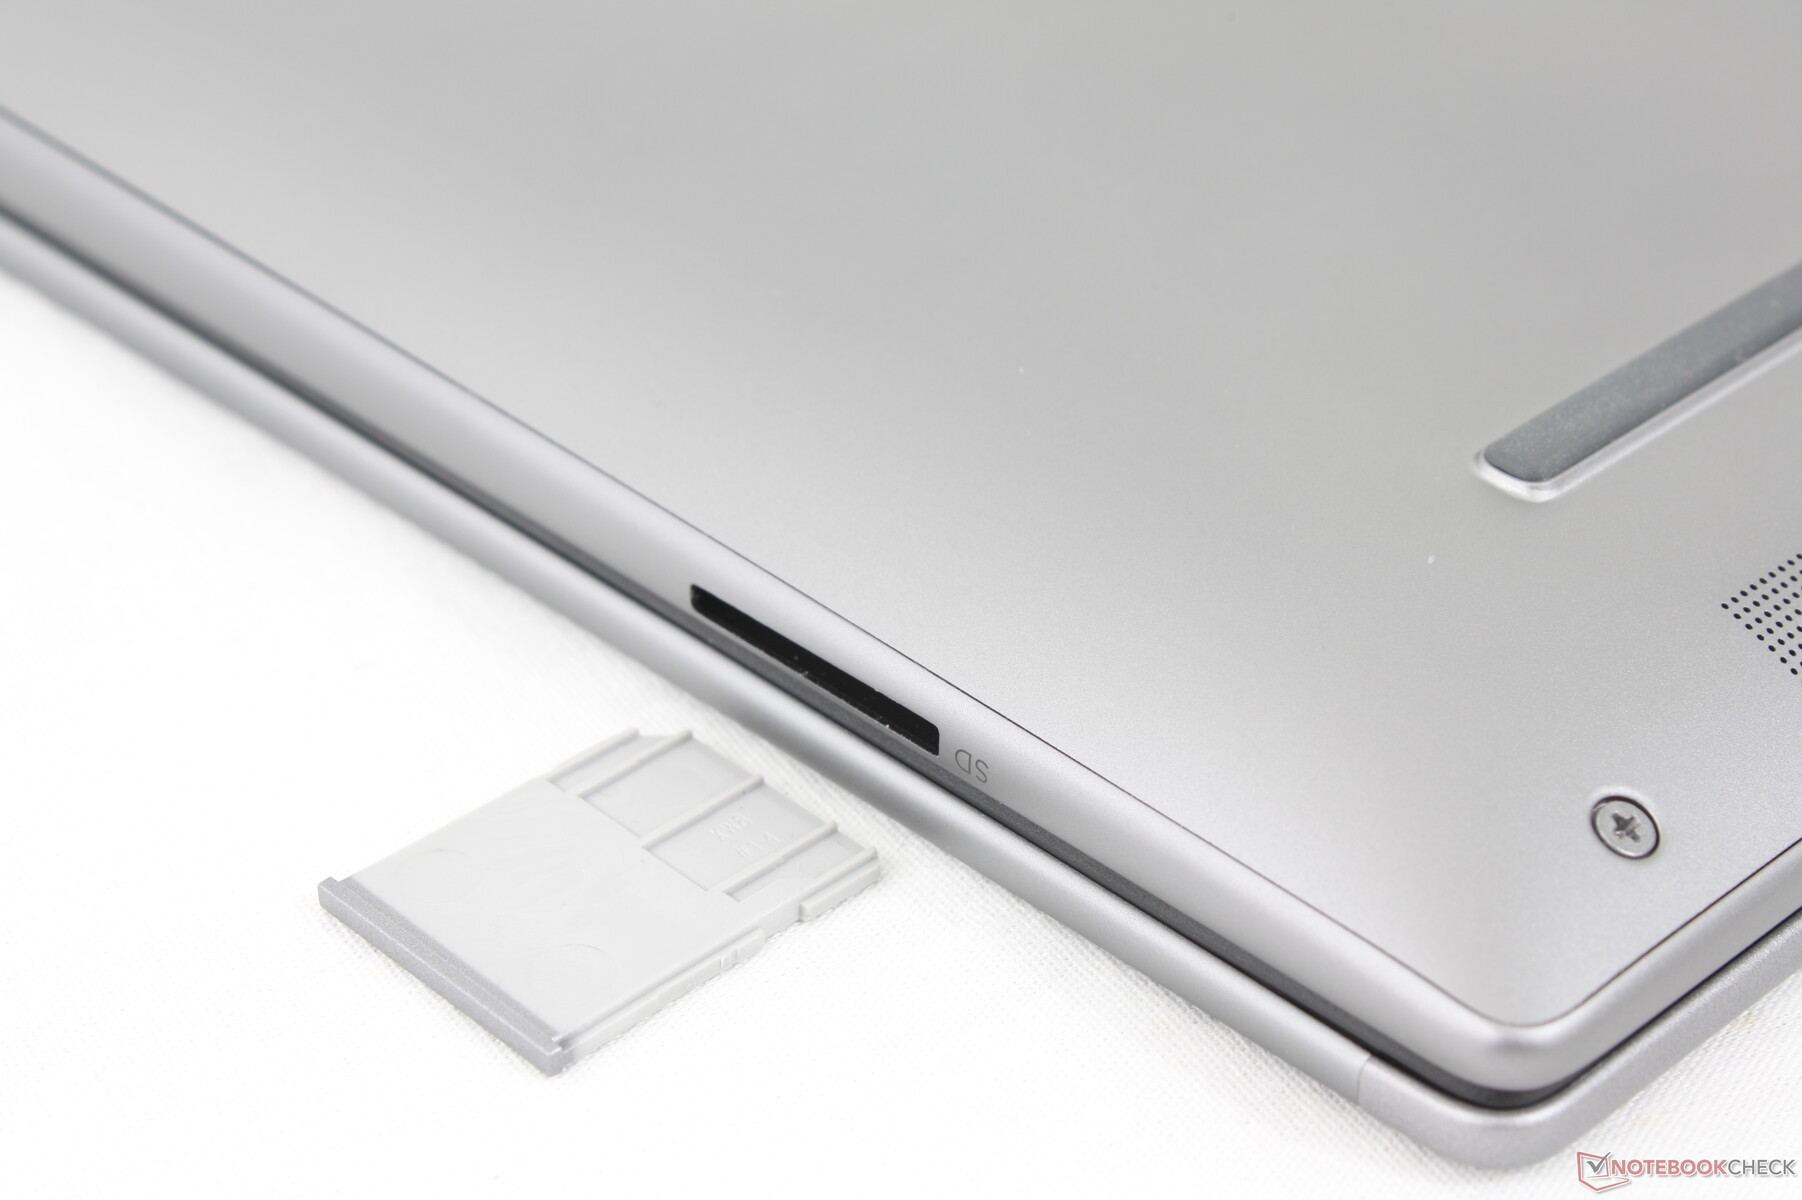
SD-kaartlezer
Het model beschikt over een MicroSD-kaartlezer, terwijl deze functie ontbrak op de ZBook Power 15 G10. De overdrachtsnelheden zijn erg snel; het overzetten van 1 GB aan foto's van onze UHS-II testkaart duurt minder dan 6 seconden, vergeleken met 12 seconden op de ZBook Fury 16 G11 of ThinkPad P1 Gen 7.
| SD Card Reader | |
| average JPG Copy Test (av. of 3 runs) | |
| HP ZBook Power 16 G11 A (Toshiba Exceria Pro SDXC 64 GB UHS-II) | |
| HP ZBook Fury 16 G11 (Toshiba Exceria Pro SDXC 64 GB UHS-II) | |
| Lenovo ThinkPad P1 Gen 7 21KV001SGE (AV Pro V60) | |
| maximum AS SSD Seq Read Test (1GB) | |
| HP ZBook Power 16 G11 A (Toshiba Exceria Pro SDXC 64 GB UHS-II) | |
| HP ZBook Fury 16 G11 (Toshiba Exceria Pro SDXC 64 GB UHS-II) | |
| Lenovo ThinkPad P1 Gen 7 21KV001SGE (AV Pro V60) | |
Communicatie
De MediaTek MT7922 wordt standaard geleverd voor Wi-Fi 6E en Bluetooth 5.2 connectiviteit. Er zijn ook Realtek-opties beschikbaar, evenals de HP 4000 of Qualcomm 9205 voor WAN-connectiviteit.
Webcam
Een 5 MP webcam is standaard naast IR en een fysieke sluiter slider vergelijkbaar met de ThinkPad P16s G2. De Precision 5690 wordt geleverd met een 2 MP webcam met een veel lagere resolutie.


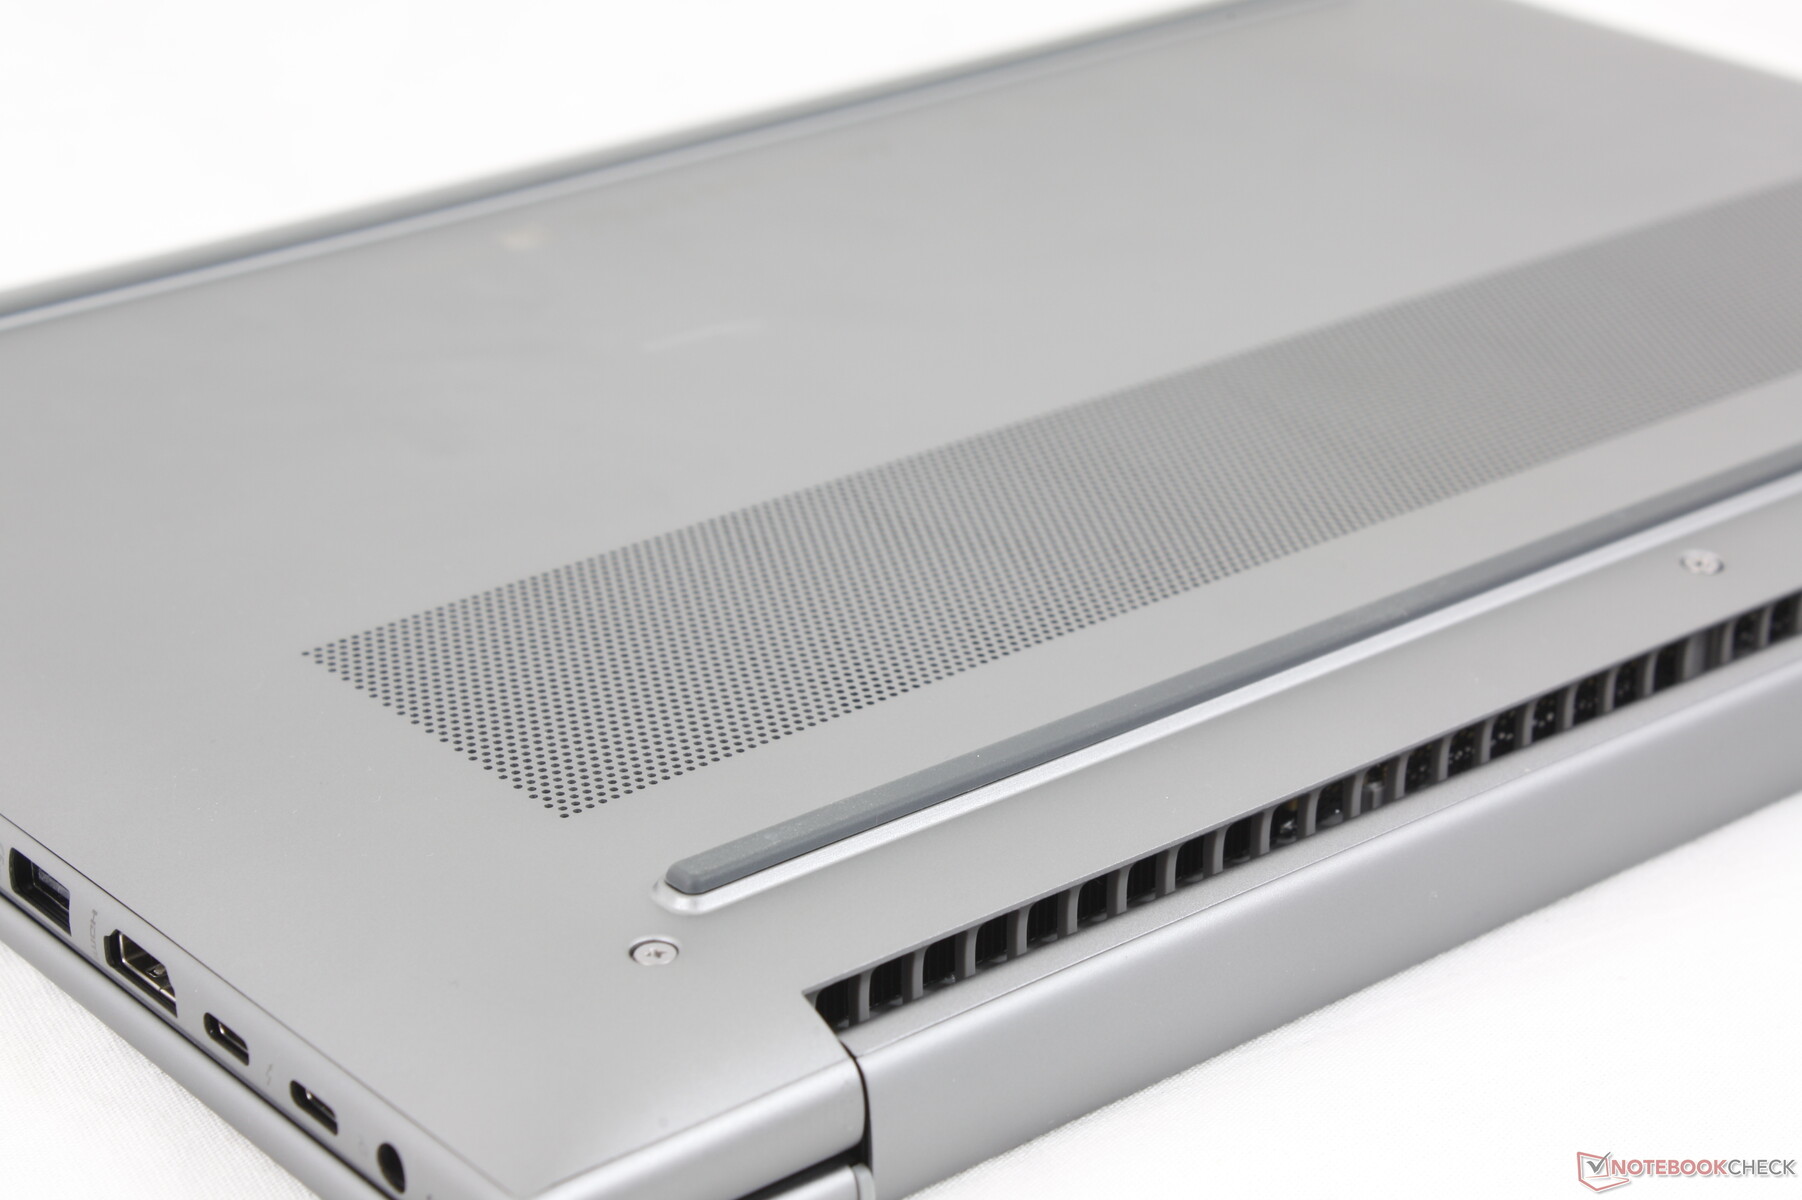
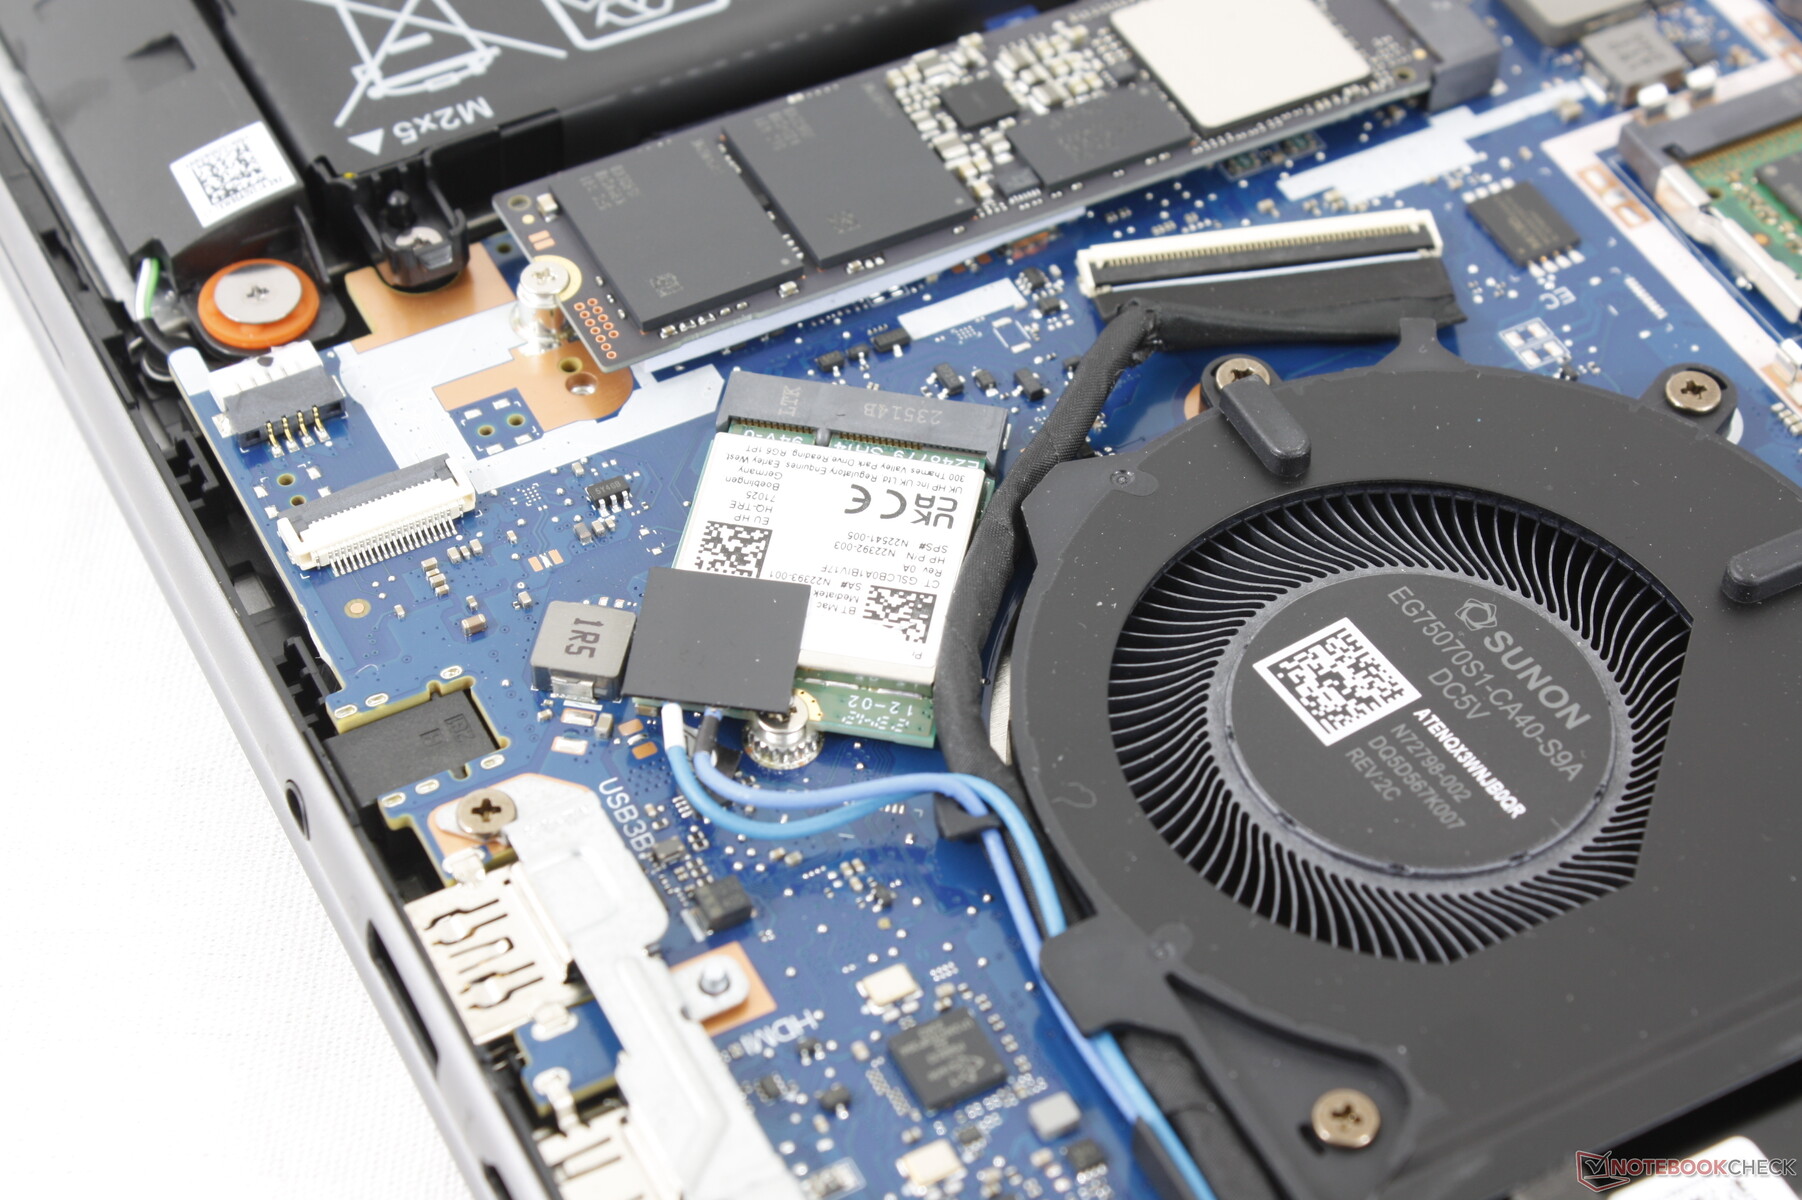
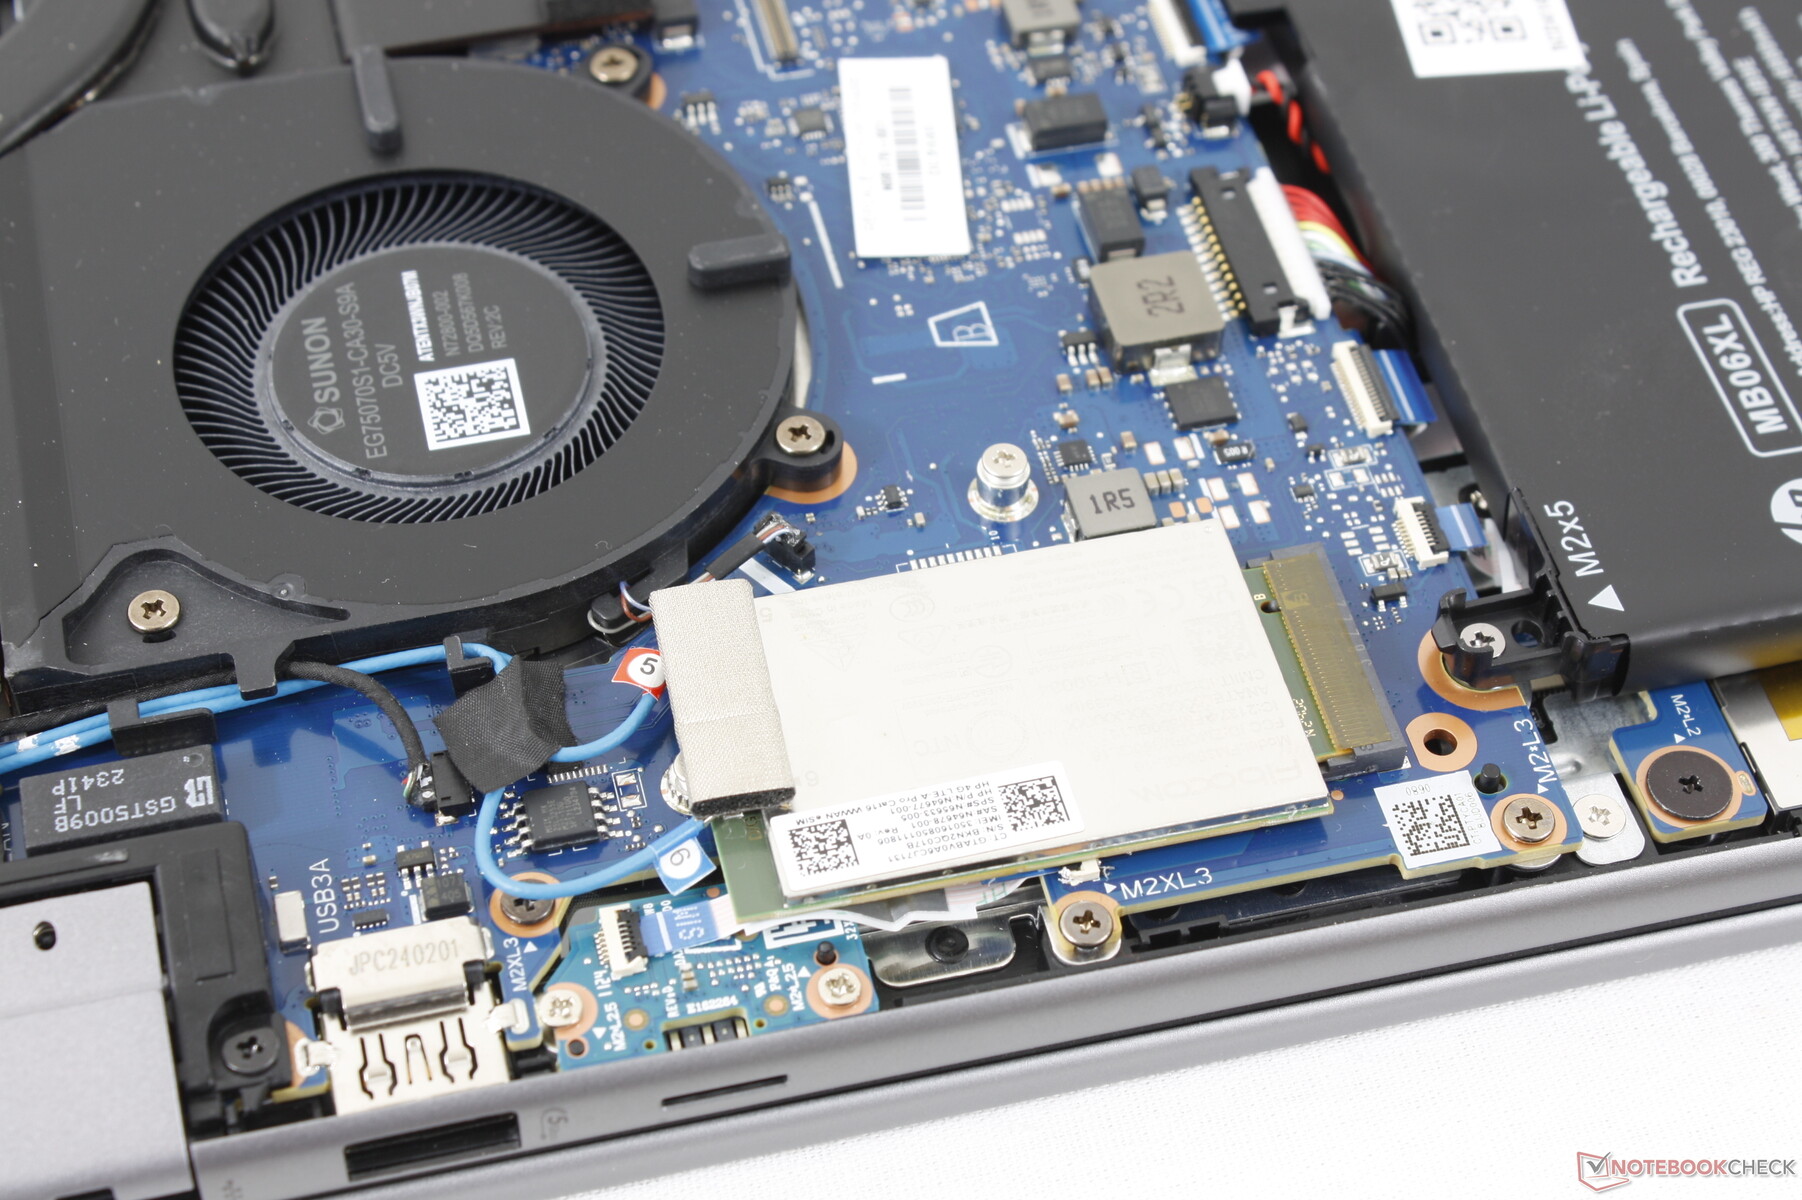
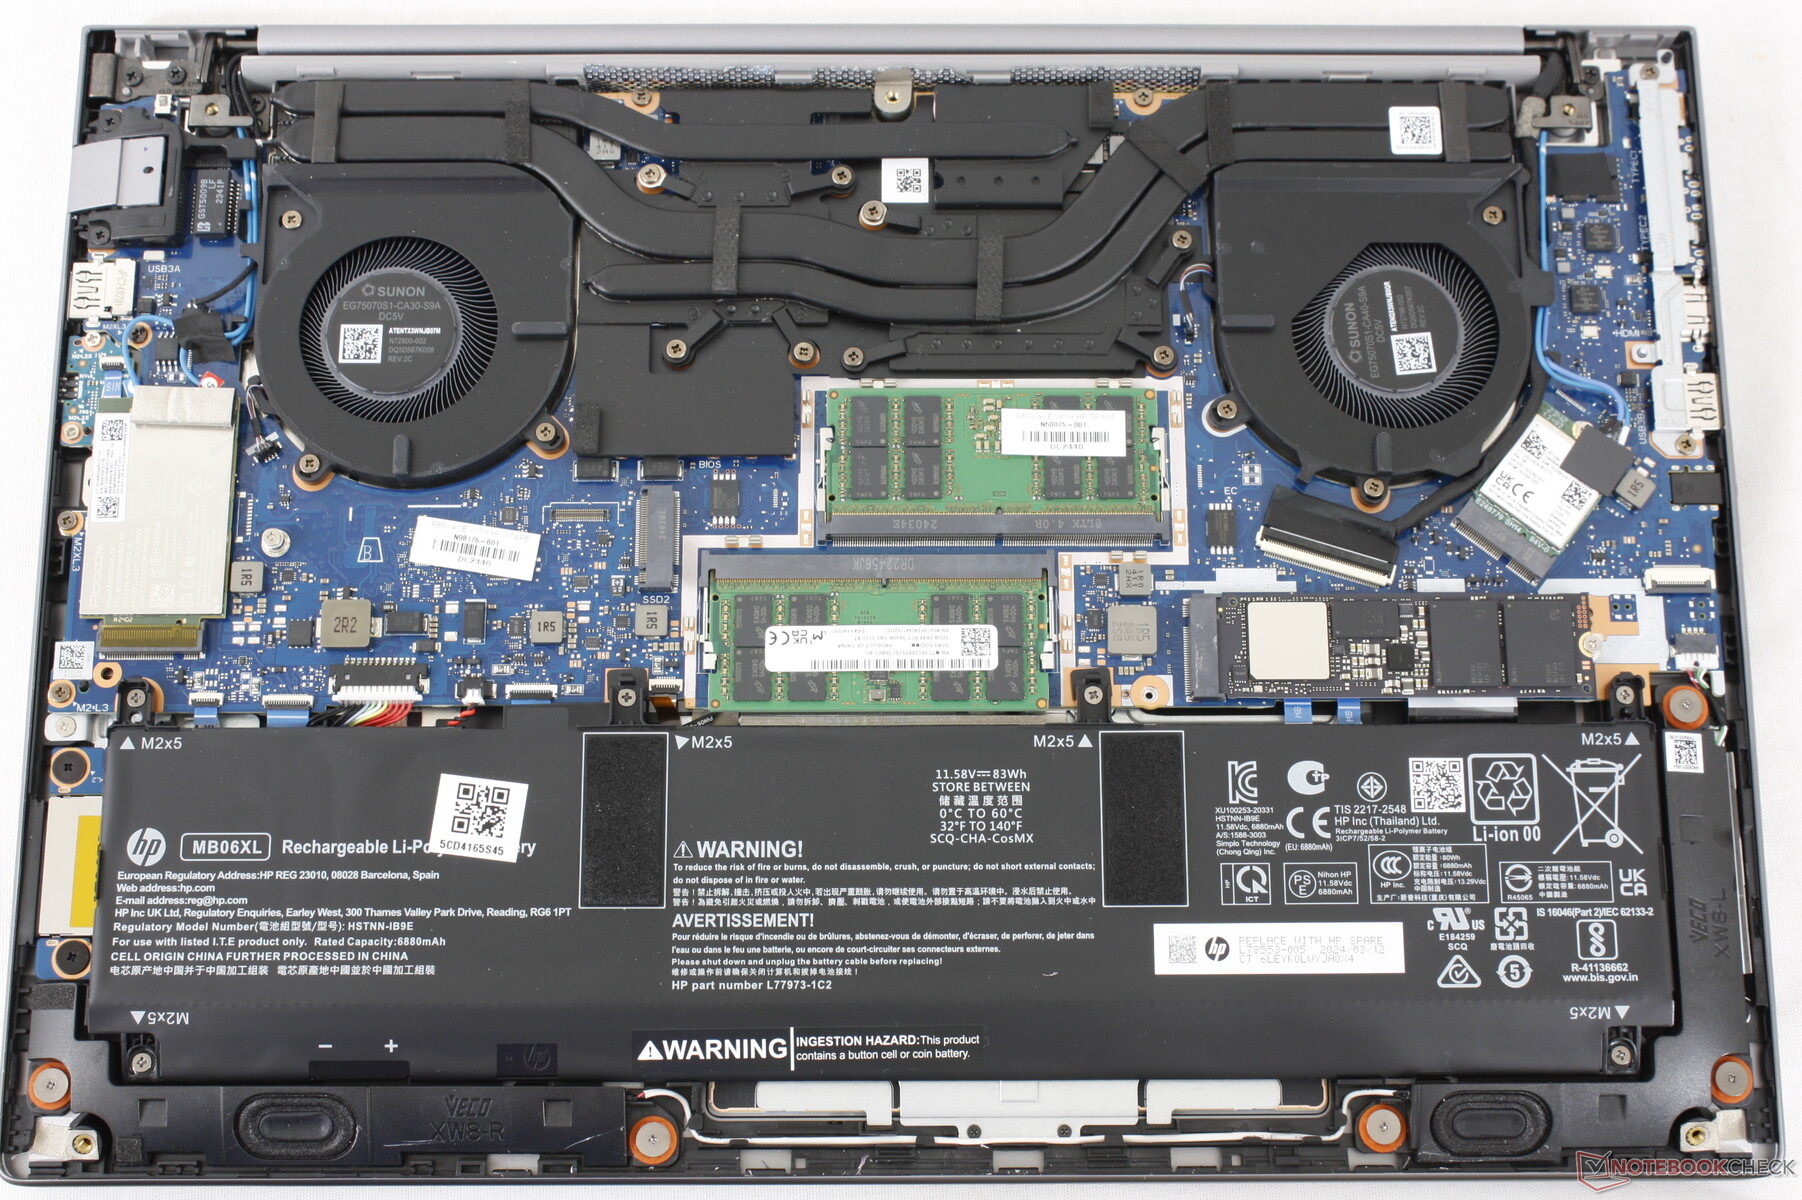
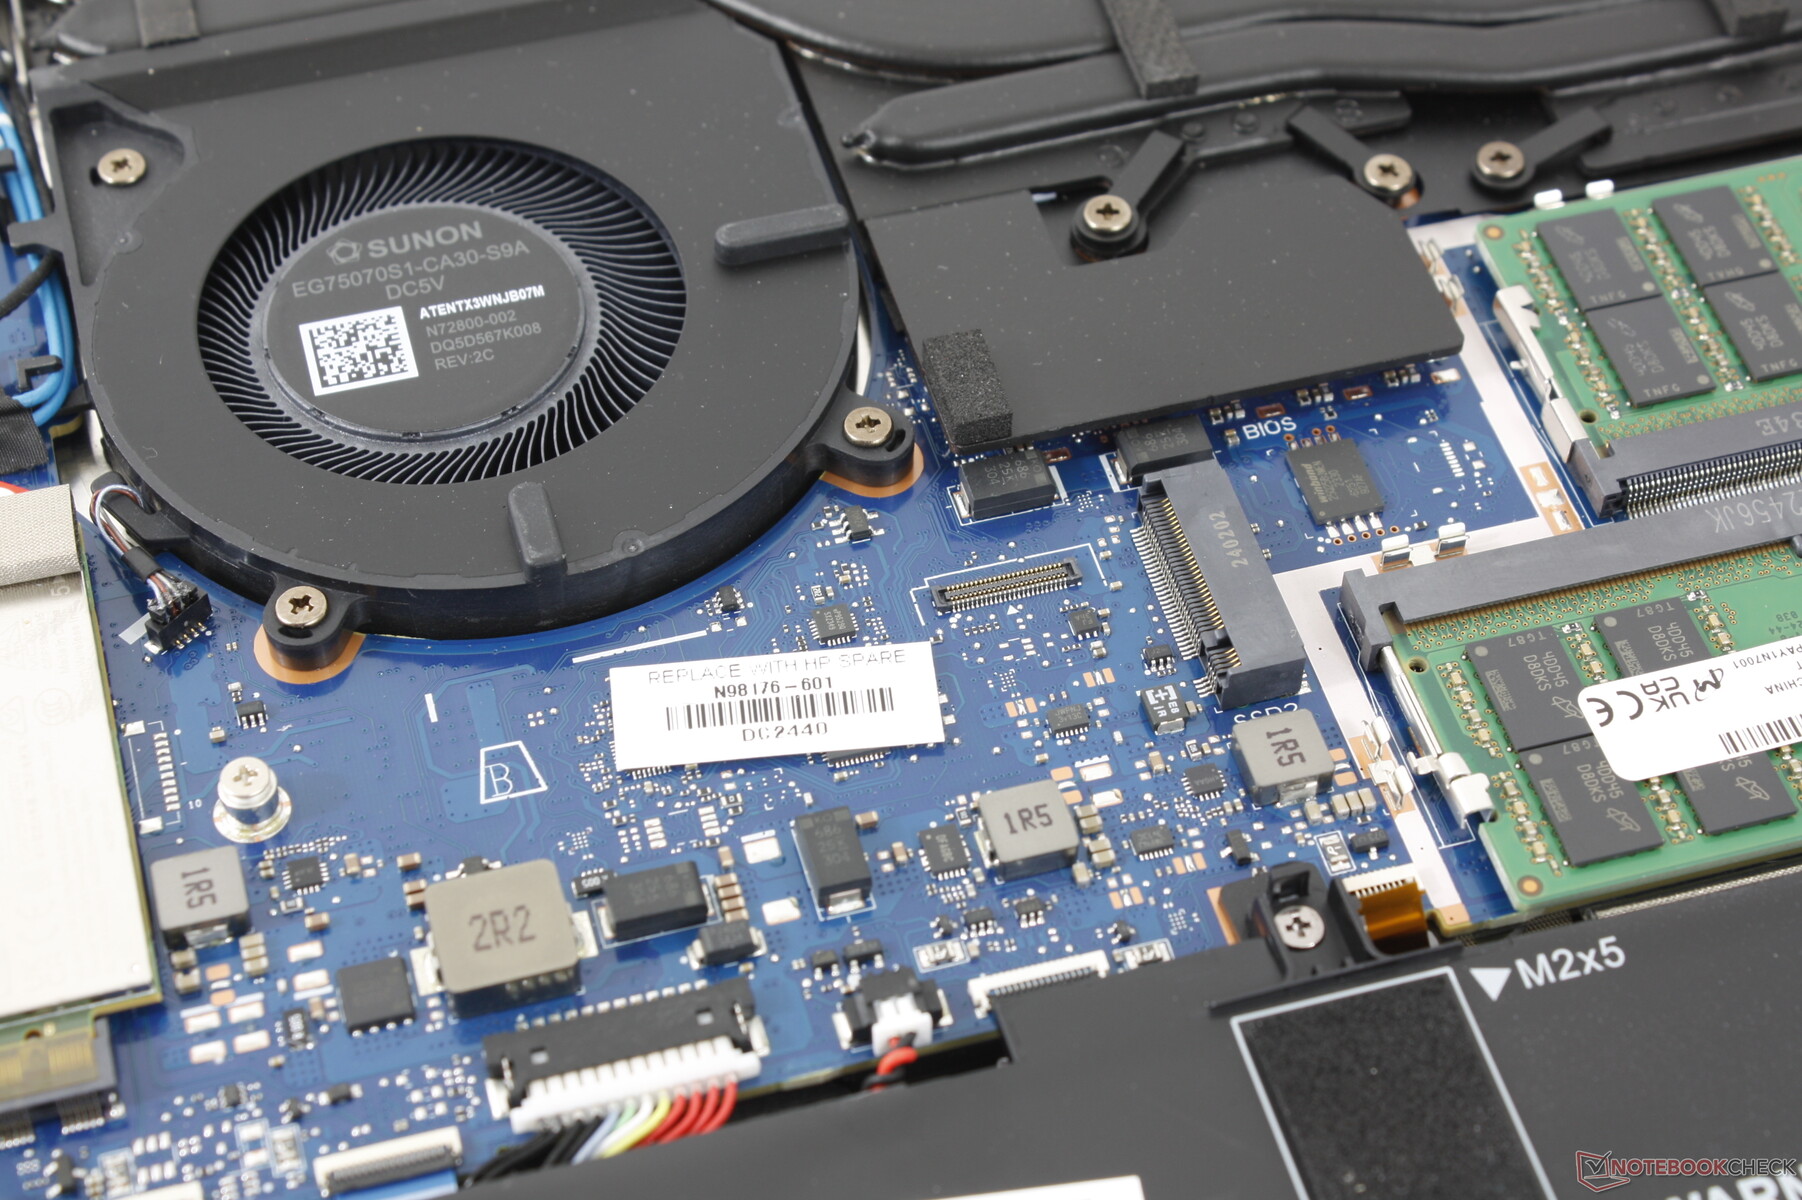
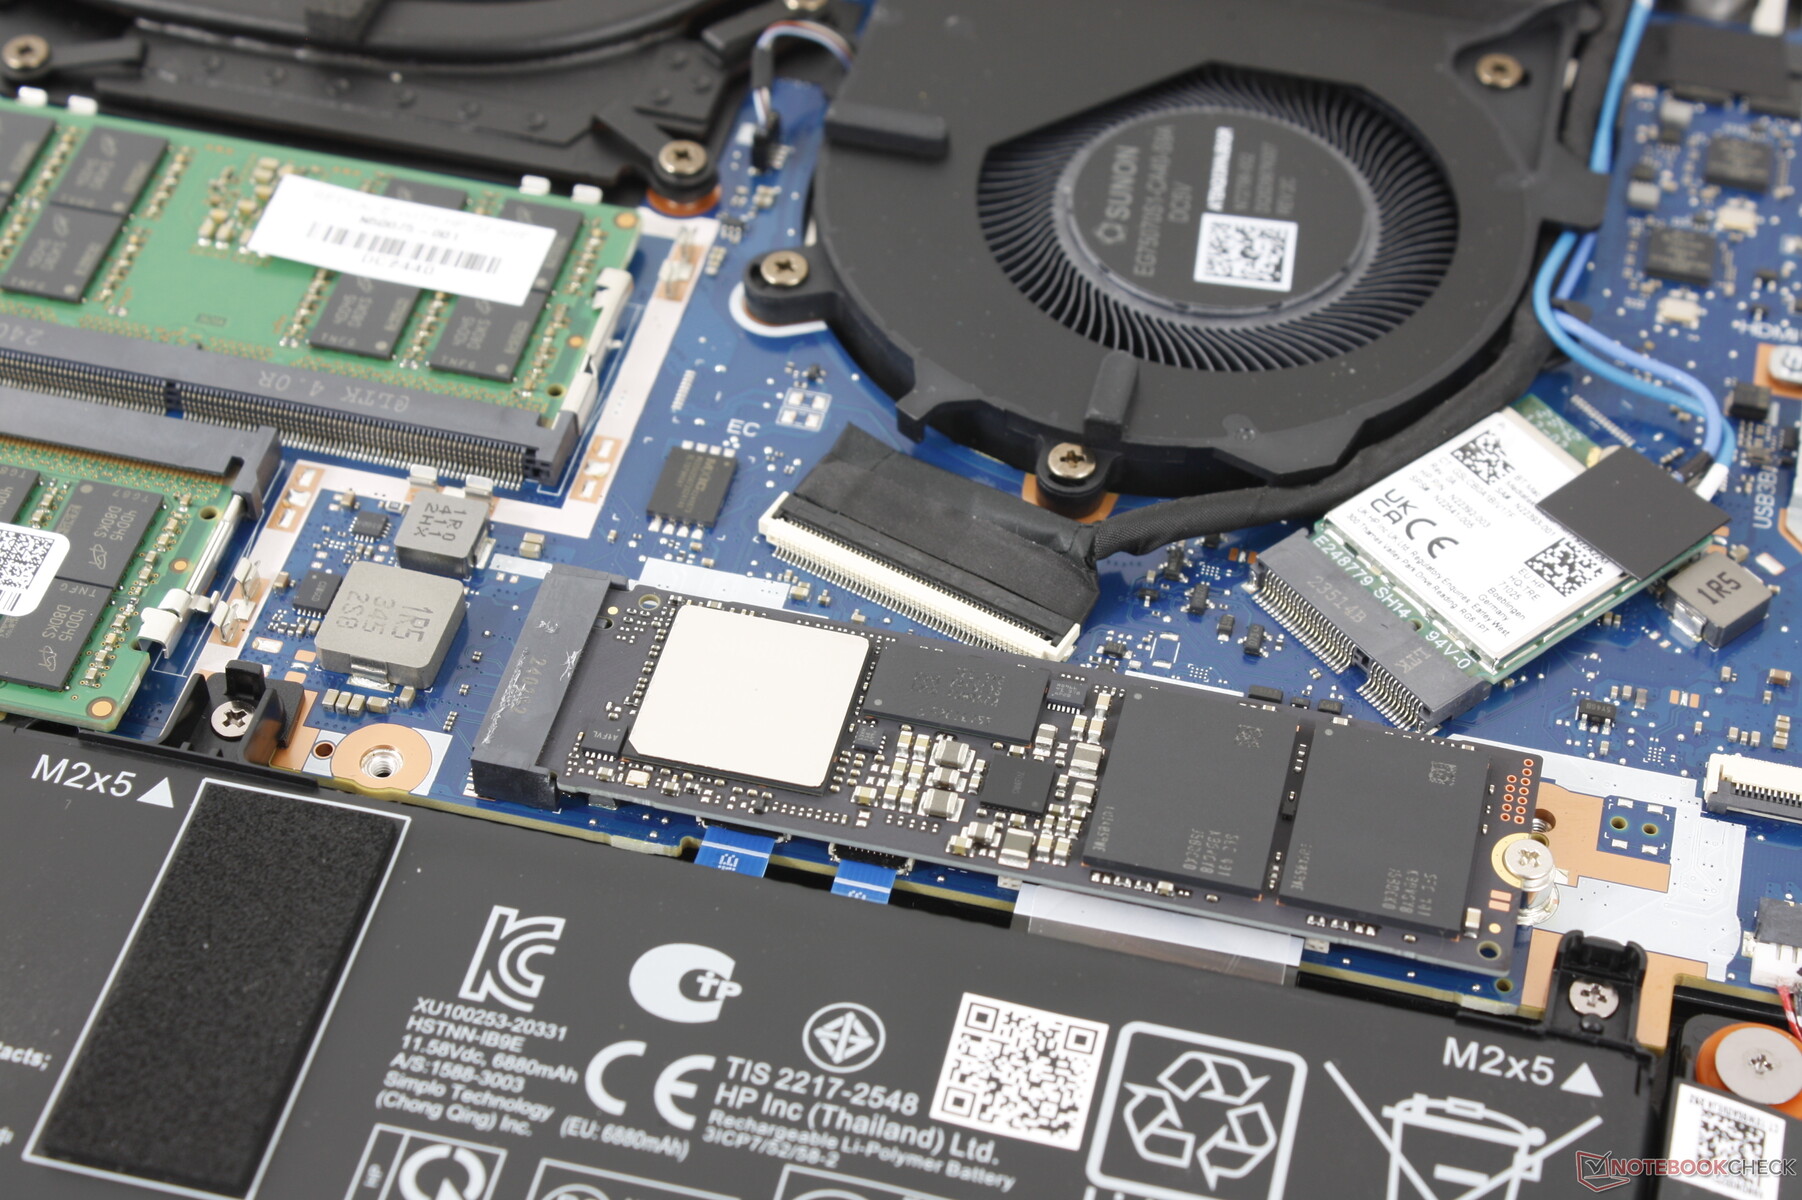
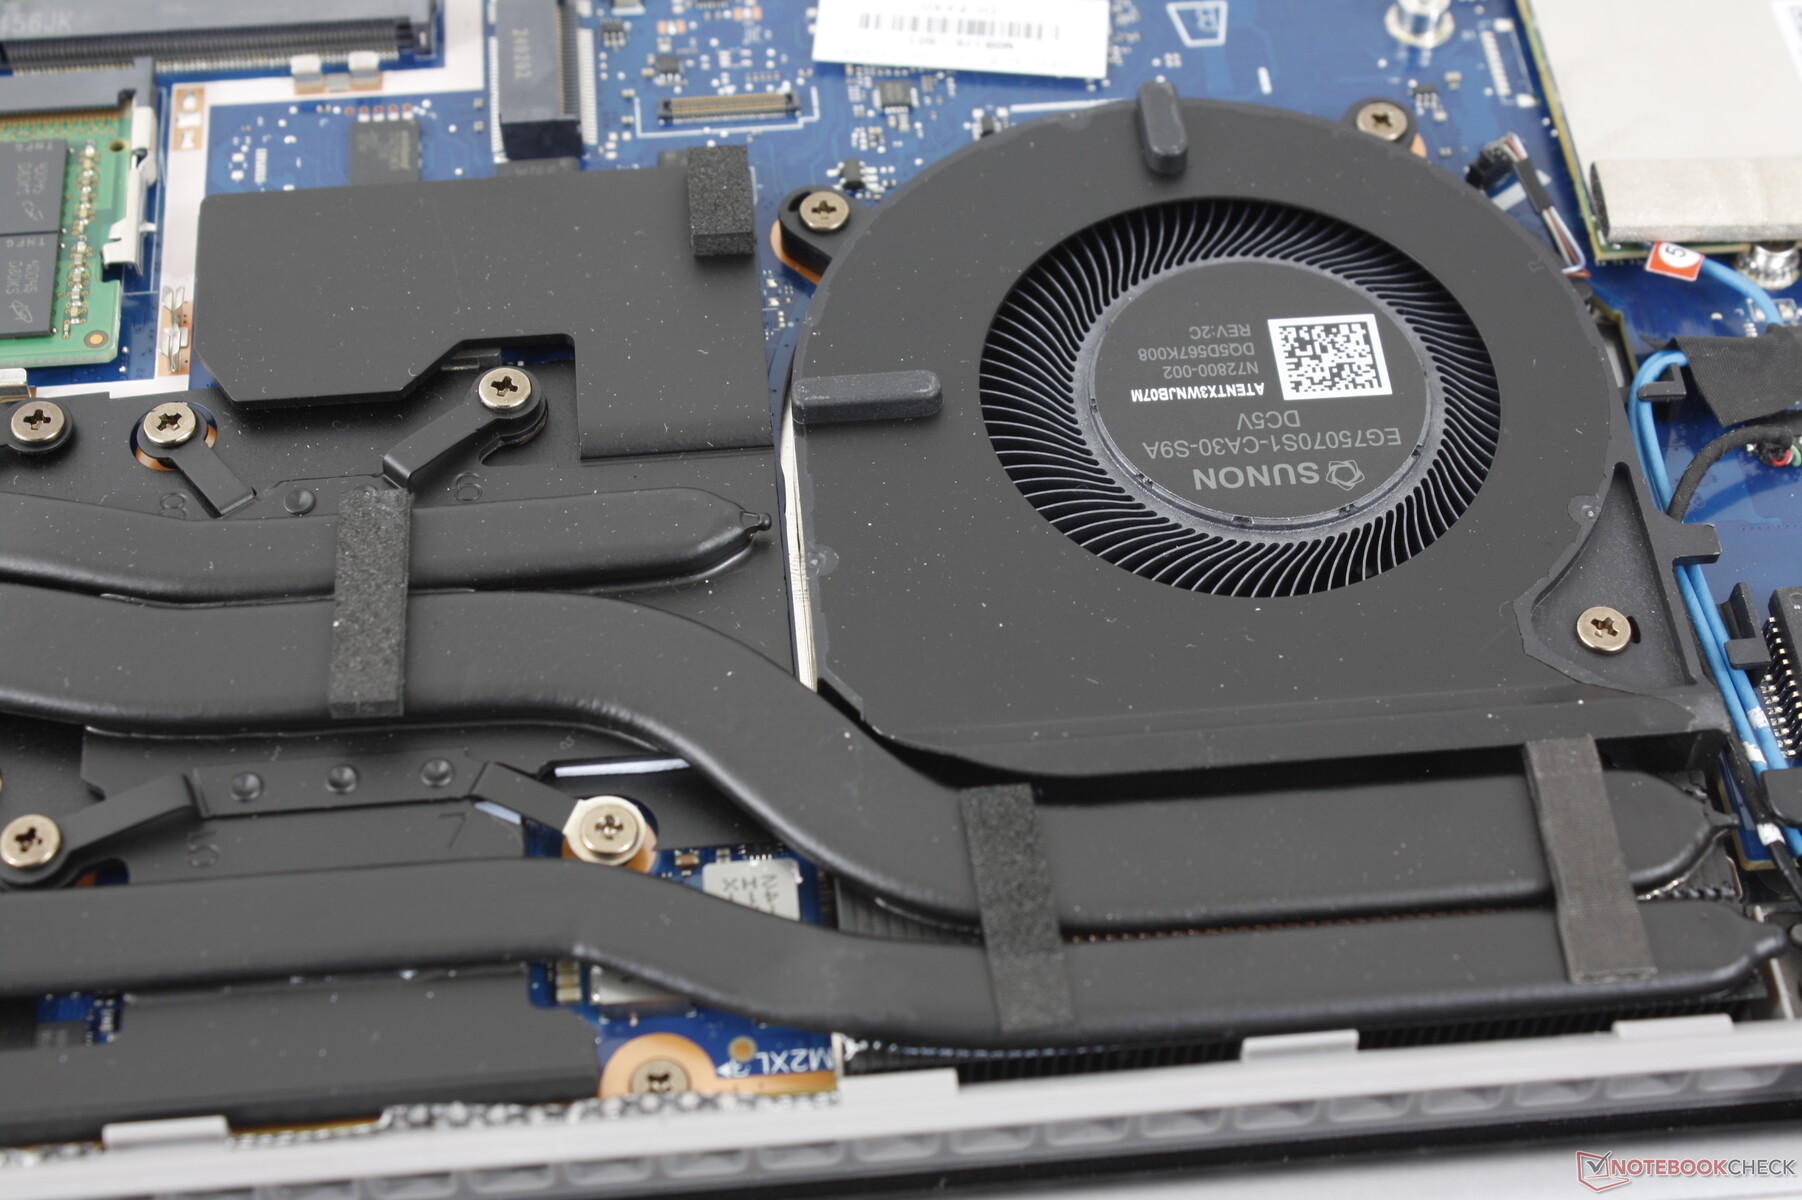
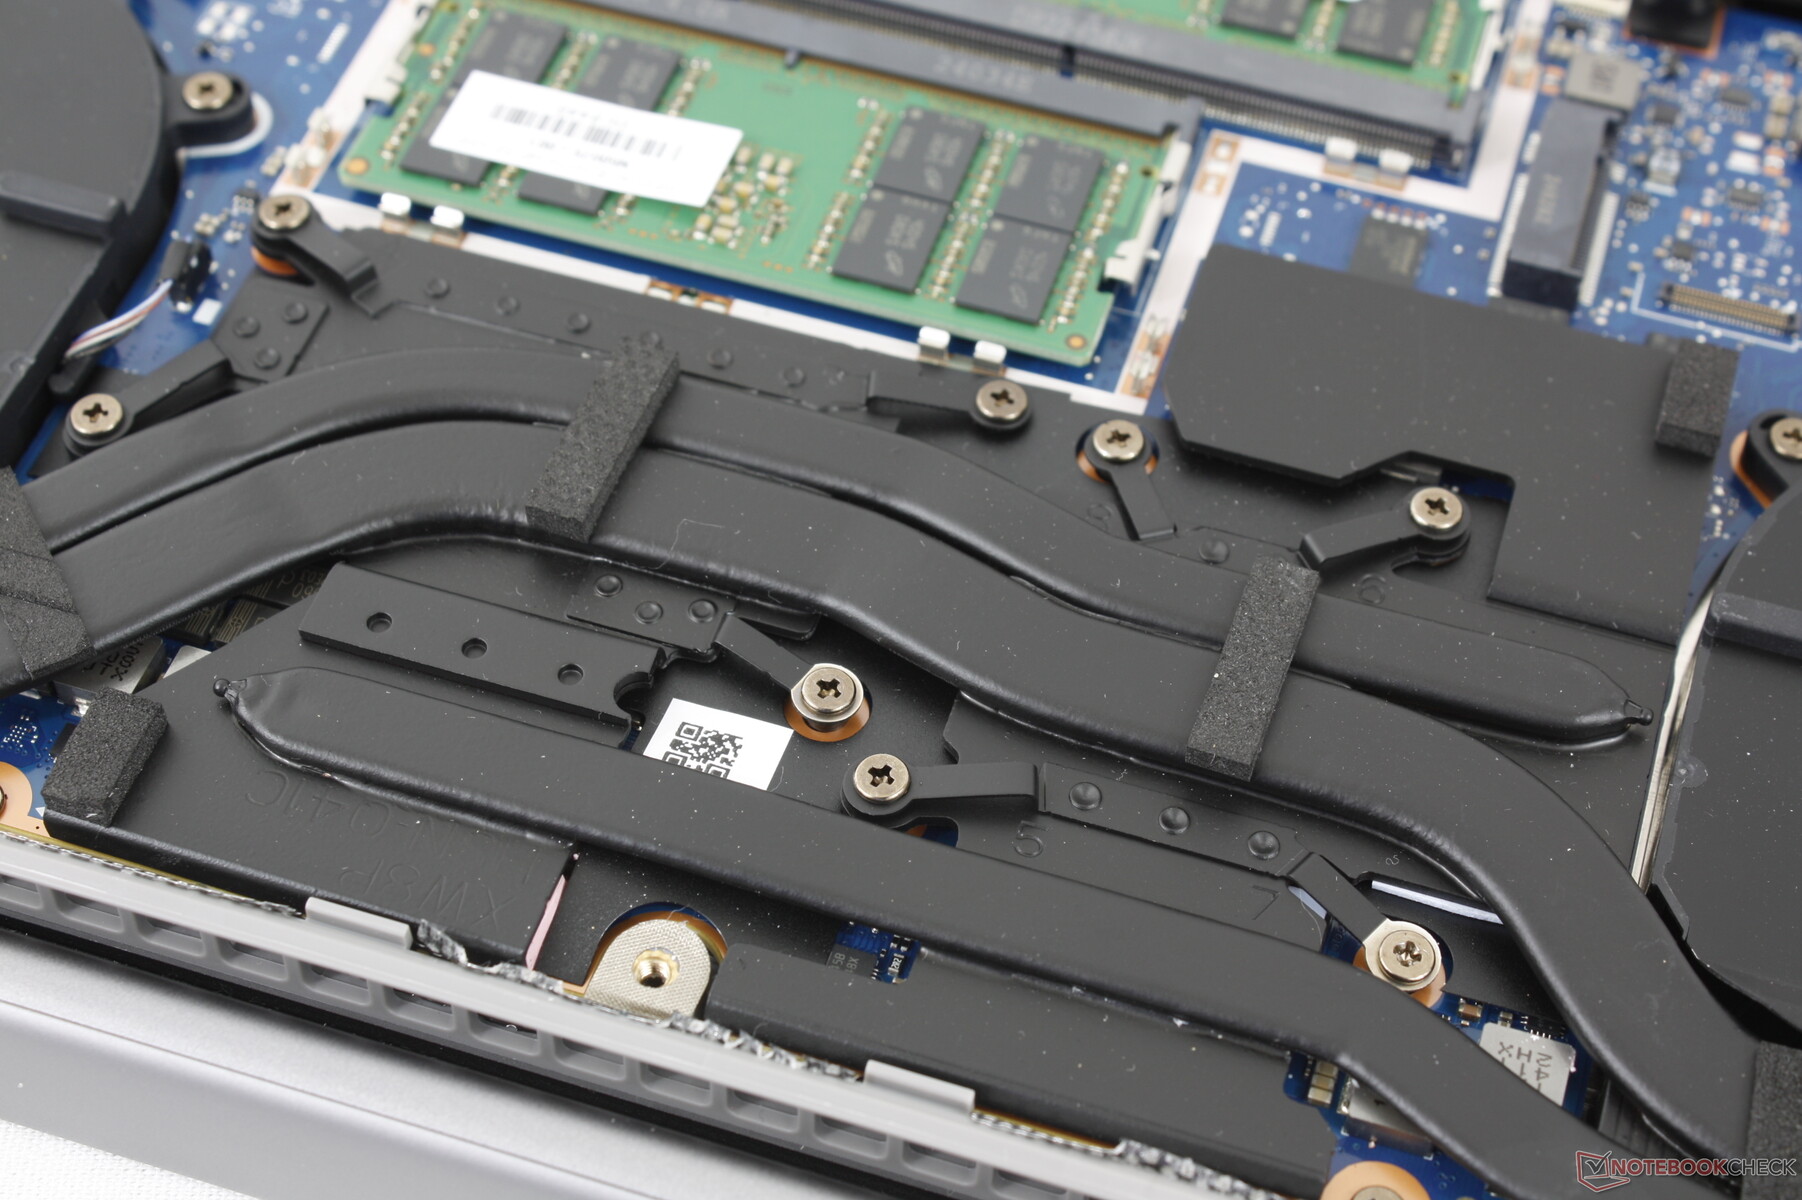
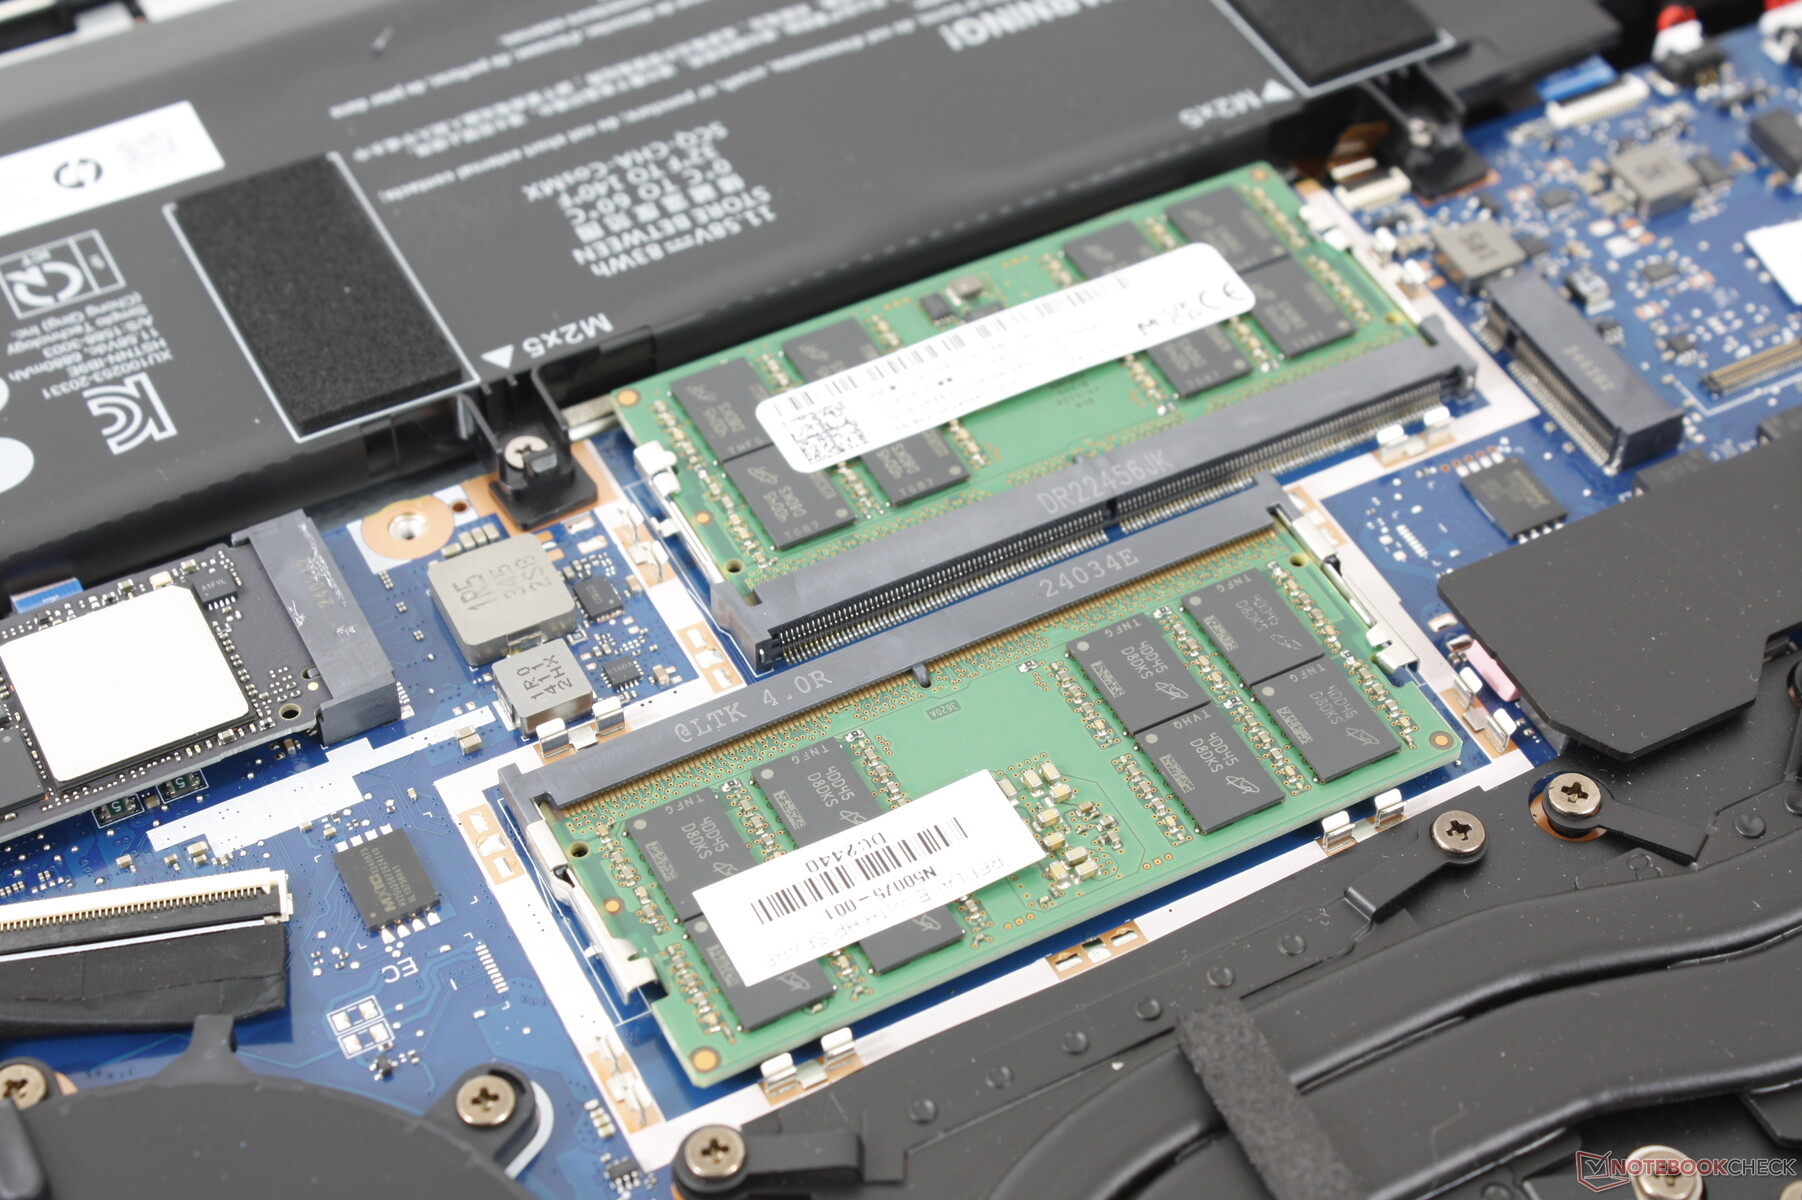
Onderhoud
Het onderste paneel springt er relatief gemakkelijk af met slechts een kruiskopschroevendraaier en een scherpe rand. De interne onderdelen zijn volledig opnieuw ontworpen in vergelijking met de ZBook Power 15 G10, maar met behoud van dezelfde opwaardeerbare opties zoals de 2x SODIMM-sleuven, 2x PCIe4 x4 NVMe SSD-sleuven en verwijderbare WLAN-module. WAN is deze keer een extra optie.
Duurzaamheid
De productie maakt gebruik van halogeenarme materialen, terwijl de verpakking bestaat uit gegoten papierpulp en gerecycled plastic van respectievelijk 100% duurzame bronnen en 60% post-consumer bronnen.
Accessoires en garantie
Er zitten geen extra's in de doos bij de AC-adapter en het papierwerk. Teleurstellend is dat de standaard beperkte garantie slechts één jaar is bij aankoop in de VS, terwijl de ZBook Fury standaard met drie jaar wordt geleverd.
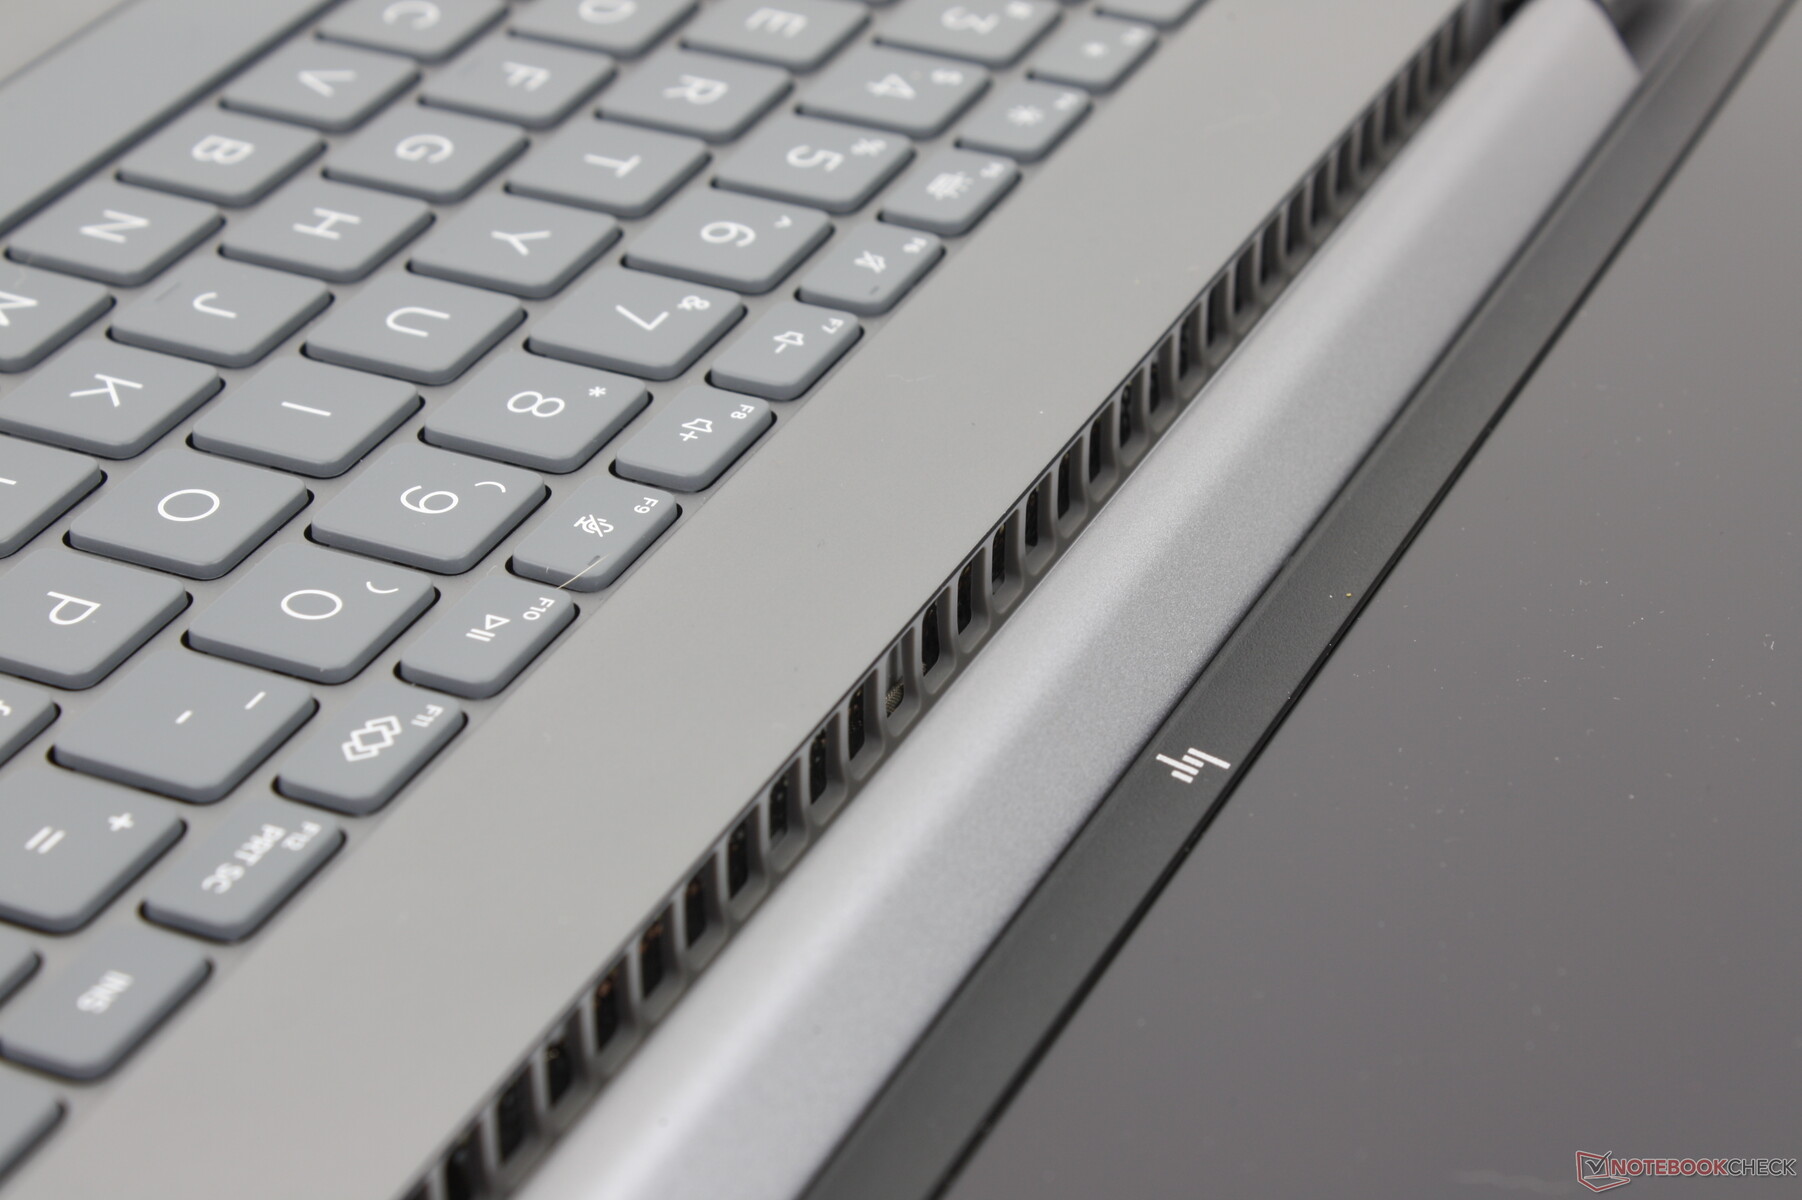
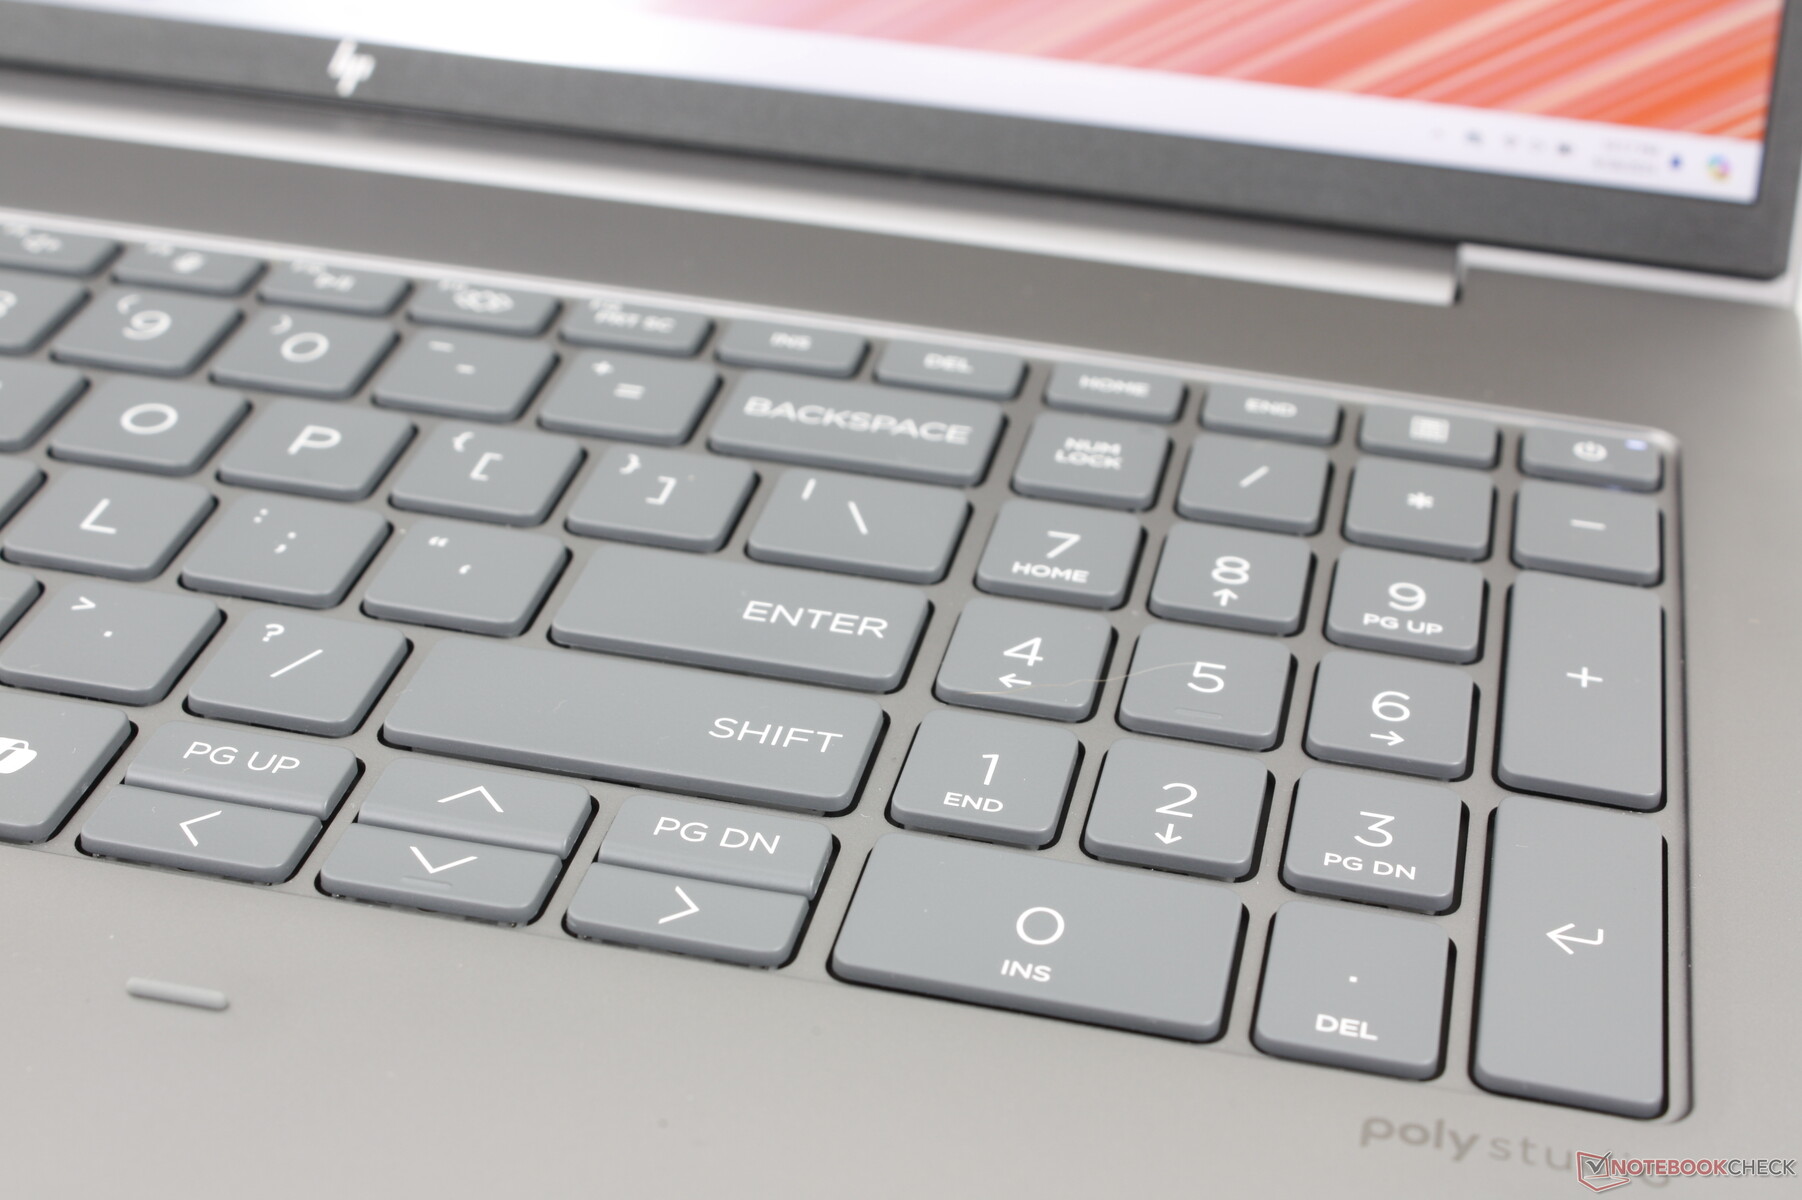
Invoerapparaten - Ruime toetsen
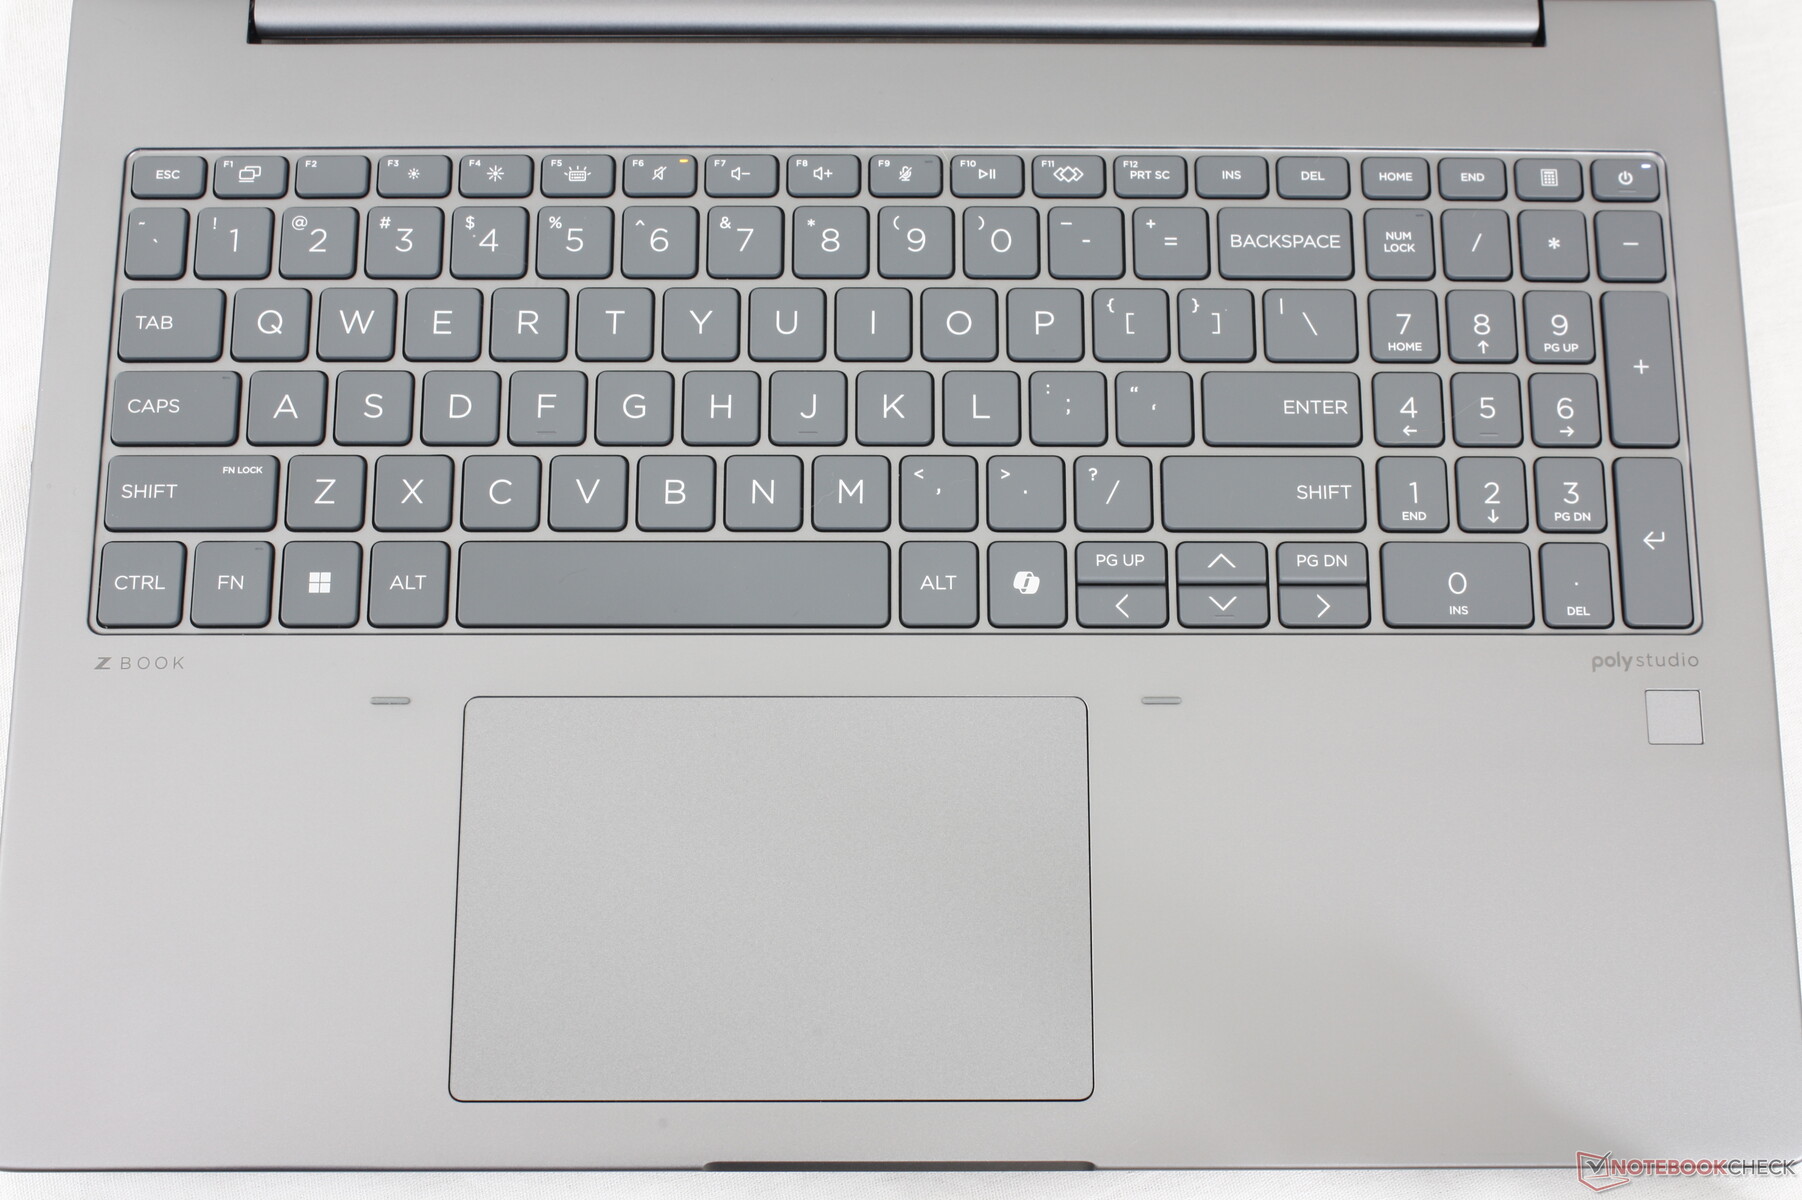
Toetsenbord
De type-ervaring is vergelijkbaar met een Spectre x360 16 in die zin dat de toetsen stevig zijn met relatief scherpe feedback om comfortabel te kunnen typen. De toetsen voelen dieper aan dan op de meeste Ultrabooks om de typische ondiepe of sponzige feedback te vermijden.
Het numpad is terug, terwijl dit ontbreekt op de concurrerende Precision 5690. De toetsen zijn echter iets smaller dan de belangrijkste QWERTY-toetsen en de feedback is dus merkbaar zachter bij het indrukken.
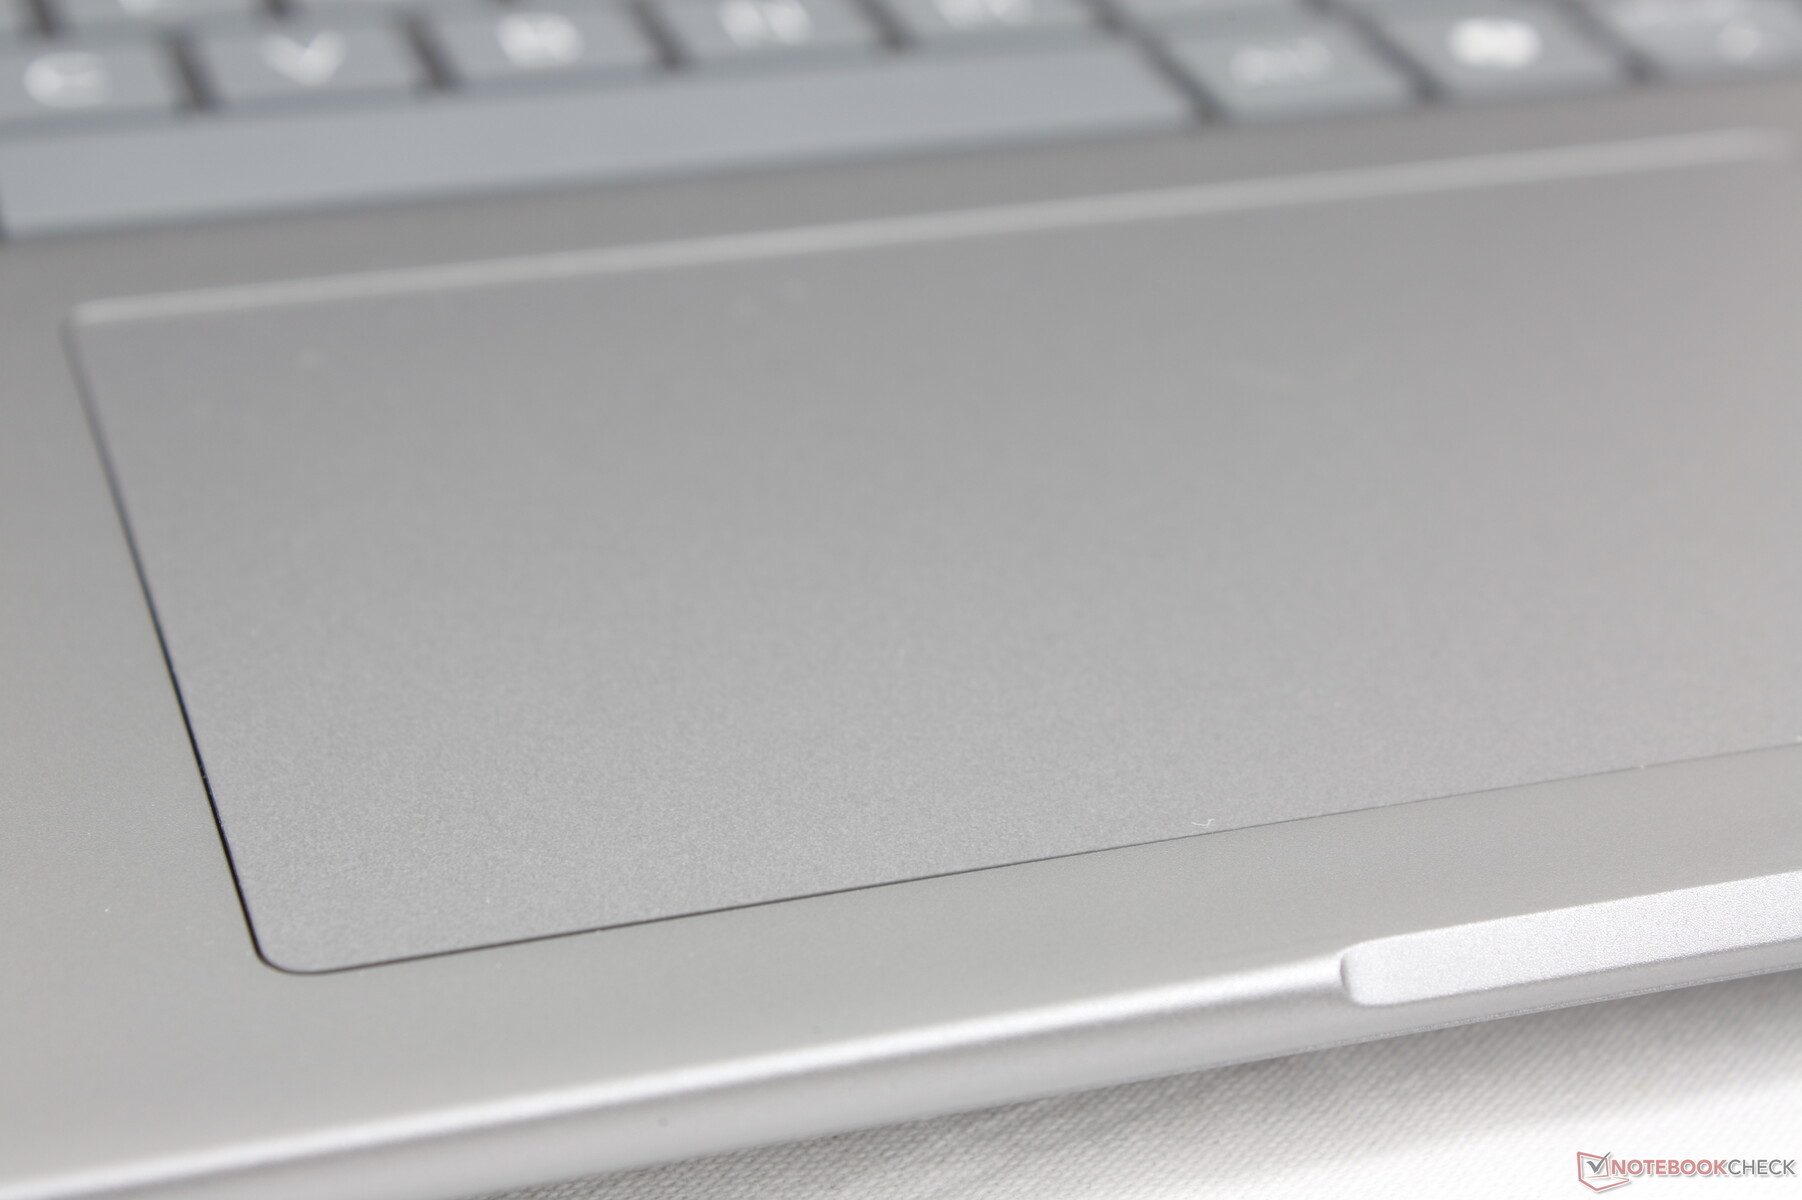
Touchpad
Het clickpad is groter dan voorheen (12,5 x 8 cm vs. 11,5 × 7 cm) om te profiteren van de grotere vormfactor van 16 inch. Speciale toetsen ontbreken nog steeds en zijn in plaats daarvan beschikbaar op de duurdere ZBook Fury-serie. De grip en feedback zijn echter soepel en klikgevoelig, respectievelijk betrouwbaarder dan de normaal gesproken sponzigere clickpads op de meeste consumentenlaptops.

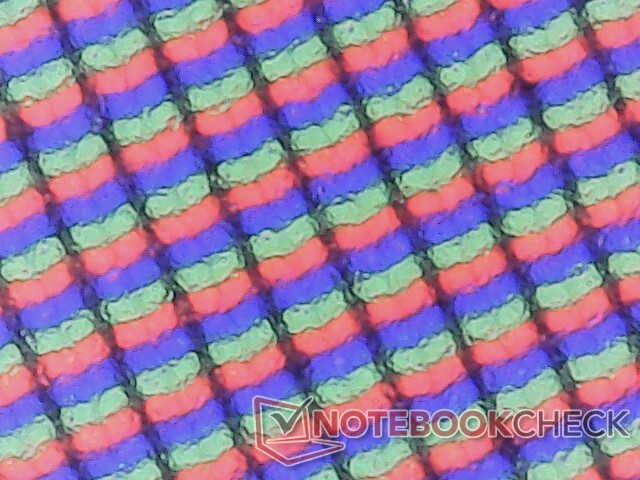
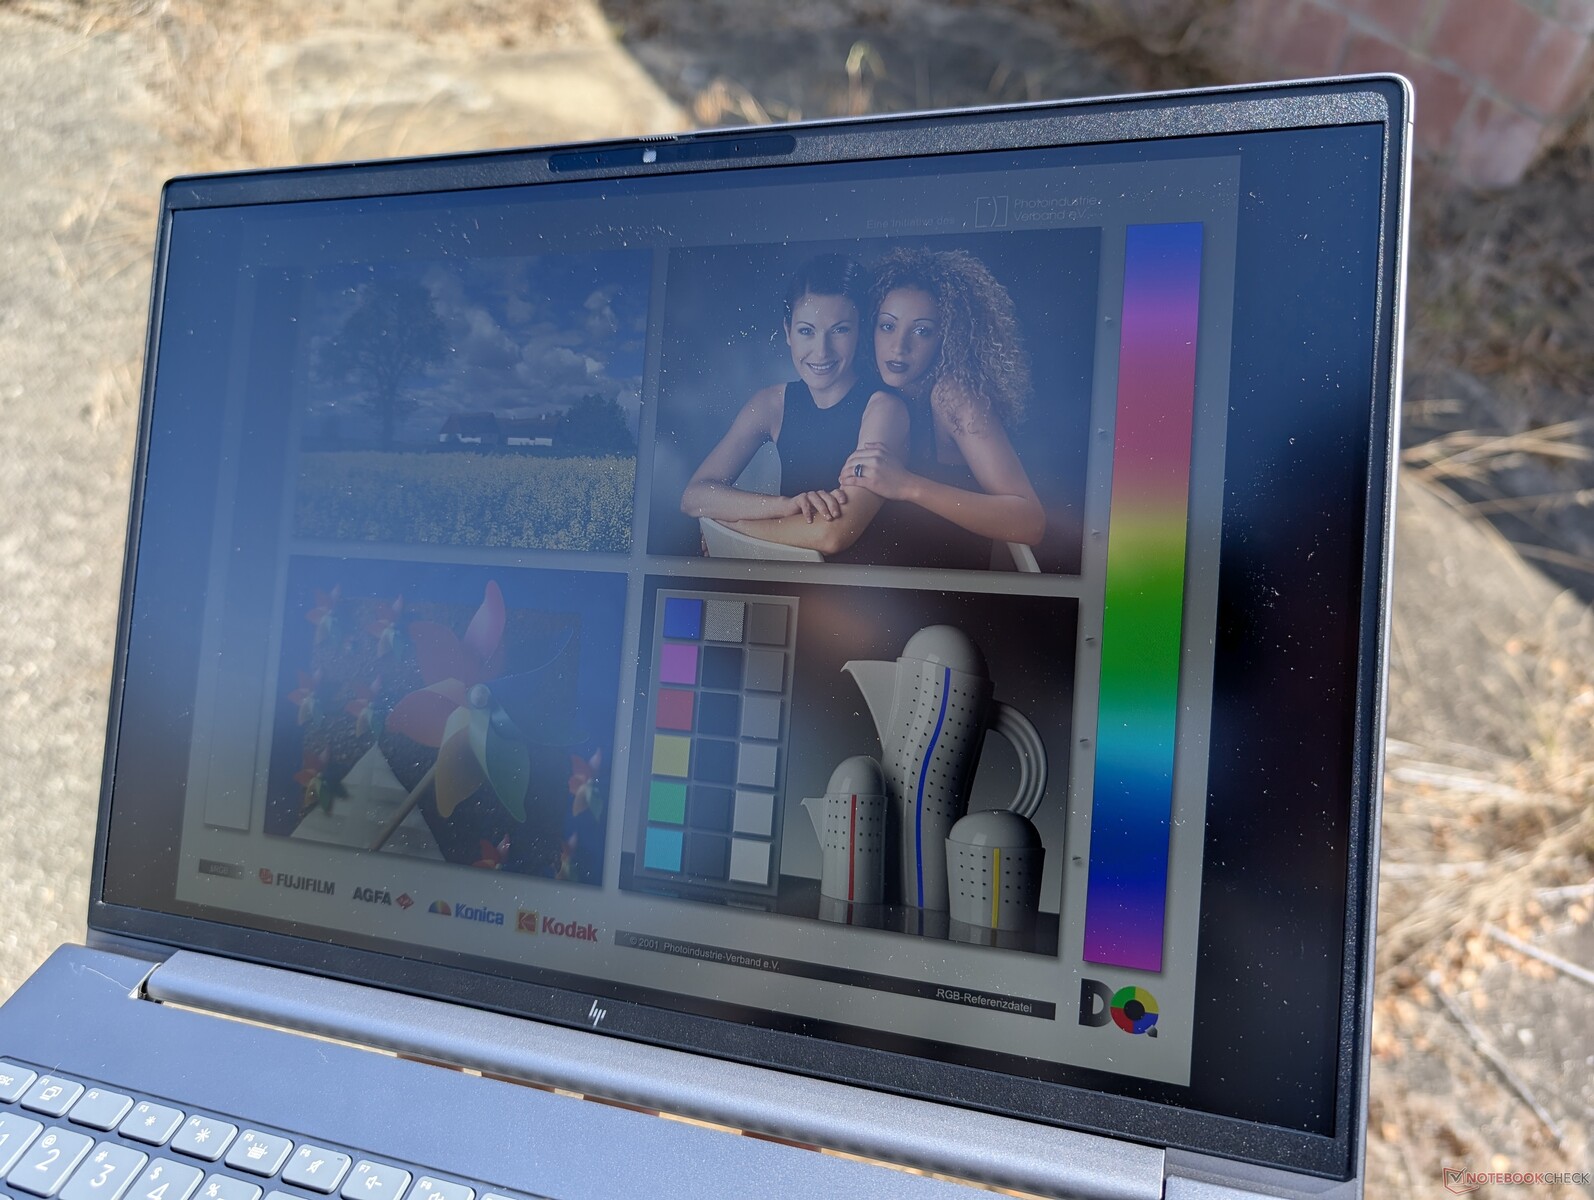
Beeldscherm - IPS over de hele linie
Er zijn in totaal vijf schermopties beschikbaar, die allemaal alleen IPS zijn. Onze configuratie wordt geleverd met de vetgedrukte optie.
- 1920 x 1200, niet-touch, mat, 250 nits, 45 procent NTSC, 60 Hz
- 1920 x 1200, aanraakscherm, mat, 250 nits, 45 procent NTSC, 60 Hz
- 1920 x 1200, niet-touch, mat, 400 nits, 100 procent sRGB, 60 Hz
- 1920 x 1200, niet-touch, mat, 1000 nits, 100 procent sRGB, HP Sure View, 60 Hz
- 2560 x 1600, zonder aanraken, mat, 400 nits, 100 procent sRGB, 120 Hz
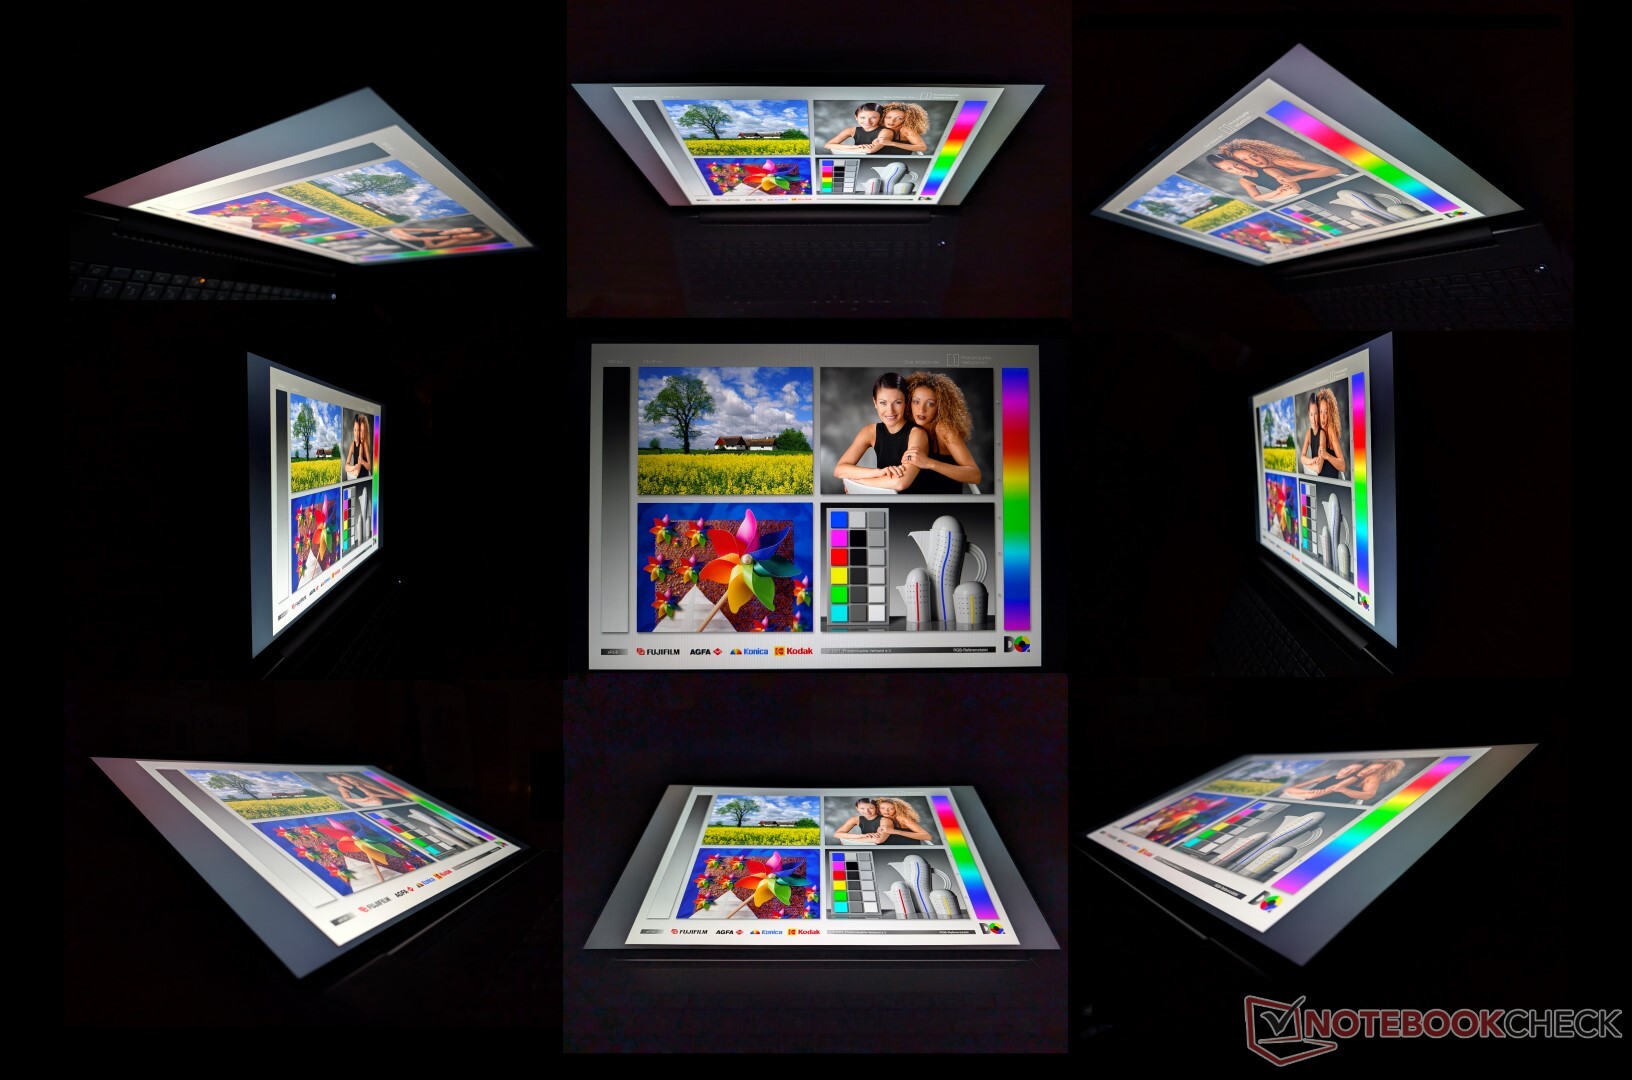
Als de beeldkwaliteit een punt van zorg is, kunnen gebruikers de eerste twee opties in het lagere segment beter overslaan, omdat de kleurdekking dan slechts ongeveer 60 procent van sRGB is. Het superheldere 1000 nits paneel is opmerkelijk omdat veel andere werkstations deze functie niet bieden, maar de optie is helaas gekoppeld aan Sure View, wat de kijkhoeken ernstig beperkt voor meer privacy. Er zijn geen OLED-, HDR- of P3-opties, wat enigszins teleurstellend is voor een prestatiegericht werkstation. Gebruikers zouden moeten upgraden naar de HP ZBook Fury 16 G11 of de ThinkPad P16s G2 voor dergelijke functies.

| |||||||||||||||||||||||||
Helderheidsverdeling: 88 %
Helderheid in Batterij-modus: 470.7 cd/m²
Contrast: 826:1 (Zwart: 0.57 cd/m²)
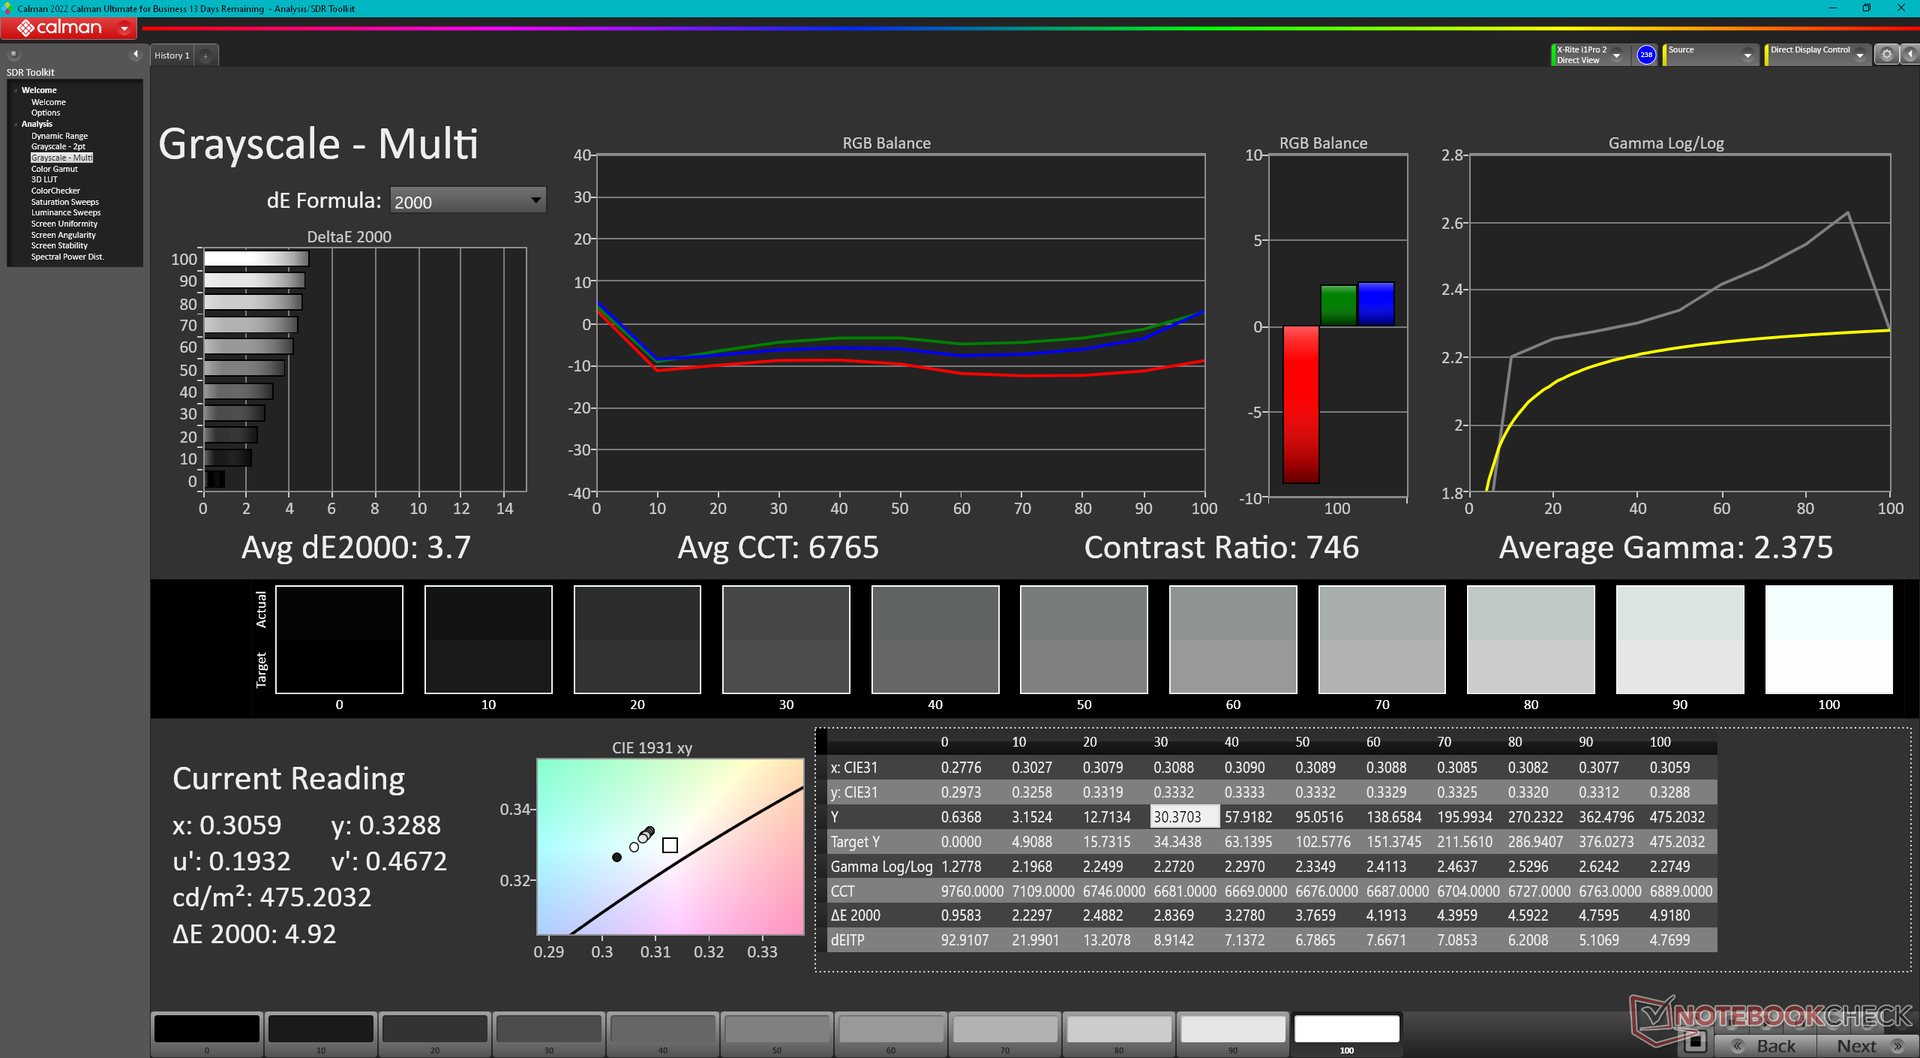
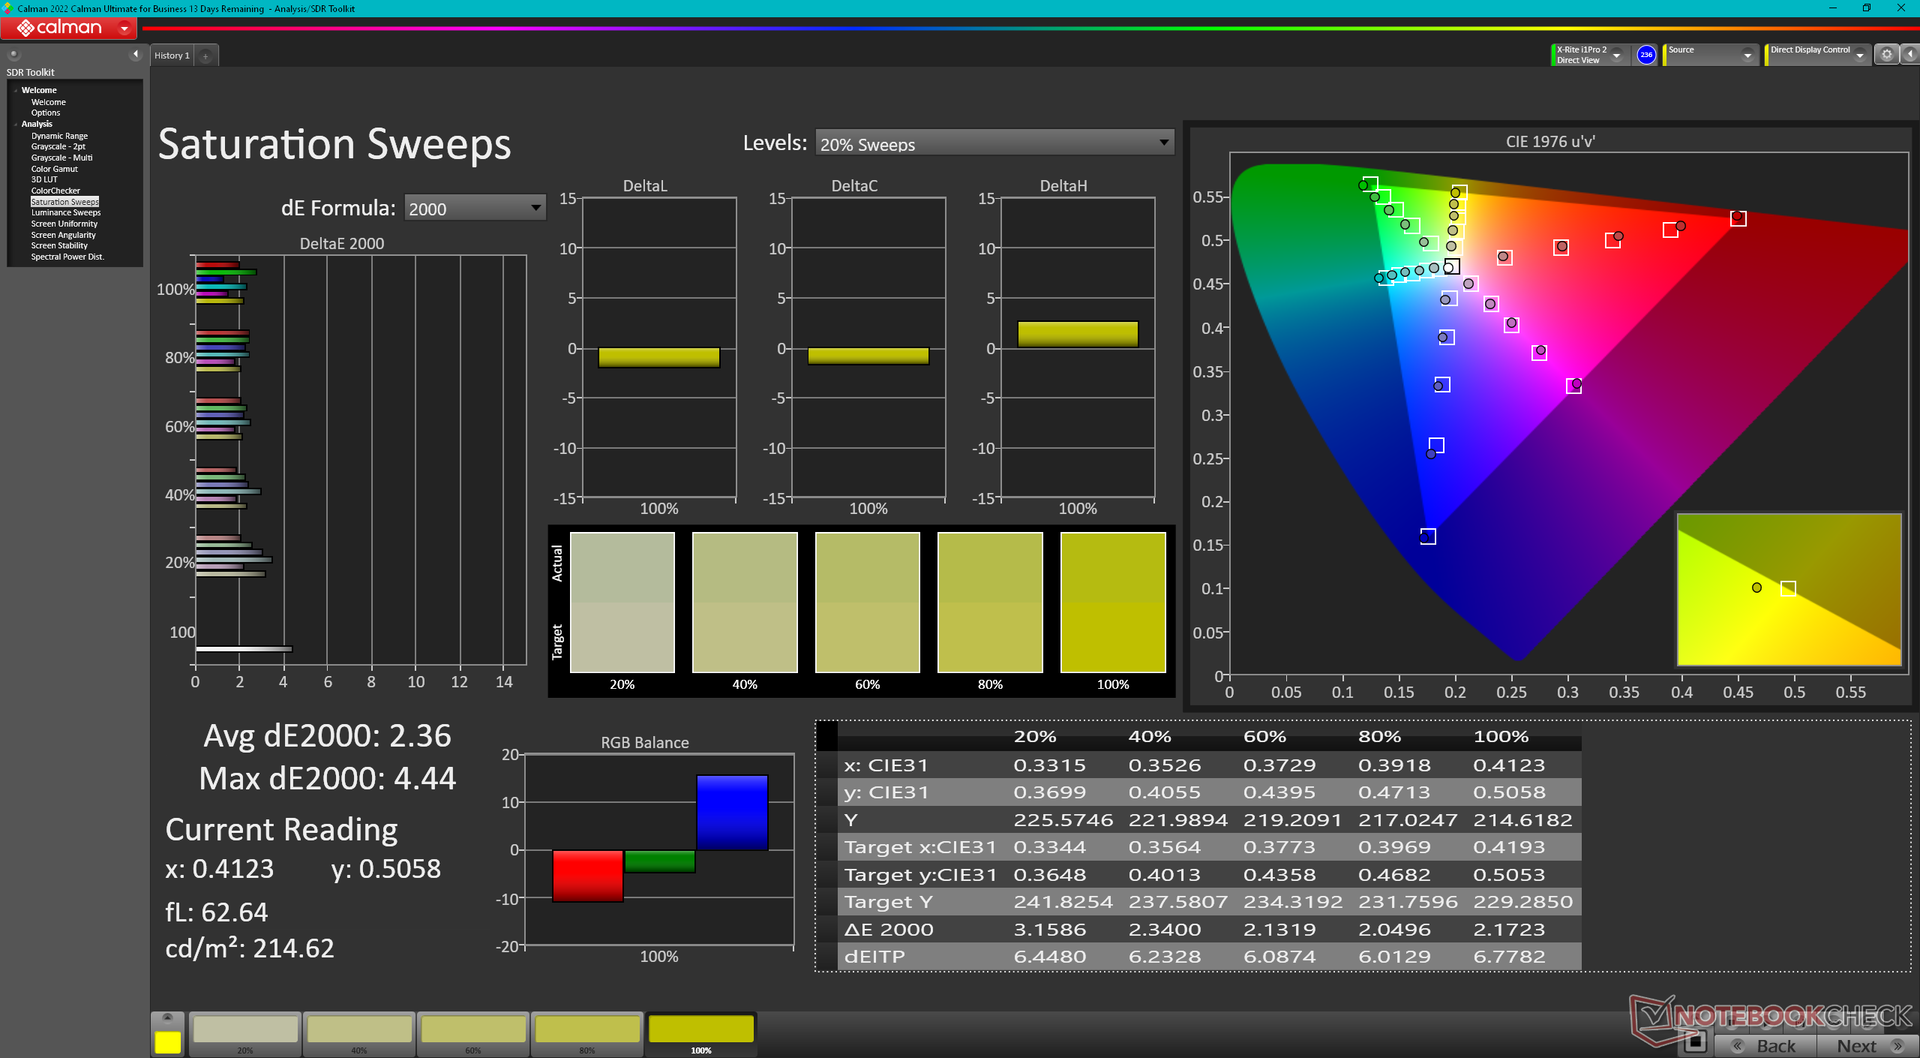
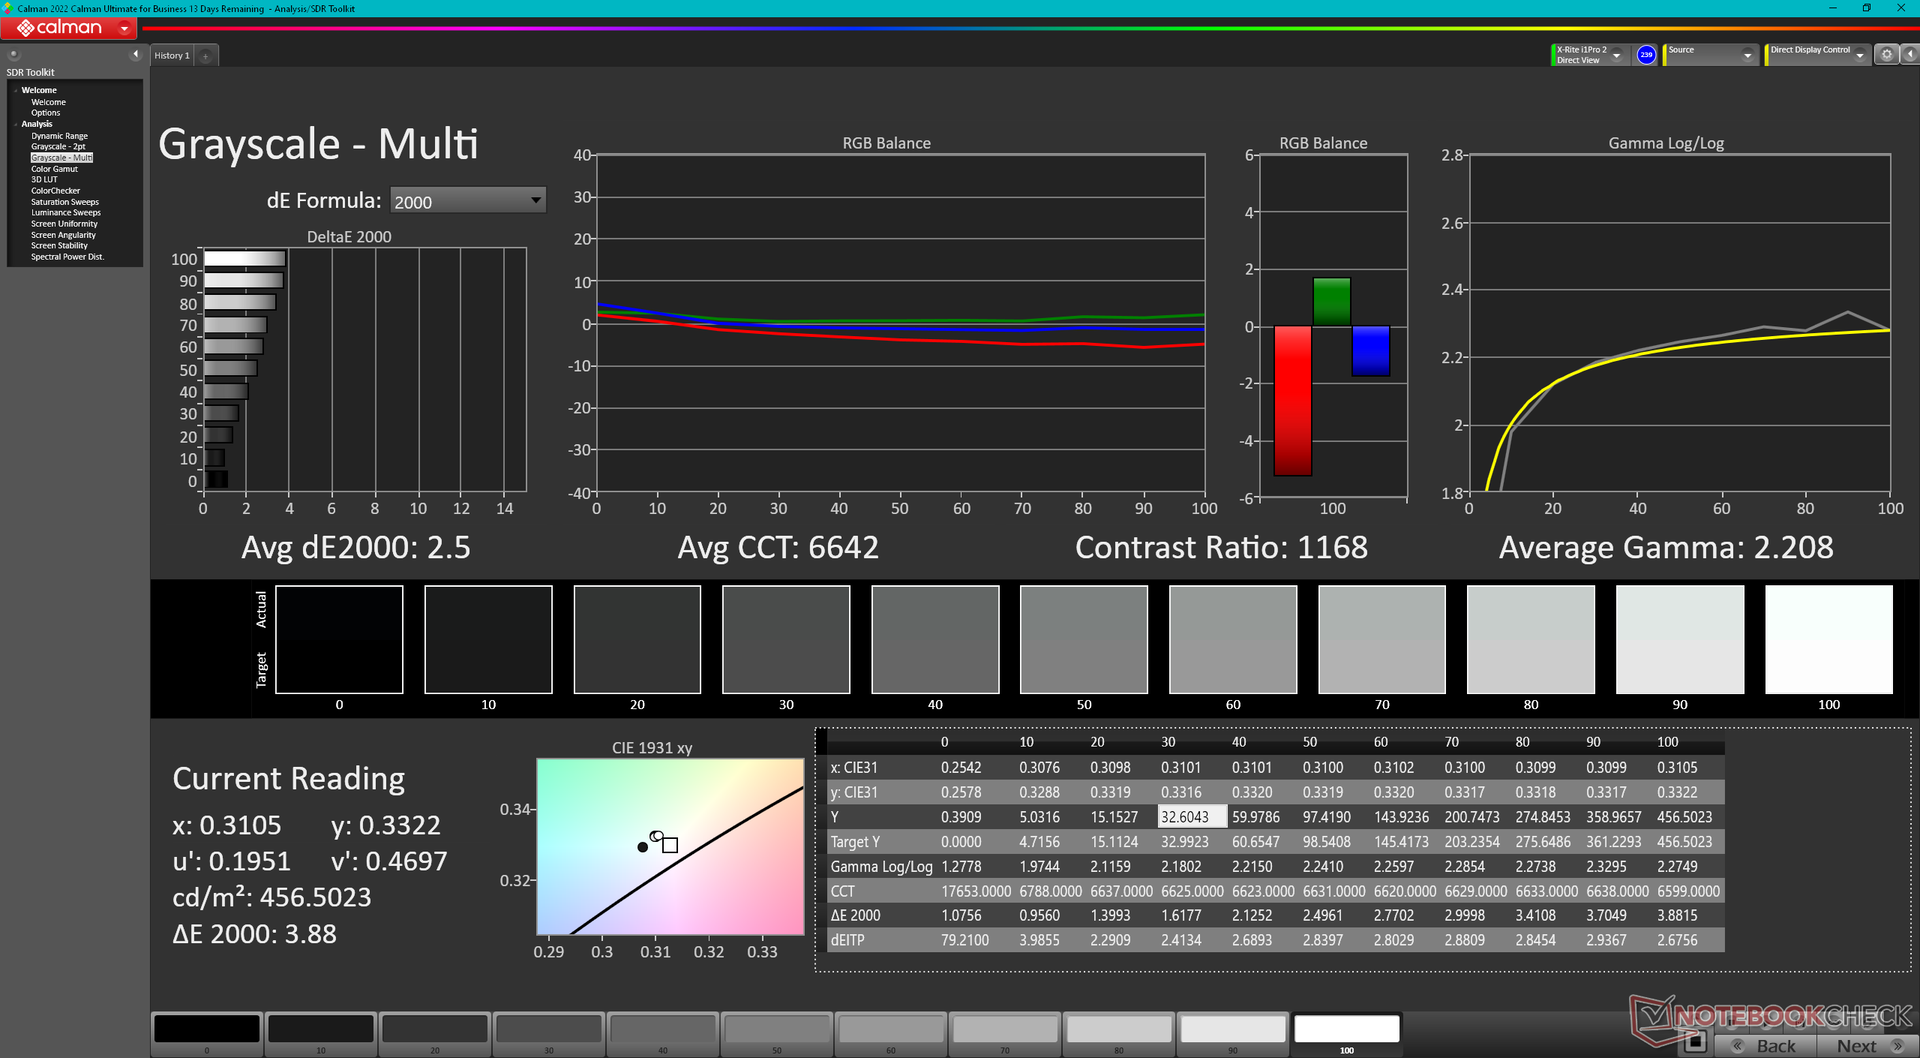
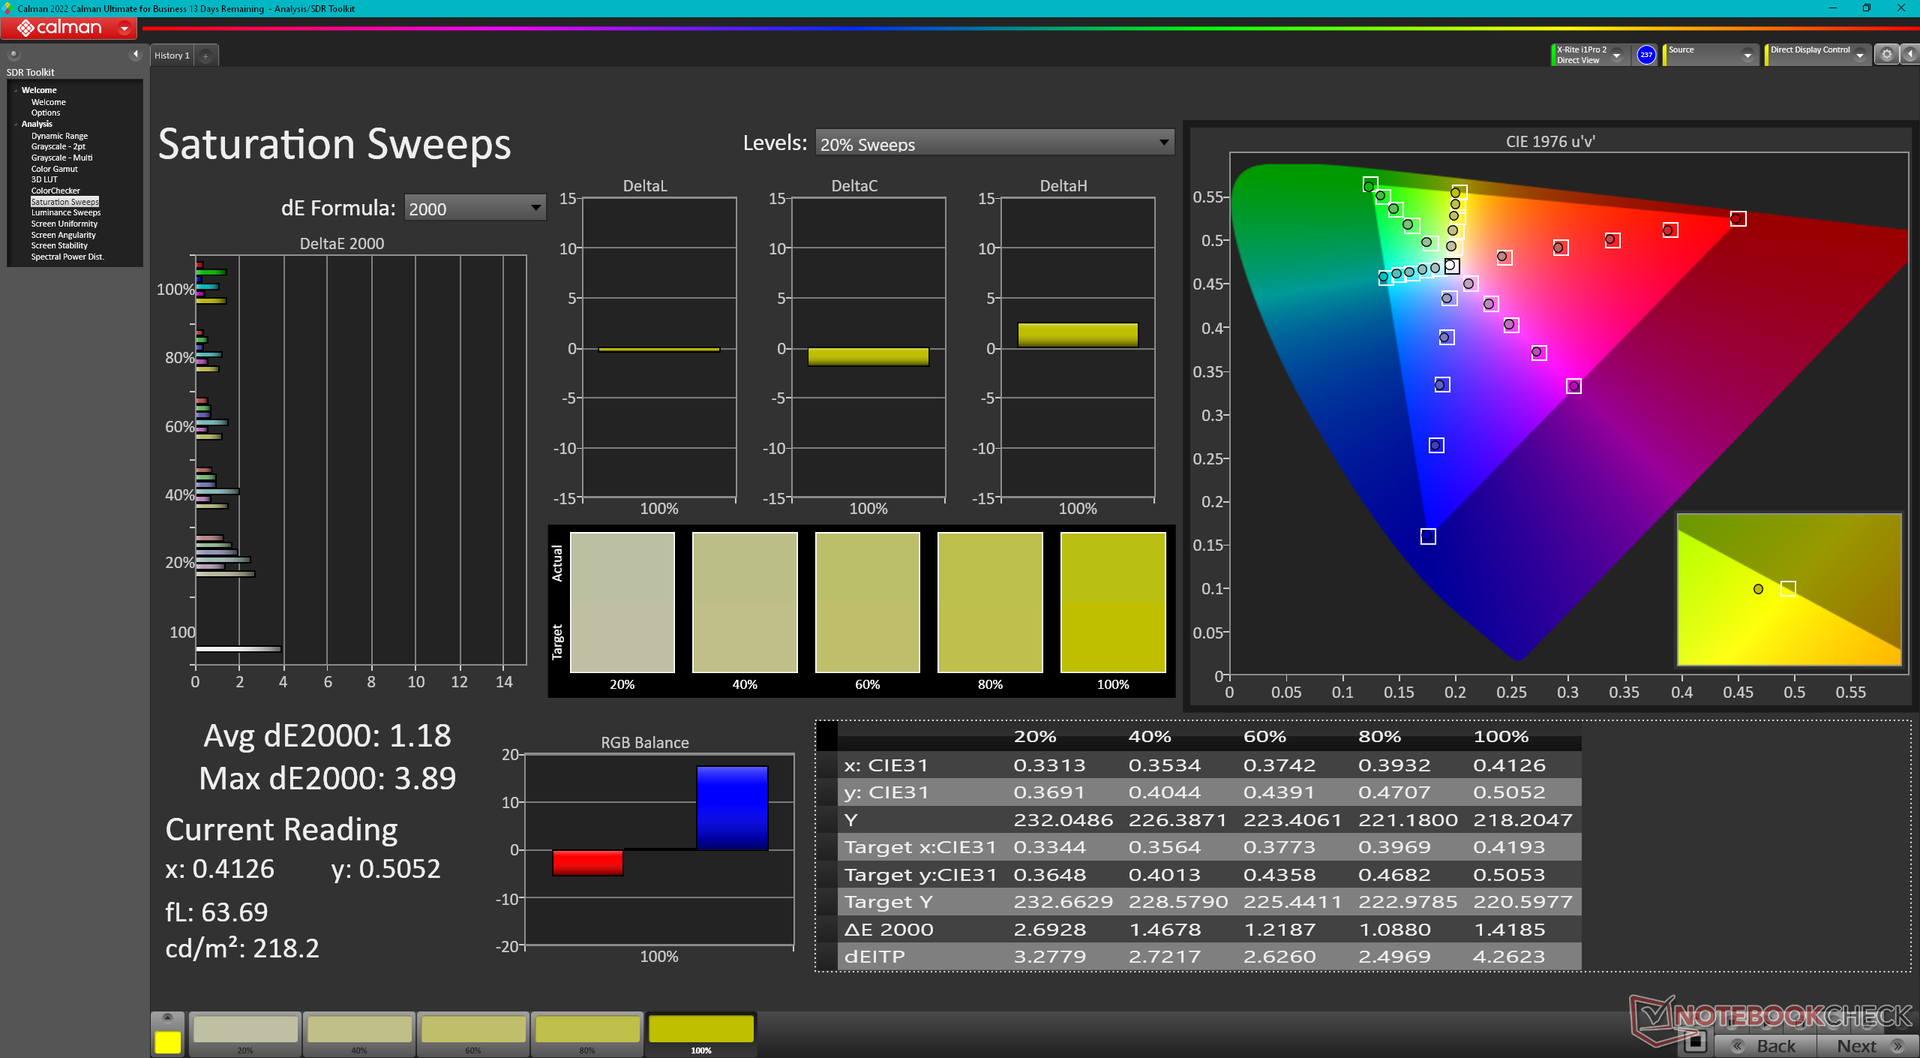
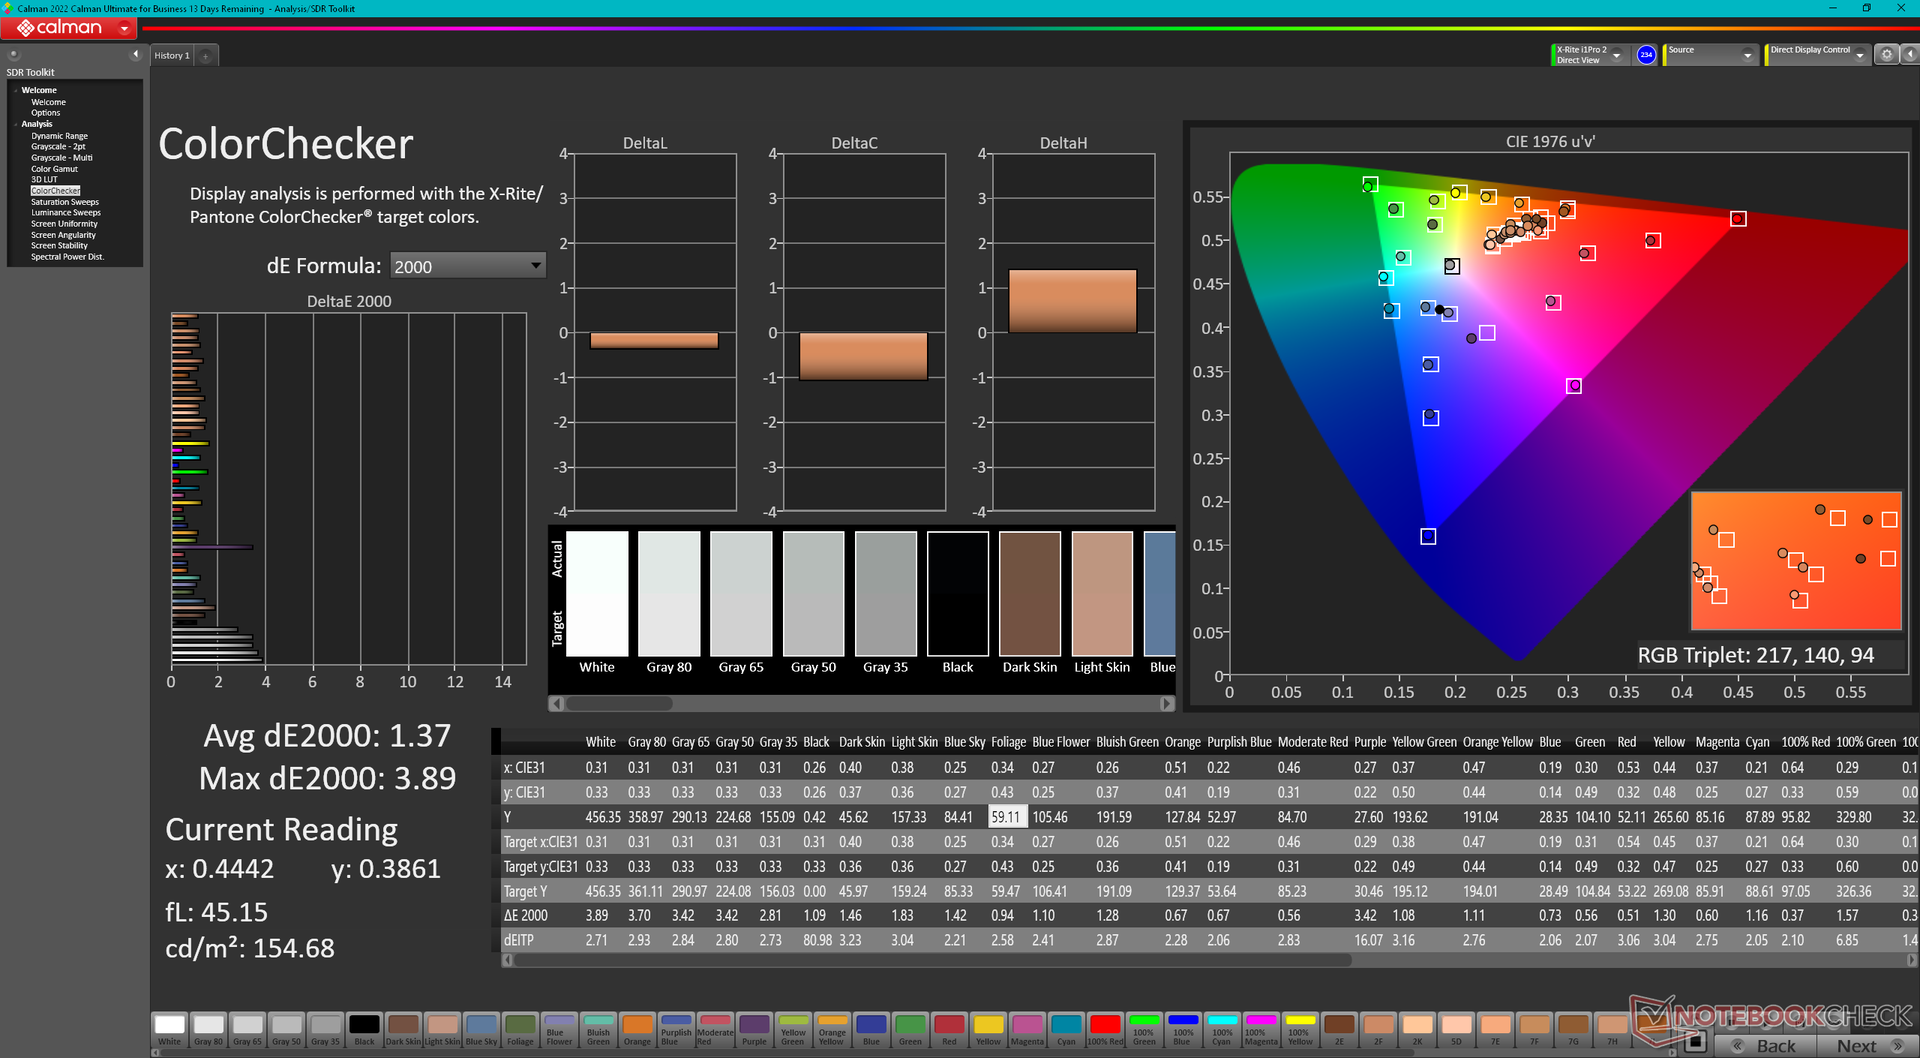
ΔE Color 2.16 | 0.5-29.43 Ø4.87, calibrated: 1.37
ΔE Greyscale 3.7 | 0.5-98 Ø5.1
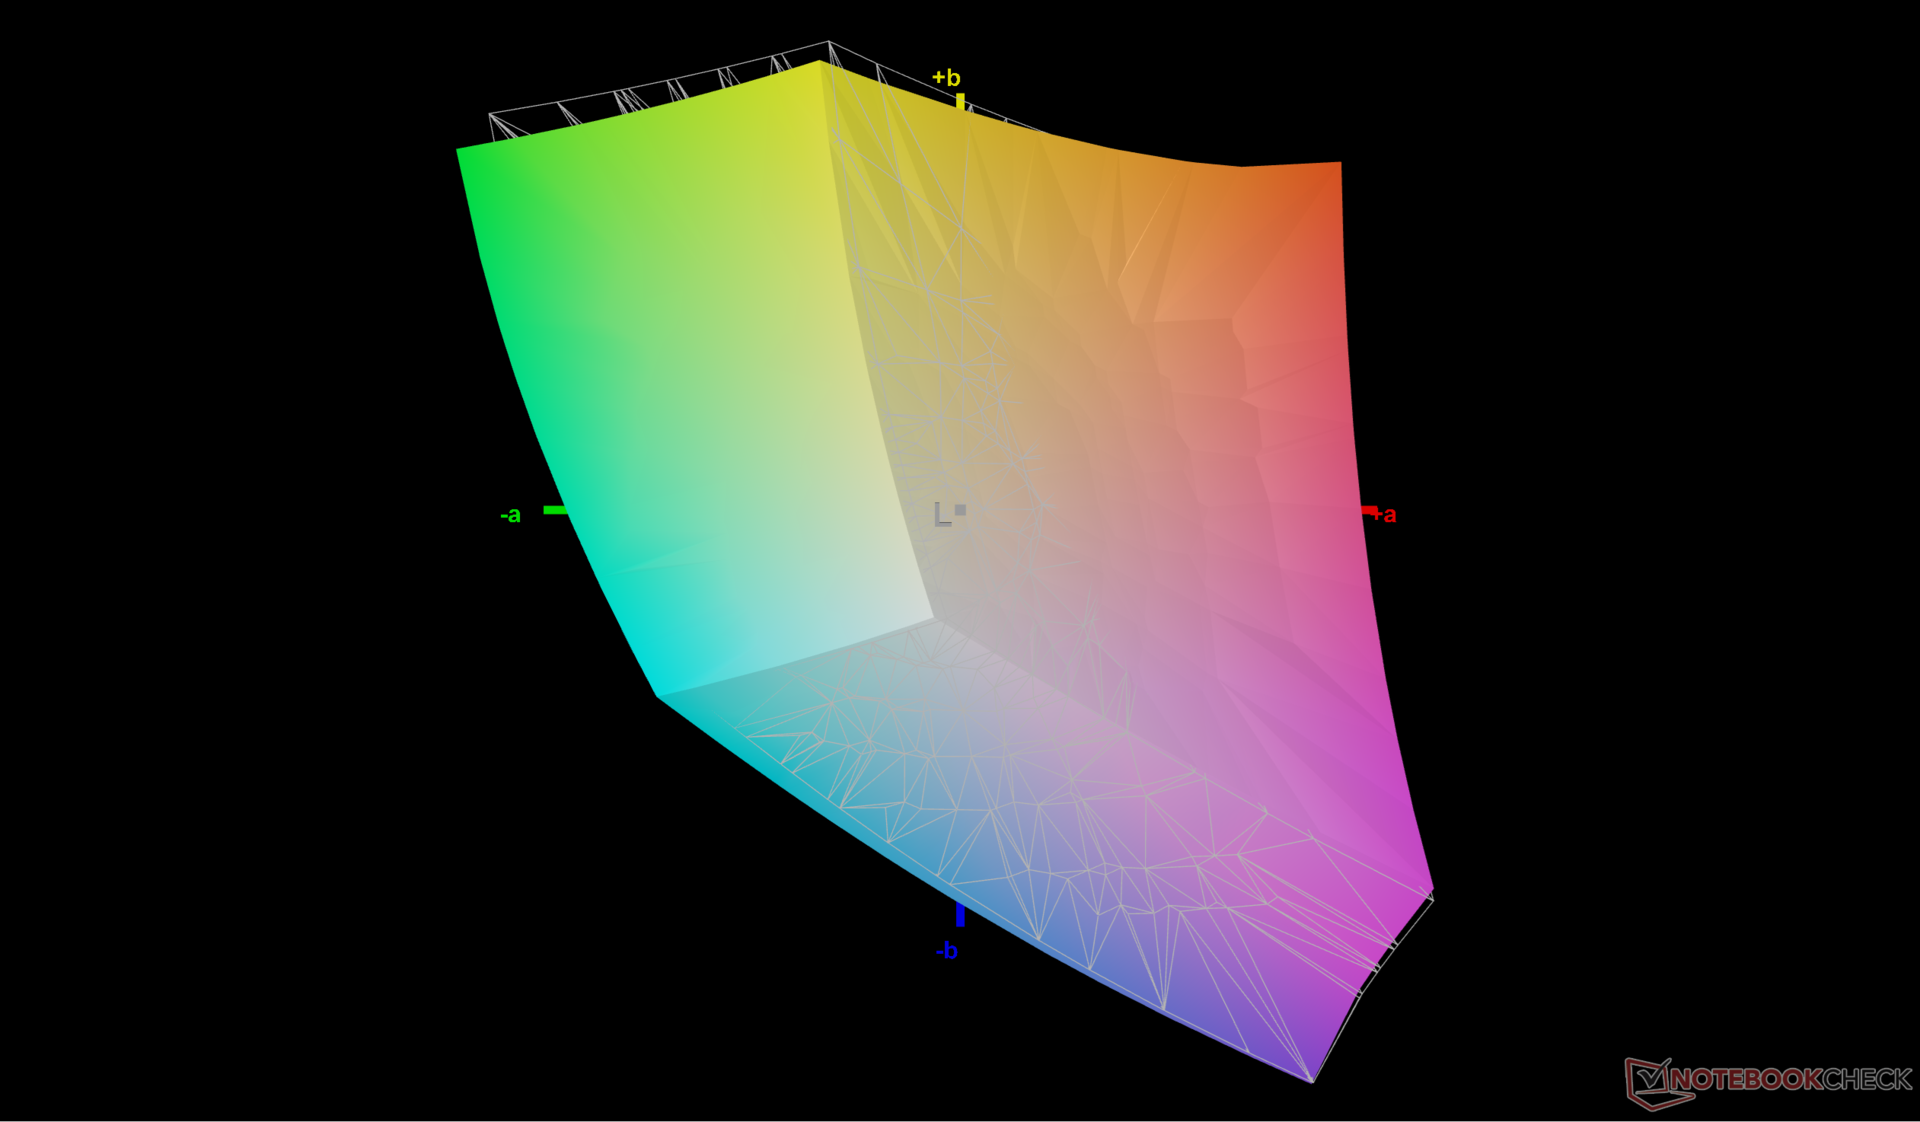
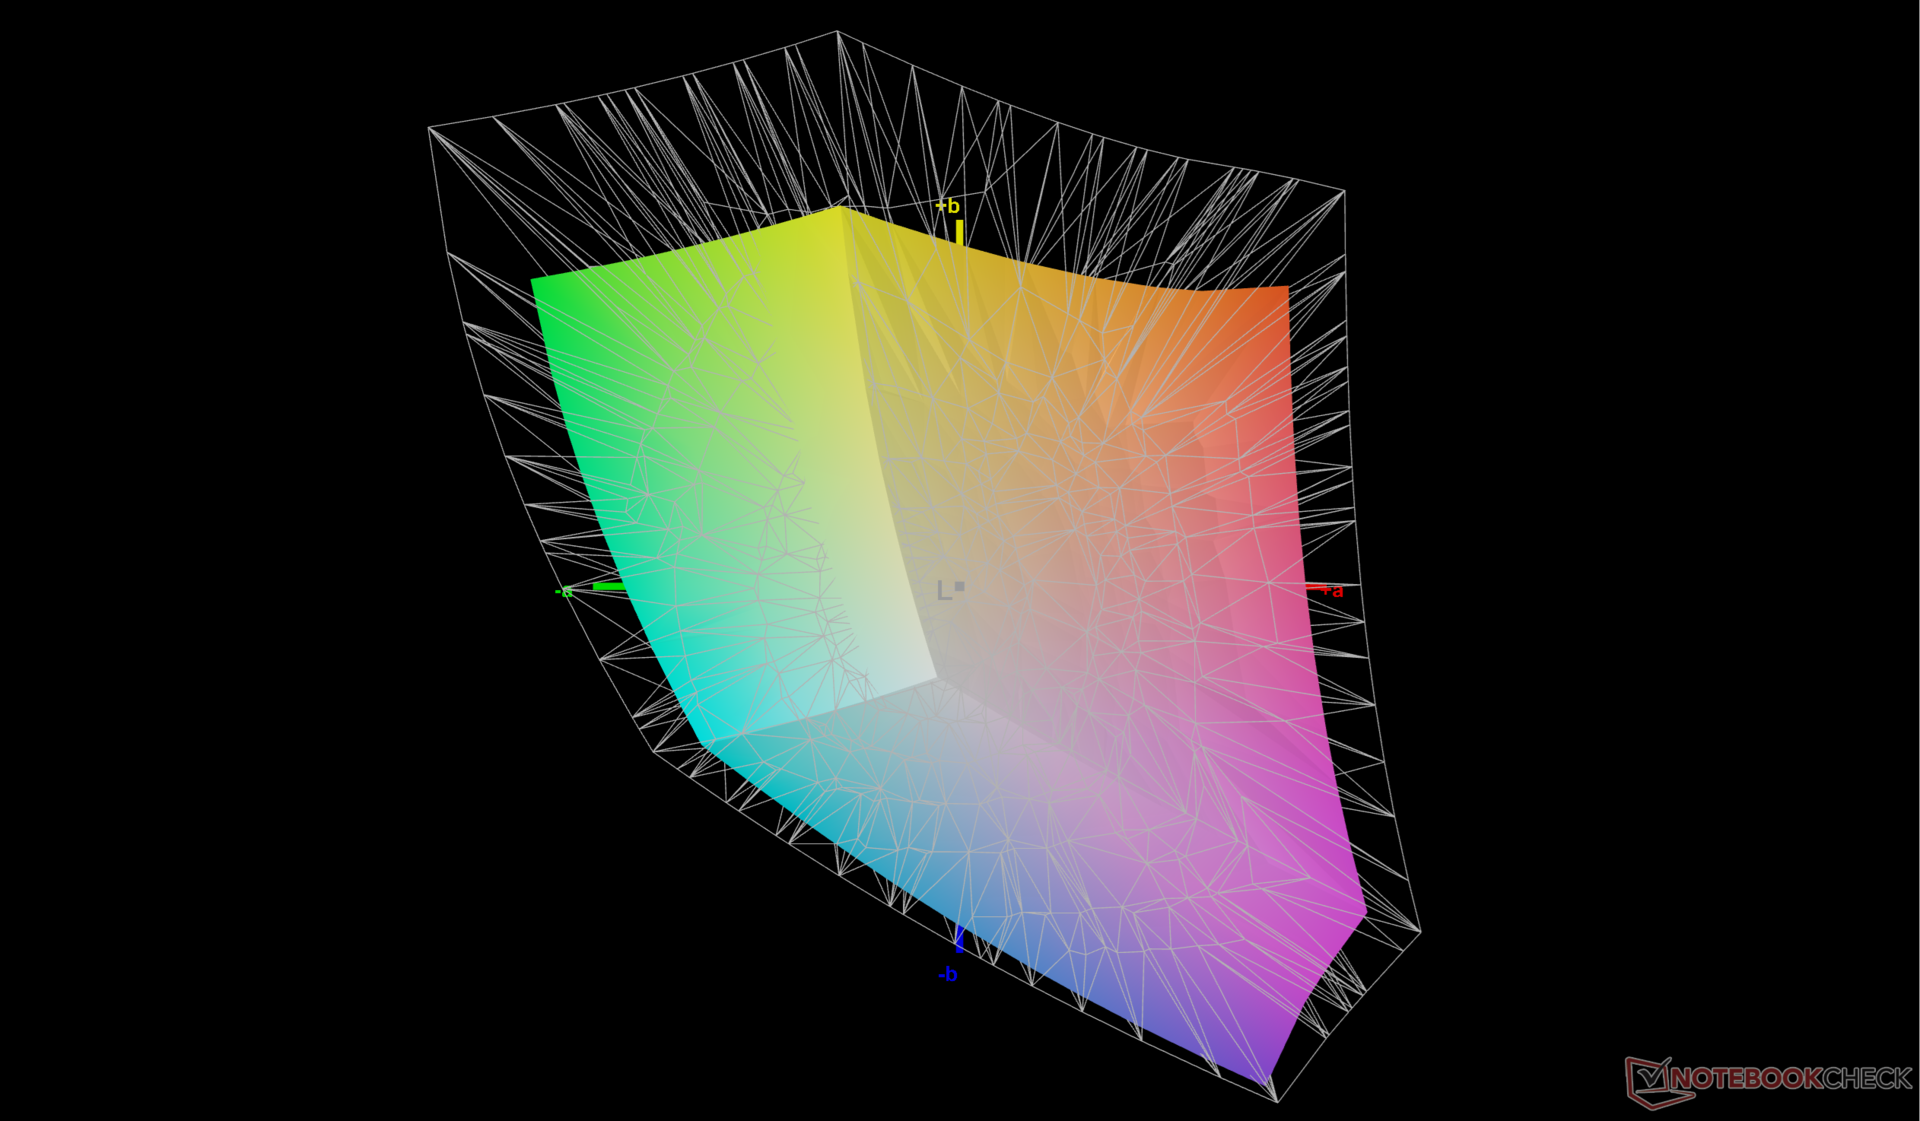
71% AdobeRGB 1998 (Argyll 2.2.0 3D)
97.7% sRGB (Argyll 2.2.0 3D)
69.1% Display P3 (Argyll 2.2.0 3D)
Gamma: 2.38
| HP ZBook Power 16 G11 A AUOA0A9, IPS, 2560x1600, 16", 120 Hz | HP ZBook Power 15 G10 BOE0B6A, IPS, 2560x1440, 15.6", 120 Hz | HP ZBook Fury 16 G11 AUO87A8, IPS, 3840x2400, 16", 120 Hz | Lenovo ThinkPad P1 Gen 7 21KV001SGE MNG007DA1-9 , IPS LED, 2560x1600, 16", 165 Hz | Lenovo ThinkPad P16s G2 21K9000CGE ATNA60YV04-0, OLED, 3840x2400, 16", 60 Hz | Dell Precision 5690 Samsung 160YV03, OLED, 3840x2400, 16", 60 Hz | |
|---|---|---|---|---|---|---|
| Display | -1% | 22% | 0% | 28% | 27% | |
| Display P3 Coverage | 69.1 | 68.2 -1% | 98.4 42% | 69.4 0% | 99.9 45% | 99.8 44% |
| sRGB Coverage | 97.7 | 95.6 -2% | 99.9 2% | 97.6 0% | 100 2% | 100 2% |
| AdobeRGB 1998 Coverage | 71 | 70.5 -1% | 86 21% | 71.8 1% | 96.9 36% | 96.6 36% |
| Response Times | -10% | 8% | -4% | 87% | 84% | |
| Response Time Grey 50% / Grey 80% * | 13.6 ? | 13 ? 4% | 11.4 ? 16% | 11.2 ? 18% | 1.5 ? 89% | 1.7 ? 87% |
| Response Time Black / White * | 8.4 ? | 10.4 ? -24% | 8.4 ? -0% | 10.6 ? -26% | 1.3 ? 85% | 1.7 ? 80% |
| PWM Frequency | 60 | 60 ? | ||||
| Screen | -13% | 5% | -10% | 2% | -14% | |
| Brightness middle | 470.7 | 313.8 -33% | 457.6 -3% | 516 10% | 416 -12% | 348.1 -26% |
| Brightness | 431 | 302 -30% | 466 8% | 505 17% | 421 -2% | 351 -19% |
| Brightness Distribution | 88 | 83 -6% | 83 -6% | 89 1% | 98 11% | 97 10% |
| Black Level * | 0.57 | 0.29 49% | 0.43 25% | 0.41 28% | ||
| Contrast | 826 | 1082 31% | 1064 29% | 1259 52% | ||
| Colorchecker dE 2000 * | 2.16 | 3.27 -51% | 2.78 -29% | 3.5 -62% | 1.3 40% | 4.18 -94% |
| Colorchecker dE 2000 max. * | 4.39 | 7.81 -78% | 5.53 -26% | 8.8 -100% | 2.8 36% | 6.68 -52% |
| Colorchecker dE 2000 calibrated * | 1.37 | 0.56 59% | 1.37 -0% | 1.2 12% | 2.9 -112% | 0.97 29% |
| Greyscale dE 2000 * | 3.7 | 5.9 -59% | 2 46% | 5.6 -51% | 1.8 51% | 1.7 54% |
| Gamma | 2.38 92% | 2.18 101% | 2.28 96% | 2.27 97% | 2.25 98% | 2.2 100% |
| CCT | 6765 96% | 6323 103% | 6806 96% | 6071 107% | 6574 99% | 6198 105% |
| Totaal Gemiddelde (Programma / Instellingen) | -8% /
-10% | 12% /
9% | -5% /
-7% | 39% /
22% | 32% /
13% |
* ... kleiner is beter
Het beeldscherm is behoorlijk goed gekalibreerd uit de doos tegen de sRGB standaard. Kalibratie van het beeldscherm met onze X-Rite colorimeter zou de gemiddelde deltaE-waarden voor grijswaarden en kleuren nog verder verbeteren, van respectievelijk 3,7 en 2,16 tot slechts 2,5 en 1,37. Ons gekalibreerde ICM-profiel kunt u hierboven gratis downloaden.

Responstijd Scherm
| ↔ Responstijd Zwart naar Wit | ||
|---|---|---|
| 8.4 ms ... stijging ↗ en daling ↘ gecombineerd | ↗ 4.5 ms stijging | 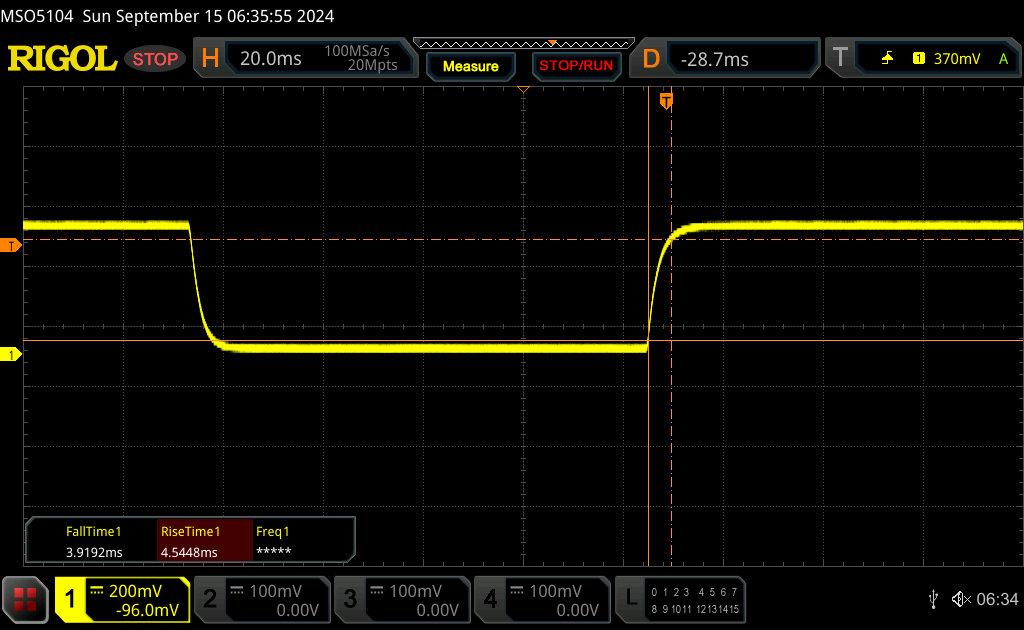 |
| ↘ 3.9 ms daling | ||
| Het scherm vertoonde snelle responstijden in onze tests en zou geschikt moeten zijn voor games. Ter vergelijking: alle testtoestellen variëren van 0.1 (minimum) tot 240 (maximum) ms. » 21 % van alle toestellen zijn beter. Dit betekent dat de gemeten responstijd beter is dan het gemiddelde (20.8 ms) van alle geteste toestellen. | ||
| ↔ Responstijd 50% Grijs naar 80% Grijs | ||
| 13.6 ms ... stijging ↗ en daling ↘ gecombineerd | ↗ 7.2 ms stijging | 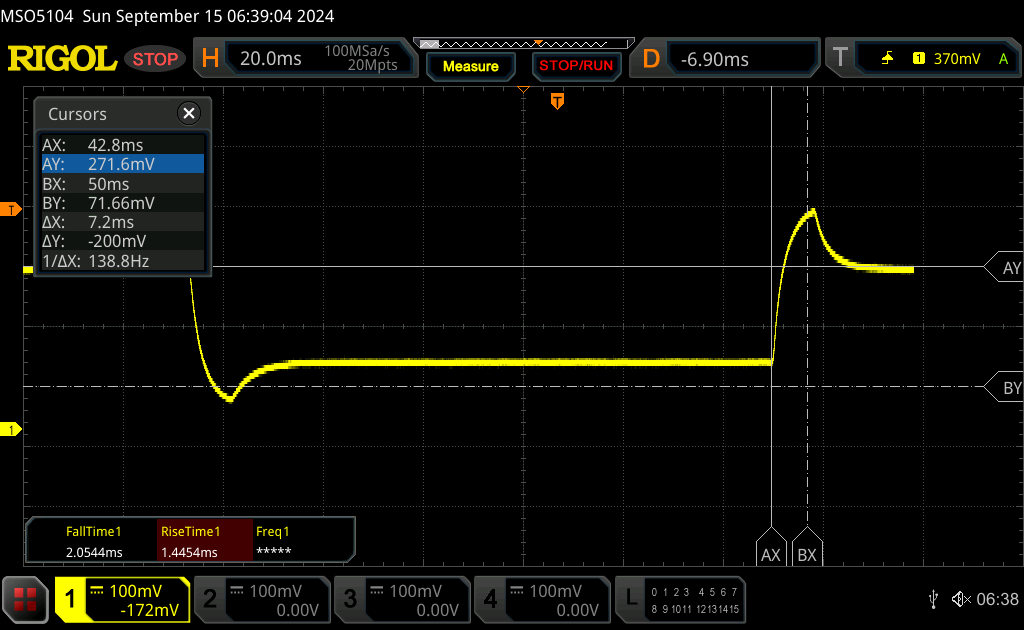 |
| ↘ 6.4 ms daling | ||
| Het scherm vertoonde prima responstijden in onze tests maar is misschien wat te traag voor competitieve games. Ter vergelijking: alle testtoestellen variëren van 0.165 (minimum) tot 636 (maximum) ms. » 24 % van alle toestellen zijn beter. Dit betekent dat de gemeten responstijd beter is dan het gemiddelde (32.5 ms) van alle geteste toestellen. | ||
Screen Flickering / PWM (Pulse-Width Modulation)
| Screen flickering / PWM niet waargenomen | 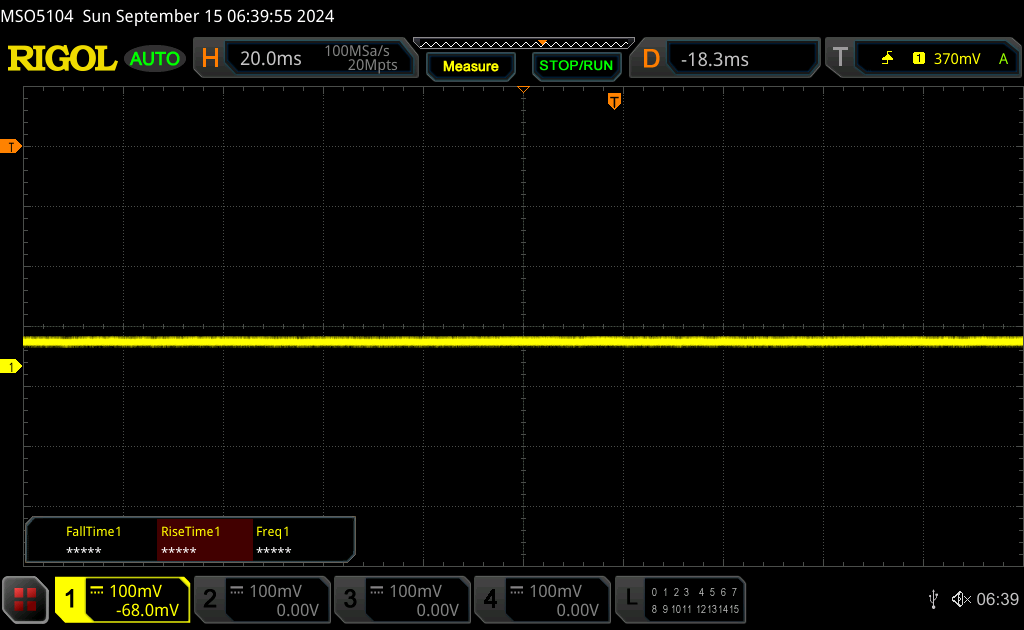 | ||
Ter vergelijking: 53 % van alle geteste toestellen maakten geen gebruik van PWM om de schermhelderheid te verlagen. Als het wel werd gebruikt, werd een gemiddelde van 8516 (minimum: 5 - maximum: 343500) Hz waargenomen. | |||
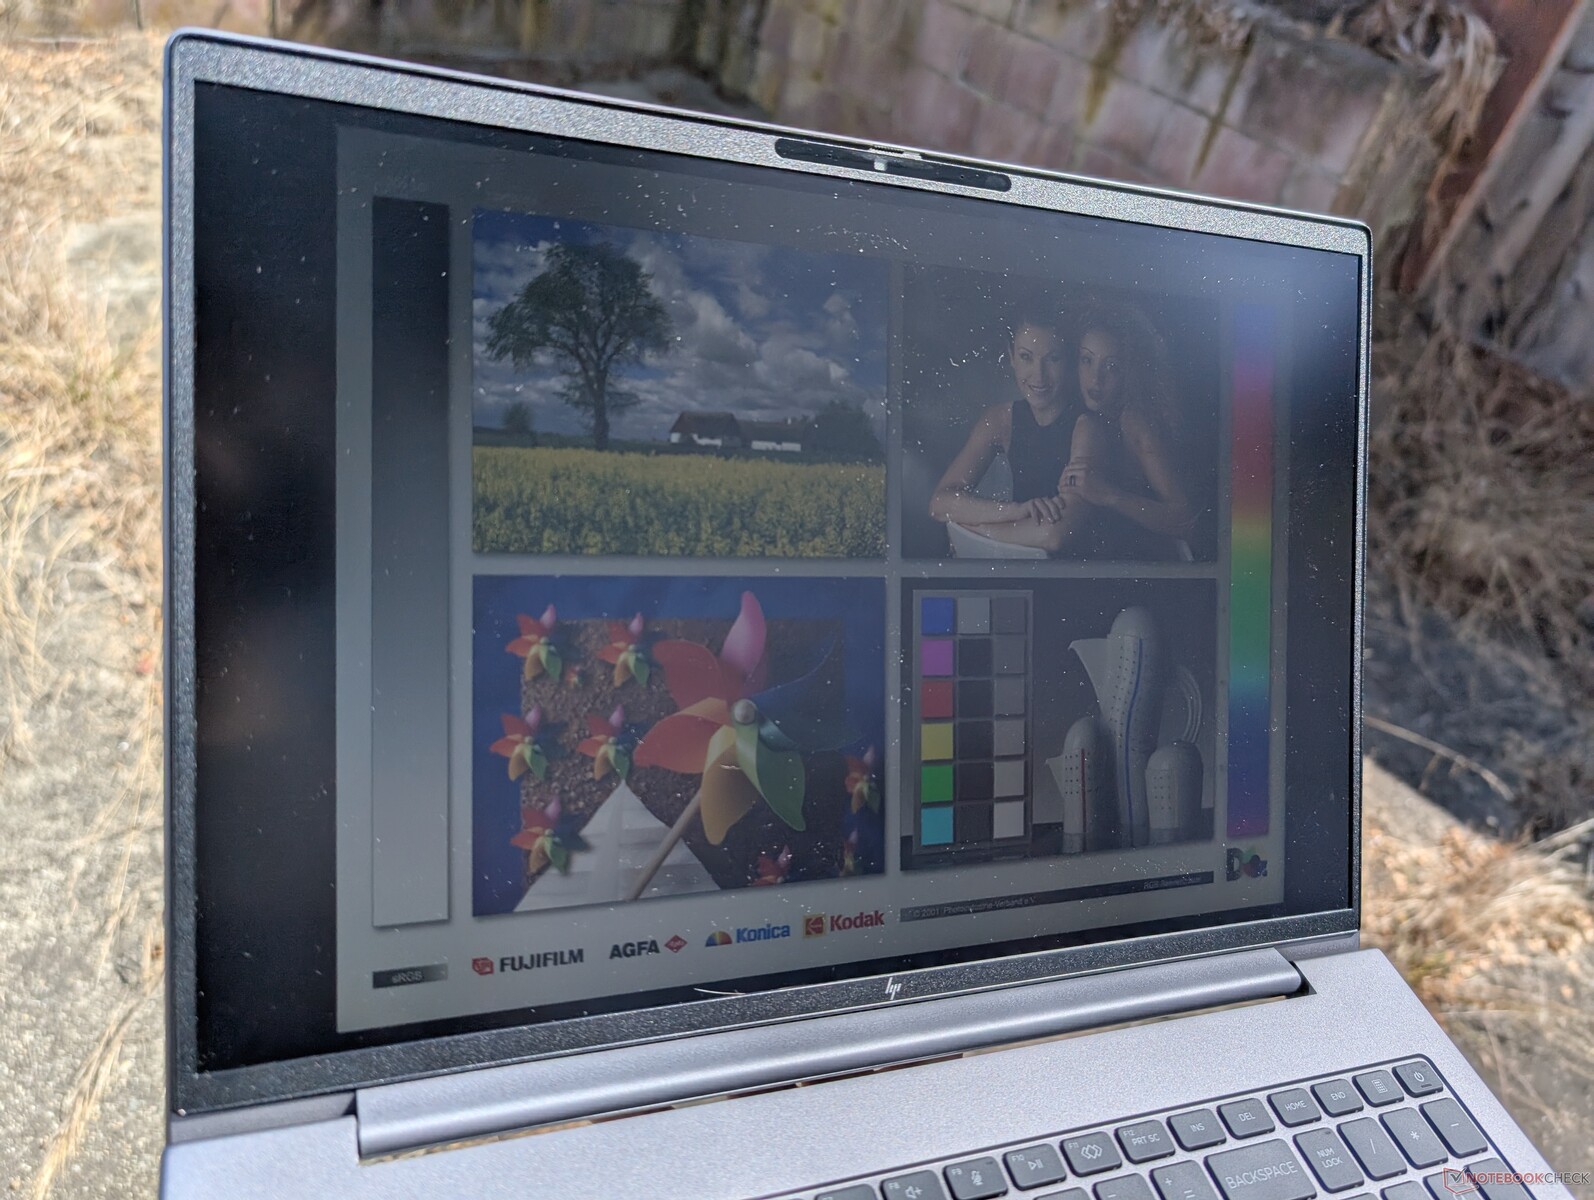
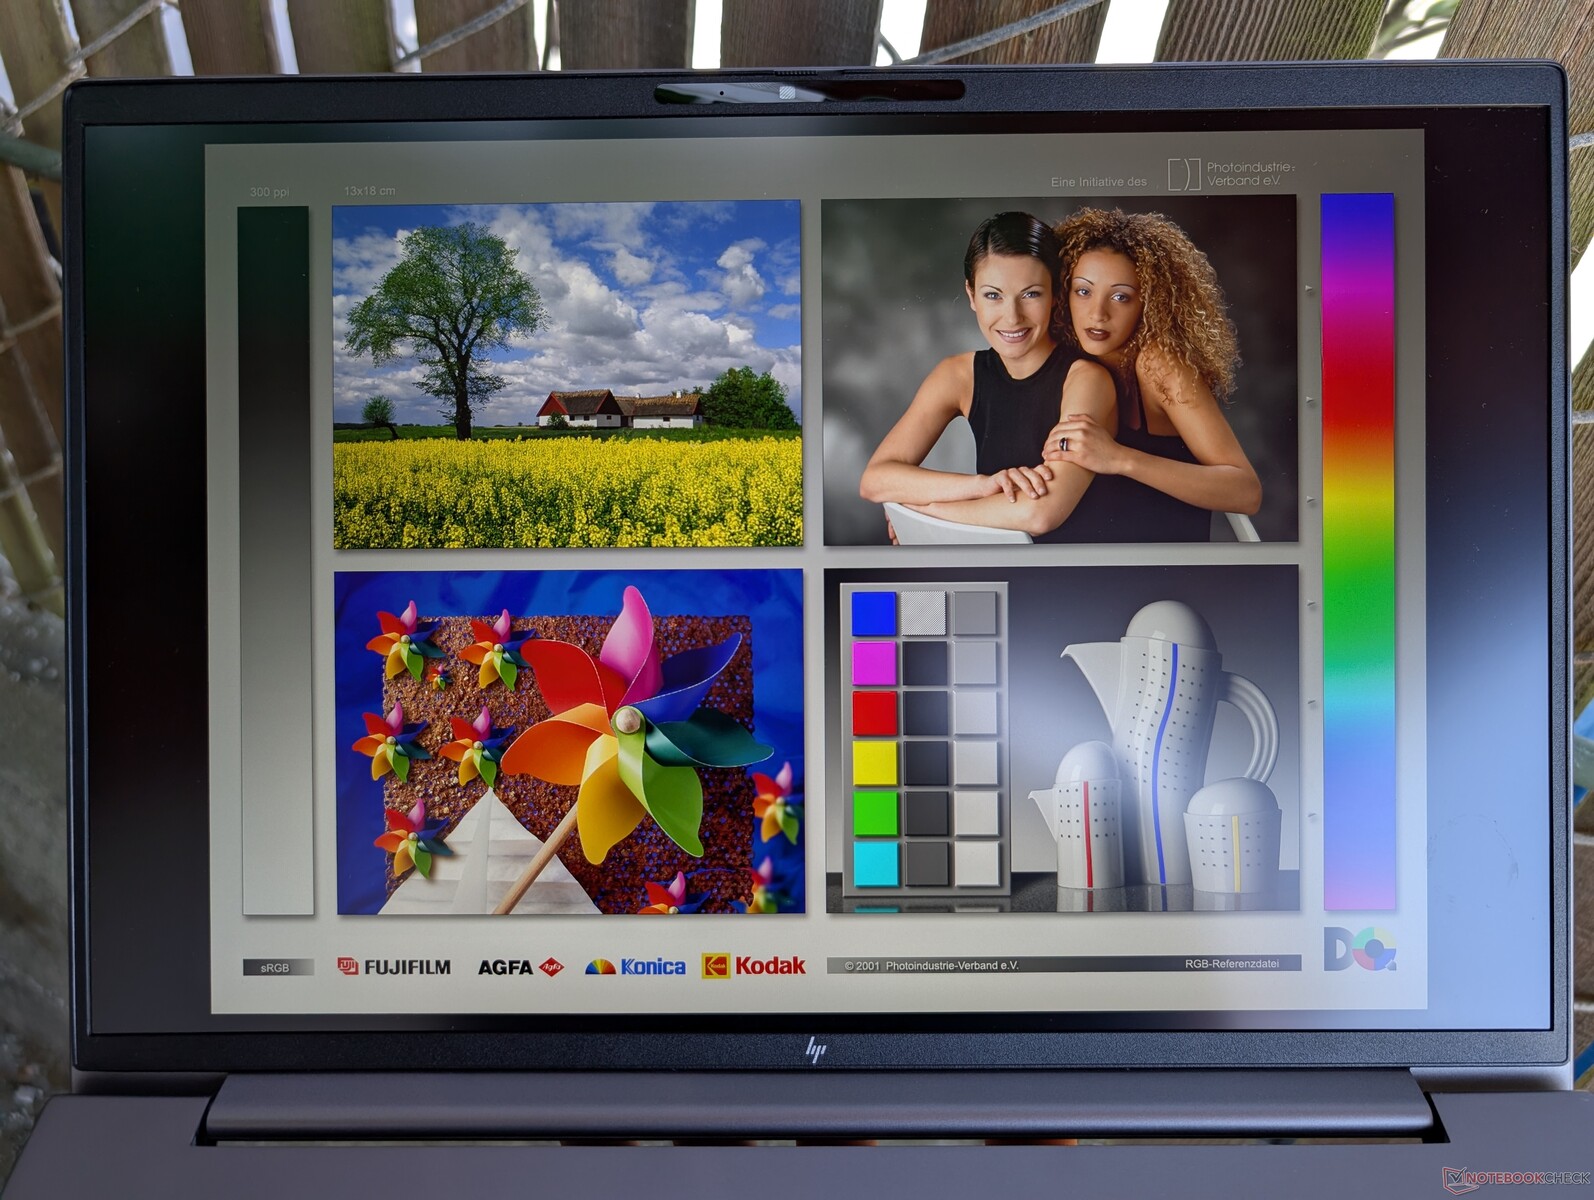
De zichtbaarheid buiten is redelijk in de schaduw met ons 1600p paneel, maar de goedkopere opties zijn zwakker en hebben meer last van schittering. De 1000-nit optie moet worden overwogen als u vaak buiten bent.
Prestaties - Nieuwe Zen 4, zelfde Zen 4 prestaties
Testomstandigheden
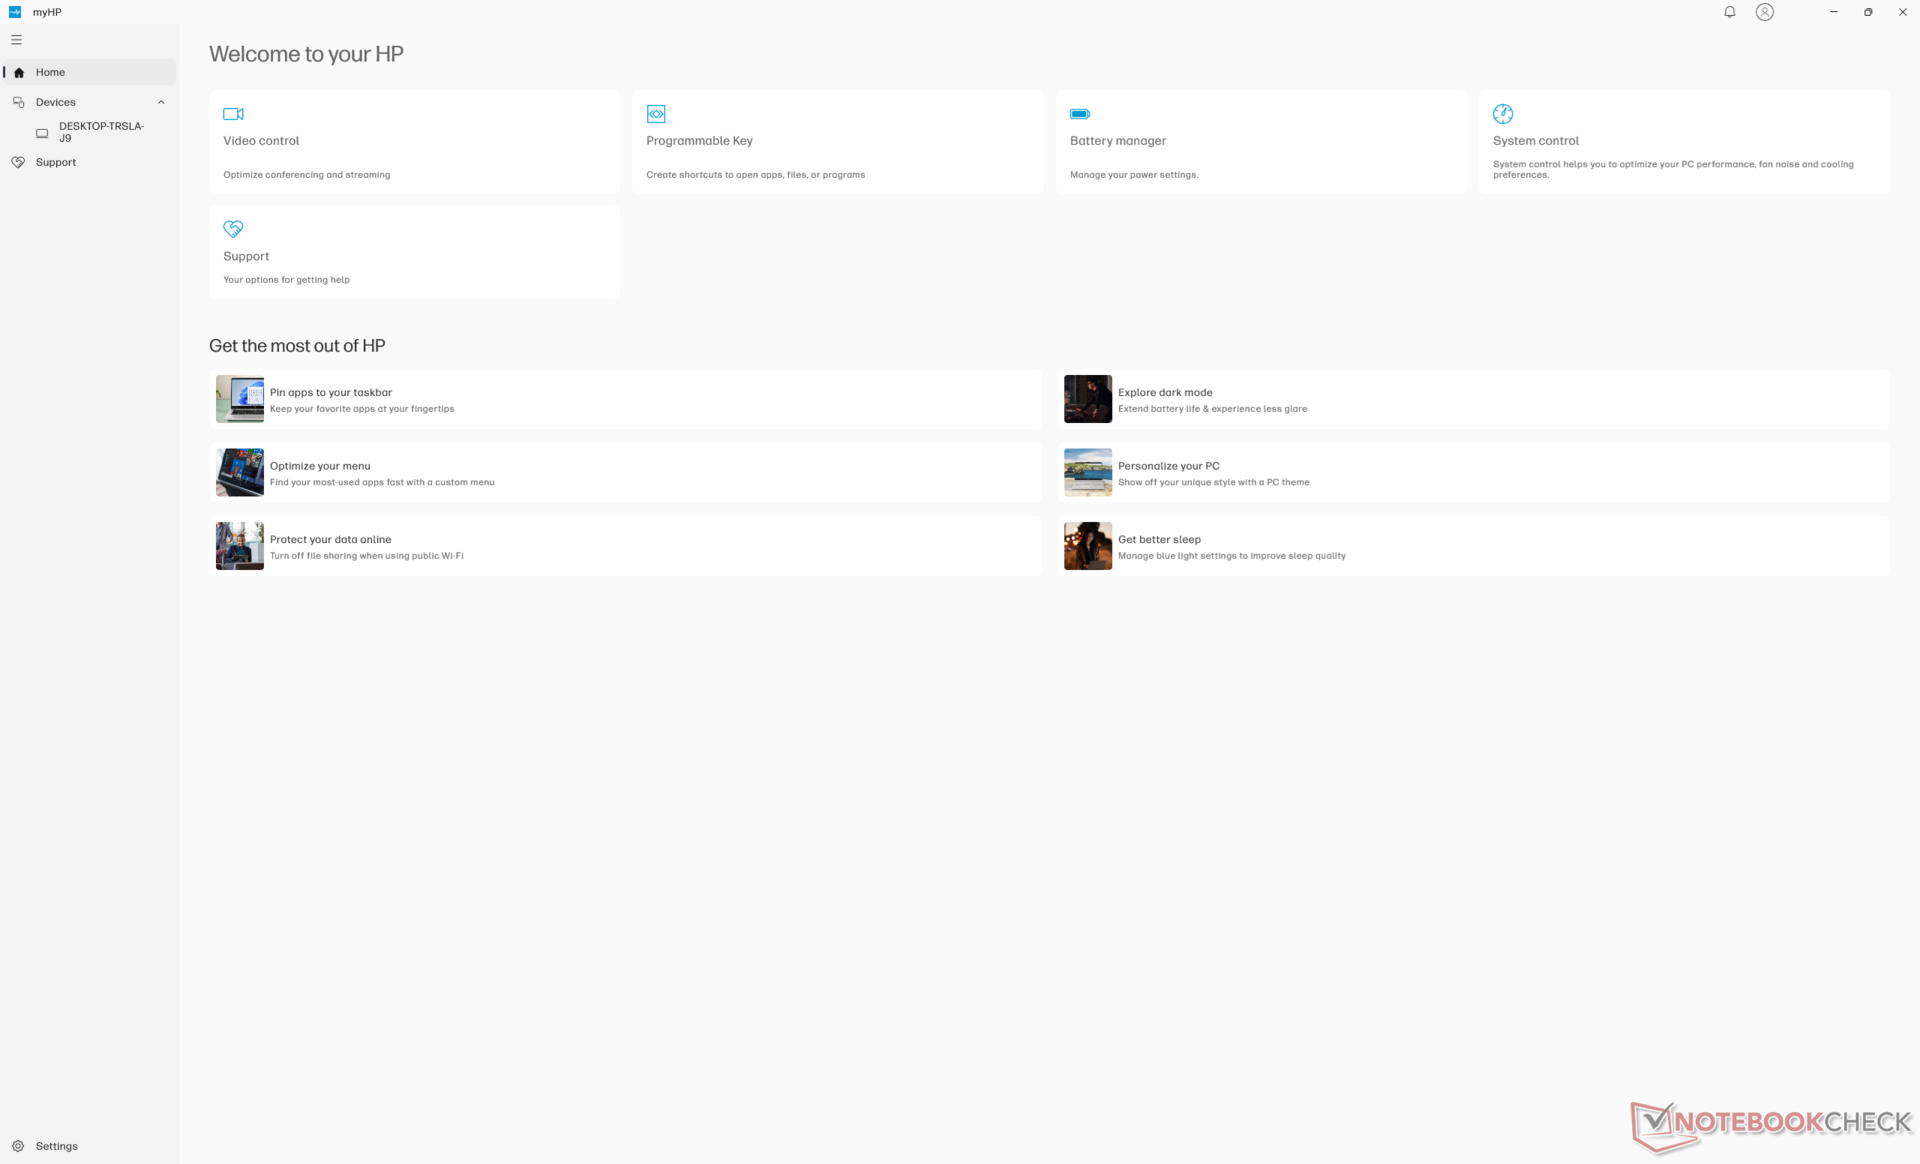
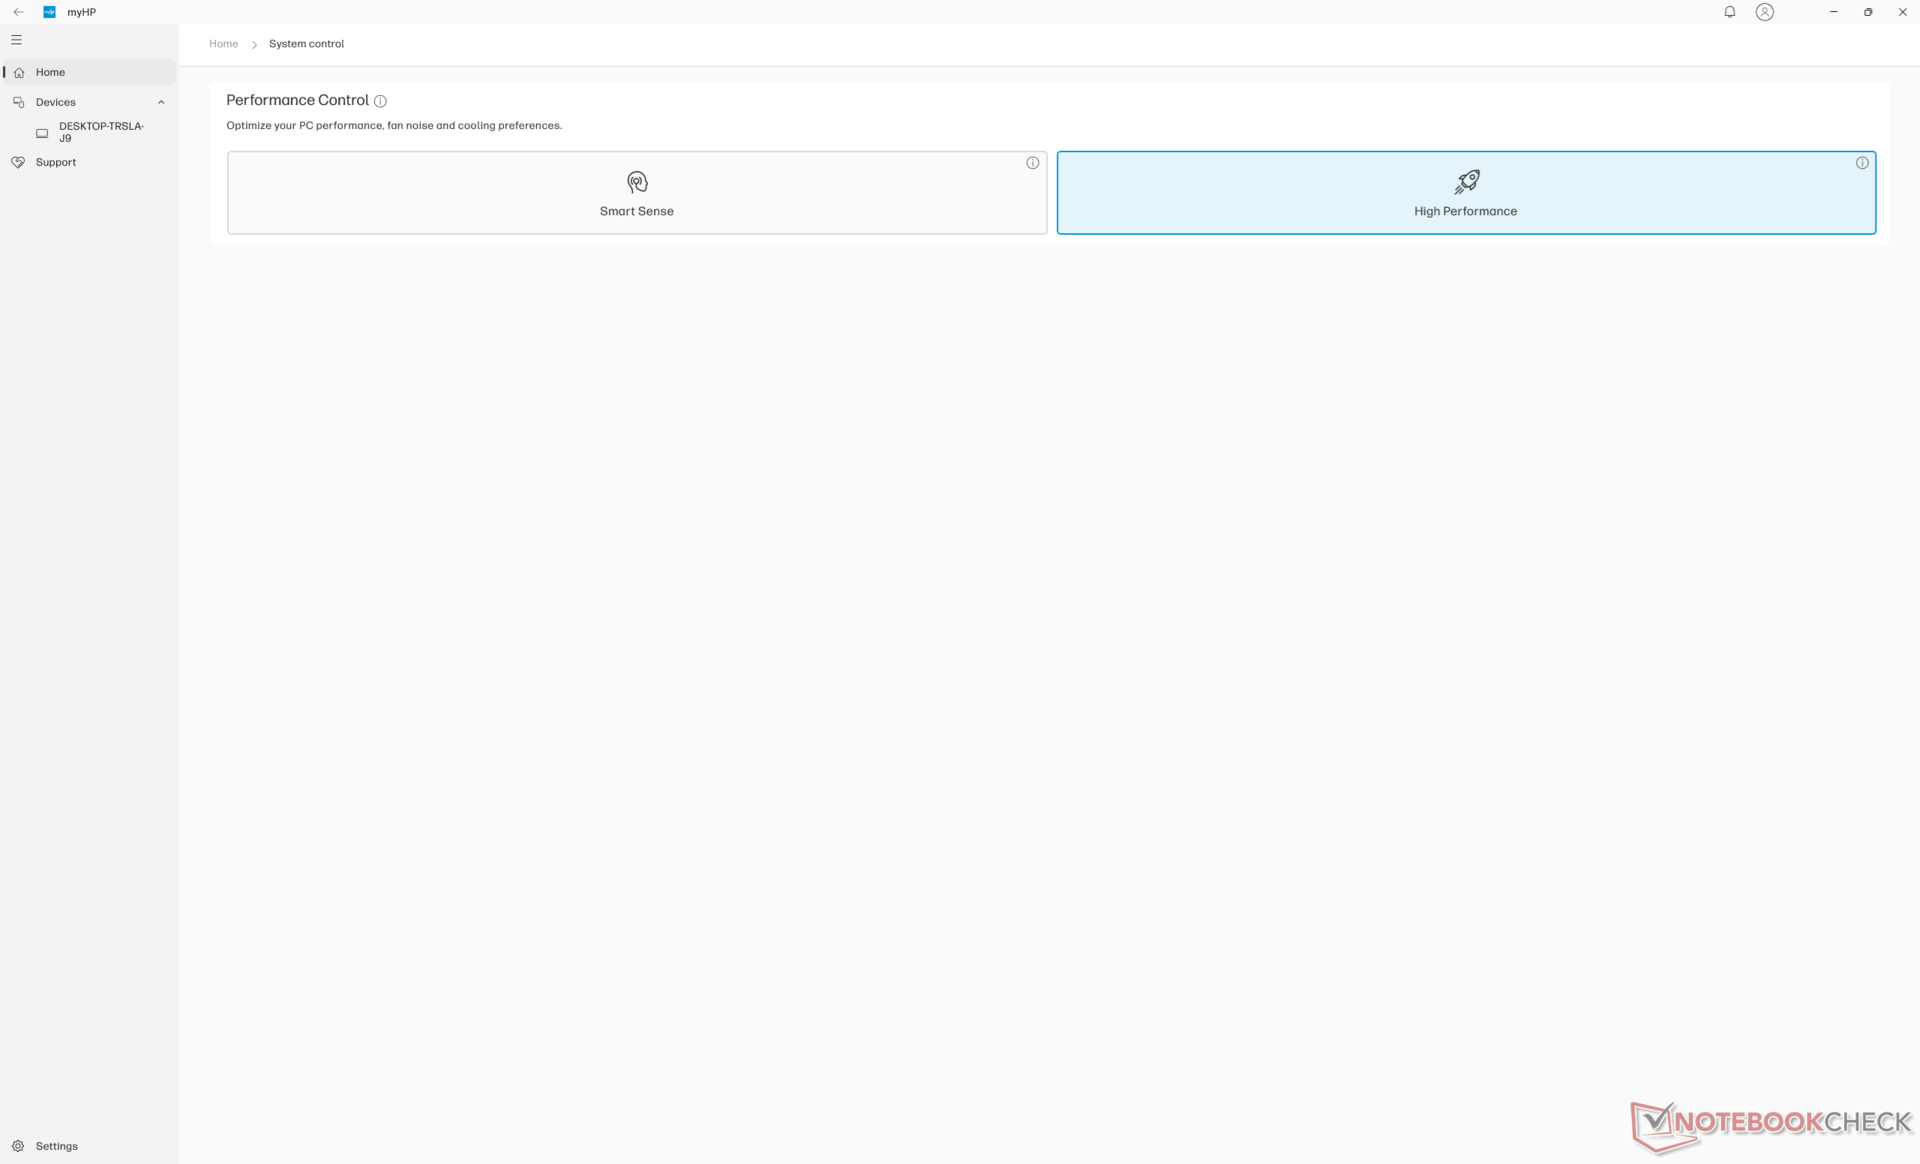
We hebben zowel Windows als MyHP ingesteld op de modus Prestaties voordat we de onderstaande benchmarks uitvoerden. Optimus 1.0 wordt ondersteund.
Processor
De Ryzen 7 8845HS biedt niet veel meer dan de Ryzen 7 7840HS die hij vervangt in de ZBook Power 15 G10. In benchmarks komen beide processors slechts een paar procentpunten dichter bij elkaar en zijn dus in wezen identiek. Dit kan teleurstellend zijn voor power users die meer significante prestatieverbeteringen hadden verwacht bij de overgang van 15-inch naar 16-inch. Snellere Raptor Lake-HX opties zijn alleen beschikbaar op HP's dikkere ZBook Fury serie.
Het belangrijkste voordeel van de Ryzen 7 8845HS ten opzichte van de Ryzen 7 7840HS is AI-versnelling dankzij de geïntegreerde NPU. Co-Pilot+ is echter niet compatibel met Hawk Point CPU's en dus is de bruikbaarheid van de NPU zeer beperkt op deze machine.
Downgraden naar de Ryzen 5 8645HS zal naar verwachting de prestaties met 25 tot 30 procent verminderen, terwijl upgraden naar de Ryzen 9 8945HS naar verwachting de prestaties met slechts 5 procent zal verbeteren.
Cinebench R15 Multi Loop
Cinebench R23: Multi Core | Single Core
Cinebench R20: CPU (Multi Core) | CPU (Single Core)
Cinebench R15: CPU Multi 64Bit | CPU Single 64Bit
Blender: v2.79 BMW27 CPU
7-Zip 18.03: 7z b 4 | 7z b 4 -mmt1
Geekbench 6.4: Multi-Core | Single-Core
Geekbench 5.5: Multi-Core | Single-Core
HWBOT x265 Benchmark v2.2: 4k Preset
LibreOffice : 20 Documents To PDF
R Benchmark 2.5: Overall mean
| CPU Performance Rating | |
| HP ZBook Fury 16 G11 | |
| Asus ExpertBook B6 Flip B6602FC2 -2! | |
| Dell Precision 5690 | |
| HP ZBook Fury 16 G9 -2! | |
| HP ZBook Power 15 G10 | |
| Gemiddeld AMD Ryzen 7 8845HS | |
| HP ZBook Power 16 G11 A | |
| Dell Precision 5000 5490 | |
| MSI CreatorPro Z16P B12UKST -2! | |
| Lenovo ThinkPad P16v G1 AMD | |
| Lenovo ThinkPad P16s G2 21K9000CGE | |
| Lenovo ThinkPad P1 G4-20Y4Z9DVUS -2! | |
| HP ZBook Firefly 16 G9-6B897EA -2! | |
| Cinebench R23 / Multi Core | |
| HP ZBook Fury 16 G11 | |
| Asus ExpertBook B6 Flip B6602FC2 | |
| Dell Precision 5690 | |
| HP ZBook Fury 16 G9 | |
| MSI CreatorPro Z16P B12UKST | |
| Dell Precision 5000 5490 | |
| Gemiddeld AMD Ryzen 7 8845HS (14895 - 18037, n=12) | |
| HP ZBook Power 16 G11 A | |
| HP ZBook Power 15 G10 | |
| Lenovo ThinkPad P16s G2 21K9000CGE | |
| Lenovo ThinkPad P16v G1 AMD | |
| Lenovo ThinkPad P1 G4-20Y4Z9DVUS | |
| HP ZBook Firefly 16 G9-6B897EA | |
| Cinebench R23 / Single Core | |
| HP ZBook Fury 16 G11 | |
| HP ZBook Fury 16 G9 | |
| Asus ExpertBook B6 Flip B6602FC2 | |
| Dell Precision 5690 | |
| HP ZBook Power 15 G10 | |
| Dell Precision 5000 5490 | |
| HP ZBook Power 16 G11 A | |
| Gemiddeld AMD Ryzen 7 8845HS (1623 - 1783, n=12) | |
| MSI CreatorPro Z16P B12UKST | |
| Lenovo ThinkPad P16s G2 21K9000CGE | |
| Lenovo ThinkPad P16v G1 AMD | |
| Lenovo ThinkPad P1 G4-20Y4Z9DVUS | |
| HP ZBook Firefly 16 G9-6B897EA | |
| Cinebench R20 / CPU (Multi Core) | |
| HP ZBook Fury 16 G11 | |
| Asus ExpertBook B6 Flip B6602FC2 | |
| Dell Precision 5690 | |
| HP ZBook Fury 16 G9 | |
| MSI CreatorPro Z16P B12UKST | |
| Dell Precision 5000 5490 | |
| HP ZBook Power 16 G11 A | |
| Gemiddeld AMD Ryzen 7 8845HS (5808 - 7026, n=12) | |
| HP ZBook Power 15 G10 | |
| Lenovo ThinkPad P16s G2 21K9000CGE | |
| Lenovo ThinkPad P16v G1 AMD | |
| Lenovo ThinkPad P1 G4-20Y4Z9DVUS | |
| HP ZBook Firefly 16 G9-6B897EA | |
| Cinebench R20 / CPU (Single Core) | |
| HP ZBook Fury 16 G11 | |
| HP ZBook Fury 16 G9 | |
| Asus ExpertBook B6 Flip B6602FC2 | |
| Dell Precision 5690 | |
| HP ZBook Power 15 G10 | |
| Gemiddeld AMD Ryzen 7 8845HS (673 - 698, n=12) | |
| HP ZBook Power 16 G11 A | |
| Dell Precision 5000 5490 | |
| MSI CreatorPro Z16P B12UKST | |
| Lenovo ThinkPad P16s G2 21K9000CGE | |
| Lenovo ThinkPad P16v G1 AMD | |
| Lenovo ThinkPad P1 G4-20Y4Z9DVUS | |
| HP ZBook Firefly 16 G9-6B897EA | |
| Cinebench R15 / CPU Multi 64Bit | |
| HP ZBook Fury 16 G11 | |
| Asus ExpertBook B6 Flip B6602FC2 | |
| Dell Precision 5690 | |
| Dell Precision 5000 5490 | |
| HP ZBook Power 16 G11 A | |
| Gemiddeld AMD Ryzen 7 8845HS (2342 - 2908, n=12) | |
| HP ZBook Power 15 G10 | |
| HP ZBook Fury 16 G9 | |
| Lenovo ThinkPad P16s G2 21K9000CGE | |
| Lenovo ThinkPad P16v G1 AMD | |
| MSI CreatorPro Z16P B12UKST | |
| Lenovo ThinkPad P1 G4-20Y4Z9DVUS | |
| HP ZBook Firefly 16 G9-6B897EA | |
| Cinebench R15 / CPU Single 64Bit | |
| HP ZBook Fury 16 G11 | |
| HP ZBook Power 15 G10 | |
| Gemiddeld AMD Ryzen 7 8845HS (269 - 283, n=12) | |
| HP ZBook Power 16 G11 A | |
| Asus ExpertBook B6 Flip B6602FC2 | |
| Dell Precision 5690 | |
| Lenovo ThinkPad P16s G2 21K9000CGE | |
| Lenovo ThinkPad P16v G1 AMD | |
| Dell Precision 5000 5490 | |
| MSI CreatorPro Z16P B12UKST | |
| Lenovo ThinkPad P1 G4-20Y4Z9DVUS | |
| HP ZBook Firefly 16 G9-6B897EA | |
| HP ZBook Fury 16 G9 | |
| Blender / v2.79 BMW27 CPU | |
| HP ZBook Firefly 16 G9-6B897EA | |
| Lenovo ThinkPad P1 G4-20Y4Z9DVUS | |
| Lenovo ThinkPad P16s G2 21K9000CGE | |
| Dell Precision 5690 | |
| HP ZBook Power 16 G11 A | |
| Lenovo ThinkPad P16v G1 AMD | |
| Dell Precision 5000 5490 | |
| Gemiddeld AMD Ryzen 7 8845HS (179 - 216, n=12) | |
| MSI CreatorPro Z16P B12UKST | |
| HP ZBook Power 15 G10 | |
| Asus ExpertBook B6 Flip B6602FC2 | |
| HP ZBook Fury 16 G9 | |
| HP ZBook Fury 16 G11 | |
| 7-Zip 18.03 / 7z b 4 | |
| HP ZBook Fury 16 G11 | |
| HP ZBook Fury 16 G9 | |
| Dell Precision 5690 | |
| Asus ExpertBook B6 Flip B6602FC2 | |
| HP ZBook Power 15 G10 | |
| Gemiddeld AMD Ryzen 7 8845HS (62669 - 74664, n=12) | |
| Dell Precision 5000 5490 | |
| HP ZBook Power 16 G11 A | |
| MSI CreatorPro Z16P B12UKST | |
| Lenovo ThinkPad P16v G1 AMD | |
| Lenovo ThinkPad P16s G2 21K9000CGE | |
| Lenovo ThinkPad P1 G4-20Y4Z9DVUS | |
| HP ZBook Firefly 16 G9-6B897EA | |
| 7-Zip 18.03 / 7z b 4 -mmt1 | |
| HP ZBook Fury 16 G11 | |
| Lenovo ThinkPad P16v G1 AMD | |
| HP ZBook Power 15 G10 | |
| HP ZBook Power 16 G11 A | |
| Gemiddeld AMD Ryzen 7 8845HS (5197 - 6714, n=12) | |
| Asus ExpertBook B6 Flip B6602FC2 | |
| HP ZBook Fury 16 G9 | |
| Lenovo ThinkPad P16s G2 21K9000CGE | |
| MSI CreatorPro Z16P B12UKST | |
| Lenovo ThinkPad P1 G4-20Y4Z9DVUS | |
| Dell Precision 5000 5490 | |
| Dell Precision 5690 | |
| HP ZBook Firefly 16 G9-6B897EA | |
| Geekbench 6.4 / Multi-Core | |
| HP ZBook Fury 16 G11 | |
| Dell Precision 5690 | |
| Dell Precision 5000 5490 | |
| HP ZBook Power 15 G10 | |
| Gemiddeld AMD Ryzen 7 8845HS (11073 - 14014, n=16) | |
| HP ZBook Power 16 G11 A | |
| Lenovo ThinkPad P16s G2 21K9000CGE | |
| Lenovo ThinkPad P16v G1 AMD | |
| Geekbench 6.4 / Single-Core | |
| HP ZBook Fury 16 G11 | |
| HP ZBook Power 15 G10 | |
| Gemiddeld AMD Ryzen 7 8845HS (2510 - 2698, n=14) | |
| HP ZBook Power 16 G11 A | |
| Lenovo ThinkPad P16v G1 AMD | |
| Dell Precision 5690 | |
| Lenovo ThinkPad P16s G2 21K9000CGE | |
| Dell Precision 5000 5490 | |
| Geekbench 5.5 / Multi-Core | |
| HP ZBook Fury 16 G11 | |
| Asus ExpertBook B6 Flip B6602FC2 | |
| Dell Precision 5690 | |
| HP ZBook Fury 16 G9 | |
| Dell Precision 5000 5490 | |
| MSI CreatorPro Z16P B12UKST | |
| HP ZBook Power 15 G10 | |
| Gemiddeld AMD Ryzen 7 8845HS (11256 - 12726, n=13) | |
| HP ZBook Power 16 G11 A | |
| Lenovo ThinkPad P16s G2 21K9000CGE | |
| Lenovo ThinkPad P16v G1 AMD | |
| Lenovo ThinkPad P1 G4-20Y4Z9DVUS | |
| HP ZBook Firefly 16 G9-6B897EA | |
| Geekbench 5.5 / Single-Core | |
| HP ZBook Fury 16 G11 | |
| HP ZBook Power 15 G10 | |
| HP ZBook Fury 16 G9 | |
| Gemiddeld AMD Ryzen 7 8845HS (1765 - 2004, n=13) | |
| HP ZBook Power 16 G11 A | |
| Asus ExpertBook B6 Flip B6602FC2 | |
| Dell Precision 5690 | |
| Lenovo ThinkPad P16v G1 AMD | |
| HP ZBook Firefly 16 G9-6B897EA | |
| MSI CreatorPro Z16P B12UKST | |
| Dell Precision 5000 5490 | |
| Lenovo ThinkPad P16s G2 21K9000CGE | |
| Lenovo ThinkPad P1 G4-20Y4Z9DVUS | |
| HWBOT x265 Benchmark v2.2 / 4k Preset | |
| HP ZBook Fury 16 G11 | |
| Dell Precision 5690 | |
| Asus ExpertBook B6 Flip B6602FC2 | |
| Gemiddeld AMD Ryzen 7 8845HS (18.6 - 22.7, n=12) | |
| HP ZBook Power 15 G10 | |
| HP ZBook Fury 16 G9 | |
| HP ZBook Power 16 G11 A | |
| MSI CreatorPro Z16P B12UKST | |
| Lenovo ThinkPad P16v G1 AMD | |
| Lenovo ThinkPad P16s G2 21K9000CGE | |
| Dell Precision 5000 5490 | |
| Lenovo ThinkPad P1 G4-20Y4Z9DVUS | |
| HP ZBook Firefly 16 G9-6B897EA | |
| LibreOffice / 20 Documents To PDF | |
| HP ZBook Power 15 G10 | |
| HP ZBook Firefly 16 G9-6B897EA | |
| Lenovo ThinkPad P16s G2 21K9000CGE | |
| HP ZBook Power 16 G11 A | |
| Gemiddeld AMD Ryzen 7 8845HS (44.4 - 77, n=12) | |
| Lenovo ThinkPad P1 G4-20Y4Z9DVUS | |
| HP ZBook Fury 16 G11 | |
| Lenovo ThinkPad P16v G1 AMD | |
| Dell Precision 5000 5490 | |
| Asus ExpertBook B6 Flip B6602FC2 | |
| Dell Precision 5690 | |
| MSI CreatorPro Z16P B12UKST | |
| HP ZBook Fury 16 G9 | |
| R Benchmark 2.5 / Overall mean | |
| Lenovo ThinkPad P1 G4-20Y4Z9DVUS | |
| HP ZBook Firefly 16 G9-6B897EA | |
| Dell Precision 5000 5490 | |
| Lenovo ThinkPad P16s G2 21K9000CGE | |
| Dell Precision 5690 | |
| MSI CreatorPro Z16P B12UKST | |
| Gemiddeld AMD Ryzen 7 8845HS (0.4304 - 0.4935, n=12) | |
| Asus ExpertBook B6 Flip B6602FC2 | |
| HP ZBook Power 15 G10 | |
| HP ZBook Power 16 G11 A | |
| Lenovo ThinkPad P16v G1 AMD | |
| HP ZBook Fury 16 G9 | |
| HP ZBook Fury 16 G11 | |
Cinebench R23: Multi Core | Single Core
Cinebench R20: CPU (Multi Core) | CPU (Single Core)
Cinebench R15: CPU Multi 64Bit | CPU Single 64Bit
Blender: v2.79 BMW27 CPU
7-Zip 18.03: 7z b 4 | 7z b 4 -mmt1
Geekbench 6.4: Multi-Core | Single-Core
Geekbench 5.5: Multi-Core | Single-Core
HWBOT x265 Benchmark v2.2: 4k Preset
LibreOffice : 20 Documents To PDF
R Benchmark 2.5: Overall mean
* ... kleiner is beter
AIDA64: FP32 Ray-Trace | FPU Julia | CPU SHA3 | CPU Queen | FPU SinJulia | FPU Mandel | CPU AES | CPU ZLib | FP64 Ray-Trace | CPU PhotoWorxx
| Performance Rating | |
| Gemiddeld AMD Ryzen 7 8845HS | |
| HP ZBook Power 15 G10 | |
| HP ZBook Power 16 G11 A | |
| HP ZBook Fury 16 G11 | |
| Lenovo ThinkPad P16s G2 21K9000CGE | |
| Dell Precision 5690 | |
| Lenovo ThinkPad P1 Gen 7 21KV001SGE | |
| AIDA64 / FP32 Ray-Trace | |
| Gemiddeld AMD Ryzen 7 8845HS (23708 - 29544, n=12) | |
| HP ZBook Power 15 G10 | |
| HP ZBook Power 16 G11 A | |
| Lenovo ThinkPad P16s G2 21K9000CGE | |
| HP ZBook Fury 16 G11 | |
| Dell Precision 5690 | |
| Lenovo ThinkPad P1 Gen 7 21KV001SGE | |
| AIDA64 / FPU Julia | |
| HP ZBook Power 16 G11 A | |
| Gemiddeld AMD Ryzen 7 8845HS (99659 - 125873, n=12) | |
| HP ZBook Power 15 G10 | |
| HP ZBook Fury 16 G11 | |
| Lenovo ThinkPad P16s G2 21K9000CGE | |
| Dell Precision 5690 | |
| Lenovo ThinkPad P1 Gen 7 21KV001SGE | |
| AIDA64 / CPU SHA3 | |
| HP ZBook Fury 16 G11 | |
| HP ZBook Power 16 G11 A | |
| Gemiddeld AMD Ryzen 7 8845HS (4332 - 5180, n=12) | |
| HP ZBook Power 15 G10 | |
| Lenovo ThinkPad P16s G2 21K9000CGE | |
| Dell Precision 5690 | |
| Lenovo ThinkPad P1 Gen 7 21KV001SGE | |
| AIDA64 / CPU Queen | |
| HP ZBook Fury 16 G11 | |
| HP ZBook Power 16 G11 A | |
| Gemiddeld AMD Ryzen 7 8845HS (109458 - 124695, n=12) | |
| HP ZBook Power 15 G10 | |
| Lenovo ThinkPad P16s G2 21K9000CGE | |
| Dell Precision 5690 | |
| Lenovo ThinkPad P1 Gen 7 21KV001SGE | |
| AIDA64 / FPU SinJulia | |
| Gemiddeld AMD Ryzen 7 8845HS (14062 - 15519, n=12) | |
| HP ZBook Power 15 G10 | |
| HP ZBook Power 16 G11 A | |
| Lenovo ThinkPad P16s G2 21K9000CGE | |
| HP ZBook Fury 16 G11 | |
| Dell Precision 5690 | |
| Lenovo ThinkPad P1 Gen 7 21KV001SGE | |
| AIDA64 / FPU Mandel | |
| Gemiddeld AMD Ryzen 7 8845HS (53436 - 67367, n=12) | |
| HP ZBook Power 15 G10 | |
| HP ZBook Power 16 G11 A | |
| Lenovo ThinkPad P16s G2 21K9000CGE | |
| HP ZBook Fury 16 G11 | |
| Dell Precision 5690 | |
| Lenovo ThinkPad P1 Gen 7 21KV001SGE | |
| AIDA64 / CPU AES | |
| HP ZBook Fury 16 G11 | |
| Gemiddeld AMD Ryzen 7 8845HS (64515 - 172642, n=12) | |
| Dell Precision 5690 | |
| HP ZBook Power 15 G10 | |
| Lenovo ThinkPad P1 Gen 7 21KV001SGE | |
| HP ZBook Power 16 G11 A | |
| Lenovo ThinkPad P16s G2 21K9000CGE | |
| AIDA64 / CPU ZLib | |
| HP ZBook Fury 16 G11 | |
| Dell Precision 5690 | |
| Lenovo ThinkPad P1 Gen 7 21KV001SGE | |
| HP ZBook Power 16 G11 A | |
| HP ZBook Power 15 G10 | |
| Lenovo ThinkPad P16s G2 21K9000CGE | |
| Gemiddeld AMD Ryzen 7 8845HS (627 - 1080, n=12) | |
| AIDA64 / FP64 Ray-Trace | |
| HP ZBook Power 15 G10 | |
| Gemiddeld AMD Ryzen 7 8845HS (12361 - 15911, n=12) | |
| HP ZBook Power 16 G11 A | |
| Lenovo ThinkPad P16s G2 21K9000CGE | |
| HP ZBook Fury 16 G11 | |
| Dell Precision 5690 | |
| Lenovo ThinkPad P1 Gen 7 21KV001SGE | |
| AIDA64 / CPU PhotoWorxx | |
| Dell Precision 5690 | |
| HP ZBook Power 15 G10 | |
| Lenovo ThinkPad P1 Gen 7 21KV001SGE | |
| HP ZBook Power 16 G11 A | |
| Gemiddeld AMD Ryzen 7 8845HS (33192 - 41668, n=12) | |
| Lenovo ThinkPad P16s G2 21K9000CGE | |
| HP ZBook Fury 16 G11 | |
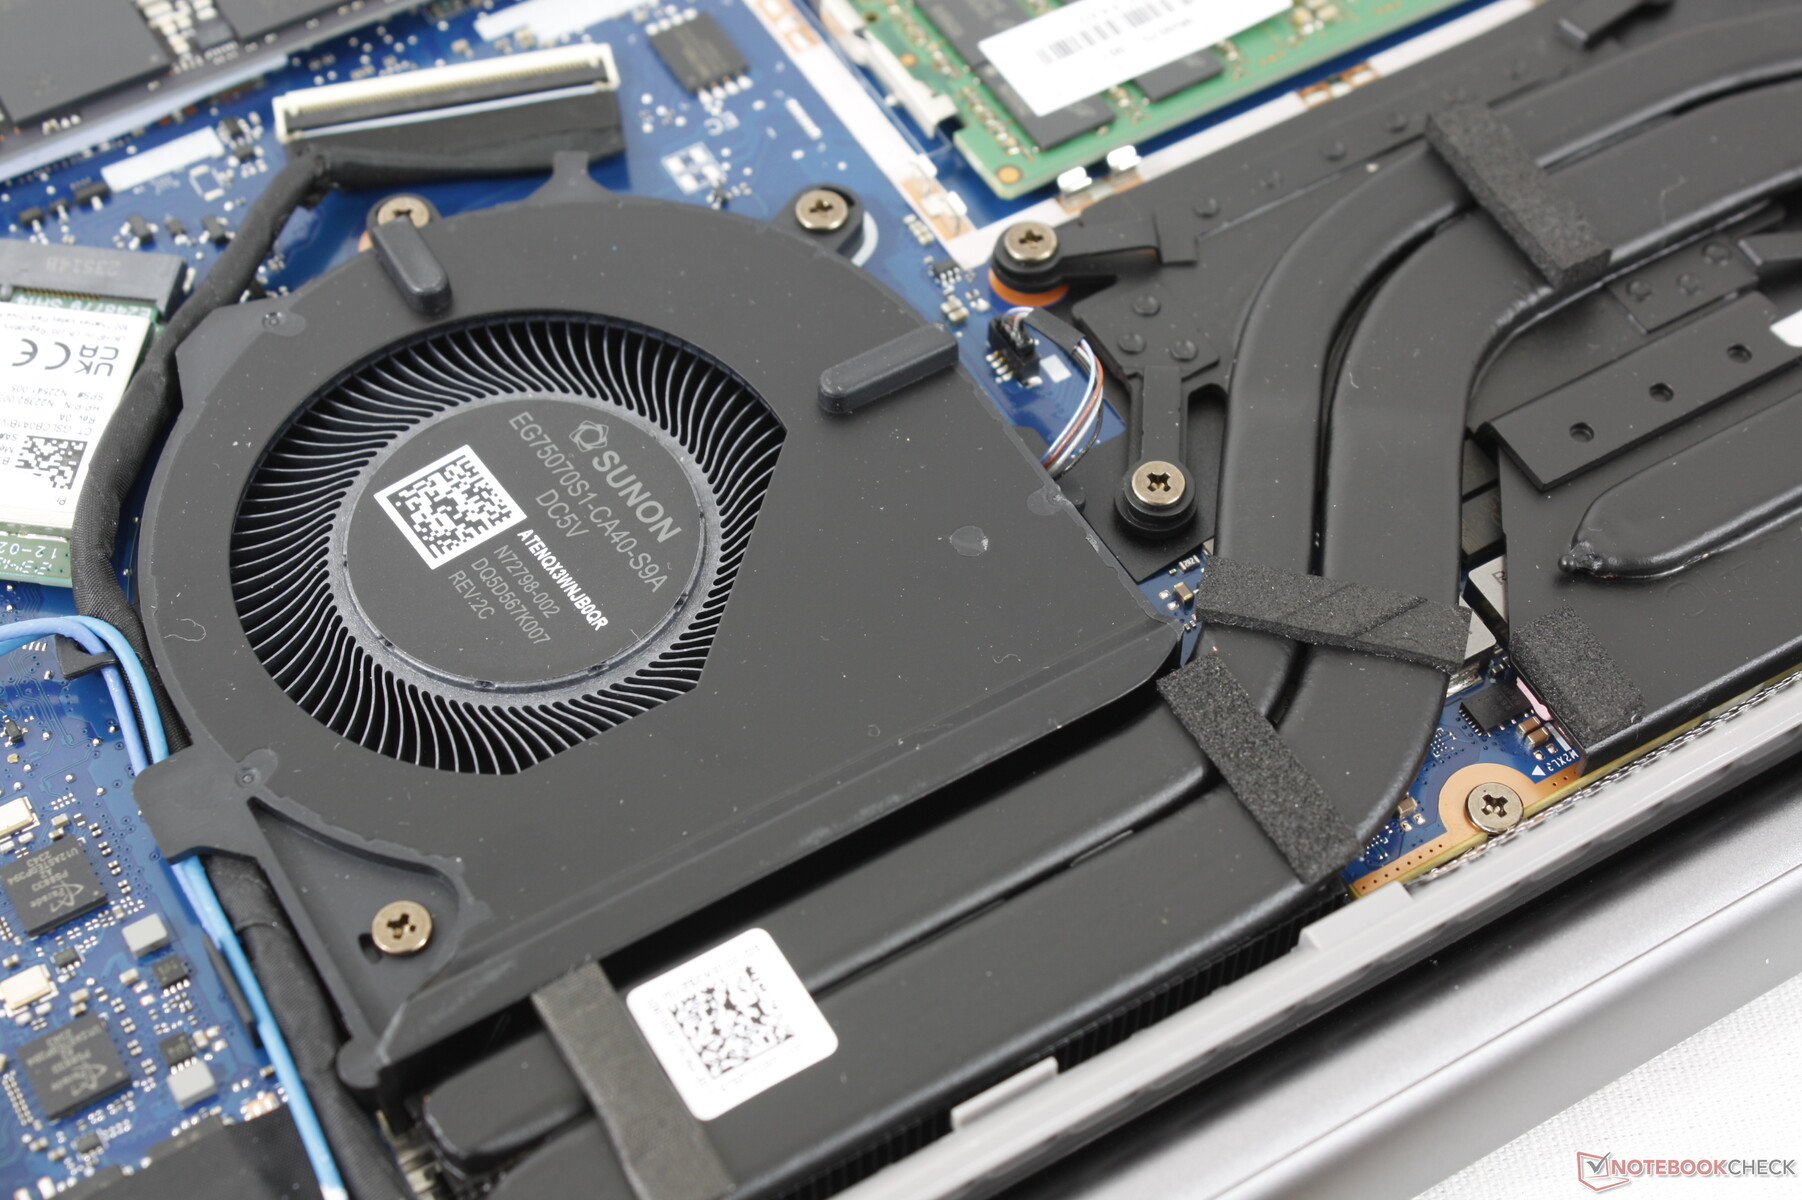
Stresstest
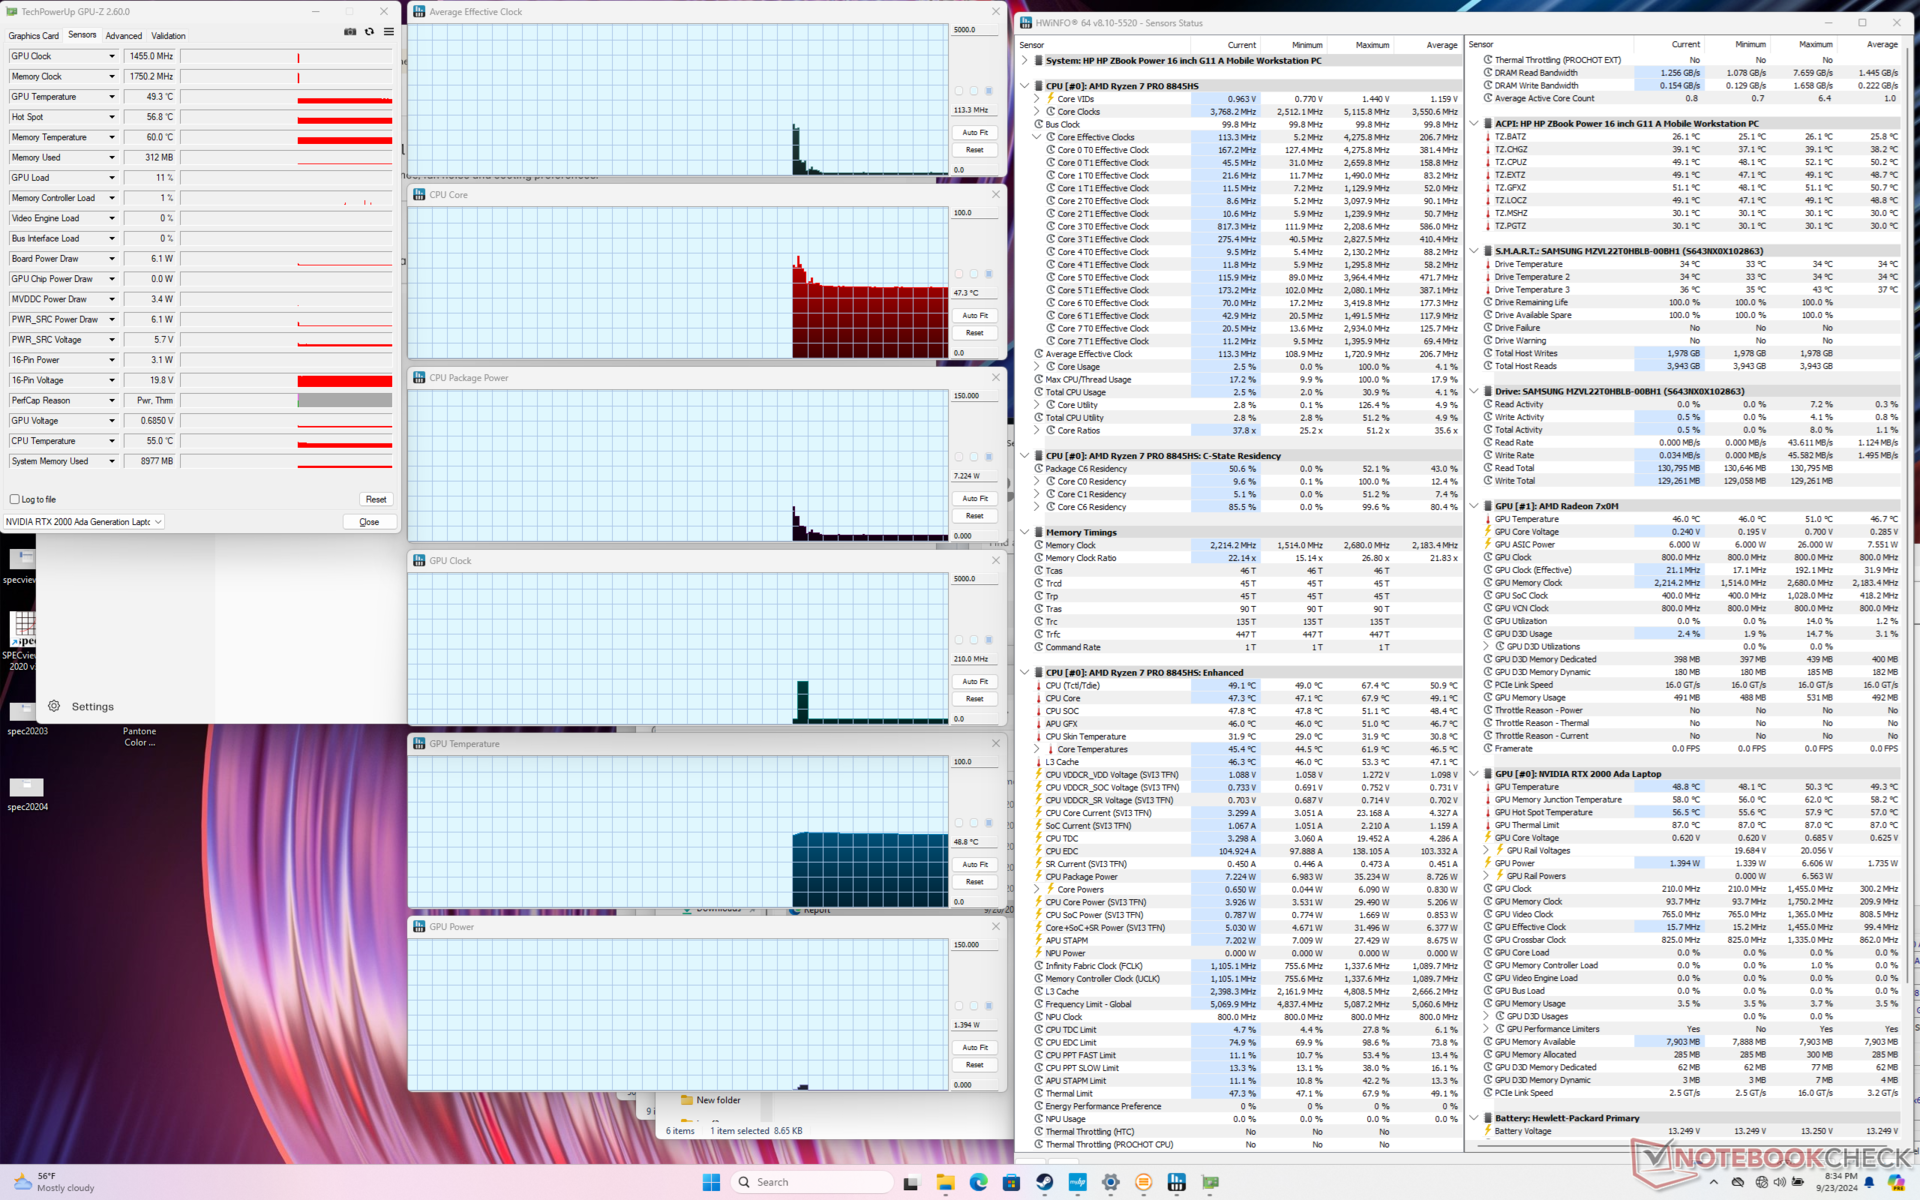
De CPU steeg naar 4,3 GHz, 65 W en 90 C bij het starten van Prime95-stress, voordat hij snel daalde en zich stabiliseerde op 3,8 GHz en 50 W om hogere kerntemperaturen te voorkomen. De resultaten komen dicht in de buurt van wat we op de ZBook Power 15 G10 zagen, zo niet een paar graden warmer.
Interessant is dat de CPU zwaarder throttled naar slechts 2,8 GHz wanneer zowel Prime95 als FurMark tegelijkertijd worden uitgevoerd, in plaats van 3,8 GHz zoals op het model van vorig jaar. Deze verandering was waarschijnlijk bedoeld om de kerntemperaturen te verbeteren; de CPU stabiliseert nu op een comfortabelere 66 C in plaats van de 99 C van de ZBook Power 15 G10.
Het draaien van Cyberpunk 2077 in de Balanced modus in plaats van de Performance modus resulteert in zowel iets koelere kerntemperaturen als iets lagere gemiddelde kloksnelheden, zoals hieronder te zien is. Het stroomverbruik van de GPU-kaart daalt ook van 35 W naar 30 W, in plaats van het geadverteerde maximum van 50 W.
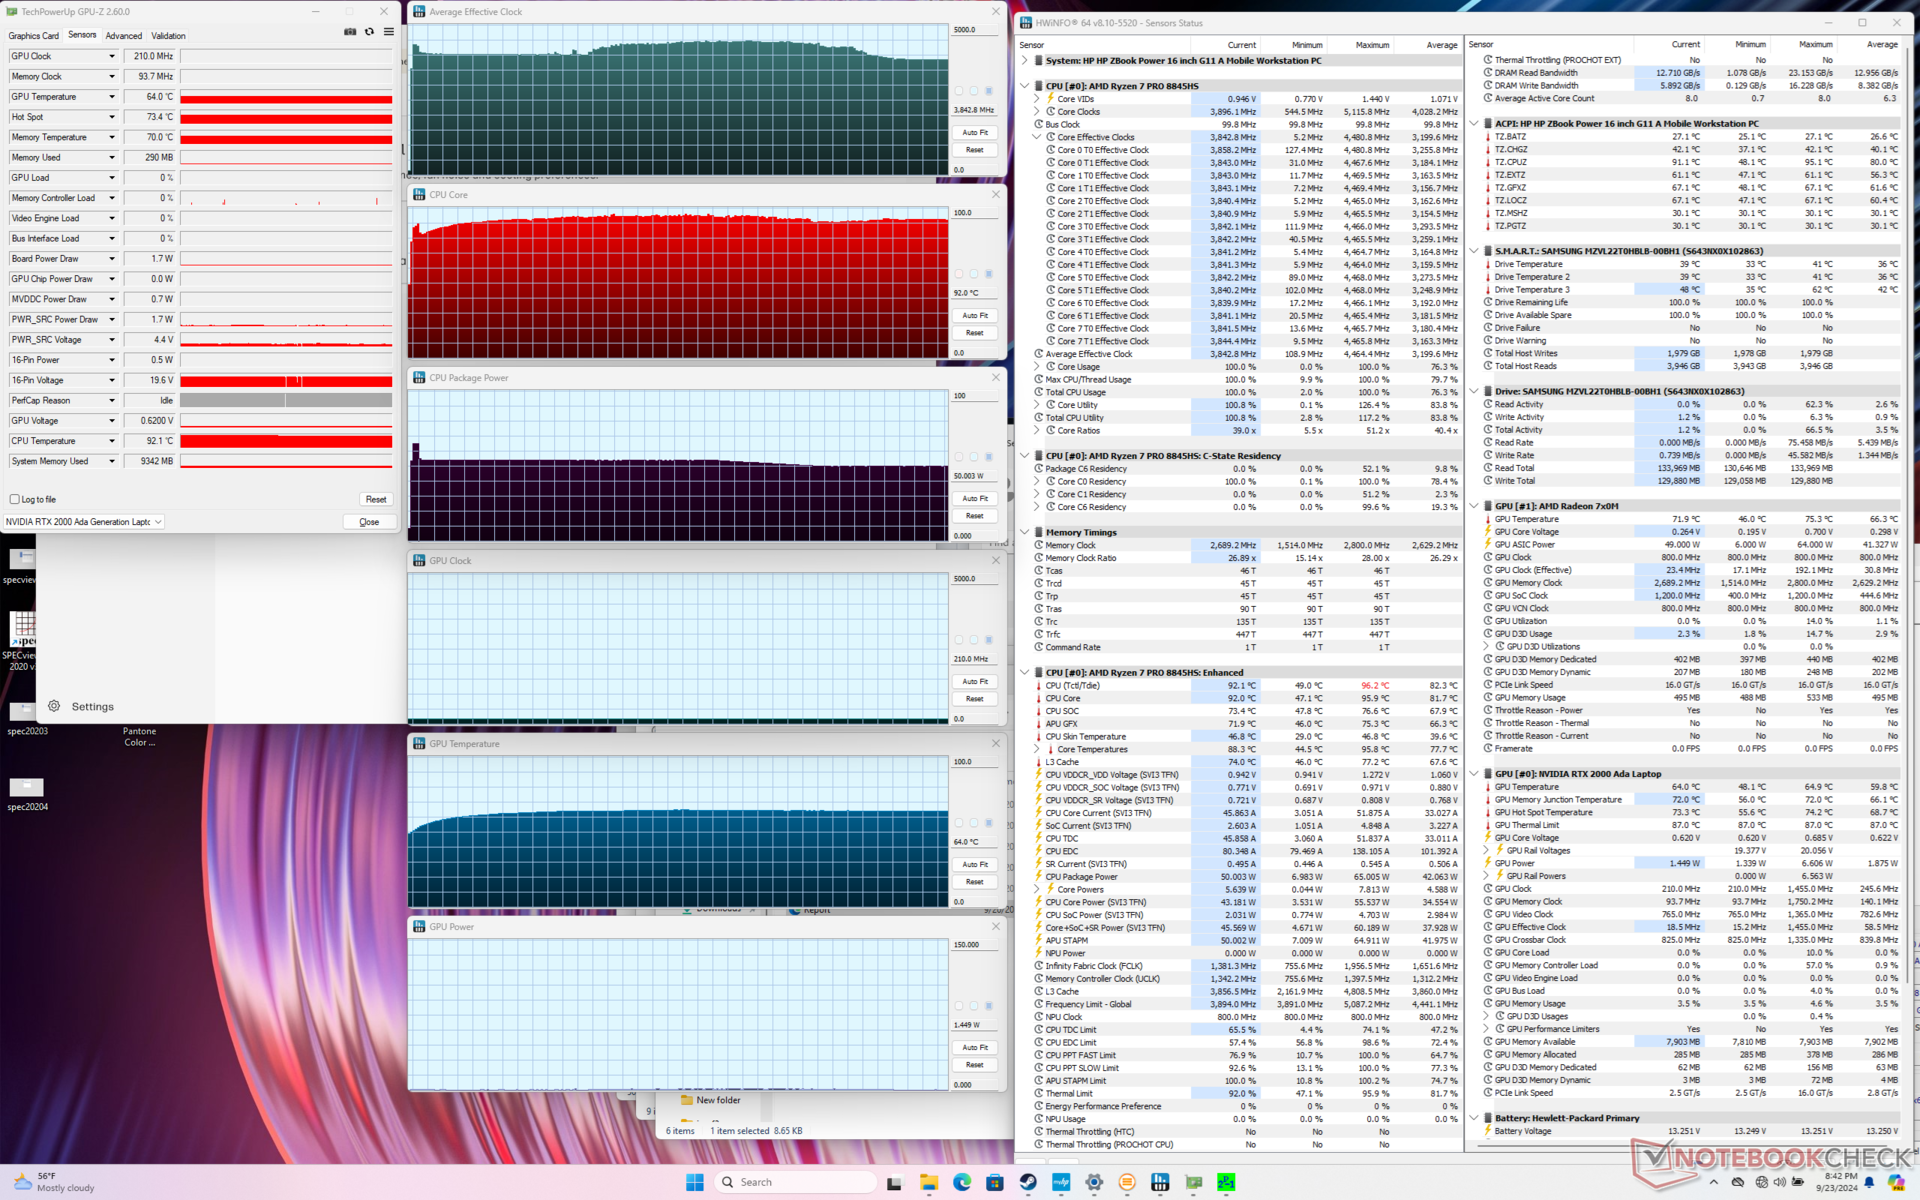
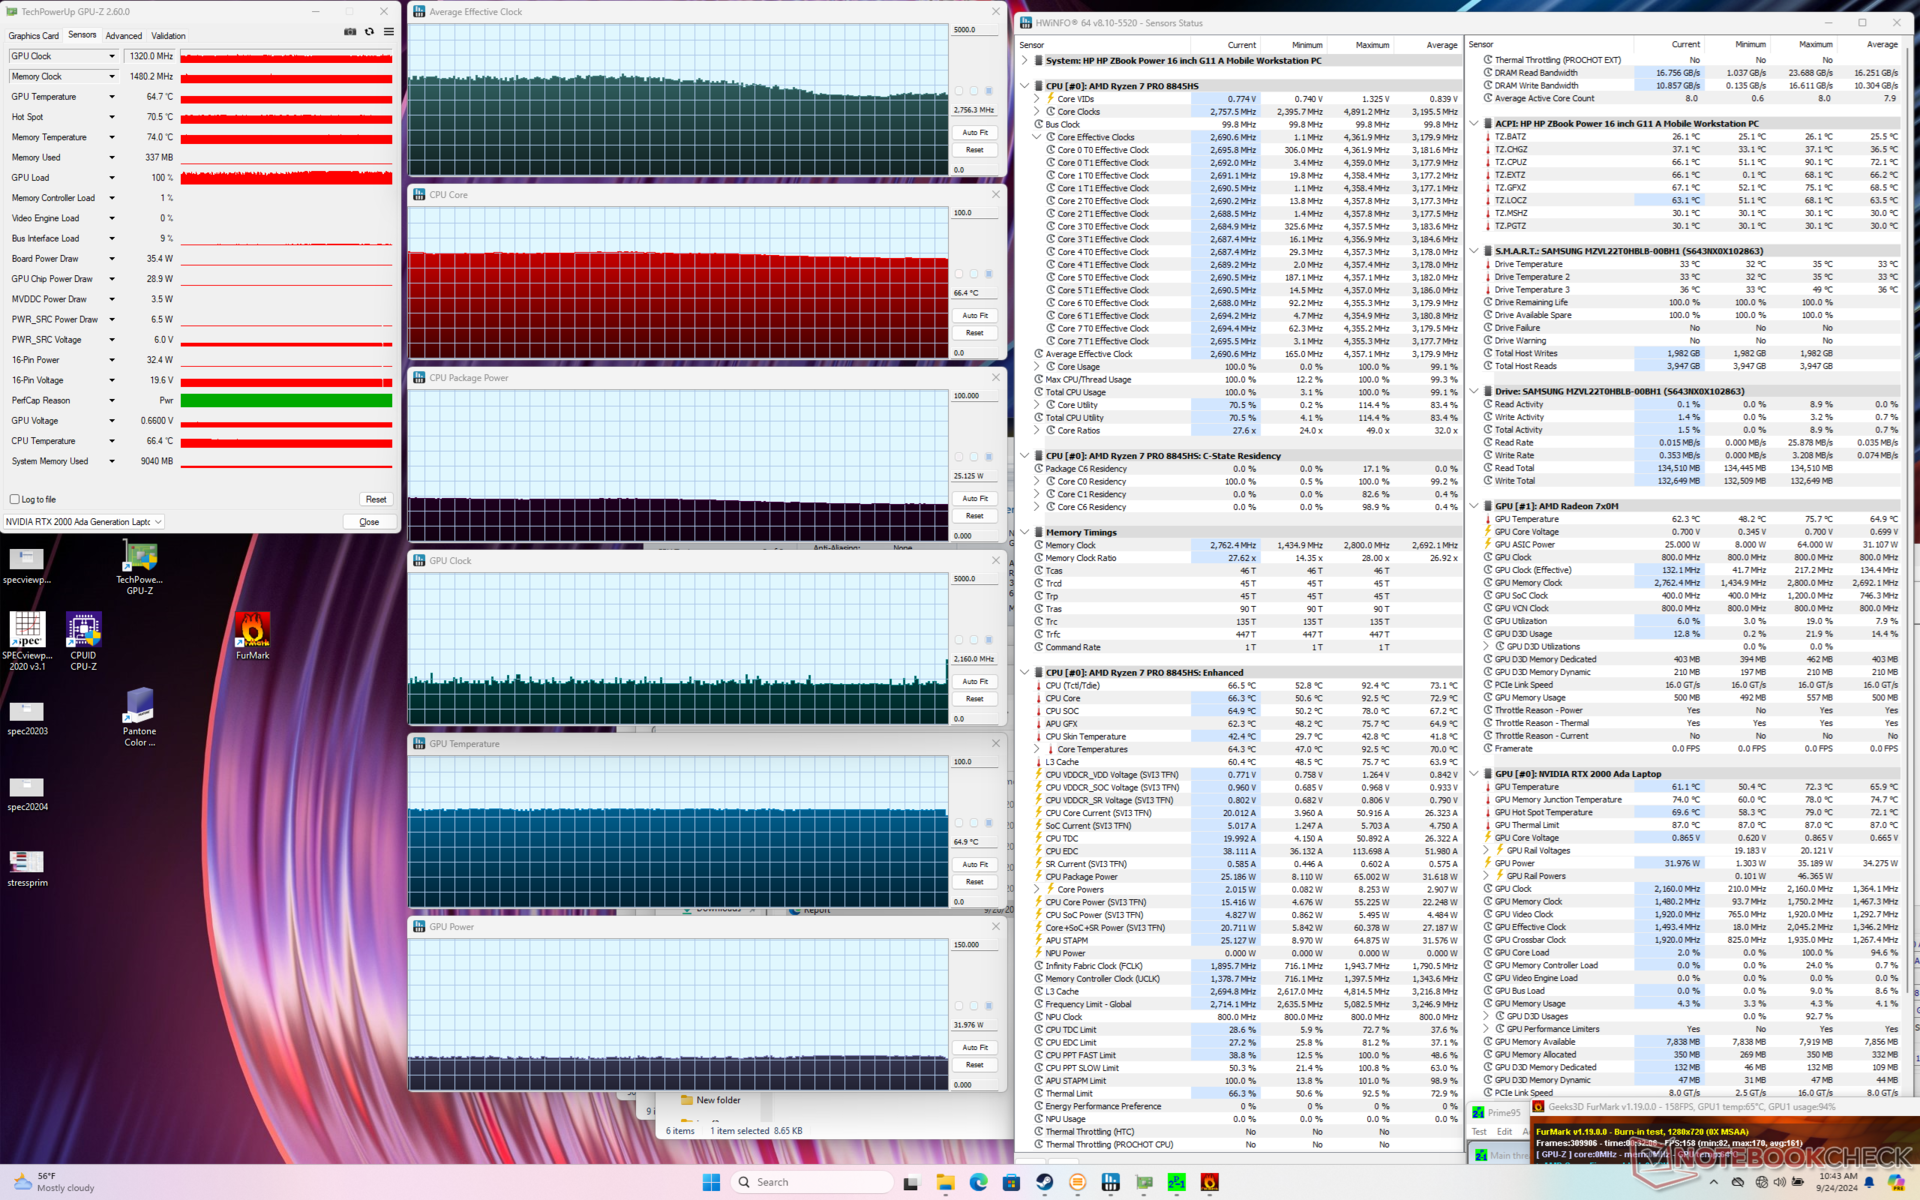
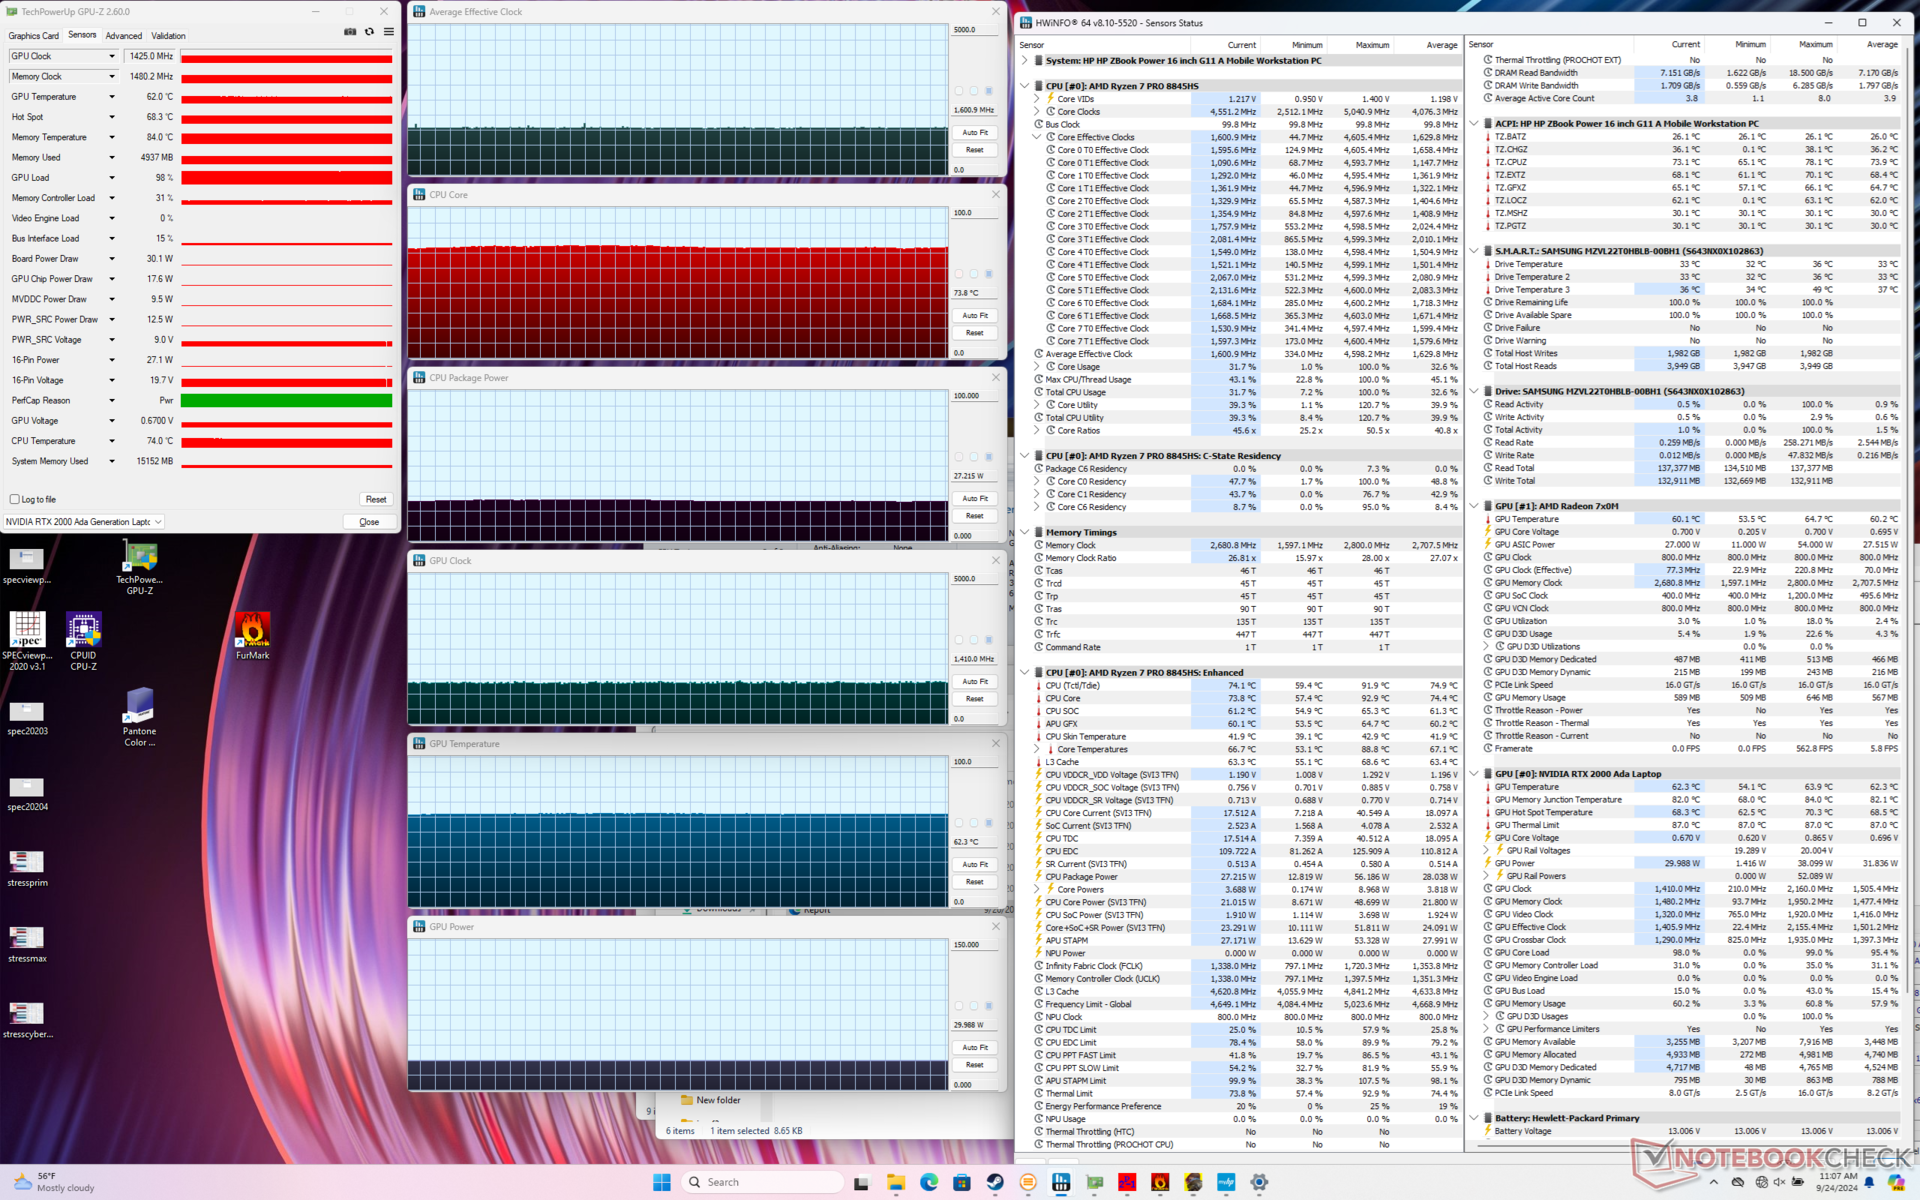
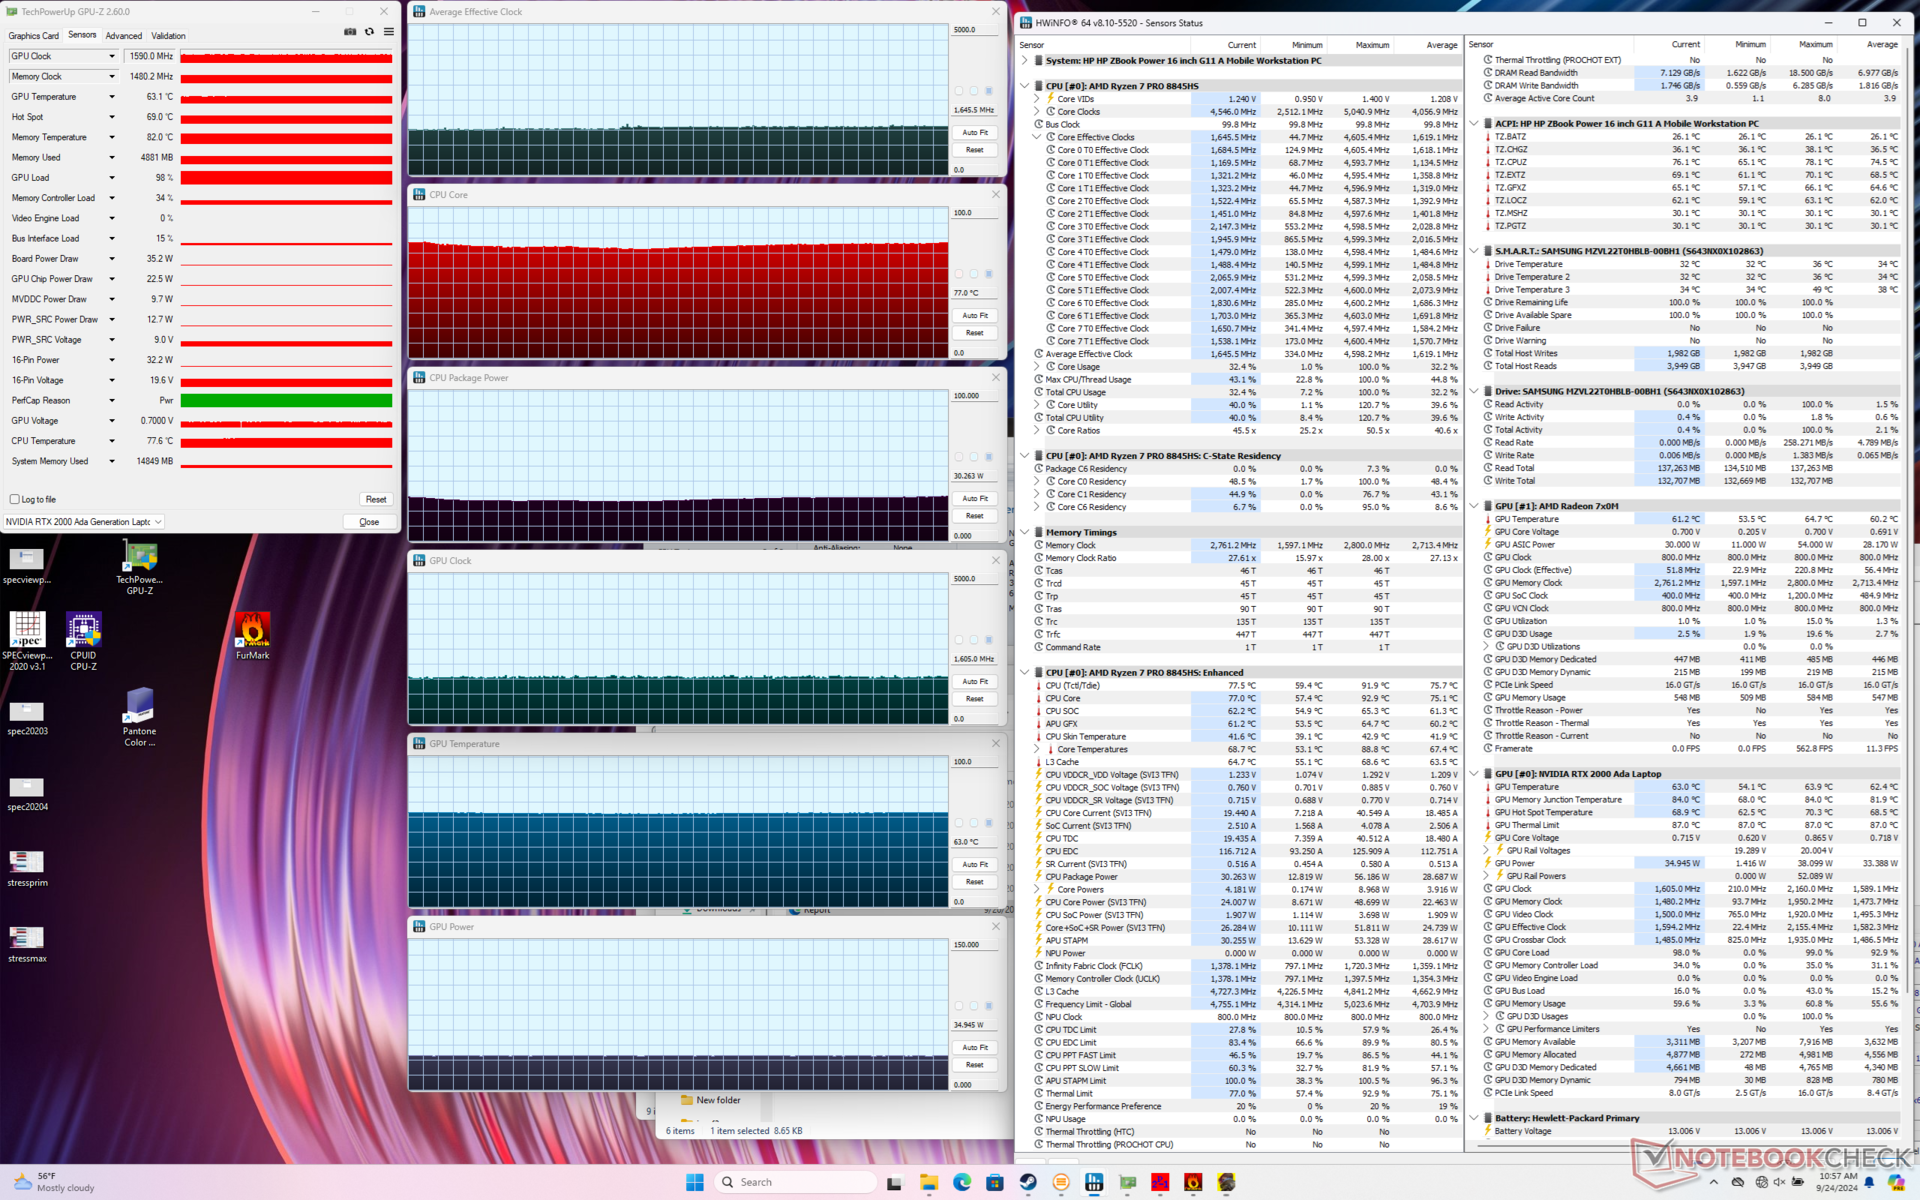
| Gemiddelde CPU-klok (GHz) | GPU-klok (MHz) | Gemiddelde CPU-temperatuur (°C) | Gemiddelde GPU-temperatuur (°C) | |
| Systeem inactief | -- | -- | 47 | 49 |
| Prime95 Stress | 3.9 | -- | 92 | 64 |
| Prime95 + FurMark Stress | 2.8 | 1320 | 66 | 65 |
| Cyberpunk 2077 Stress (evenwichtige modus) | 1.6 | 1425 | 74 | 62 |
| Cyberpunk 2077 Stress (prestatiemodus) | 1.7 | 1590 | 77 | 63 |
Systeemprestaties
De PCMark-resultaten zijn bijna identiek aan die van de ZBook Power 15 G10 van vorig jaar. Dit betekent dat traditionele dagelijkse taken zoals browsen of bewerken niet merkbaar sneller zijn op ons nieuwere model. De RAM prestaties zijn ook niet verbeterd.
We ondervonden een probleem met ontwaken uit slaap waarbij een harde shutdown nodig was om terug te keren naar Windows. We konden het probleem niet betrouwbaar reproduceren, maar het feit dat het zich voordeed op een mobiel werkstation is toch opmerkelijk.

CrossMark: Overall | Productivity | Creativity | Responsiveness
WebXPRT 3: Overall
WebXPRT 4: Overall
Mozilla Kraken 1.1: Total
| PCMark 10 / Score | |
| Dell Precision 5690 | |
| HP ZBook Fury 16 G11 | |
| HP ZBook Power 15 G10 | |
| HP ZBook Power 16 G11 A | |
| Gemiddeld AMD Ryzen 7 8845HS, NVIDIA RTX 2000 Ada Generation Laptop GPU (n=1) | |
| Lenovo ThinkPad P1 Gen 7 21KV001SGE | |
| Lenovo ThinkPad P16s G2 21K9000CGE | |
| PCMark 10 / Essentials | |
| Dell Precision 5690 | |
| HP ZBook Power 15 G10 | |
| HP ZBook Power 16 G11 A | |
| Gemiddeld AMD Ryzen 7 8845HS, NVIDIA RTX 2000 Ada Generation Laptop GPU (n=1) | |
| Lenovo ThinkPad P1 Gen 7 21KV001SGE | |
| Lenovo ThinkPad P16s G2 21K9000CGE | |
| HP ZBook Fury 16 G11 | |
| PCMark 10 / Productivity | |
| Dell Precision 5690 | |
| HP ZBook Power 15 G10 | |
| HP ZBook Power 16 G11 A | |
| Gemiddeld AMD Ryzen 7 8845HS, NVIDIA RTX 2000 Ada Generation Laptop GPU (n=1) | |
| HP ZBook Fury 16 G11 | |
| Lenovo ThinkPad P1 Gen 7 21KV001SGE | |
| Lenovo ThinkPad P16s G2 21K9000CGE | |
| PCMark 10 / Digital Content Creation | |
| HP ZBook Fury 16 G11 | |
| Dell Precision 5690 | |
| Lenovo ThinkPad P1 Gen 7 21KV001SGE | |
| HP ZBook Power 15 G10 | |
| HP ZBook Power 16 G11 A | |
| Gemiddeld AMD Ryzen 7 8845HS, NVIDIA RTX 2000 Ada Generation Laptop GPU (n=1) | |
| Lenovo ThinkPad P16s G2 21K9000CGE | |
| CrossMark / Overall | |
| HP ZBook Fury 16 G11 | |
| Dell Precision 5690 | |
| HP ZBook Power 16 G11 A | |
| Gemiddeld AMD Ryzen 7 8845HS, NVIDIA RTX 2000 Ada Generation Laptop GPU (n=1) | |
| Lenovo ThinkPad P1 Gen 7 21KV001SGE | |
| HP ZBook Power 15 G10 | |
| Lenovo ThinkPad P16s G2 21K9000CGE | |
| CrossMark / Productivity | |
| HP ZBook Fury 16 G11 | |
| Dell Precision 5690 | |
| HP ZBook Power 16 G11 A | |
| Gemiddeld AMD Ryzen 7 8845HS, NVIDIA RTX 2000 Ada Generation Laptop GPU (n=1) | |
| Lenovo ThinkPad P1 Gen 7 21KV001SGE | |
| HP ZBook Power 15 G10 | |
| Lenovo ThinkPad P16s G2 21K9000CGE | |
| CrossMark / Creativity | |
| HP ZBook Fury 16 G11 | |
| HP ZBook Power 16 G11 A | |
| Gemiddeld AMD Ryzen 7 8845HS, NVIDIA RTX 2000 Ada Generation Laptop GPU (n=1) | |
| Dell Precision 5690 | |
| Lenovo ThinkPad P1 Gen 7 21KV001SGE | |
| HP ZBook Power 15 G10 | |
| Lenovo ThinkPad P16s G2 21K9000CGE | |
| CrossMark / Responsiveness | |
| HP ZBook Fury 16 G11 | |
| Dell Precision 5690 | |
| HP ZBook Power 16 G11 A | |
| Gemiddeld AMD Ryzen 7 8845HS, NVIDIA RTX 2000 Ada Generation Laptop GPU (n=1) | |
| Lenovo ThinkPad P1 Gen 7 21KV001SGE | |
| Lenovo ThinkPad P16s G2 21K9000CGE | |
| HP ZBook Power 15 G10 | |
| WebXPRT 3 / Overall | |
| HP ZBook Fury 16 G11 | |
| HP ZBook Power 15 G10 | |
| HP ZBook Power 16 G11 A | |
| Gemiddeld AMD Ryzen 7 8845HS, NVIDIA RTX 2000 Ada Generation Laptop GPU (n=1) | |
| Dell Precision 5690 | |
| Lenovo ThinkPad P1 Gen 7 21KV001SGE | |
| Lenovo ThinkPad P16s G2 21K9000CGE | |
| WebXPRT 4 / Overall | |
| HP ZBook Fury 16 G11 | |
| Dell Precision 5690 | |
| Lenovo ThinkPad P1 Gen 7 21KV001SGE | |
| HP ZBook Power 16 G11 A | |
| Gemiddeld AMD Ryzen 7 8845HS, NVIDIA RTX 2000 Ada Generation Laptop GPU (n=1) | |
| HP ZBook Power 15 G10 | |
| Mozilla Kraken 1.1 / Total | |
| Lenovo ThinkPad P16s G2 21K9000CGE | |
| HP ZBook Power 15 G10 | |
| HP ZBook Power 16 G11 A | |
| Gemiddeld AMD Ryzen 7 8845HS, NVIDIA RTX 2000 Ada Generation Laptop GPU (n=1) | |
| Lenovo ThinkPad P1 Gen 7 21KV001SGE | |
| Dell Precision 5690 | |
| HP ZBook Fury 16 G11 | |
* ... kleiner is beter
| PCMark 10 Score | 7376 punten | |
Help | ||
| AIDA64 / Memory Copy | |
| Dell Precision 5690 | |
| HP ZBook Power 15 G10 | |
| Gemiddeld AMD Ryzen 7 8845HS (61459 - 71873, n=12) | |
| Lenovo ThinkPad P16s G2 21K9000CGE | |
| Lenovo ThinkPad P1 Gen 7 21KV001SGE | |
| HP ZBook Power 16 G11 A | |
| HP ZBook Fury 16 G11 | |
| AIDA64 / Memory Read | |
| Dell Precision 5690 | |
| Lenovo ThinkPad P1 Gen 7 21KV001SGE | |
| HP ZBook Power 15 G10 | |
| HP ZBook Power 16 G11 A | |
| HP ZBook Fury 16 G11 | |
| Gemiddeld AMD Ryzen 7 8845HS (49866 - 61976, n=12) | |
| Lenovo ThinkPad P16s G2 21K9000CGE | |
| AIDA64 / Memory Write | |
| Lenovo ThinkPad P16s G2 21K9000CGE | |
| Gemiddeld AMD Ryzen 7 8845HS (68425 - 93239, n=12) | |
| HP ZBook Power 15 G10 | |
| HP ZBook Power 16 G11 A | |
| Dell Precision 5690 | |
| Lenovo ThinkPad P1 Gen 7 21KV001SGE | |
| HP ZBook Fury 16 G11 | |
| AIDA64 / Memory Latency | |
| Dell Precision 5690 | |
| Lenovo ThinkPad P1 Gen 7 21KV001SGE | |
| Lenovo ThinkPad P16s G2 21K9000CGE | |
| HP ZBook Power 15 G10 | |
| HP ZBook Power 16 G11 A | |
| Gemiddeld AMD Ryzen 7 8845HS (82.5 - 117, n=12) | |
| HP ZBook Fury 16 G11 | |
* ... kleiner is beter
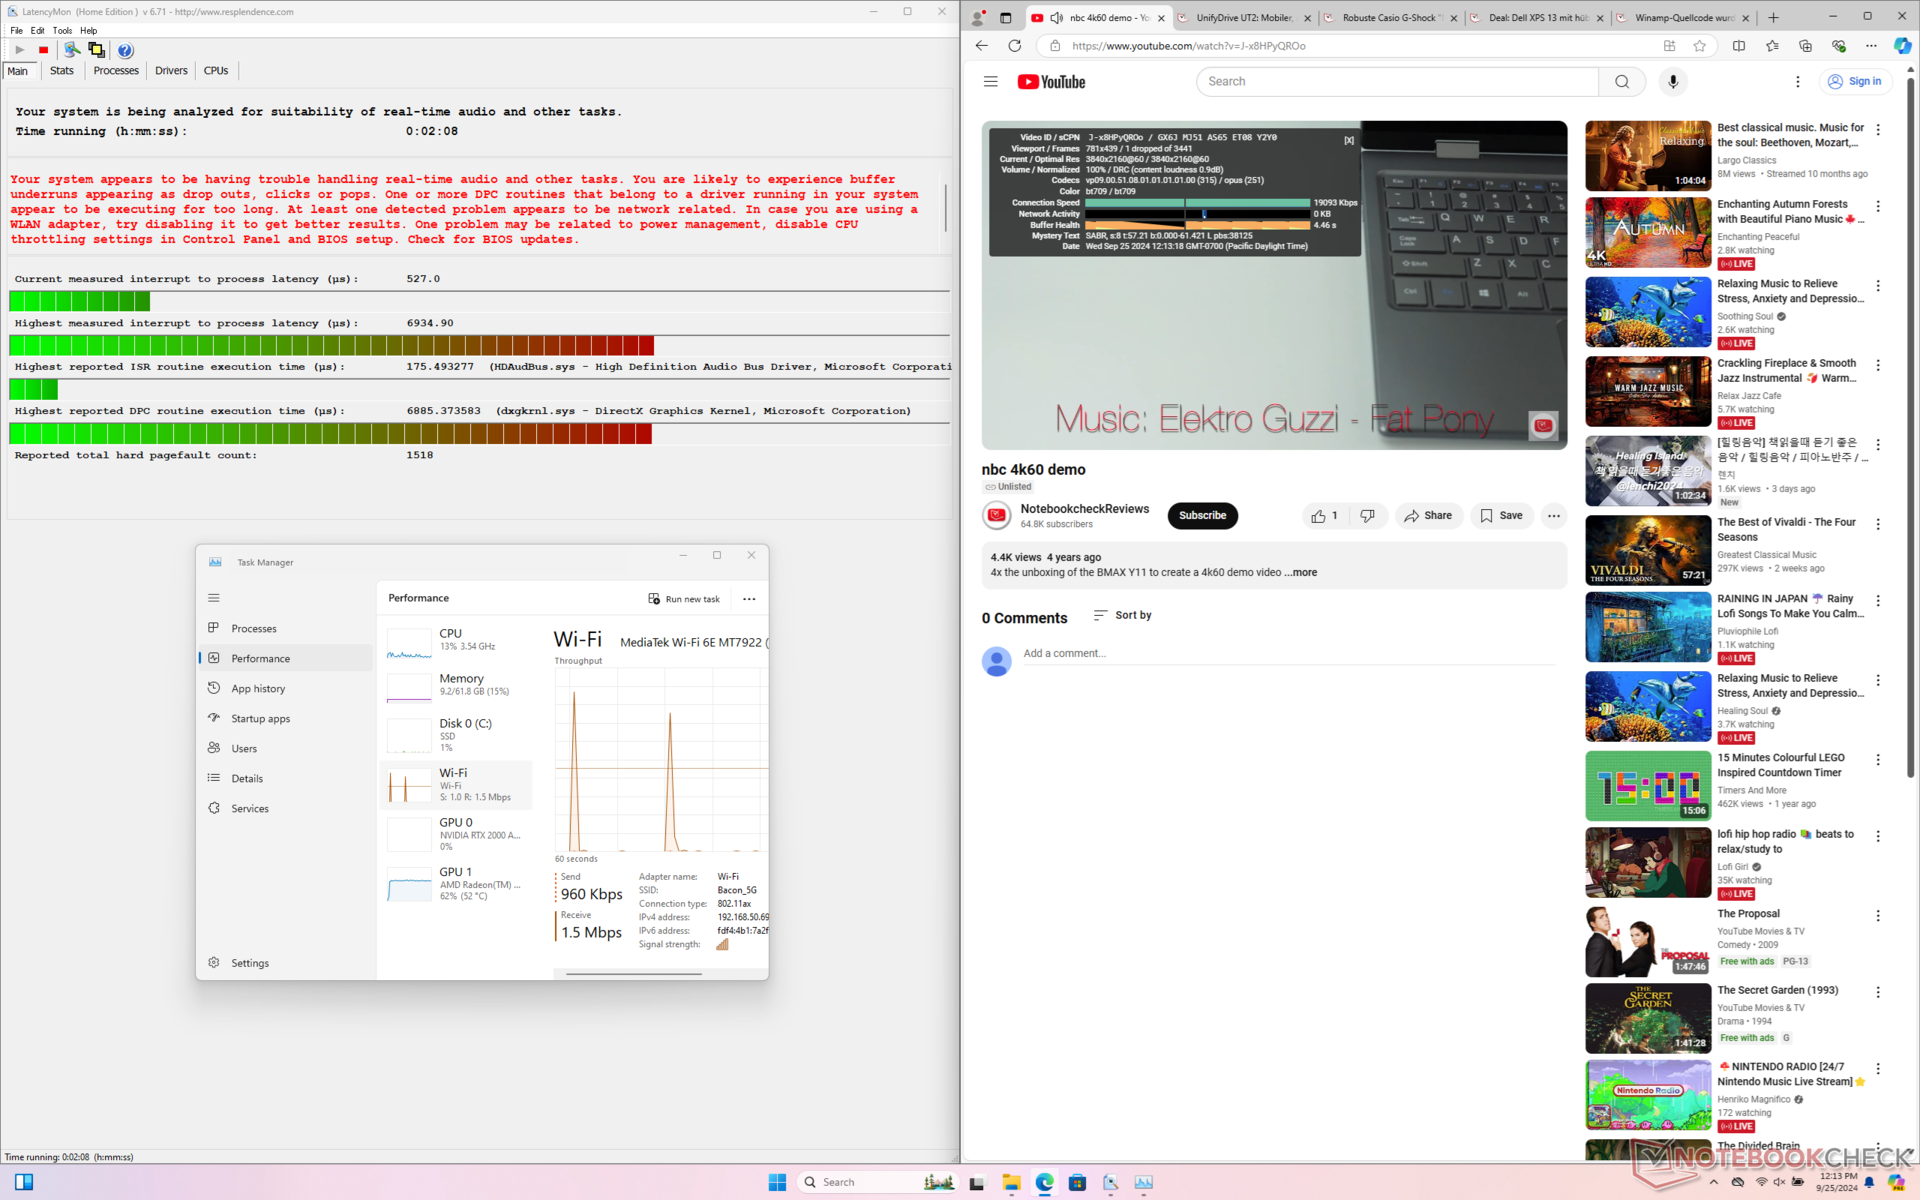
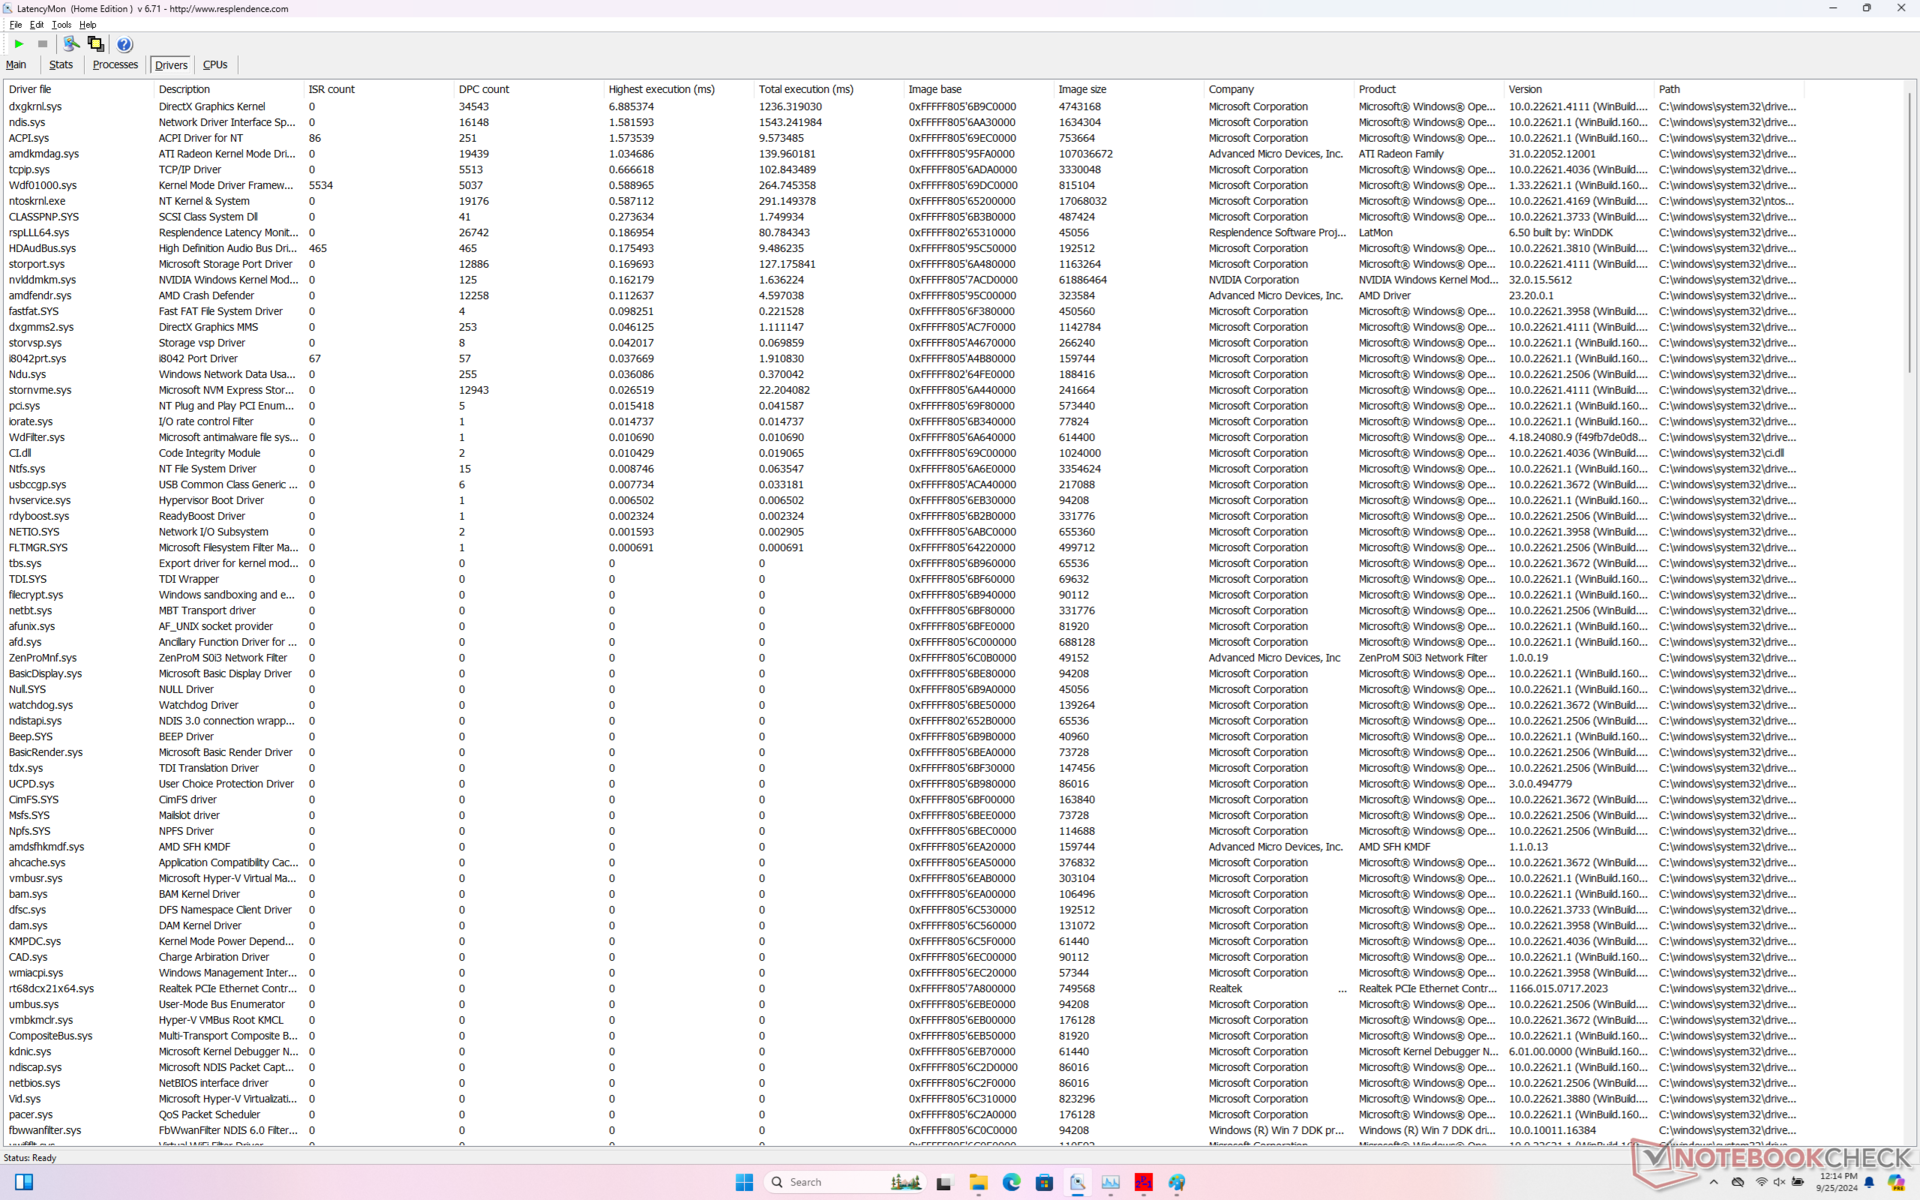
DPC latentie
LatencyMon onthult DPC-problemen met betrekking tot HDAudBus.sys, zelfs na meerdere hertests. het afspelen van 4K-video's met 60 FPS is verder uitstekend, met slechts één uitgevallen frame tijdens een venster van 60 seconden.
| DPC Latencies / LatencyMon - interrupt to process latency (max), Web, Youtube, Prime95 | |
| HP ZBook Fury 16 G11 | |
| HP ZBook Power 16 G11 A | |
| HP ZBook Power 15 G10 | |
| Lenovo ThinkPad P1 Gen 7 21KV001SGE | |
| Lenovo ThinkPad P16s G2 21K9000CGE | |
| Dell Precision 5690 | |
* ... kleiner is beter
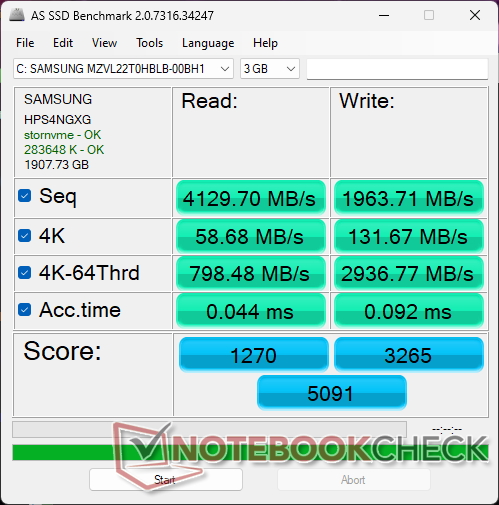
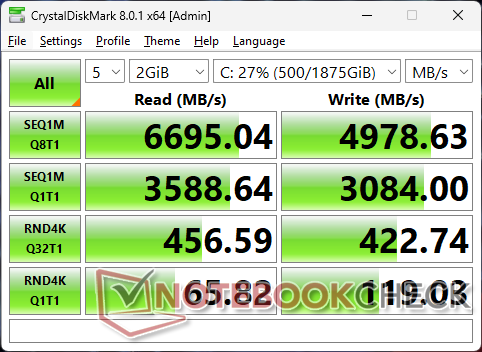
Opslagapparaten
Ons testapparaat wordt geleverd met een 2 TB Samsung PM9A1 PCIe4 x4 NVMe SSD voor sequentiële leessnelheden tot 6700 MB/s. Helaas gaf de schijf na slechts een paar minuten belasting al snel gas terug naar het lage 2000 MB/s-bereik, zoals blijkt uit onze DiskSpd-lus testresultaten hieronder. We hebben de test herhaald en de resultaten werden niet beter. Dit is teleurstellend omdat de WD-schijf in de oudere ZBook Power 15 G10 geen throttling-problemen vertoonde. Een warmtespreider zou de prestaties waarschijnlijk verbeterd hebben.

| Drive Performance Rating - Percent | |
| HP ZBook Fury 16 G11 | |
| Dell Precision 5690 | |
| Lenovo ThinkPad P16s G2 21K9000CGE | |
| HP ZBook Power 15 G10 | |
| HP ZBook Power 16 G11 A | |
| Lenovo ThinkPad P1 Gen 7 21KV001SGE | |
* ... kleiner is beter
Disk Throttling: DiskSpd Read Loop, Queue Depth 8
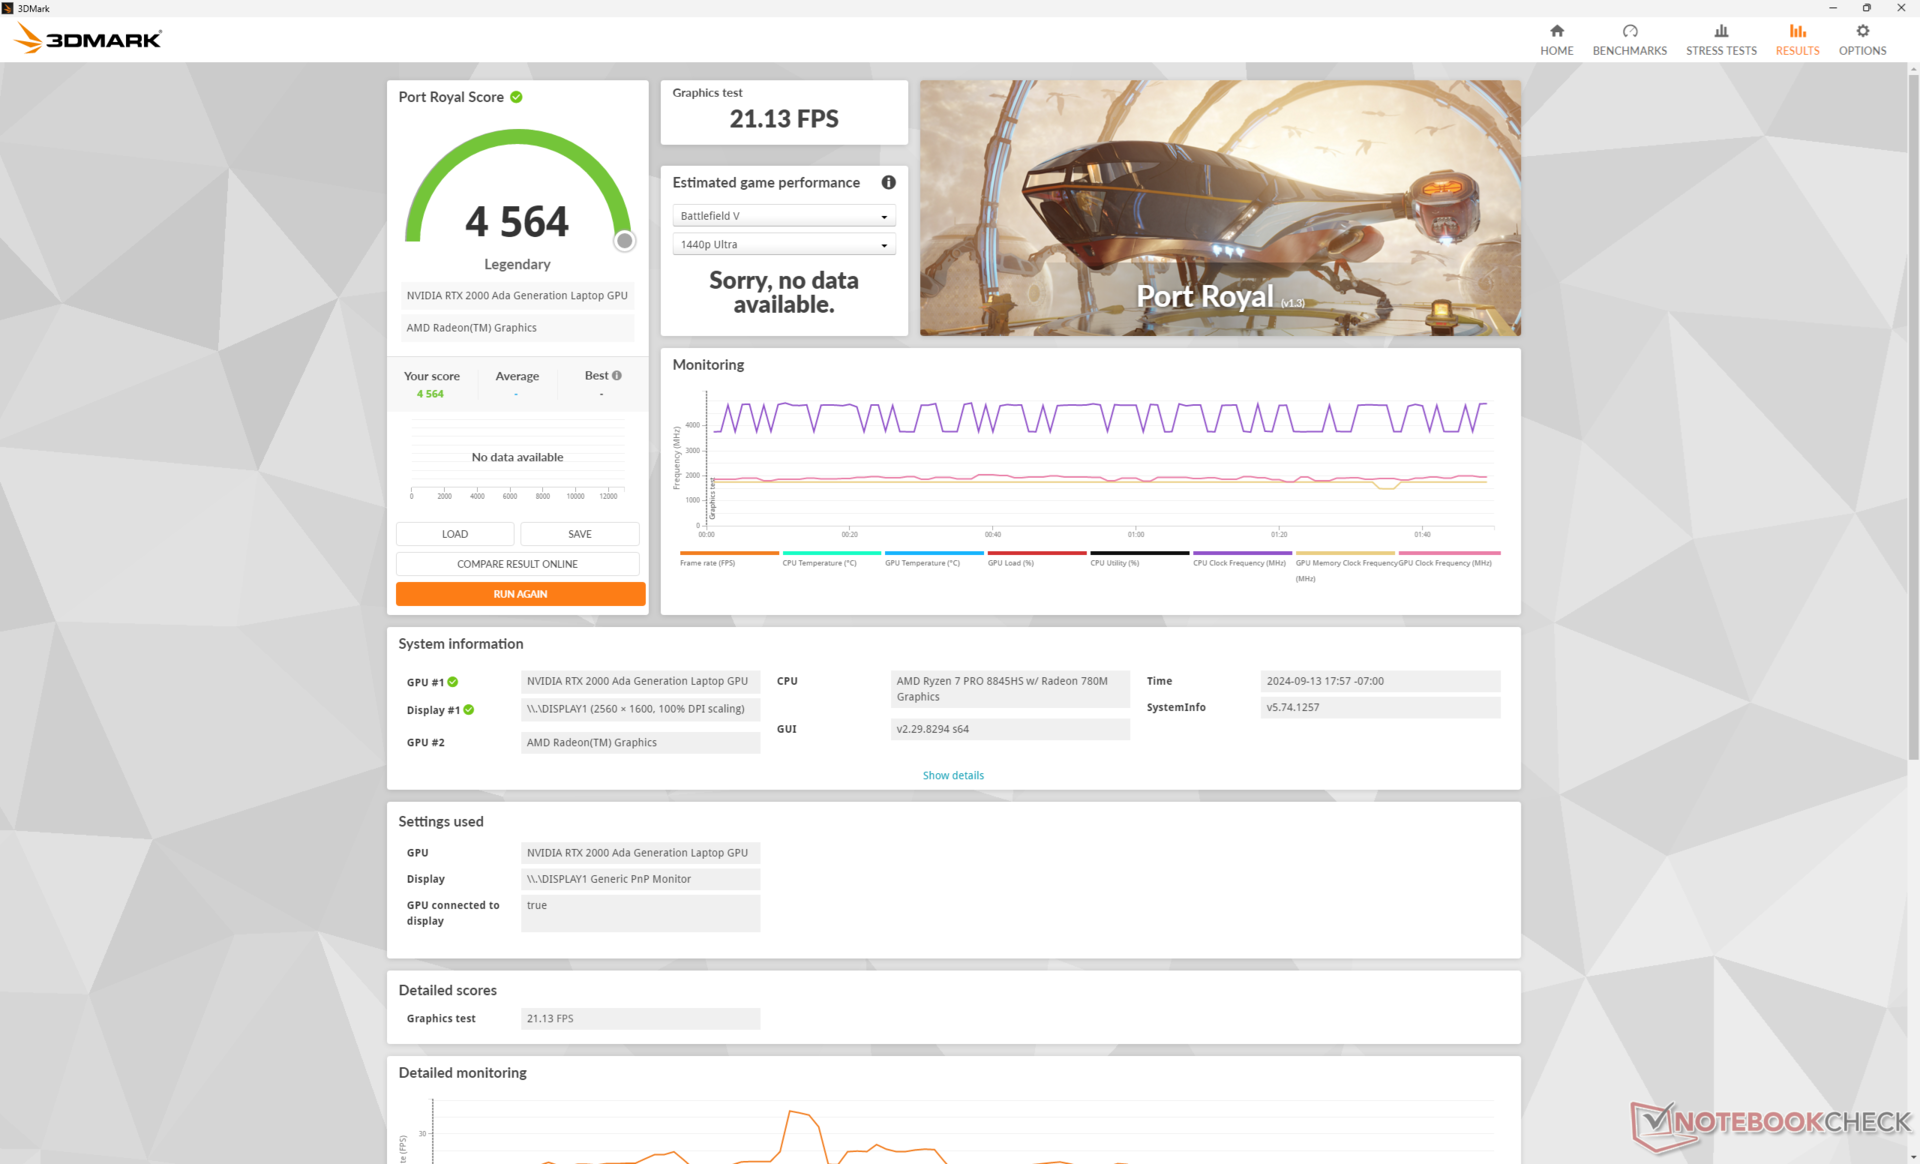
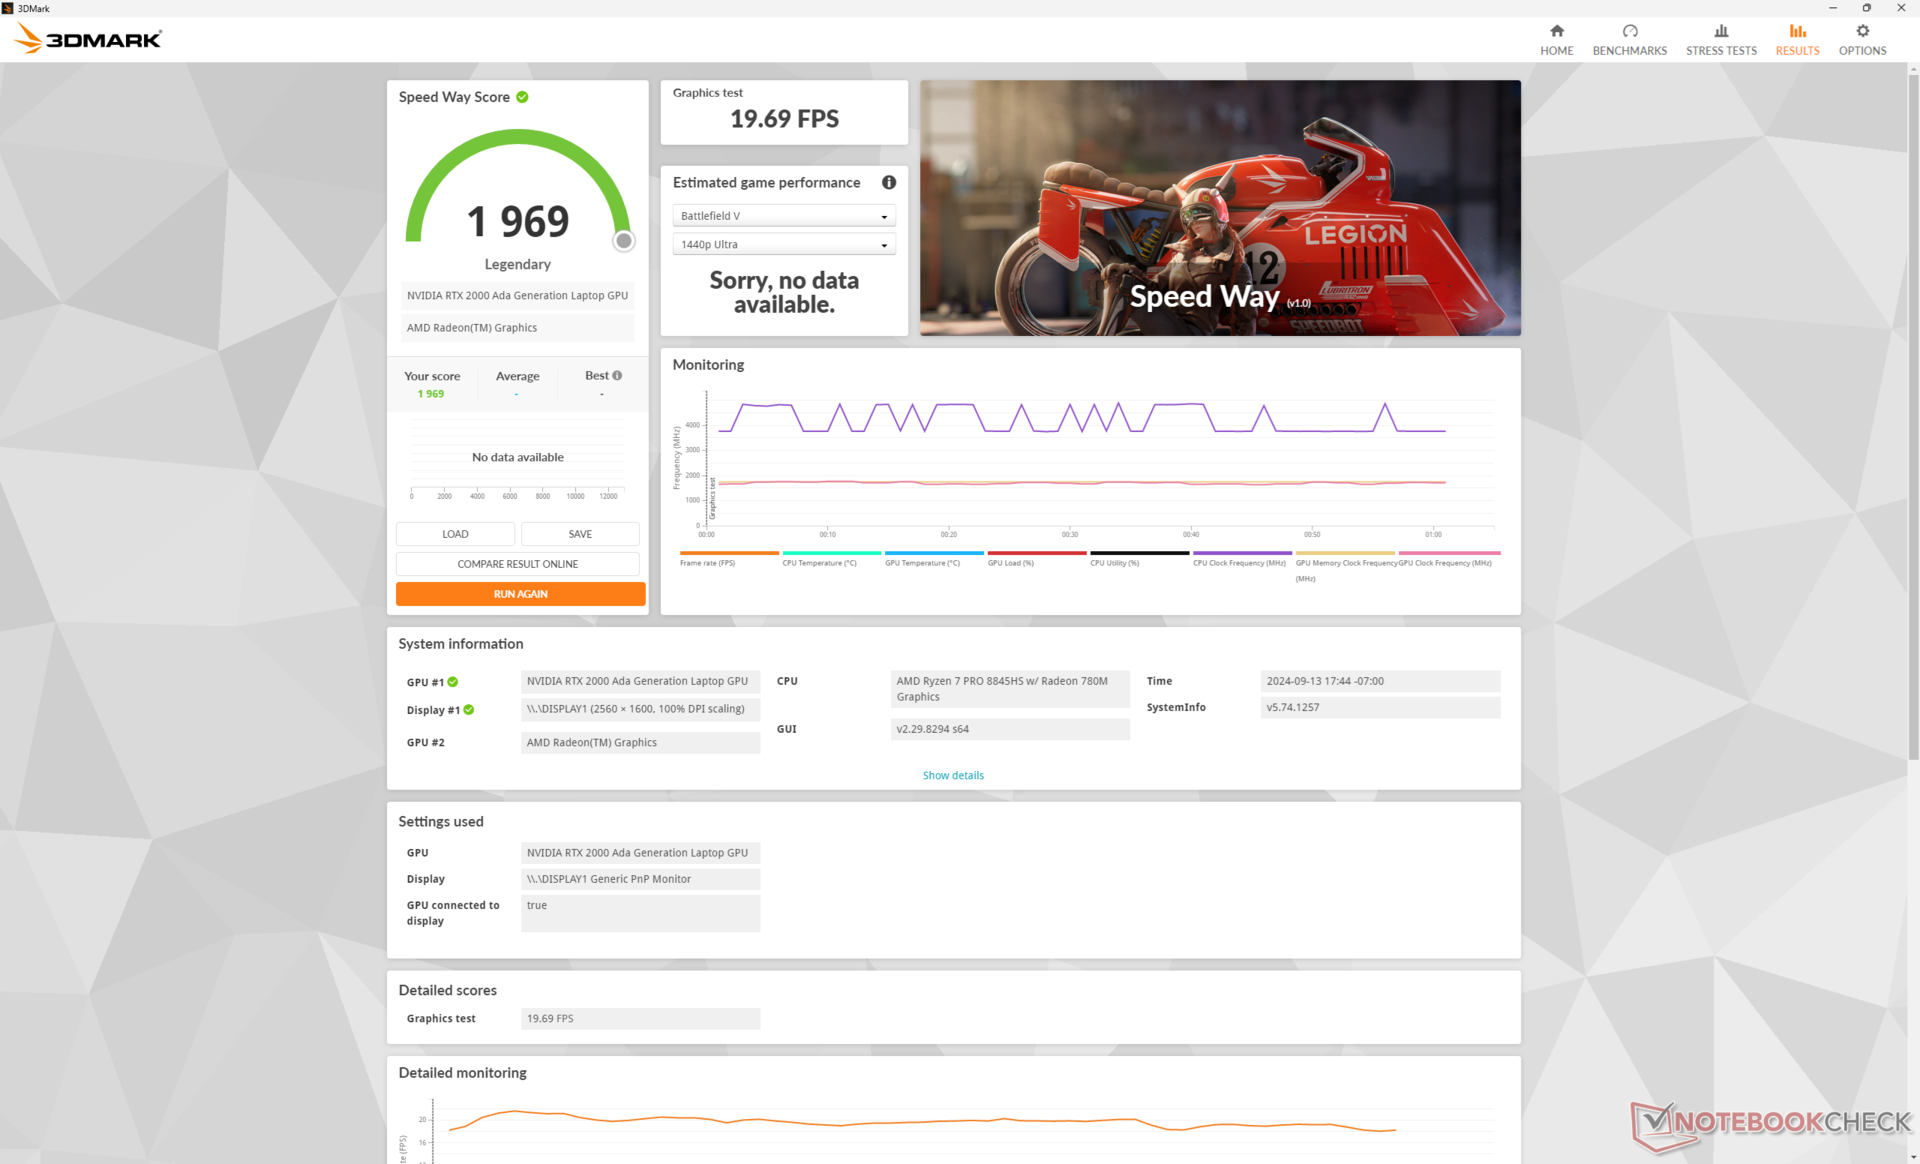
GPU-prestaties
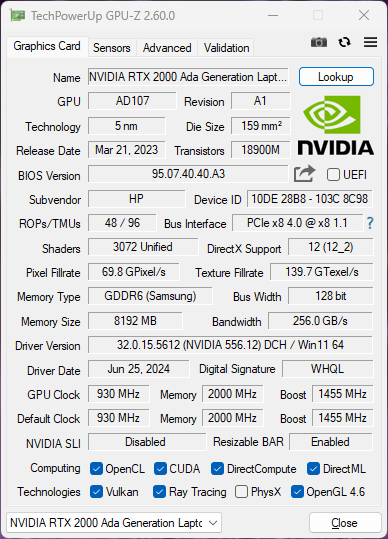
De discrete GPU-opties blijven identiek aan de 15-inch ZBook Power 15 G10, aangezien Nvidia nog geen opvolger heeft gelanceerd voor de mobiele Ada Lovelace-serie. Bovendien is de koeloplossing niet enorm verbeterd tijdens de overgang naar een 16-inch vormfactor, wat betekent dat de ZBook Power 16 G11 nog steeds beperkt is tot hetzelfde 50 W TGP-plafond en RTX 1000 Ada, RTX 2000 Adaen RTX 3000 Ada grafische opties zoals voorheen. Gebruikers zullen de dikkere ZBook Fury 16 serie moeten overwegen voor de RTX Ada opties in het hogere segment.
Upgraden naar de RTX 3000 Ada levert op zijn best een marginale prestatieverbetering op, gebaseerd op onze ervaring met de Dell Precision 5490.
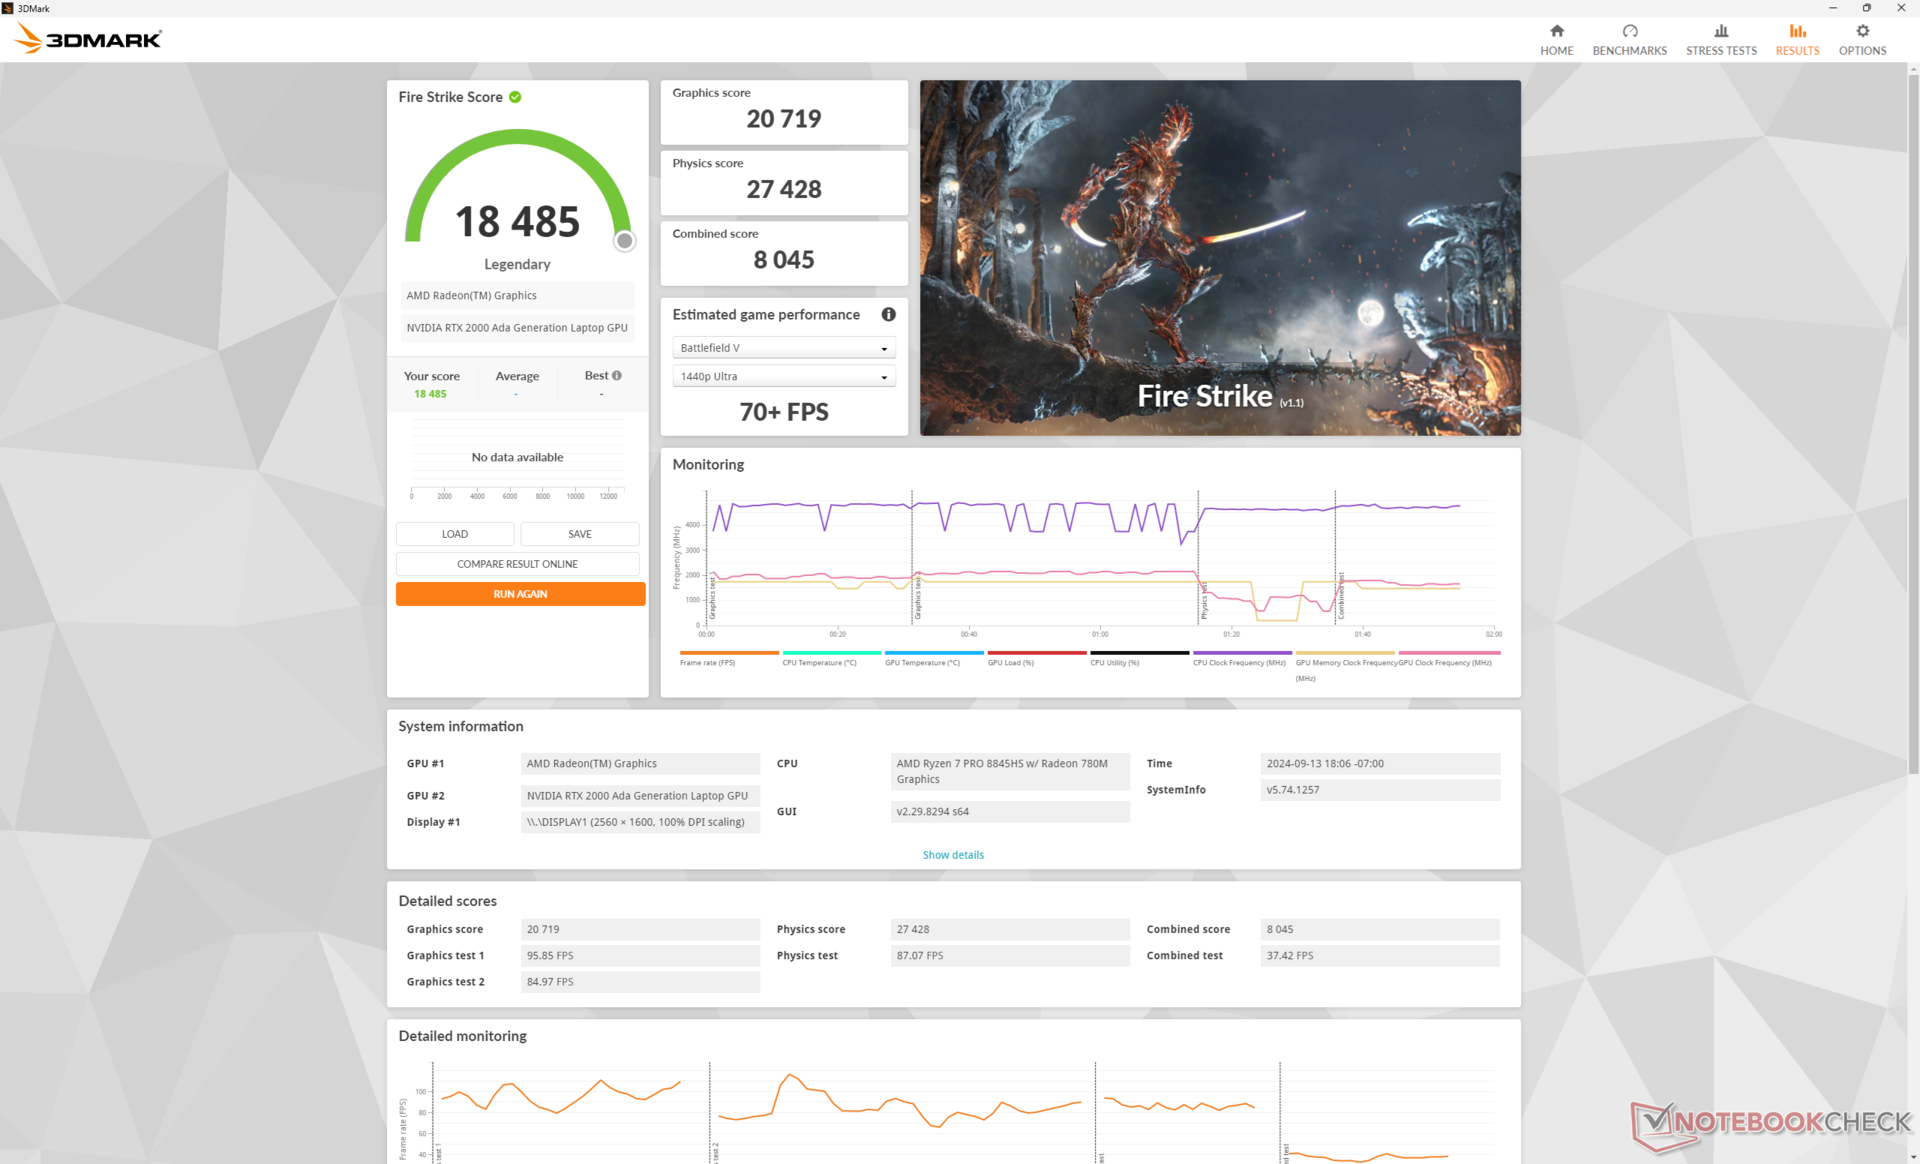
| Vermogen Profiel | Grafische Score | Natuurkunde Score | Gecombineerde Score |
| Prestatiemodus | 20719 | 27428 | 8045 |
| Evenwichtige modus | 19961 (-4%) | 26363 (-4%) | 7633 (-5%) |
| Batterijvermogen | 8108 (-61%) | 6149 (-78%) | 1727 (-79%) |
Het draaien in de modus Gebalanceerd in plaats van de modus Prestaties heeft een kleine invloed op de prestaties, zoals onze bovenstaande tabel met Fire Strike resultaten laat zien. Zowel CPU- als GPU-prestaties zijn echter aanzienlijk minder als u op batterijen draait.
| 3DMark Performance Rating - Percent | |
| Dell Precision 5690 -3! | |
| HP ZBook Fury 16 G11 | |
| HP ZBook Fury 16 G9 -3! | |
| HP ZBook Power 16 G11 A | |
| Gemiddeld NVIDIA RTX 2000 Ada Generation Laptop GPU | |
| Dell Precision 5000 5490 -3! | |
| MSI CreatorPro Z16P B12UKST -19! | |
| HP ZBook Power 15 G10 -11! | |
| Asus ExpertBook B6 Flip B6602FC2 -19! | |
| Lenovo ThinkPad P16v G1 AMD -18! | |
| Lenovo ThinkPad P1 G4-20Y4Z9DVUS -19! | |
| Lenovo ThinkPad P16s G2 21K9000CGE -19! | |
| HP ZBook Firefly 16 G9-6B897EA -19! | |
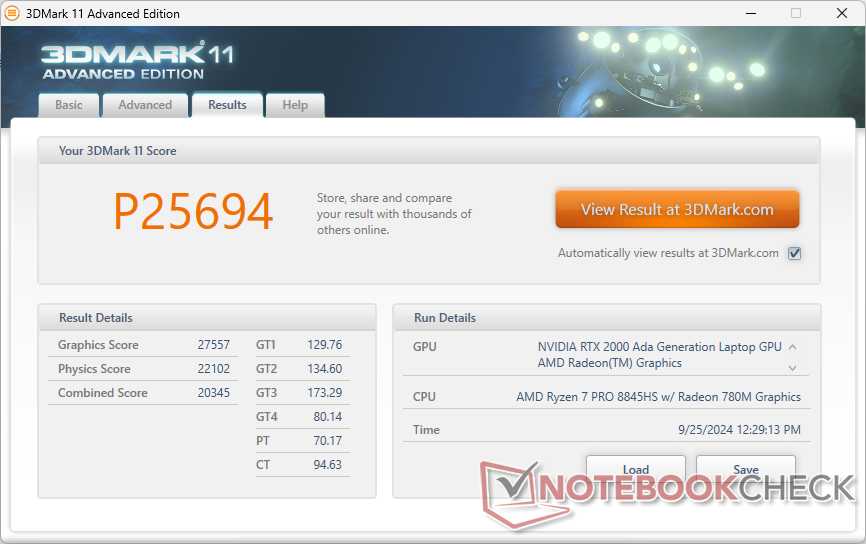
| 3DMark 11 Performance | 25694 punten | |
| 3DMark Cloud Gate Standard Score | 51846 punten | |
| 3DMark Fire Strike Score | 18485 punten | |
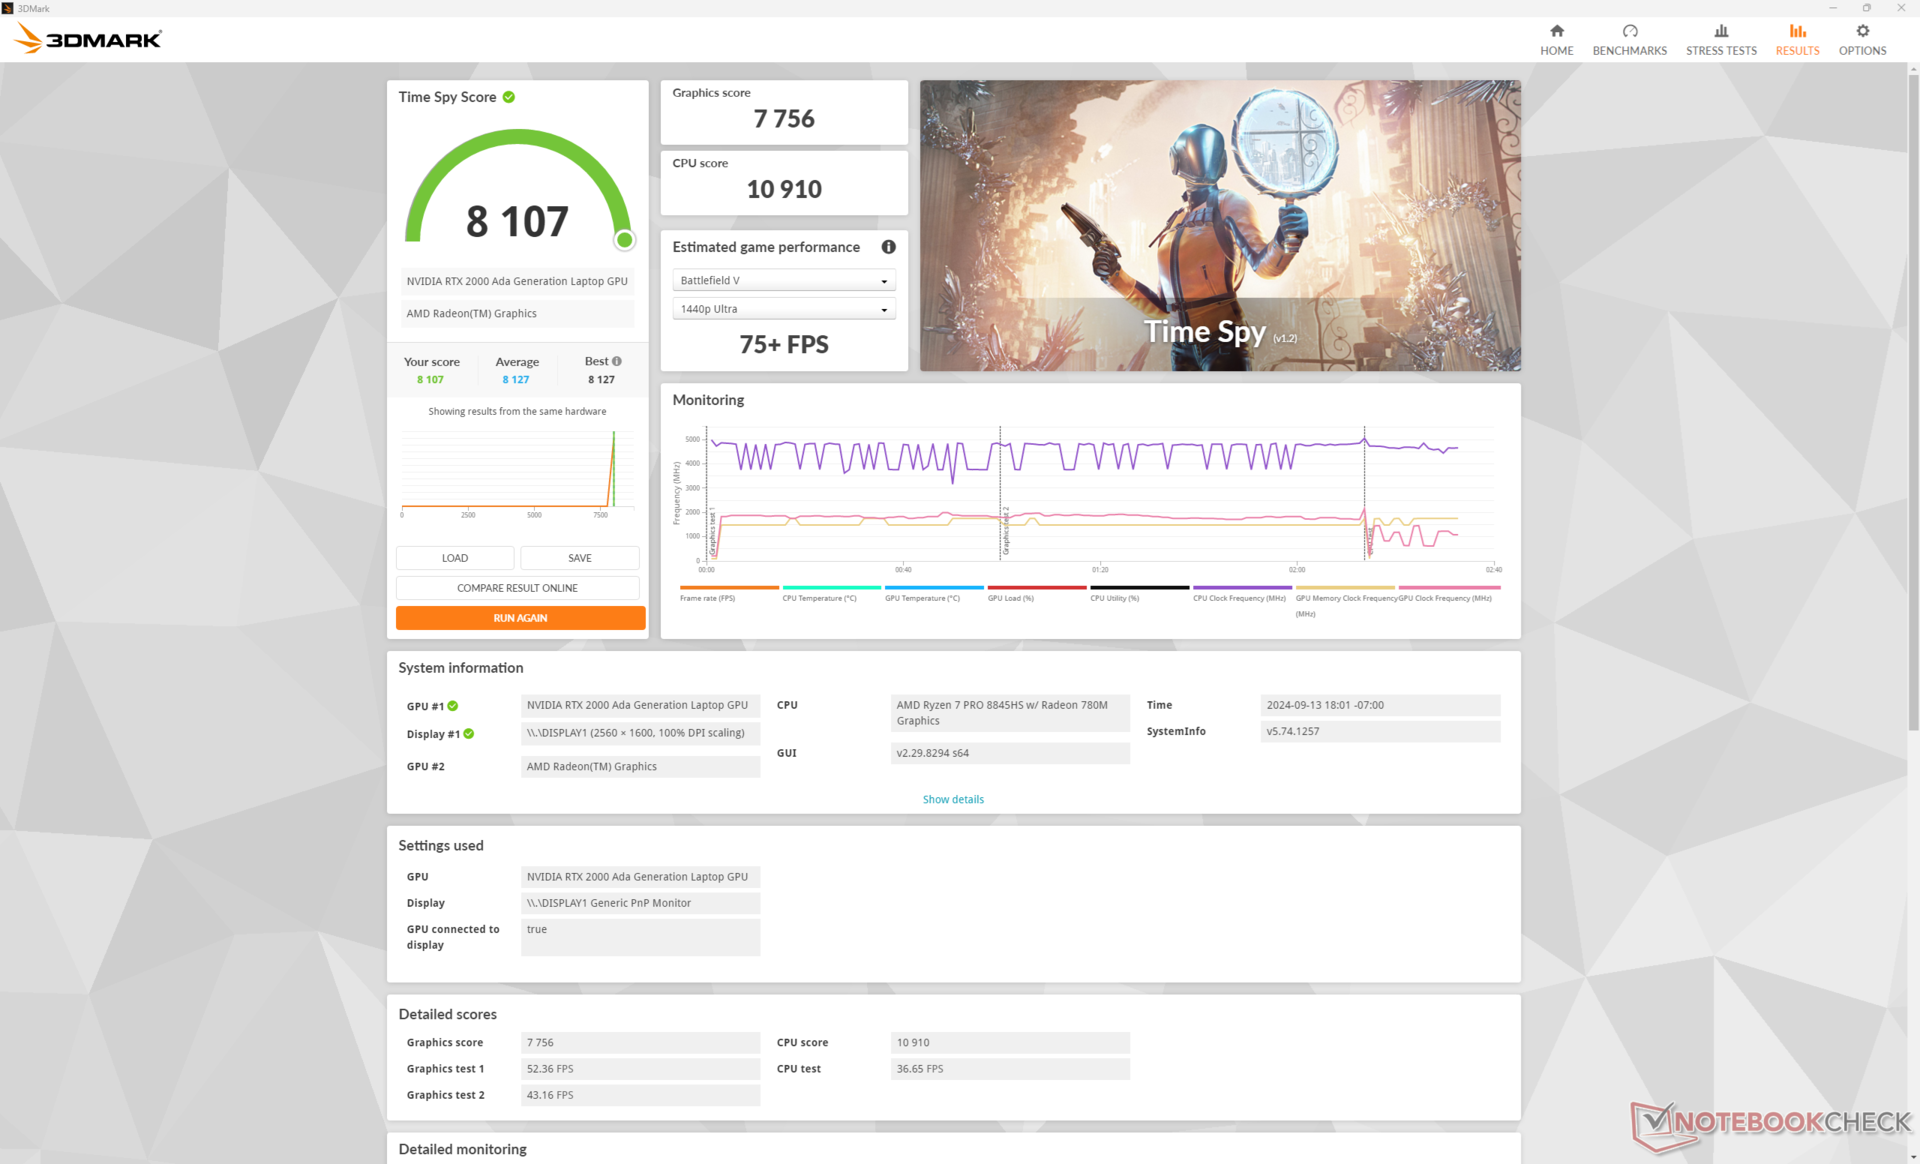
| 3DMark Time Spy Score | 8107 punten | |
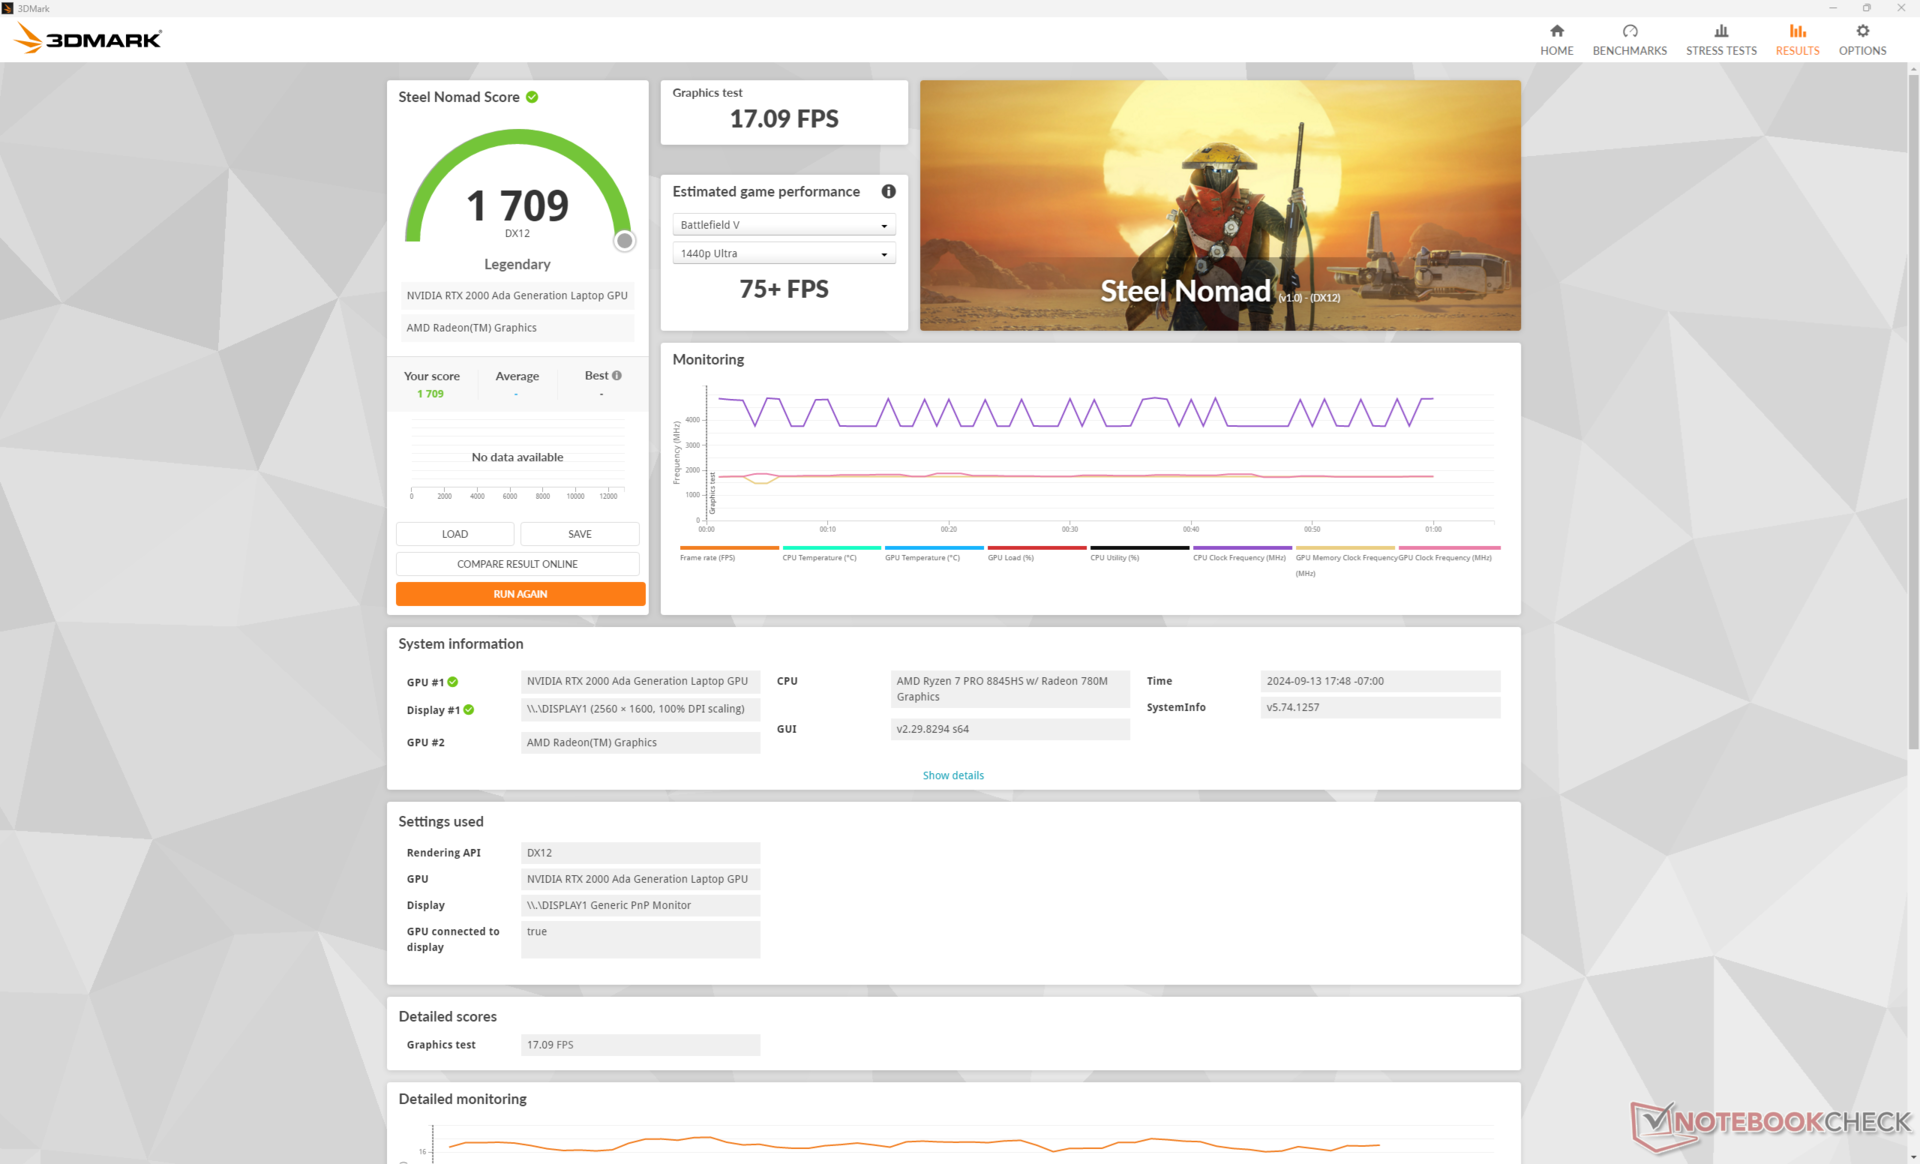
| 3DMark Steel Nomad Score | 1709 punten | |
Help | ||
* ... kleiner is beter
Gaming prestaties
Hoewel niet geoptimaliseerd voor gaming, lijkt de RTX 2000 Ada het meest op laptops die draaien op de GeForce RTX 3060 of RTX 4060.
| Performance Rating - Percent | |
| HP ZBook Fury 16 G11 | |
| Dell Precision 5690 -1! | |
| HP ZBook Fury 16 G9 -1! | |
| MSI CreatorPro Z16P B12UKST | |
| Asus ExpertBook B6 Flip B6602FC2 | |
| Dell Precision 5000 5490 -1! | |
| HP ZBook Power 16 G11 A | |
| HP ZBook Power 15 G10 | |
| Lenovo ThinkPad P1 G4-20Y4Z9DVUS -3! | |
| Lenovo ThinkPad P16v G1 AMD | |
| HP ZBook Firefly 16 G9-6B897EA | |
| Lenovo ThinkPad P16s G2 21K9000CGE | |
| GTA V - 1920x1080 Highest Settings possible AA:4xMSAA + FX AF:16x | |
| HP ZBook Fury 16 G9 | |
| HP ZBook Fury 16 G11 | |
| MSI CreatorPro Z16P B12UKST | |
| HP ZBook Power 16 G11 A | |
| HP ZBook Power 15 G10 | |
| Asus ExpertBook B6 Flip B6602FC2 | |
| Lenovo ThinkPad P16v G1 AMD | |
| HP ZBook Firefly 16 G9-6B897EA | |
| Lenovo ThinkPad P16s G2 21K9000CGE | |
| Final Fantasy XV Benchmark - 1920x1080 High Quality | |
| Dell Precision 5690 | |
| HP ZBook Fury 16 G11 | |
| HP ZBook Fury 16 G9 | |
| Dell Precision 5000 5490 | |
| HP ZBook Power 15 G10 | |
| HP ZBook Power 16 G11 A | |
| MSI CreatorPro Z16P B12UKST | |
| Asus ExpertBook B6 Flip B6602FC2 | |
| Lenovo ThinkPad P16v G1 AMD | |
| Lenovo ThinkPad P1 G4-20Y4Z9DVUS | |
| Lenovo ThinkPad P16s G2 21K9000CGE | |
| HP ZBook Firefly 16 G9-6B897EA | |
| Dota 2 Reborn - 1920x1080 ultra (3/3) best looking | |
| HP ZBook Fury 16 G11 | |
| HP ZBook Fury 16 G9 | |
| MSI CreatorPro Z16P B12UKST | |
| Asus ExpertBook B6 Flip B6602FC2 | |
| Dell Precision 5690 | |
| HP ZBook Power 15 G10 | |
| Dell Precision 5000 5490 | |
| HP ZBook Power 16 G11 A | |
| Lenovo ThinkPad P16v G1 AMD | |
| Lenovo ThinkPad P1 G4-20Y4Z9DVUS | |
| HP ZBook Firefly 16 G9-6B897EA | |
| Lenovo ThinkPad P16s G2 21K9000CGE | |
Cyberpunk 2077 ultra FPS Chart
| lage | gem. | hoge | ultra | QHD | |
|---|---|---|---|---|---|
| GTA V (2015) | 180.6 | 162.7 | 90.3 | 63.4 | |
| Dota 2 Reborn (2015) | 145.2 | 142 | 126.1 | 119.9 | |
| Final Fantasy XV Benchmark (2018) | 166.1 | 89.3 | 66.3 | 49.4 | |
| X-Plane 11.11 (2018) | 83.2 | 72.1 | 60.6 | ||
| Far Cry 5 (2018) | 138 | 111 | 104 | 98 | 67 |
| Strange Brigade (2018) | 329 | 187.8 | 158.1 | 138.5 | 99.5 |
| Tiny Tina's Wonderlands (2022) | 139.1 | 115.1 | 80 | 64.4 | 46.3 |
| F1 22 (2022) | 186.6 | 171.1 | 129.1 | 46.2 | 29.8 |
| Baldur's Gate 3 (2023) | 87.1 | 75.7 | 67.6 | 66.1 | 45.6 |
| Cyberpunk 2077 2.2 Phantom Liberty (2023) | 81.1 | 61.4 | 51.7 | 44.8 | 29.7 |
Uitstoot
Systeemgeluid
De geluidsniveaus en het gedrag van de ventilator zijn vergelijkbaar met wat we hebben waargenomen bij het model van vorig jaar. Het systeem blijft stil met slechts 25,4 dB(A), zelfs na het uitvoeren van de eerste benchmarkscène van 3DMark 06, wat veel stiller is dan concurrerende modellen zoals de ThinkPad P16s G2 of Precision 5690 onder vergelijkbare omstandigheden.
Houd er rekening mee dat het ventilatorgeluid merkbaar stiller is in de gebalanceerde modus; het uitvoeren van Cyberpunk 2077 in de Performance-modus kan tot 43 dB(A) luid zijn, vergeleken met slechts 37,5 dB(A) in de gebalanceerde modus.
Geluidsniveau
| Onbelast |
| 23.8 / 24.2 / 24.2 dB (A) |
| Belasting |
| 25.4 / 45 dB (A) |
 | ||
30 dB stil 40 dB(A) hoorbaar 50 dB(A) luid |
||
min: | ||
| HP ZBook Power 16 G11 A NVIDIA RTX 2000 Ada Generation Laptop GPU, R7 8845HS, Samsung PM9A1 MZVL22T0HBLB | HP ZBook Power 15 G10 NVIDIA RTX 2000 Ada Generation Laptop GPU, R7 PRO 7840HS, WDC PC SN810 2TB | HP ZBook Fury 16 G11 NVIDIA RTX 3500 Ada Generation Laptop GPU, i9-14900HX, SK hynix PC801 HFS001TEJ9X101N | Lenovo ThinkPad P1 Gen 7 21KV001SGE NVIDIA GeForce RTX 4060 Laptop GPU, Ultra 7 155H, Kioxia XG8 KXG8AZNV1T02 | Lenovo ThinkPad P16s G2 21K9000CGE Radeon 780M, R7 PRO 7840U, SK hynix PC801 HFS001TEJ9X162N | Dell Precision 5690 NVIDIA RTX 5000 Ada Generation Laptop GPU, Ultra 9 185H, 2x Samsung PM9A1 1TB (RAID 0) | |
|---|---|---|---|---|---|---|
| Noise | -3% | -15% | -18% | -3% | -17% | |
| uit / omgeving * | 23.5 | 24.2 -3% | 23.2 1% | 24.7 -5% | 22.6 4% | 23.4 -0% |
| Idle Minimum * | 23.8 | 24.4 -3% | 23.2 3% | 24.7 -4% | 22.6 5% | 23.6 1% |
| Idle Average * | 24.2 | 24.4 -1% | 23.2 4% | 24.7 -2% | 22.6 7% | 24.9 -3% |
| Idle Maximum * | 24.2 | 24.4 -1% | 29.5 -22% | 24.7 -2% | 22.6 7% | 30.9 -28% |
| Load Average * | 25.4 | 27.4 -8% | 43 -69% | 43.7 -72% | 37.8 -49% | 40.4 -59% |
| Cyberpunk 2077 ultra * | 43 | 48.2 -12% | 53.2 -24% | |||
| Load Maximum * | 45 | 46.8 -4% | 48.2 -7% | 53.3 -18% | 40.5 10% | 51.9 -15% |
| Witcher 3 ultra * | 43.3 | 40.3 | 48.3 |
* ... kleiner is beter
Temperatuur
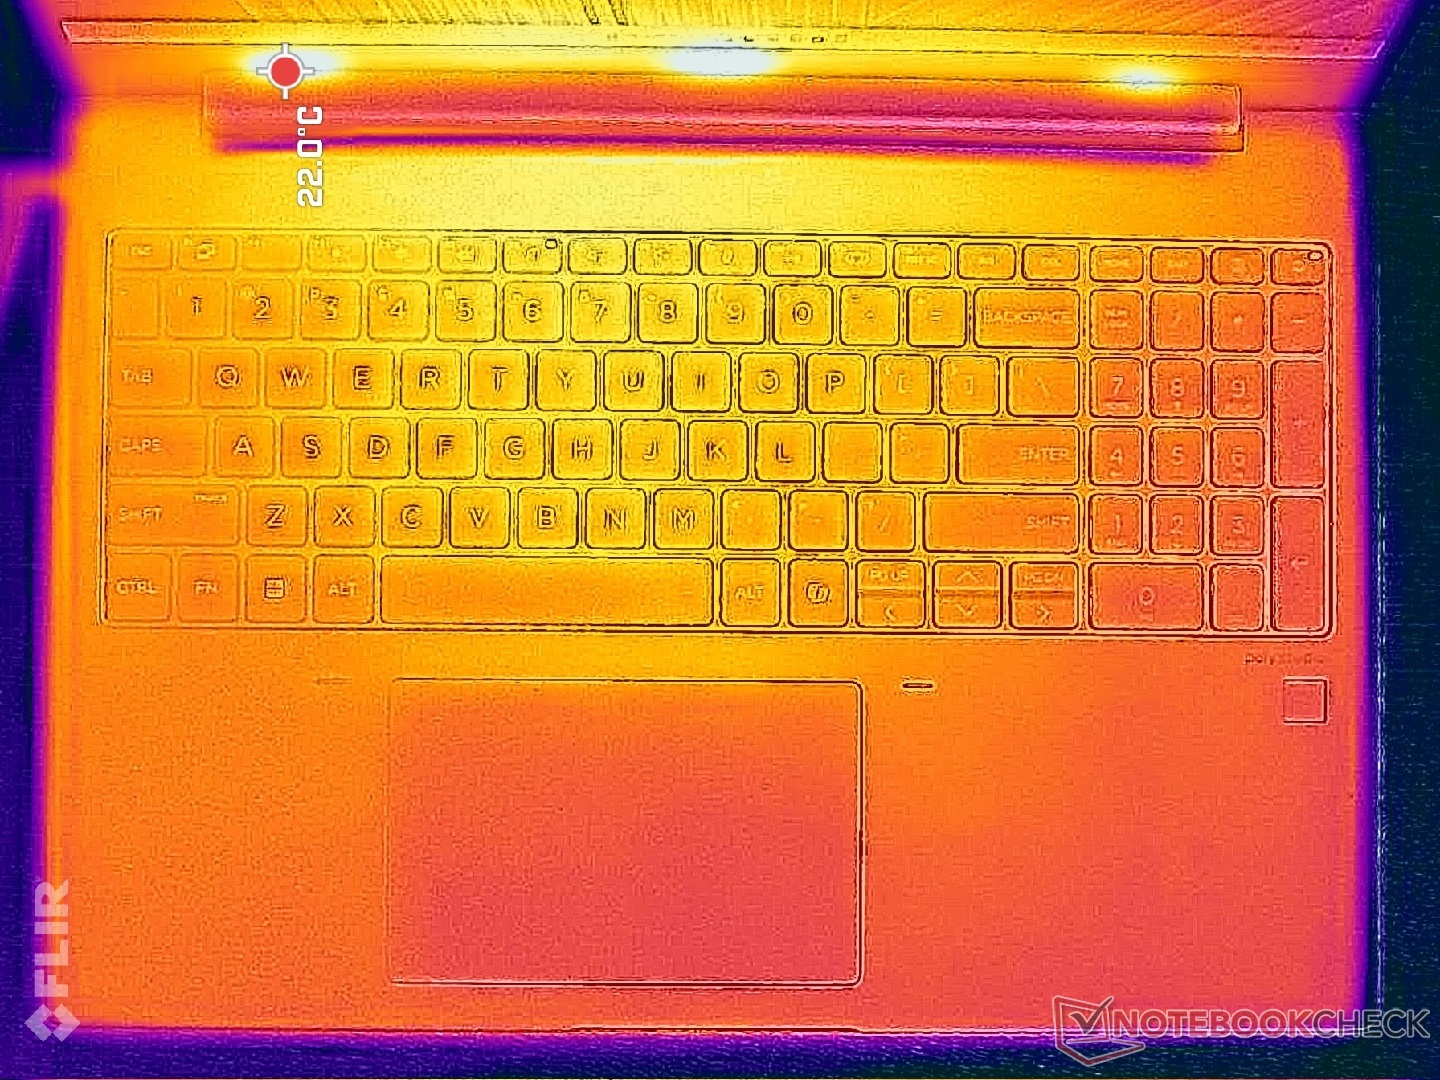
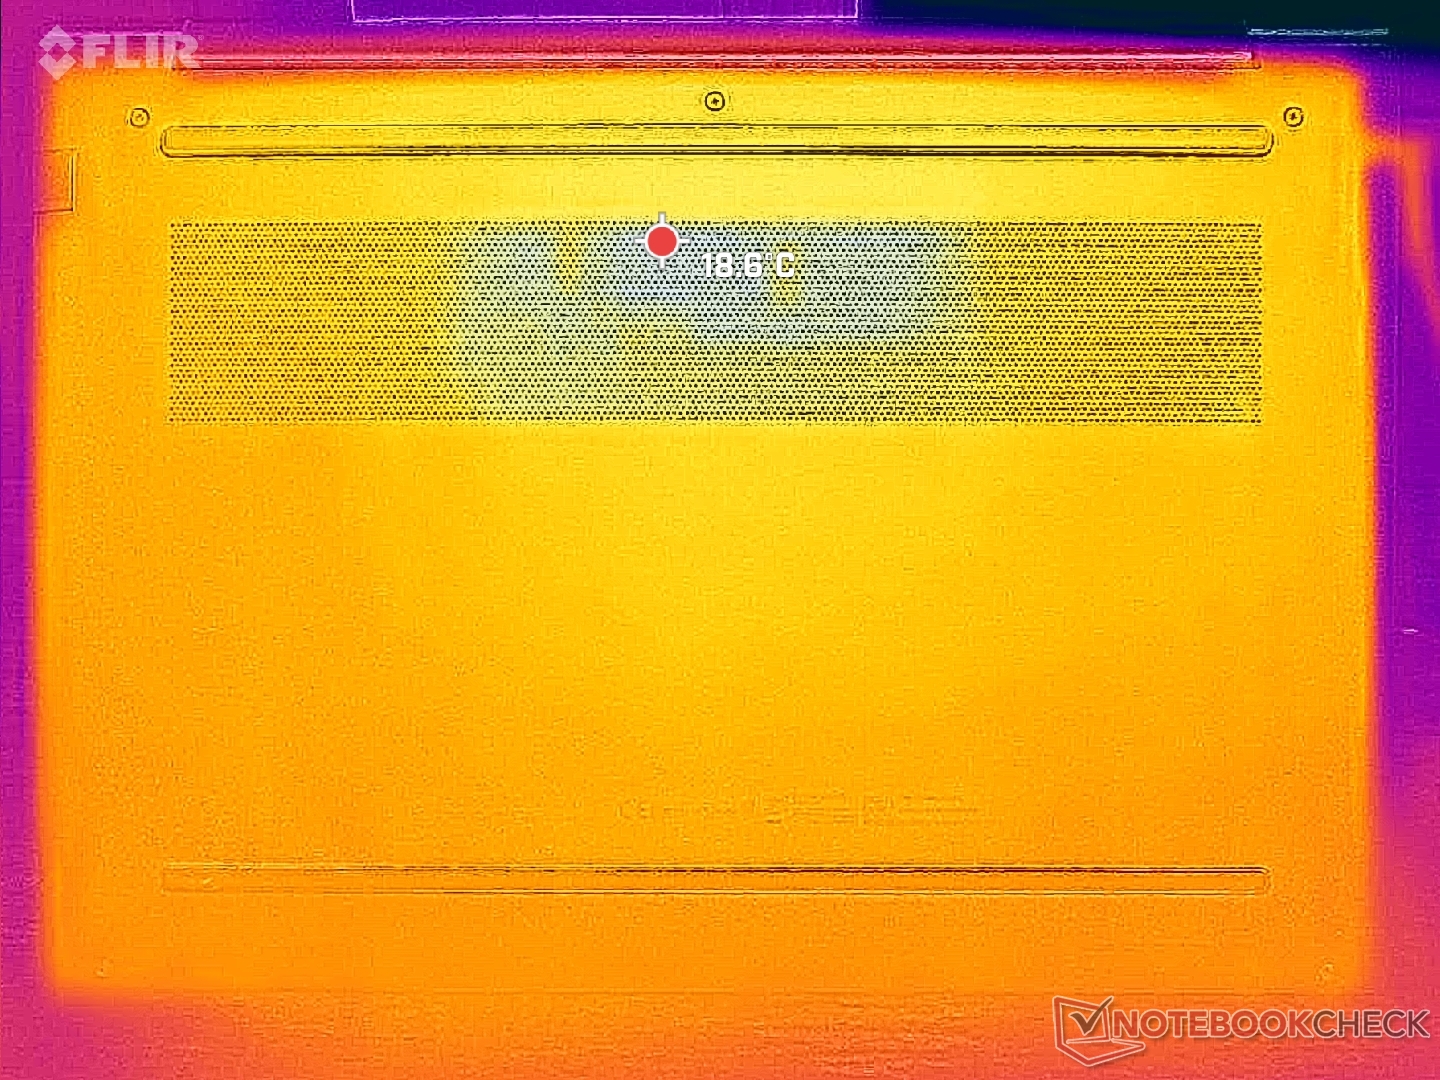
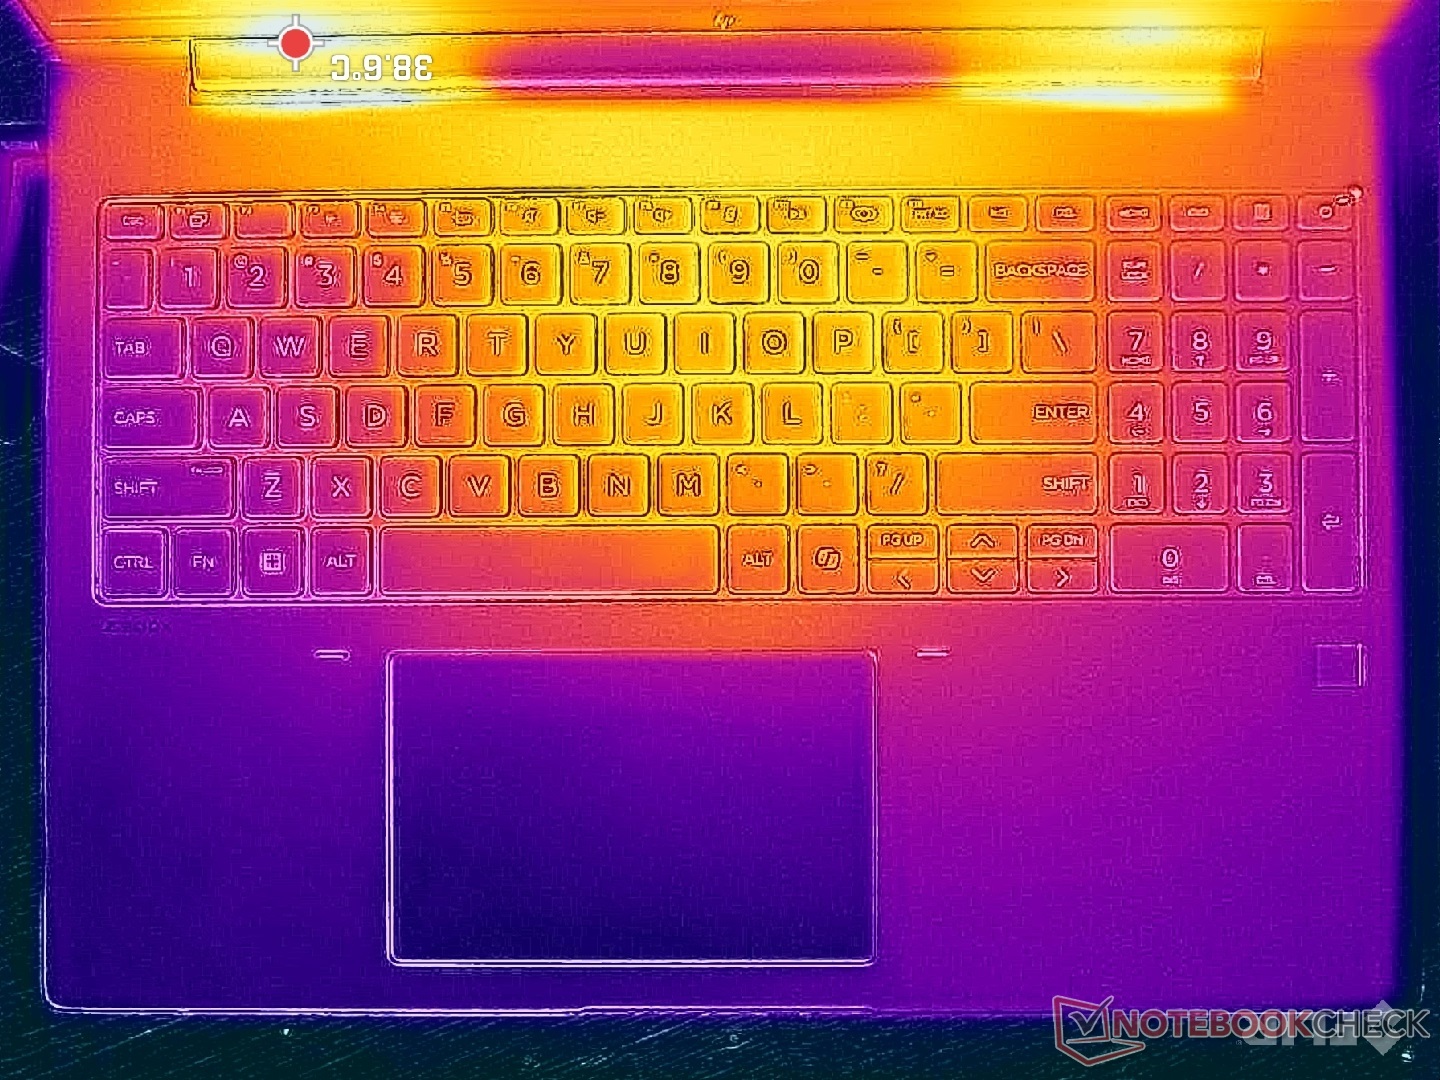
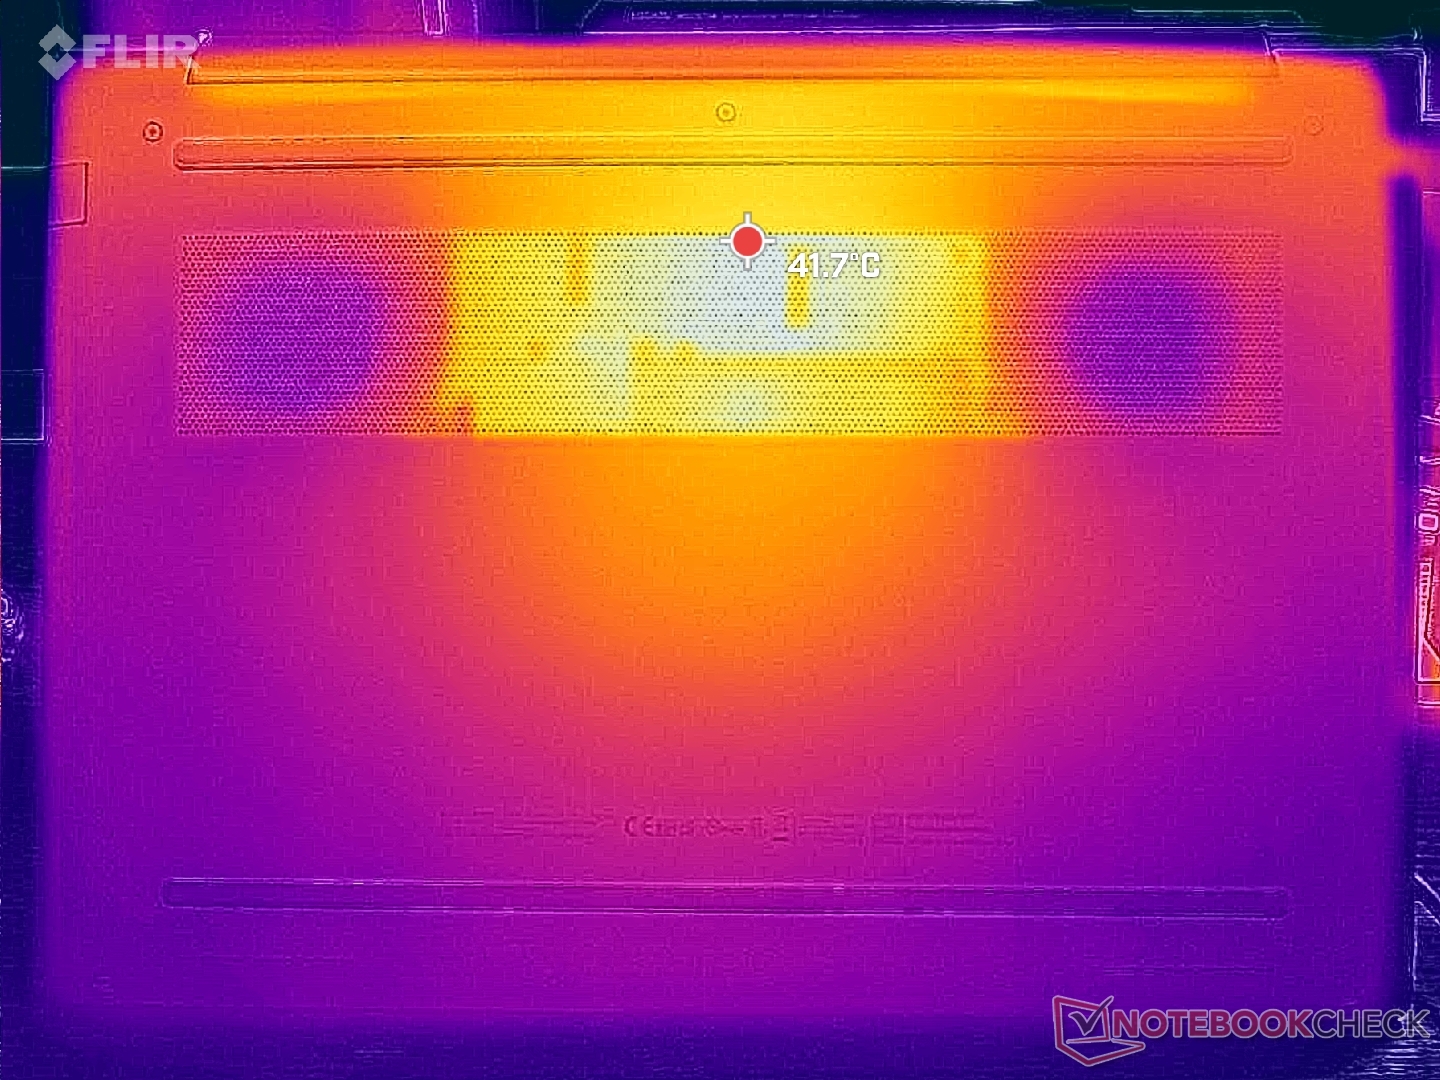
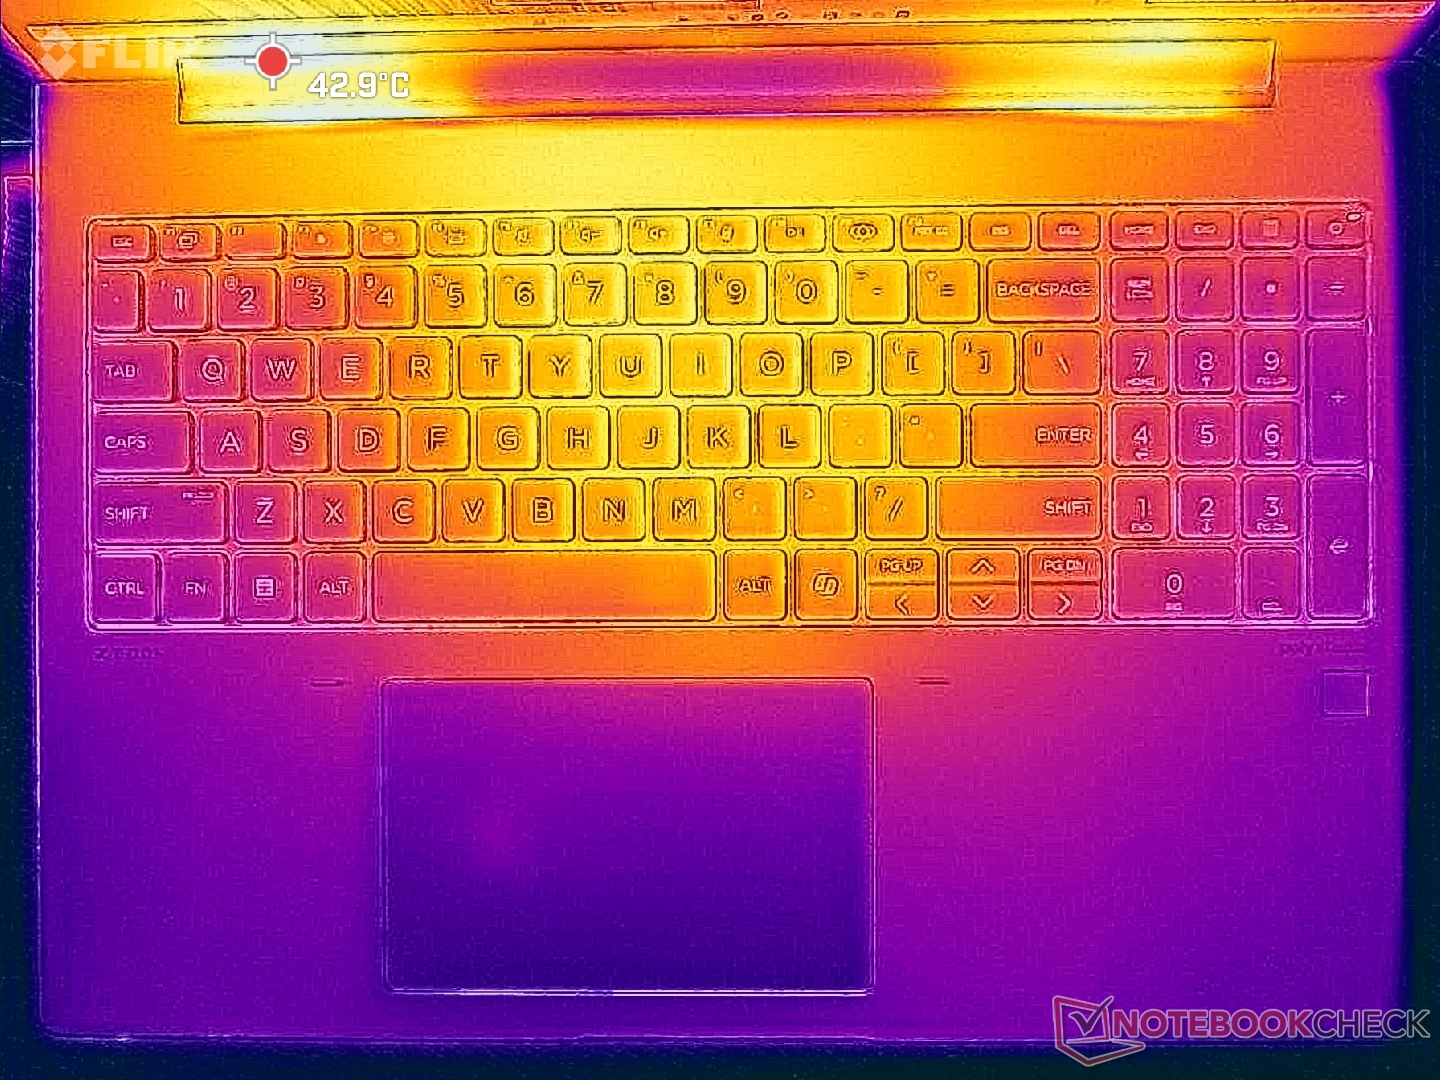
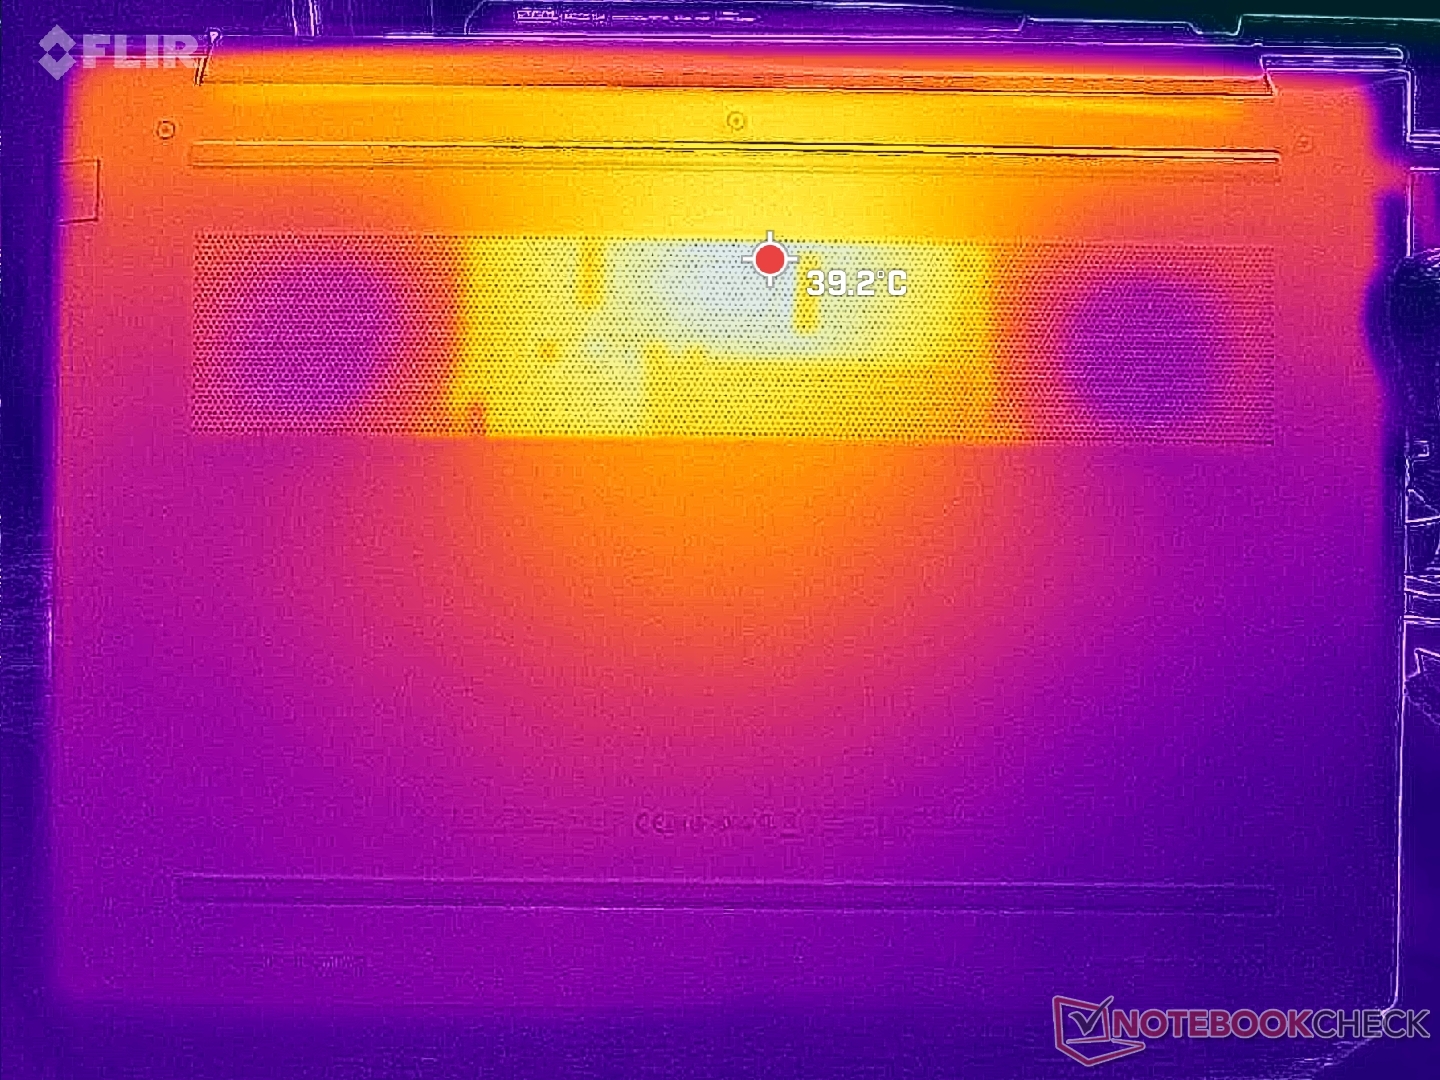
De oppervlaktetemperaturen zijn over het algemeen koeler op onze nieuwe 16-inch vormfactor, vooral met betrekking tot de onderkant. Hete plekken aan de onderkant bereiken slechts 41 C bij zware belasting, vergeleken met 48 C op de oudere ZBook Power 15 G10. De hotspot op het toetsenbord in het midden bereikt ook 41 C, terwijl de palmsteunen en zijkanten koeler en comfortabeler blijven voor handpalmen en vingers.
In vergelijking met de krachtigere Precision 5690is het Dell apparaat nog warmer op het toetsenbord, terwijl het koeler is aan de onderkant.
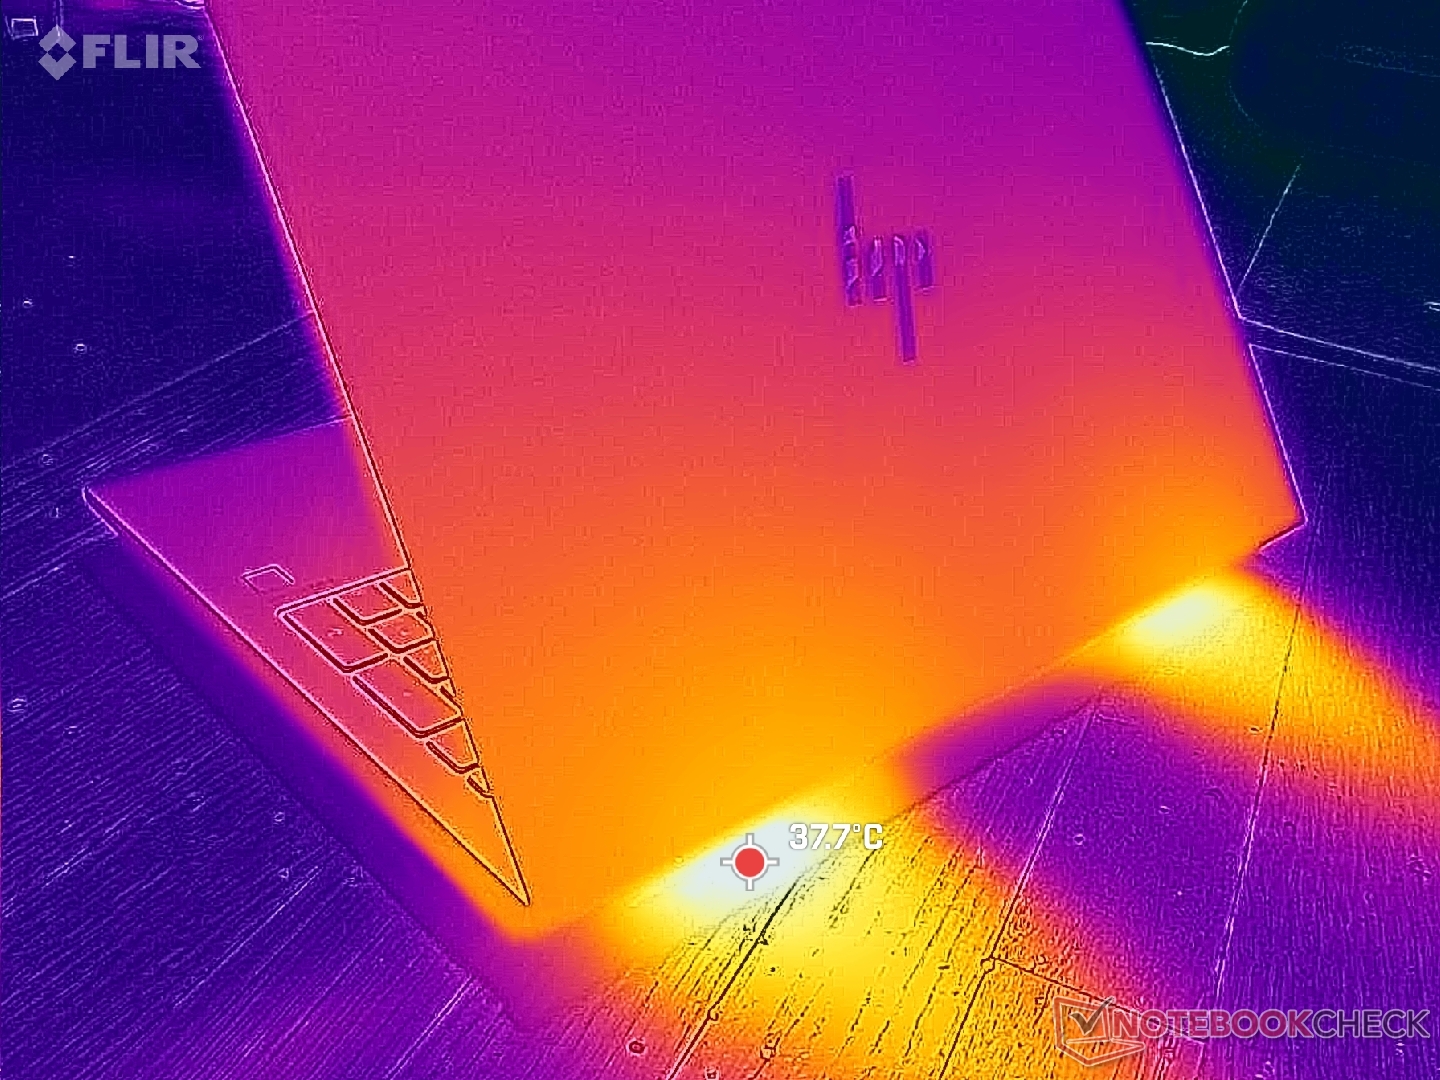
(±) De maximumtemperatuur aan de bovenzijde bedraagt 40.6 °C / 105 F, vergeleken met het gemiddelde van 38.2 °C / 101 F, variërend van 22.2 tot 69.8 °C voor de klasse Workstation.
(±) De bodem warmt op tot een maximum van 40.6 °C / 105 F, vergeleken met een gemiddelde van 41.2 °C / 106 F
(+) Bij onbelast gebruik bedraagt de gemiddelde temperatuur voor de bovenzijde 24.6 °C / 76 F, vergeleken met het apparaatgemiddelde van 32 °C / 90 F.
(+) 3: The average temperature for the upper side is 30.1 °C / 86 F, compared to the average of 32 °C / 90 F for the class Workstation.
(+) De palmsteunen en het touchpad zijn met een maximum van ###max## °C / 81 F koeler dan de huidtemperatuur en voelen daarom koel aan.
(±) De gemiddelde temperatuur van de handpalmsteun van soortgelijke toestellen bedroeg 27.8 °C / 82 F (+0.6 °C / 1 F).
| HP ZBook Power 16 G11 A AMD Ryzen 7 8845HS, NVIDIA RTX 2000 Ada Generation Laptop GPU | HP ZBook Power 15 G10 AMD Ryzen 7 PRO 7840HS, NVIDIA RTX 2000 Ada Generation Laptop GPU | HP ZBook Fury 16 G11 Intel Core i9-14900HX, NVIDIA RTX 3500 Ada Generation Laptop GPU | Lenovo ThinkPad P1 Gen 7 21KV001SGE Intel Core Ultra 7 155H, NVIDIA GeForce RTX 4060 Laptop GPU | Lenovo ThinkPad P16s G2 21K9000CGE AMD Ryzen 7 PRO 7840U, AMD Radeon 780M | Dell Precision 5690 Intel Core Ultra 9 185H, Nvidia RTX 5000 Ada Generation Laptop GPU | |
|---|---|---|---|---|---|---|
| Heat | -7% | -26% | -8% | -9% | -8% | |
| Maximum Upper Side * | 40.6 | 42.4 -4% | 42.2 -4% | 50.3 -24% | 42.7 -5% | 46.6 -15% |
| Maximum Bottom * | 40.6 | 47.8 -18% | 48 -18% | 38 6% | 47.2 -16% | 33 19% |
| Idle Upper Side * | 26 | 26.8 -3% | 37 -42% | 28.3 -9% | 27.8 -7% | 32.4 -25% |
| Idle Bottom * | 26.6 | 27.2 -2% | 36.8 -38% | 27.3 -3% | 28.4 -7% | 29.4 -11% |
* ... kleiner is beter
Luidsprekers
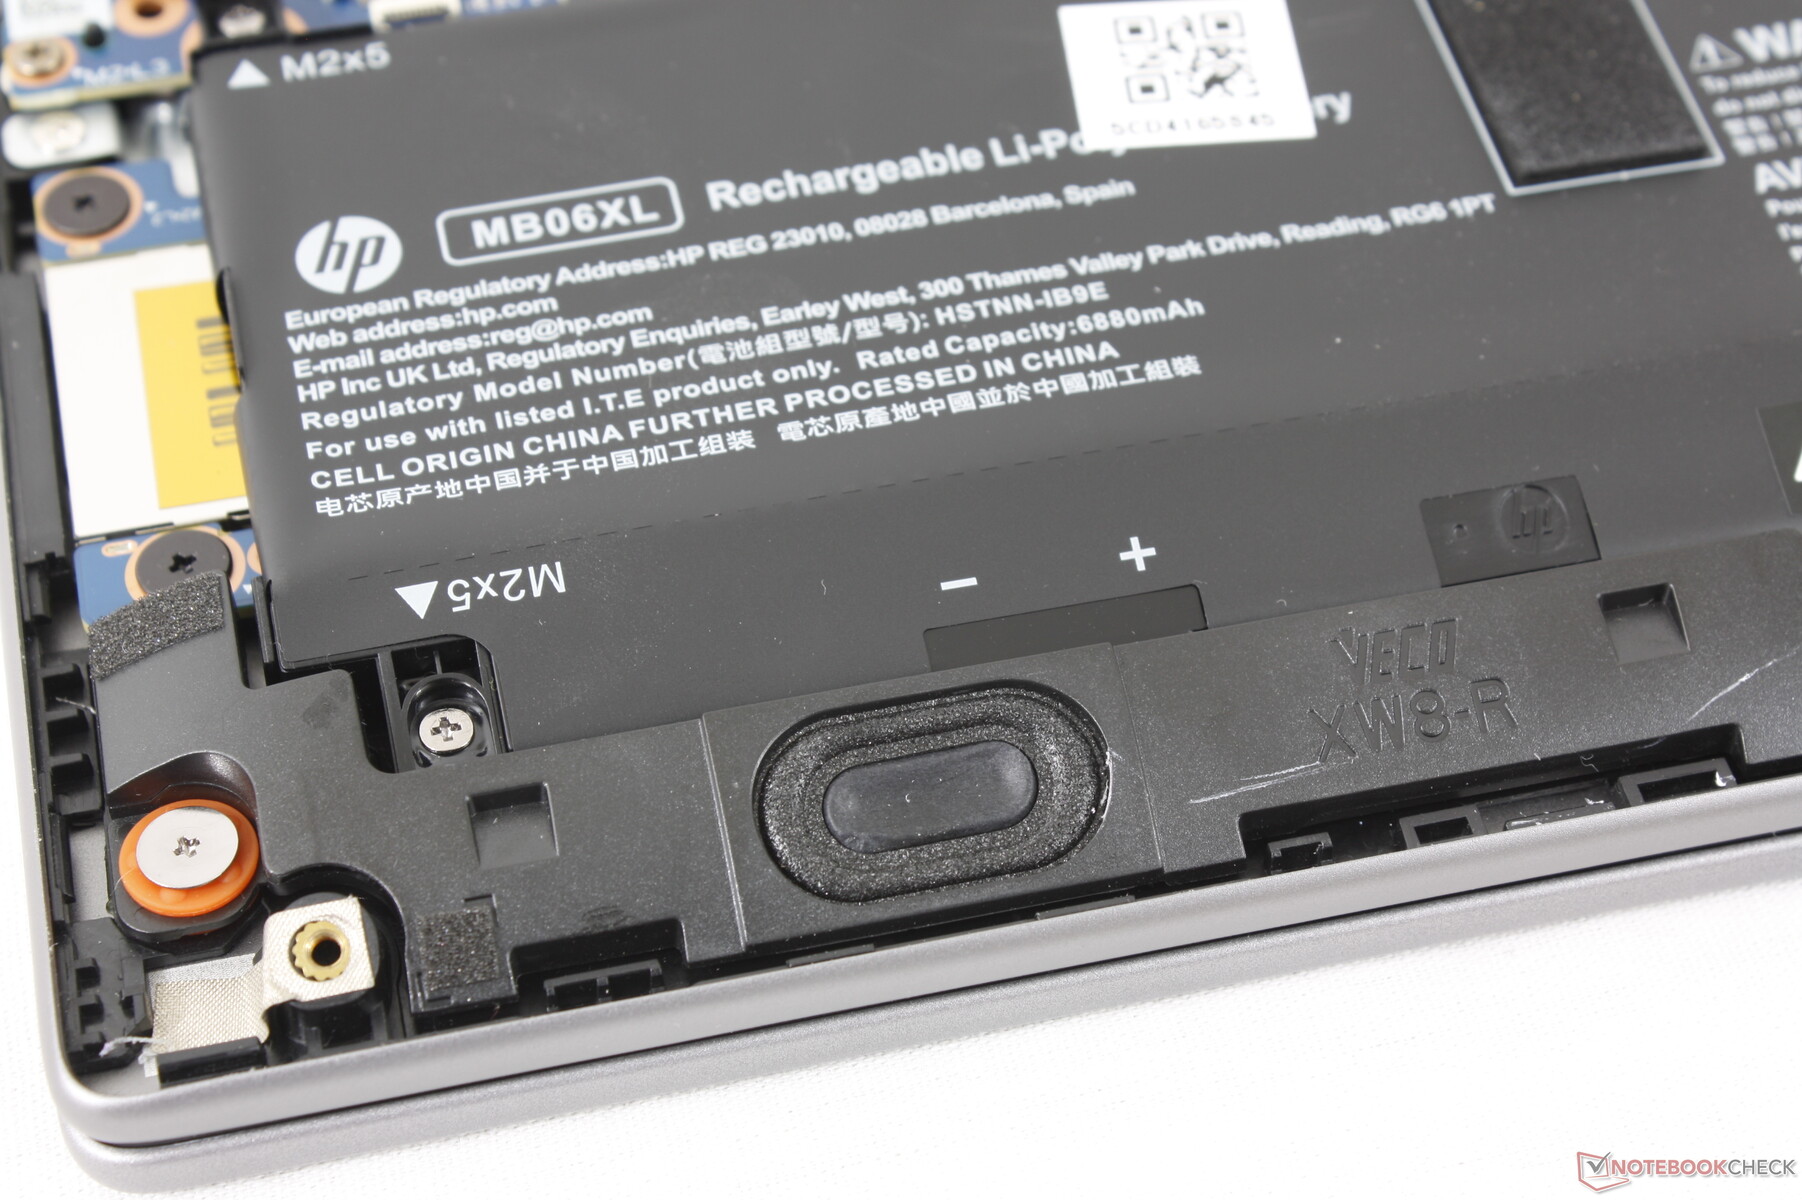
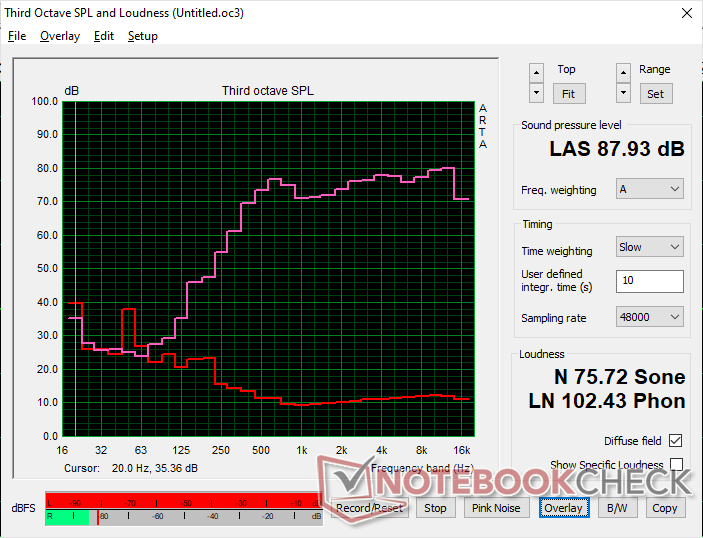
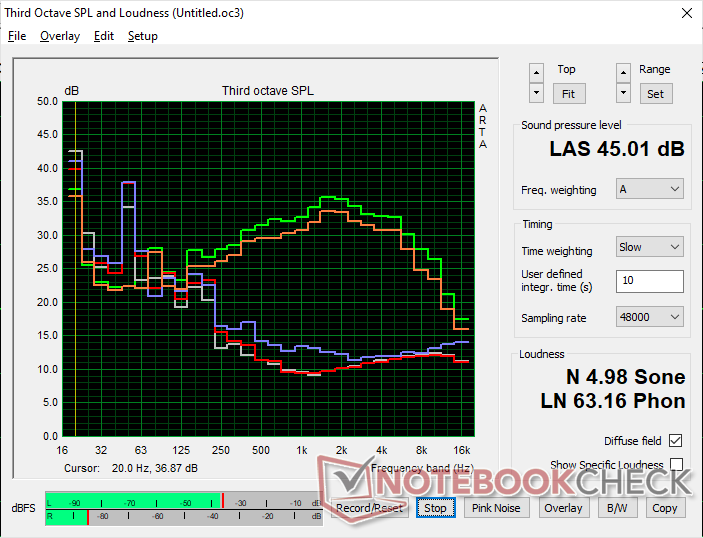
HP ZBook Power 16 G11 A audioanalyse
(+) | luidsprekers kunnen relatief luid spelen (87.9 dB)
Bas 100 - 315 Hz
(-) | bijna geen lage tonen - gemiddeld 28.1% lager dan de mediaan
(±) | lineariteit van de lage tonen is gemiddeld (9% delta ten opzichte van de vorige frequentie)
Midden 400 - 2000 Hz
(+) | evenwichtige middens - slechts 1.9% verwijderd van de mediaan
(+) | de middentonen zijn lineair (4.8% delta ten opzichte van de vorige frequentie)
Hoog 2 - 16 kHz
(+) | evenwichtige hoogtepunten - slechts 3.6% verwijderd van de mediaan
(+) | de hoge tonen zijn lineair (2.4% delta naar de vorige frequentie)
Algemeen 100 - 16.000 Hz
(±) | lineariteit van het totale geluid is gemiddeld (15.1% verschil met de mediaan)
Vergeleken met dezelfde klasse
» 29% van alle geteste apparaten in deze klasse waren beter, 7% vergelijkbaar, 63% slechter
» De beste had een delta van 7%, het gemiddelde was 18%, de slechtste was 35%
Vergeleken met alle geteste toestellen
» 19% van alle geteste apparaten waren beter, 4% gelijk, 77% slechter
» De beste had een delta van 4%, het gemiddelde was 24%, de slechtste was 134%
Apple MacBook Pro 16 2021 M1 Pro audioanalyse
(+) | luidsprekers kunnen relatief luid spelen (84.7 dB)
Bas 100 - 315 Hz
(+) | goede baars - slechts 3.8% verwijderd van de mediaan
(+) | de lage tonen zijn lineair (5.2% delta naar de vorige frequentie)
Midden 400 - 2000 Hz
(+) | evenwichtige middens - slechts 1.3% verwijderd van de mediaan
(+) | de middentonen zijn lineair (2.1% delta ten opzichte van de vorige frequentie)
Hoog 2 - 16 kHz
(+) | evenwichtige hoogtepunten - slechts 1.9% verwijderd van de mediaan
(+) | de hoge tonen zijn lineair (2.7% delta naar de vorige frequentie)
Algemeen 100 - 16.000 Hz
(+) | het totale geluid is lineair (4.6% verschil met de mediaan)
Vergeleken met dezelfde klasse
» 0% van alle geteste apparaten in deze klasse waren beter, 0% vergelijkbaar, 100% slechter
» De beste had een delta van 5%, het gemiddelde was 18%, de slechtste was 45%
Vergeleken met alle geteste toestellen
» 0% van alle geteste apparaten waren beter, 0% gelijk, 100% slechter
» De beste had een delta van 4%, het gemiddelde was 24%, de slechtste was 134%
Energiebeheer
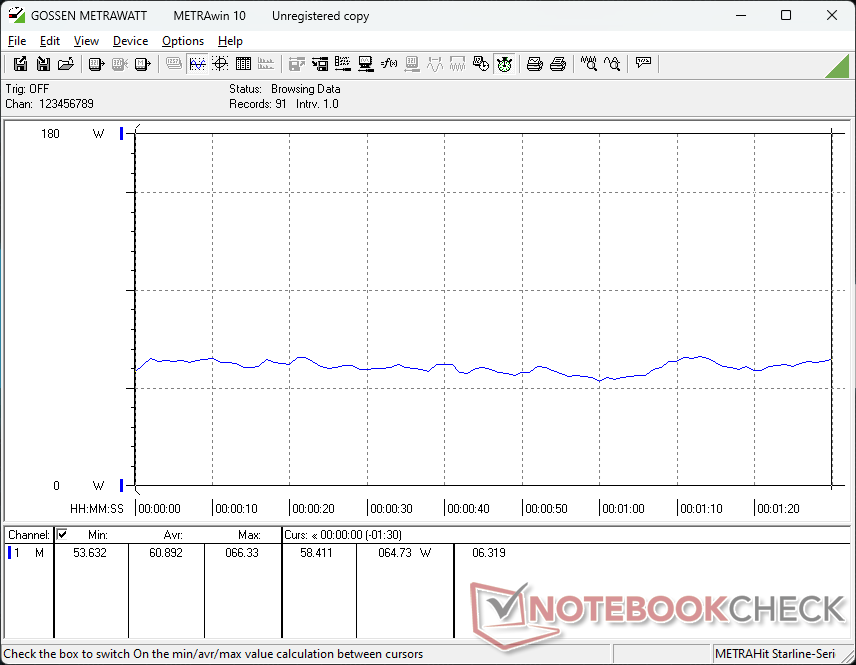
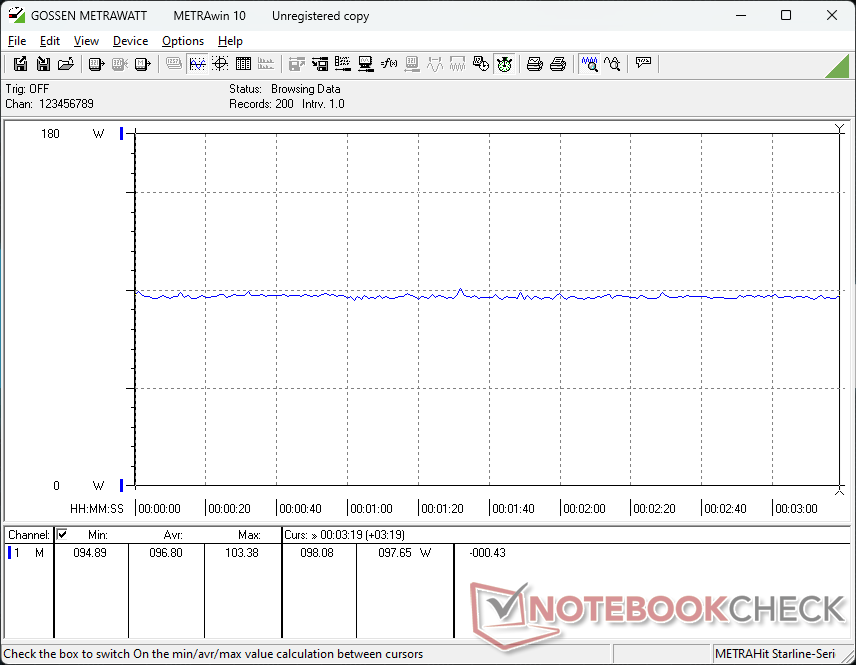
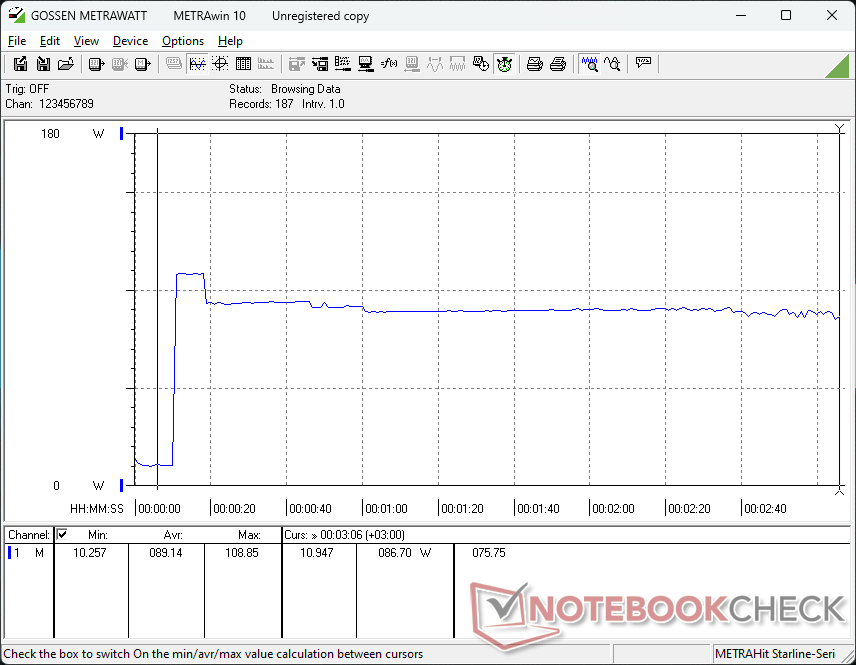
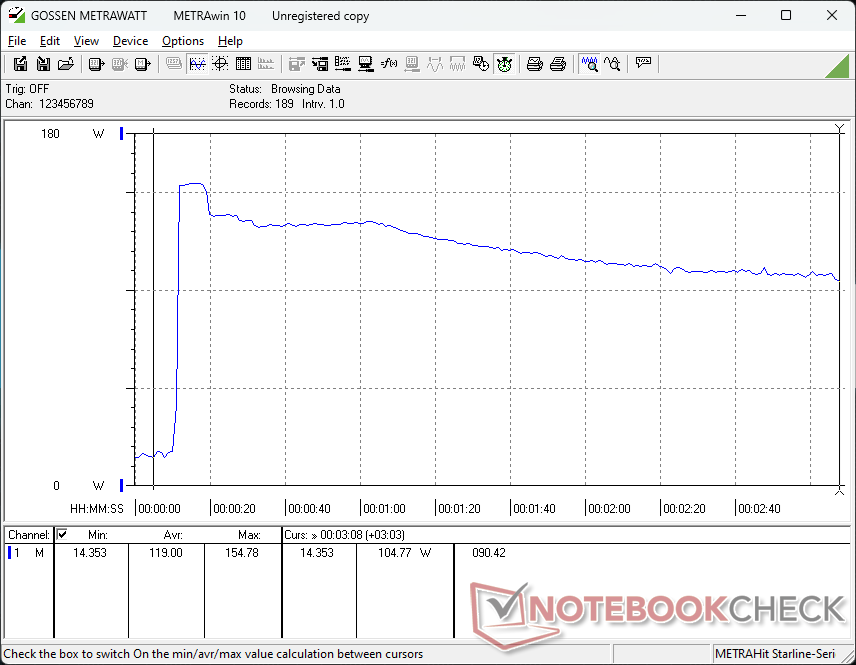
Stroomverbruik
Verbruiksniveaus en gedrag zijn vergelijkbaar met wat we hebben waargenomen op de ZBook Power 15 G10, wat niet verwonderlijk is aangezien de energie-enveloppe hetzelfde blijft. Het meest opvallende verschil is misschien wel het lagere verbruik van ongeveer 25 W bij het gelijktijdig uitvoeren van Prime95 en FurMark. Dit kan worden toegeschreven aan de zwaardere throttling voor het koelen van de kerntemperaturen bij het uitvoeren van dergelijke belastingen, zoals vermeld in het gedeelte over de stresstest hierboven.
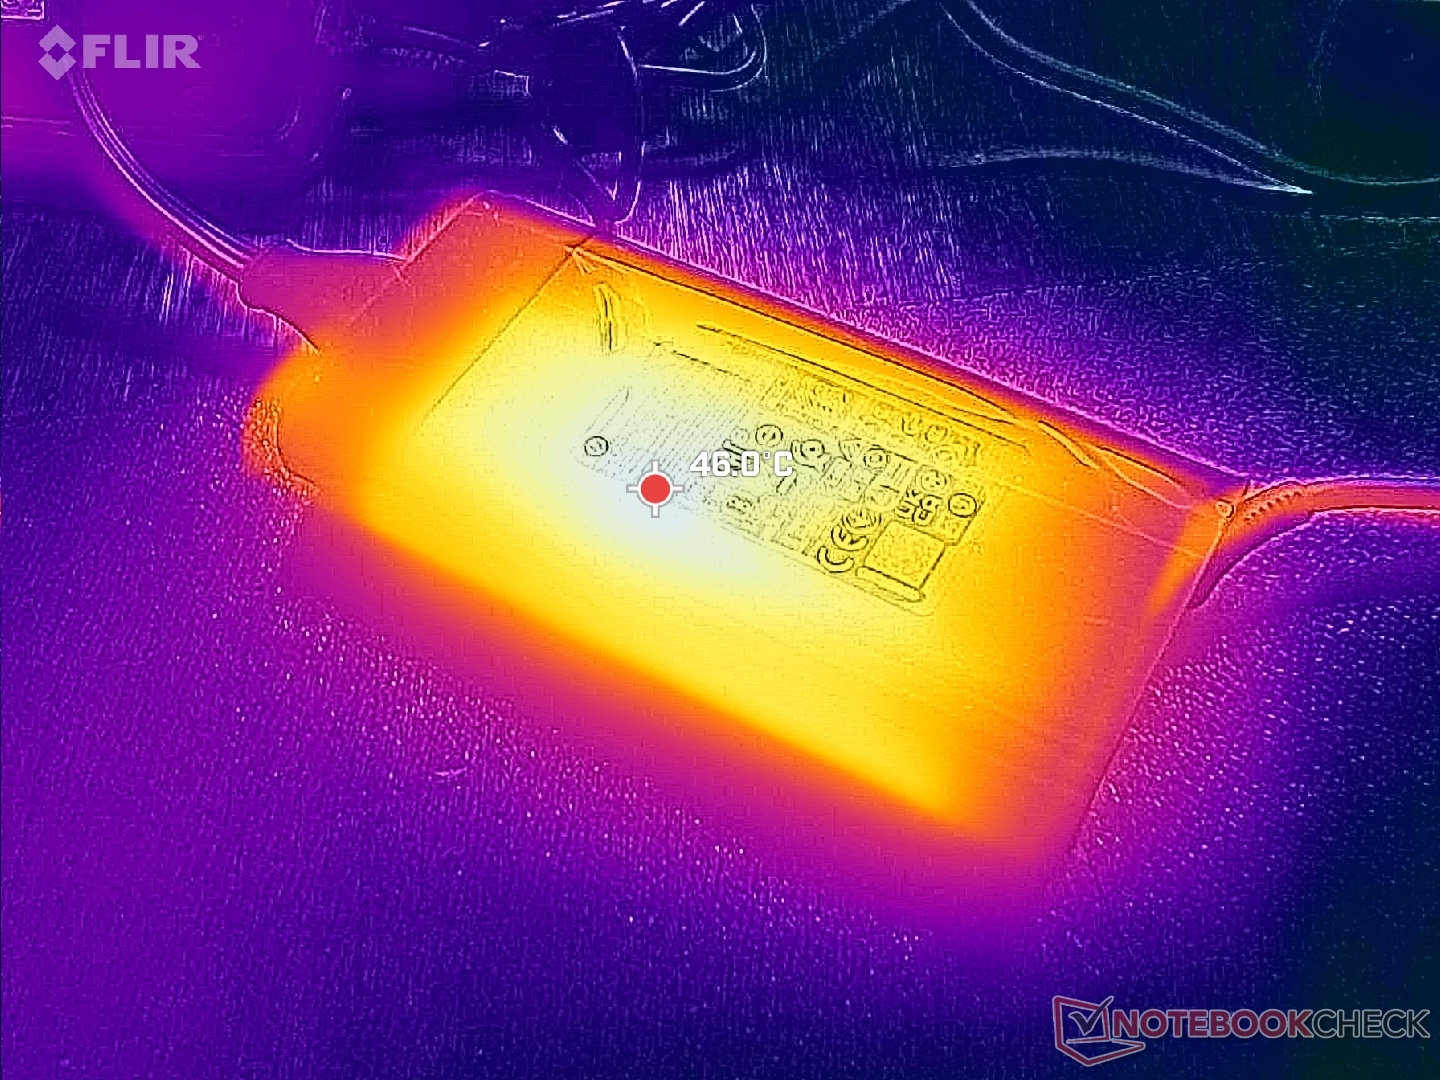
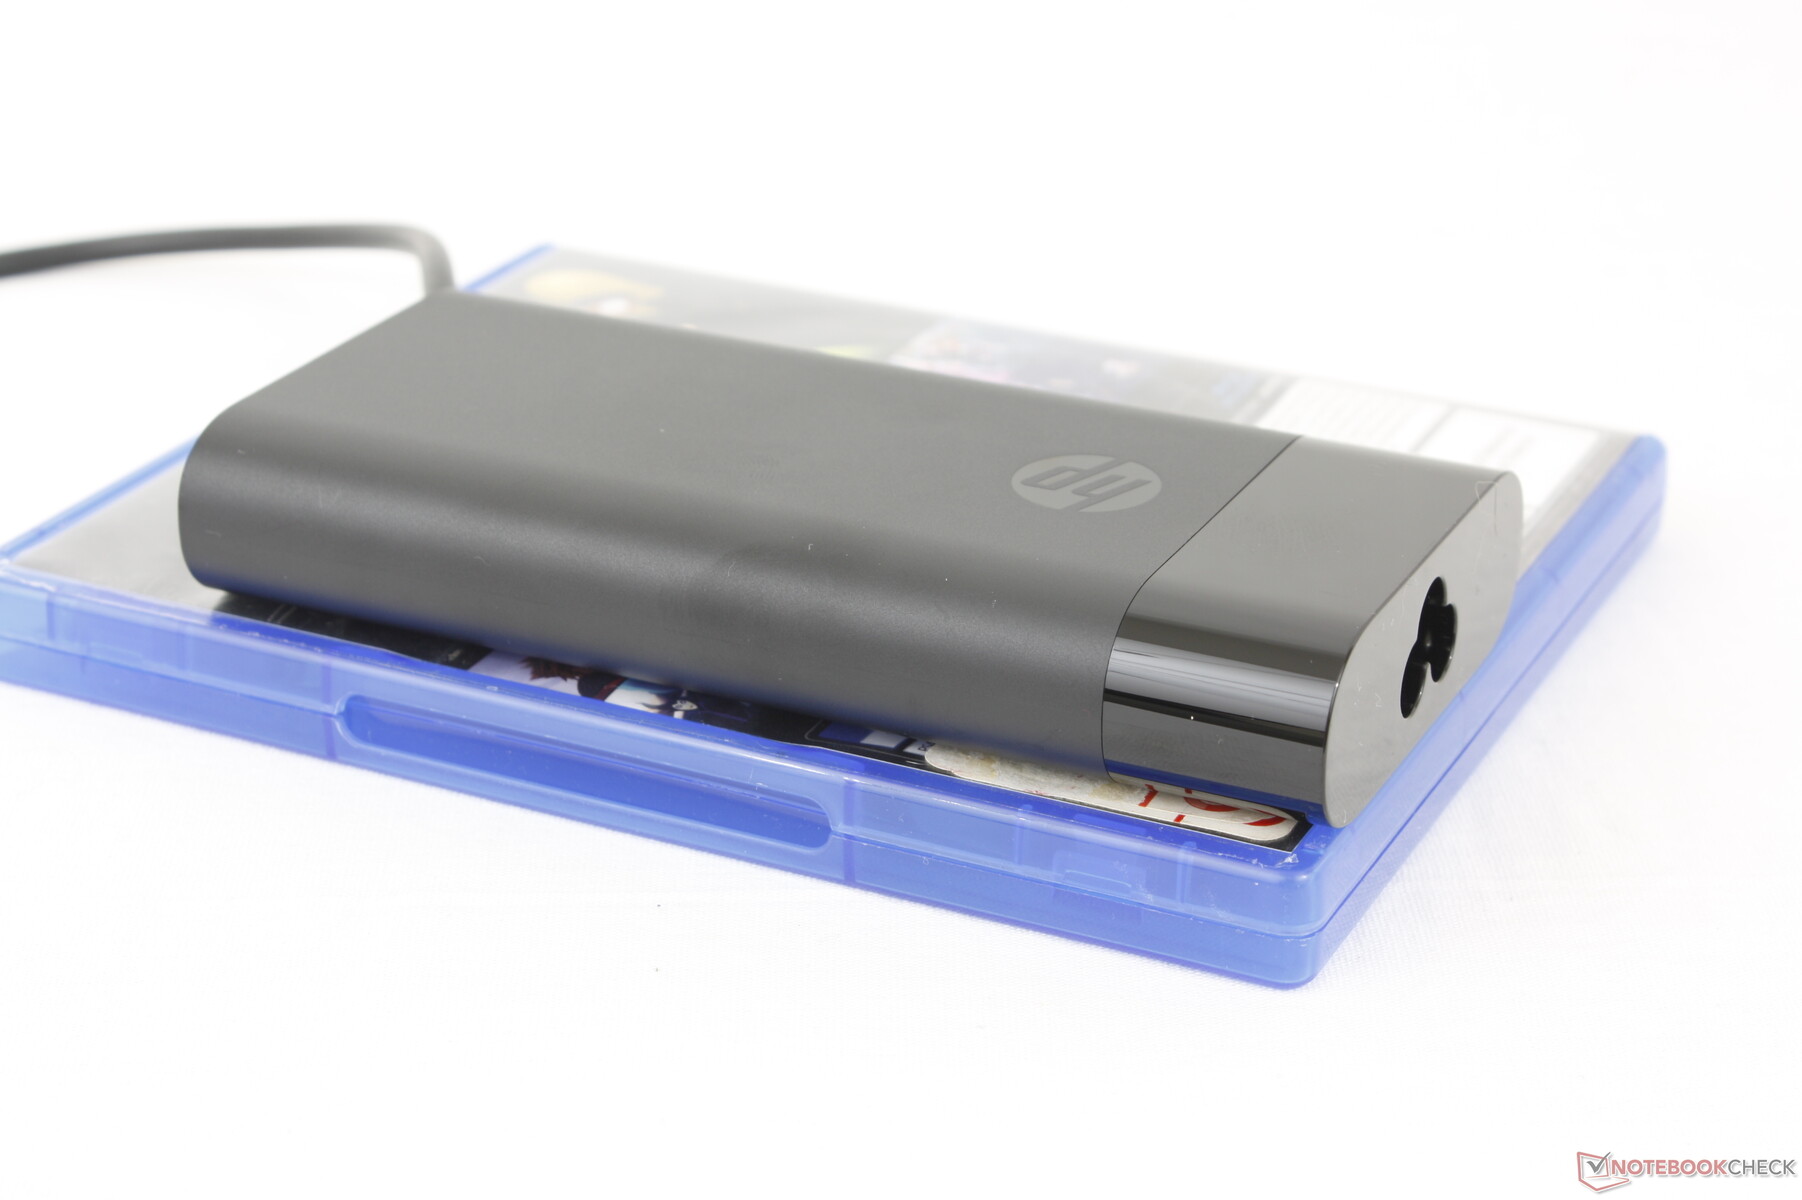
We zijn in staat om een tijdelijke maximale stroomopname van 155 W te registreren van de middelgrote (~13,8 x 6,5 x 2,2 cm) 150 W AC-adapter.
| Uit / Standby | |
| Inactief | |
| Belasting |
|
Key:
min: | |
| HP ZBook Power 16 G11 A R7 8845HS, NVIDIA RTX 2000 Ada Generation Laptop GPU, Samsung PM9A1 MZVL22T0HBLB, IPS, 2560x1600, 16" | HP ZBook Power 15 G10 R7 PRO 7840HS, NVIDIA RTX 2000 Ada Generation Laptop GPU, WDC PC SN810 2TB, IPS, 2560x1440, 15.6" | HP ZBook Fury 16 G11 i9-14900HX, NVIDIA RTX 3500 Ada Generation Laptop GPU, SK hynix PC801 HFS001TEJ9X101N, IPS, 3840x2400, 16" | Lenovo ThinkPad P1 Gen 7 21KV001SGE Ultra 7 155H, NVIDIA GeForce RTX 4060 Laptop GPU, Kioxia XG8 KXG8AZNV1T02, IPS LED, 2560x1600, 16" | Lenovo ThinkPad P16s G2 21K9000CGE R7 PRO 7840U, Radeon 780M, SK hynix PC801 HFS001TEJ9X162N, OLED, 3840x2400, 16" | Dell Precision 5690 Ultra 9 185H, NVIDIA RTX 5000 Ada Generation Laptop GPU, 2x Samsung PM9A1 1TB (RAID 0), OLED, 3840x2400, 16" | |
|---|---|---|---|---|---|---|
| Power Consumption | -13% | -80% | -35% | 20% | -67% | |
| Idle Minimum * | 4.6 | 5.3 -15% | 8.6 -87% | 7.3 -59% | 6.1 -33% | 7.9 -72% |
| Idle Average * | 10 | 9.9 1% | 14.8 -48% | 12.3 -23% | 6.5 35% | 12 -20% |
| Idle Maximum * | 10.6 | 16.7 -58% | 15.7 -48% | 17.9 -69% | 7 34% | 28.6 -170% |
| Load Average * | 60.9 | 61.3 -1% | 129.4 -112% | 78.2 -28% | 56.6 7% | 98.8 -62% |
| Cyberpunk 2077 ultra external monitor * | 92.8 | 192.6 -108% | 117.7 -27% | |||
| Cyberpunk 2077 ultra * | 96.8 | 199.4 -106% | 123.5 -28% | |||
| Load Maximum * | 154.8 | 145.3 6% | 236.1 -53% | 167.5 -8% | 68.3 56% | 174.8 -13% |
| Witcher 3 ultra * | 87.9 | 61.2 | 144.5 |
* ... kleiner is beter
Power Consumption Cyberpunk / Stress Test
Power Consumption external Monitor
Levensduur batterij
De batterijcapaciteit is niet veranderd ten opzichte van de ZBook Power 15 G10 van vorig jaar, ondanks de aanpassingen aan de vormfactor. Misschien is het toeval dat de runtimes bijna hetzelfde blijven met iets meer dan 9,5 uur echt WLAN-browsen voordat hij automatisch wordt afgesloten.
Het opladen van lege naar volle capaciteit gaat relatief snel (minder dan 70 minuten). Opladen via USB-C wordt ondersteund, zij het met lagere snelheden.
| HP ZBook Power 16 G11 A R7 8845HS, NVIDIA RTX 2000 Ada Generation Laptop GPU, 83 Wh | HP ZBook Power 15 G10 R7 PRO 7840HS, NVIDIA RTX 2000 Ada Generation Laptop GPU, 83 Wh | HP ZBook Fury 16 G11 i9-14900HX, NVIDIA RTX 3500 Ada Generation Laptop GPU, 95 Wh | Lenovo ThinkPad P1 Gen 7 21KV001SGE Ultra 7 155H, NVIDIA GeForce RTX 4060 Laptop GPU, 90 Wh | Lenovo ThinkPad P16s G2 21K9000CGE R7 PRO 7840U, Radeon 780M, 84 Wh | Dell Precision 5690 Ultra 9 185H, NVIDIA RTX 5000 Ada Generation Laptop GPU, 98 Wh | |
|---|---|---|---|---|---|---|
| Batterijduur | 3% | -31% | 7% | -1% | -6% | |
| Reader / Idle | 1566 | |||||
| WiFi v1.3 | 582 | 601 3% | 402 -31% | 595 2% | 635 9% | 549 -6% |
| Load | 103 | 114 11% | 92 -11% | |||
| H.264 | 797 |
Pro
Contra
Verdict - Groter scherm maar dezelfde prestaties
De ZBook Power 16 G11 vervangt de ZBook Power 15-serie met een groter en zwaarder 16-inch ontwerp. Men zou kunnen aannemen dat de grotere vormfactor tot snellere prestaties leidt, maar dat is helaas niet het geval. De nieuwe Hawk Point CPU's bieden niet veel meer dan de Phoenix-opties van vorig jaar, terwijl de GPU-opties tot aan hun TGP-plafonds exact hetzelfde zijn. Het nieuwe ontwerp van de behuizing was HP's kans om de koeloplossing te upgraden en meer prestaties uit de processors te persen, maar we vermoeden dat de fabrikant zich niet te veel op het terrein van de ZBook Fury in het hogere segment wilde begeven.
De schermopties zijn ook een beetje teleurstellend voor een workstation. Afgezien van de unieke 1000-nit optie, zijn er geen noemenswaardige kenmerken zoals OLED, P3-kleuren of 4K-resolutie. Dergelijke panelen zouden het grotere schermformaat veel aantrekkelijker hebben gemaakt ten opzichte van de uitgaande 15,6-inch versie. In plaats daarvan zijn gebruikers beperkt tot 2K en IPS.
Afgezien van het grotere 16-inch schermformaat heeft de ZBook Power 16 G11 niet veel meer te bieden dan zijn voorganger. De prestaties en functies van de twee modellen zijn vrijwel hetzelfde.
Ondanks het gebrek aan prestatie-upgrades en nieuwe functies is de HP nog steeds een sterk werkstation in het middensegment. De CPU prestaties zijn nog steeds merkbaar sneller dan de ThinkPad P16s G2 die beperkt is tot CPU's uit de Ryzen-U serie, maar minder duur is dan de populaire Dell Precision 5690 wanneer geconfigureerd met dezelfde GPU. Als u echter al een ZBook Power 15 G10 bezit, kan de zwaardere 16-inch versie aanvoelen als een zijsprong.
Prijs en beschikbaarheid
Opmerking: We hebben ons beoordelingssysteem onlangs bijgewerkt en de resultaten van versie 8 zijn niet vergelijkbaar met de resultaten van versie 7. Meer informatie is beschikbaar hier .
HP ZBook Power 16 G11 A
- 30-09-2024 v8
Allen Ngo
 Total Sustainability Score:
 Transparantie
De selectie van te beoordelen apparaten wordt gemaakt door onze redactie. Het testexemplaar werd ten behoeve van deze beoordeling door de fabrikant of detailhandelaar in bruikleen aan de auteur verstrekt. De kredietverstrekker had geen invloed op deze recensie, noch ontving de fabrikant vóór publicatie een exemplaar van deze recensie. Er bestond geen verplichting om deze recensie te publiceren. Wij accepteren nooit een compensatie of betaling in ruil voor onze beoordelingen. Als onafhankelijk mediabedrijf is Notebookcheck niet onderworpen aan het gezag van fabrikanten, detailhandelaren of uitgevers.
[transparency_disclaimer]Dit is hoe Notebookcheck test
Elk jaar beoordeelt Notebookcheck onafhankelijk honderden laptops en smartphones met behulp van gestandaardiseerde procedures om ervoor te zorgen dat alle resultaten vergelijkbaar zijn. We hebben onze testmethoden al zo'n 20 jaar voortdurend ontwikkeld en daarbij de industriestandaard bepaald. In onze testlaboratoria wordt gebruik gemaakt van hoogwaardige meetapparatuur door ervaren technici en redacteuren. Deze tests omvatten een validatieproces in meerdere fasen. Ons complexe beoordelingssysteem is gebaseerd op honderden goed onderbouwde metingen en benchmarks, waardoor de objectiviteit behouden blijft. Meer informatie over onze testmethoden kunt u hier vinden.
Price comparison

