Notebookcheck Logo

AMD Ryzen 7 9700X Review: Core i9-14900K niveaus van single-core en gaming prestaties met Zen 5 voor US$185 minder
Nokloper aan de rand van de efficiëntie.

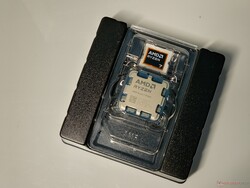
De AMD Ryzen 7 9700X maakt gebruik van verbeteringen in de 4 nm Zen 5-architectuur om uitstekende single-core en gamingprestaties te bieden die vergelijkbaar zijn met Intels beste 14e generatie aanbod, inclusief de Core i9-14900K. Hoewel de efficiëntieverbeteringen van de Ryzen 7 9700X zorgen voor een krachtige gaming PC, bemoeilijkt de huidige prijsstrategie van AMD aankoopbeslissingen ten opzichte van de concurrentie.
AMD Ryzen 7 9700X in review

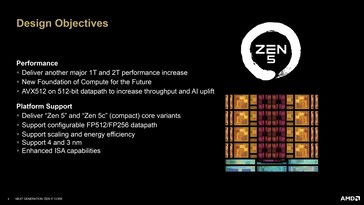
AMD lanceerde onlangs de 4 nm Ryzen 9000 Zen 5 "Granite Ridge" APU's als directe opvolger van het Zen 4-aanbod van vorig jaar. AMD's verklaarde doelstellingen met Zen 5 zijn "belangrijke" 1T en 2T prestatieverhogingen en een volledig 512-bit AVX512 datapad.

Volgens AMD is de Zen 5-kern ontworpen ter ondersteuning van aankomende AI-mogelijkheden, hoewel de SoC zelf geen speciale NPU heeft, in tegenstelling tot wat we hebben gezien bij de nieuwe Ryzen 9 AI HX Strix Point APUs.

De Ryzen 5 9600X en de Ryzen 7 9700X hebben +100 MHz boostfrequenties in vergelijking met hun Zen 4 tegenhangers. Deze CPU's zijn echter beperkt tot 65 W TDP out-of-the-box.

Deze kunstmatige TDP-beperking is vergelijkbaar met het draaien van de Ryzen 7 7700X in de ECO-modus, maar de veranderingen in de microarchitectuur van Zen 5 zorgen voor merkbare prestatiewinst, zelfs bij deze beperkte TDP. Het andere voordeel is dat u vrijwel elke basiskoeler op de Ryzen 7 9700X kunt plaatsen en de bal aan het rollen kunt brengen.

Natuurlijk, hoe beter de koeloplossing en de stroomvoorziening van het moederbord, hoe meer thermische en stroomruimte voor Precision Boost Overdrive 2 (PBO2) om zijn magie te doen. De nadelen van deze aanpak zijn echter lagere basiskloks en praktisch geen prestatieverschil ten opzichte van Zen 4, zoals we binnenkort zullen zien.

Zen 5 ontwerpdoelstellingen. (Bron: AMD)
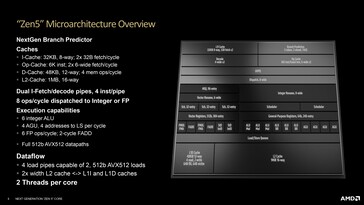
Overzicht van de Zen 5 microarchitectuur. (Bron: AMD)
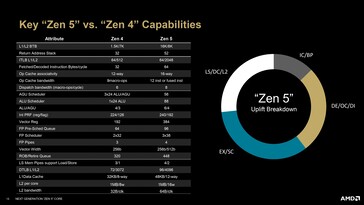
Verschillen tussen Zen 4 en Zen 5 architectuur. (Bron: AMD)
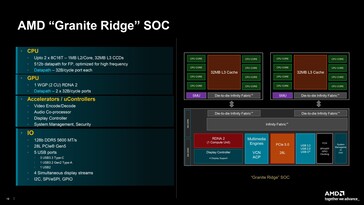
Overzicht van de Zen 5 "Granite Ridge" SoC. (Bron: AMD)

Dit is geen X3D-chip, dus de gecombineerde L2+L3 cache is nog steeds 40 MB. De I/O-die is hergebruikt uit Zen 4, wat betekent dat de SoC dezelfde RDNA 2 iGPU heeft met twee compute units (128 stream processors).

De belangrijkste verandering deze keer is ondersteuning voor DDR5-5600 geheugen, dat naar verluidt DDR5-8000 EXPO snelheden kan bereiken. Net als bij de Ryzen 7000-serie raadt AMD een 1:1 UCLK- en MCLK-verhouding aan met FCLK ingesteld op Auto.

Zen 5 brengt ook een nieuwe Geheugenklokfunctie On-the-Fly die naadloos schakelen tussen POR-geheugensnelheden (Power-on-Reset) en EXPO-profielen rechtstreeks vanuit Ryzen Master mogelijk maakt. Gebruikers kunnen ook geheugengeoptimaliseerde prestatieprofielen (OPP) maken, wat in feite EXPO-instellingen zijn voor geheugen zonder een native EXPO-profiel.

Tot slot is er naast de bestaande Curve Optimizer een nieuwe Curve Shaper-functie waarmee de spanningscurves opnieuw gevormd kunnen worden, door naar behoefte 15 verschillende frequentie-temperatuurbanden toe te voegen of te verwijderen. Deze overklokfuncties worden ook ondersteund op bestaande AM5-borden met een BIOS-update.

In deze review bekijken we de AMD Ryzen 7 9700X 8-core 16-thread processor om te zien hoe deze het doet in vergelijking met de concurrentie van Team Blue en zijn eigen landgenoten.

Overzicht van AMD Zen 5 "Granite Ridge" Ryzen 9000 desktop-processoren

SKU Kernen / Draden Basisklok Turboklok L2 Cache L3 Cache TDP Standaard socketvermogen (PPT) Lanceerprijs (SEP)
Ryzen 9 9950X 16 / 32 4,3 GHz 5,7 GHz 16x 1 MB 64 MB 170 W 200 W US$649
Ryzen 9 9900X 12 / 24 4,7 GHz 5,6 GHz 12x 1 MB 64 MB 120 W 162 W US$499
Ryzen 7 9700X 8/ 16 3,8 GHz 5,5 GHz 8x 1 MB 32 MB 65 W 88 W US$359
Ryzen 5 9600X 6 / 12 3,9 GHz 5,4 GHz 6x 1 MB 32 MB 65 W 88 W US$279

De testbank: AMD Ryzen 7 9700X gaat goed samen met de RTX 4090

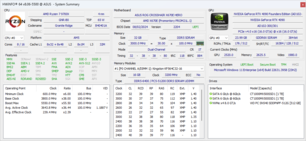
Wij gebruikten de volgende onderdelen in onze testopstelling voor deze recensie:

  • Cooler Master MasterFrame 700 open testbank
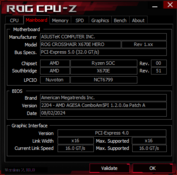
  • Asus ROG Crosshair X670E Hero moederbord met BIOS 2204 (AGESA ComboAM5PI 1.2.0.0a Patch A)
  • Nvidia GeForce RTX 4090 stichterseditie GPU
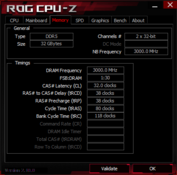
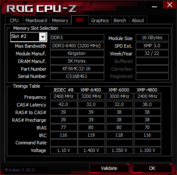
  • 2x 16 GB Kingston Fury Beast DDR5-6400 RAM op DDR5-6000 met timings 32-38-38-80 bij 1,35 V
  • Western Digital PC SN540 512 GB NVMe SSD en 2x Crucial MX500 1 TB SATA SSD's voor OS, benchmarks en games
  • MSI MAG 274UPF 4K 144 Hz monitor
  • Thermaltake TH420 V2 Ultra EX ARGB AIO-koeler
  • Cooler Master MVE Gold V2 1250 ATX 3.0 volledig modulaire PSU

Alle tests werden uitgevoerd na een schone installatie van Windows 11 23H2 (Build 22621.3958) samen met de nieuwste AMD-chipsetdrivers en Nvidia Game Ready Driver 560.81.

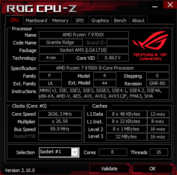
AMD Ryzen 7 9700X
AMD Ryzen 7 9700X

We hadden nog steeds moeite met de langere duur van de DDR5-training met Zen 5, waarbij de eerste keer opstarten na de CPU-installatie ongeveer vier tot vijf minuten duurde. Eenmaal voorbij deze eerste periode, worden opeenvolgende boots voltooid in ongeveer 10 seconden bij een nieuwe installatie van het besturingssysteem.

We willen AMD bedanken voor het leveren van het Ryzen 7 9700X-testexemplaar, Nvidia voor de RTX 4090 Founders Edition GPU, Asus voor het ROG Crosshair X670E Hero-moederbord, MSI voor de MAG274UPF-monitor, Kingston voor de DDR5-geheugenkit, Thermaltake voor de TH420 V2 Ultra EX AIO, en Cooler Master voor de testbank en voeding.

CPU prestaties: Multi-core winst ten opzichte van Ryzen 7 7700X belemmerd door 65 W TDP

De cumulatieve CPU-prestaties van de AMD Ryzen 7 9700X zijn vergelijkbaar met die van de Intel Core i5-14600K, Core i5-13600Ken zelfs de Core i9-12900K en de Ryzen 9 5950X. De Zen 5 CPU laat echter over het geheel genomen geen waarneembare prestatiewinst zien in vergelijking met een Ryzen 7 7700X.

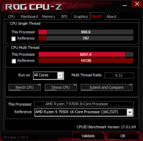
Dat gezegd hebbende, zien we wel behoorlijke gen-op-gen verbeteringen in Cinebench en Geekbench single-core scores, waarin de Ryzen 7 9700X tot 13% voorsprong laat zien ten opzichte van zijn Zen 4-voorganger.

De multikernwinsten zijn echter over de hele linie zeer minimaal, en we zien praktisch geen verschil tussen de Ryzen 7 9700X en de Ryzen 7 7700X in cumulatieve CPU-tests. Dit komt waarschijnlijk door de verlaagde standaard TDP van 65 W, wat een soort ECO-modus is. De lagere TDP geeft het PBO2-algoritme waarschijnlijk extra energie om de prestaties in single-core scenario's te verbeteren, aangezien deze CPU's nog steeds op een constante TjMax van 95 °C draaien.

AMD legt uit dat de Ryzen 7 9700X en de Ryzen 5 9600X specifiek gericht zijn op gebruikssituaties met een laag energieverbruik en waarschijnlijk thermisch beperkt zijn, afhankelijk van de koeloplossing.

Er doen geruchten de ronde op

dat AMD mogelijk een nieuwe AGESA-patch zal aanbieden die de 105 W TDP zal deblokkeren, dus daar zullen we op letten. U kunt de vermogenslimieten ook handmatig ontgrendelen door de PBO-limieten in het BIOS op hun maximum in te stellen.</p> <p style>Interessant is dat de single-core prestaties van de standaard Ryzen 7 9700X en de Ryzen 5 9600X precies hetzelfde zijn. Dus als uw workloads voornamelijk single-threaded zijn, kunt u gemakkelijk volstaan met de Ryzen 5 9600X en het wisselgeld besparen.</p>
 
CPU Performance Rating - Percent
Intel Core i9-14900K
i9-14900K, 3200 MHz
79.9 pt
Intel Core i9-13900K
i9-13900K, 3000 MHz
78.3 pt
AMD Ryzen 9 7950X
R9 7950X, 4500 MHz
78.3 pt
AMD Ryzen 9 7950X3D
R9 7950X3D, 4200 MHz
77.3 pt
Intel Core i7-14700K
i7-14700K, 2500 MHz
74.5 pt
AMD Ryzen 9 7900X
R9 7900X, 4700 MHz
70.6 pt
AMD Ryzen 9 5950X -1!
R9 5950X, 3400 MHz
67.2 pt
AMD Ryzen 7 9700X
Ryzen 7 9700X, 3800 MHz
66.7 pt
Intel Core i5-14600K
i5-14600K, 3500 MHz
66.6 pt
Intel Core i9-12900K
i9-12900K, 3200 MHz
66.5 pt
AMD Ryzen 7 7700X -1!
R7 7700X, 4500 MHz
65.4 pt
Intel Core i5-13600K
i5-13600K, 3500 MHz
65.1 pt
AMD Ryzen 5 9600X
Ryzen 5 9600X, 3900 MHz
63.7 pt
AMD Ryzen 7 7800X3D -1!
R7 7800X3D, 4200 MHz
63.2 pt
AMD Ryzen 5 7600X
R5 7600X, 4700 MHz
61 pt
Intel Core i5-12600K
i5-12600K, 2800 MHz
58.6 pt
Intel Core i5-13400
i5-13400, 2500 MHz
56.3 pt
AMD Ryzen 5 5600X -1!
R5 5600X, 3700 MHz
54.5 pt
Intel Core i5-12400F
i5-12400F, 2500 MHz
52 pt
Cinebench R11.5
CPU Single 64Bit
AMD Ryzen 7 9700X
Ryzen 7 9700X, 3800 MHz
4.06 Points
Intel Core i9-14900K
i9-14900K, 3200 MHz
4.02 Points -1%
AMD Ryzen 5 9600X
Ryzen 5 9600X, 3900 MHz
4 Points -1%
Intel Core i9-13900K
i9-13900K, 3000 MHz
3.92 Points -3%
AMD Ryzen 9 7950X
R9 7950X, 4500 MHz
3.86 Points -5%
AMD Ryzen 9 7950X3D
R9 7950X3D, 4200 MHz
3.86 Points -5%
AMD Ryzen 9 7900X
R9 7900X, 4700 MHz
3.83 Points -6%
AMD Ryzen 5 7600X
R5 7600X, 4700 MHz
3.72 Points -8%
AMD Ryzen 7 7700X
R7 7700X, 4500 MHz
3.71 Points -9%
Intel Core i7-14700K
i7-14700K, 2500 MHz
3.7 Points -9%
Intel Core i5-14600K
i5-14600K, 3500 MHz
3.58 Points -12%
Intel Core i9-12900K
i9-12900K, 3200 MHz
3.49 Points -14%
Intel Core i5-13600K
i5-13600K, 3500 MHz
3.48 Points -14%
AMD Ryzen 7 7800X3D
R7 7800X3D, 4200 MHz
3.43 Points -16%
Intel Core i5-12600K
i5-12600K, 2800 MHz
3.31 Points -18%
AMD Ryzen 9 5950X
R9 5950X, 3400 MHz
3.14 Points -23%
Intel Core i5-13400
i5-13400, 2500 MHz
3.1 Points -24%
AMD Ryzen 5 5600X
R5 5600X, 3700 MHz
2.95 Points -27%
Intel Core i5-12400F
i5-12400F, 2500 MHz
2.95 Points -27%
CPU Multi 64Bit
Intel Core i9-14900K
i9-14900K, 3200 MHz
72.24 Points +99%
Intel Core i9-13900K
i9-13900K, 3000 MHz
70.78 Points +95%
AMD Ryzen 9 7950X
R9 7950X, 4500 MHz
68.61 Points +89%
AMD Ryzen 9 7950X3D
R9 7950X3D, 4200 MHz
64.59 Points +78%
Intel Core i7-14700K
i7-14700K, 2500 MHz
61.44 Points +70%
AMD Ryzen 9 7900X
R9 7900X, 4700 MHz
54.51 Points +50%
AMD Ryzen 9 5950X
R9 5950X, 3400 MHz
49.6 Points +37%
Intel Core i9-12900K
i9-12900K, 3200 MHz
47.06 Points +30%
Intel Core i5-13600K
i5-13600K, 3500 MHz
42.38 Points +17%
Intel Core i5-14600K
i5-14600K, 3500 MHz
40.96 Points +13%
AMD Ryzen 7 9700X
Ryzen 7 9700X, 3800 MHz
36.24 Points
AMD Ryzen 7 7700X
R7 7700X, 4500 MHz
36.06 Points 0%
AMD Ryzen 7 7800X3D
R7 7800X3D, 4200 MHz
33.48 Points -8%
AMD Ryzen 5 9600X
Ryzen 5 9600X, 3900 MHz
30.86 Points -15%
Intel Core i5-12600K
i5-12600K, 2800 MHz
30.01 Points -17%
AMD Ryzen 5 7600X
R5 7600X, 4700 MHz
28.41 Points -22%
Intel Core i5-13400
i5-13400, 2500 MHz
27.36 Points -25%
AMD Ryzen 5 5600X
R5 5600X, 3700 MHz
21.75 Points -40%
Intel Core i5-12400F
i5-12400F, 2500 MHz
20.39 Points -44%
Cinebench R15
CPU Single 64Bit
AMD Ryzen 7 9700X
Ryzen 7 9700X, 3800 MHz
346 Points
AMD Ryzen 5 9600X
Ryzen 5 9600X, 3900 MHz
341 Points -1%
Intel Core i9-14900K
i9-14900K, 3200 MHz
332 Points -4%
AMD Ryzen 9 7950X
R9 7950X, 4500 MHz
328 Points -5%
Intel Core i9-13900K
i9-13900K, 3000 MHz
327 Points -5%
AMD Ryzen 9 7950X3D
R9 7950X3D, 4200 MHz
326 Points -6%
AMD Ryzen 9 7900X
R9 7900X, 4700 MHz
324 Points -6%
AMD Ryzen 5 7600X
R5 7600X, 4700 MHz
315 Points -9%
AMD Ryzen 7 7700X
R7 7700X, 4500 MHz
314 Points -9%
Intel Core i7-14700K
i7-14700K, 2500 MHz
314 Points -9%
Intel Core i5-14600K
i5-14600K, 3500 MHz
297 Points -14%
AMD Ryzen 7 7800X3D
R7 7800X3D, 4200 MHz
291 Points -16%
Intel Core i5-13600K
i5-13600K, 3500 MHz
289 Points -16%
Intel Core i9-12900K
i9-12900K, 3200 MHz
286 Points -17%
Intel Core i5-12600K
i5-12600K, 2800 MHz
275 Points -21%
AMD Ryzen 9 5950X
R9 5950X, 3400 MHz
272 Points -21%
Intel Core i5-13400
i5-13400, 2500 MHz
257 Points -26%
AMD Ryzen 5 5600X
R5 5600X, 3700 MHz
254 Points -27%
Intel Core i5-12400F
i5-12400F, 2500 MHz
244 Points -29%
CPU Multi 64Bit
Intel Core i9-14900K
i9-14900K, 3200 MHz
6282 Points +98%
AMD Ryzen 9 7950X
R9 7950X, 4500 MHz
6209 Points +95%
Intel Core i9-13900K
i9-13900K, 3000 MHz
6191 Points +95%
AMD Ryzen 9 7950X3D
R9 7950X3D, 4200 MHz
5974 Points +88%
Intel Core i7-14700K
i7-14700K, 2500 MHz
5459 (5323.4min - 5459.26max) Points +72%
AMD Ryzen 9 7900X
R9 7900X, 4700 MHz
4856 Points +53%
AMD Ryzen 9 5950X
R9 5950X, 3400 MHz
4492 Points +41%
Intel Core i9-12900K
i9-12900K, 3200 MHz
4057 Points +28%
Intel Core i5-13600K
i5-13600K, 3500 MHz
3643 Points +15%
Intel Core i5-14600K
i5-14600K, 3500 MHz
3640 Points +15%
AMD Ryzen 7 7700X
R7 7700X, 4500 MHz
3191 (3116.72min - 3191.32max) Points 0%
AMD Ryzen 7 9700X
Ryzen 7 9700X, 3800 MHz
3178 (3067.25min - 3120.37max) Points
AMD Ryzen 7 7800X3D
R7 7800X3D, 4200 MHz
2974 Points -6%
AMD Ryzen 5 9600X
Ryzen 5 9600X, 3900 MHz
2630 Points -17%
Intel Core i5-12600K
i5-12600K, 2800 MHz
2555 Points -20%
AMD Ryzen 5 7600X
R5 7600X, 4700 MHz
2507 Points -21%
Intel Core i5-13400
i5-13400, 2500 MHz
2358 Points -26%
AMD Ryzen 5 5600X
R5 5600X, 3700 MHz
1968 Points -38%
Intel Core i5-12400F
i5-12400F, 2500 MHz
1759 Points -45%
Cinebench R20
CPU (Single Core)
Intel Core i9-14900K
i9-14900K, 3200 MHz
900 Points +3%
AMD Ryzen 7 9700X
Ryzen 7 9700X, 3800 MHz
870 Points
AMD Ryzen 5 9600X
Ryzen 5 9600X, 3900 MHz
858 Points -1%
Intel Core i7-14700K
i7-14700K, 2500 MHz
832 Points -4%
Intel Core i9-13900K
i9-13900K, 3000 MHz
828 Points -5%
AMD Ryzen 9 7950X
R9 7950X, 4500 MHz
795 Points -9%
AMD Ryzen 9 7950X3D
R9 7950X3D, 4200 MHz
795 Points -9%
Intel Core i5-14600K
i5-14600K, 3500 MHz
790 Points -9%
AMD Ryzen 9 7900X
R9 7900X, 4700 MHz
786 Points -10%
Intel Core i5-13600K
i5-13600K, 3500 MHz
775 Points -11%
AMD Ryzen 7 7700X
R7 7700X, 4500 MHz
772 Points -11%
Intel Core i9-12900K
i9-12900K, 3200 MHz
766 Points -12%
AMD Ryzen 5 7600X
R5 7600X, 4700 MHz
761 Points -13%
Intel Core i5-12600K
i5-12600K, 2800 MHz
734 Points -16%
AMD Ryzen 7 7800X3D
R7 7800X3D, 4200 MHz
709 Points -19%
Intel Core i5-13400
i5-13400, 2500 MHz
688 Points -21%
Intel Core i5-12400F
i5-12400F, 2500 MHz
653 Points -25%
AMD Ryzen 9 5950X
R9 5950X, 3400 MHz
641 Points -26%
AMD Ryzen 5 5600X
R5 5600X, 3700 MHz
601 Points -31%
CPU (Multi Core)
Intel Core i9-14900K
i9-14900K, 3200 MHz
15466 Points +94%
Intel Core i9-13900K
i9-13900K, 3000 MHz
15181 Points +91%
AMD Ryzen 9 7950X
R9 7950X, 4500 MHz
14786 Points +86%
AMD Ryzen 9 7950X3D
R9 7950X3D, 4200 MHz
14188 Points +78%
Intel Core i7-14700K
i7-14700K, 2500 MHz
13672 Points +72%
AMD Ryzen 9 7900X
R9 7900X, 4700 MHz
11563 Points +45%
AMD Ryzen 9 5950X
R9 5950X, 3400 MHz
10482 Points +32%
Intel Core i9-12900K
i9-12900K, 3200 MHz
10240 Points +29%
Intel Core i5-14600K
i5-14600K, 3500 MHz
9371 Points +18%
Intel Core i5-13600K
i5-13600K, 3500 MHz
9265 Points +16%
AMD Ryzen 7 9700X
Ryzen 7 9700X, 3800 MHz
7956 Points
AMD Ryzen 7 7700X
R7 7700X, 4500 MHz
7617 Points -4%
AMD Ryzen 7 7800X3D
R7 7800X3D, 4200 MHz
7121 Points -10%
AMD Ryzen 5 9600X
Ryzen 5 9600X, 3900 MHz
6719 Points -16%
Intel Core i5-12600K
i5-12600K, 2800 MHz
6692 Points -16%
Intel Core i5-13400
i5-13400, 2500 MHz
6135 Points -23%
AMD Ryzen 5 7600X
R5 7600X, 4700 MHz
5985 Points -25%
Intel Core i5-12400F
i5-12400F, 2500 MHz
4740 Points -40%
AMD Ryzen 5 5600X
R5 5600X, 3700 MHz
4567 Points -43%
Cinebench R23
Single Core
Intel Core i9-14900K
i9-14900K, 3200 MHz
2351 Points +6%
Intel Core i9-13900K
i9-13900K, 3000 MHz
2267 Points +3%
AMD Ryzen 7 9700X
Ryzen 7 9700X, 3800 MHz
2211 Points
AMD Ryzen 5 9600X
Ryzen 5 9600X, 3900 MHz
2180 Points -1%
Intel Core i7-14700K
i7-14700K, 2500 MHz
2153 Points -3%
Intel Core i5-14600K
i5-14600K, 3500 MHz
2064 Points -7%
AMD Ryzen 9 7950X3D
R9 7950X3D, 4200 MHz
2053 Points -7%
AMD Ryzen 9 7950X
R9 7950X, 4500 MHz
2045 Points -8%
AMD Ryzen 9 7900X
R9 7900X, 4700 MHz
2039 Points -8%
Intel Core i5-13600K
i5-13600K, 3500 MHz
2010 Points -9%
Intel Core i9-12900K
i9-12900K, 3200 MHz
1998 Points -10%
AMD Ryzen 7 7700X
R7 7700X, 4500 MHz
1986 Points -10%
AMD Ryzen 5 7600X
R5 7600X, 4700 MHz
1967 Points -11%
Intel Core i5-12600K
i5-12600K, 2800 MHz
1907 Points -14%
AMD Ryzen 7 7800X3D
R7 7800X3D, 4200 MHz
1820 Points -18%
Intel Core i5-13400
i5-13400, 2500 MHz
1786 Points -19%
Intel Core i5-12400F
i5-12400F, 2500 MHz
1680 Points -24%
AMD Ryzen 9 5950X
R9 5950X, 3400 MHz
1649 Points -25%
AMD Ryzen 5 5600X
R5 5600X, 3700 MHz
1541 Points -30%
Multi Core
Intel Core i9-14900K
i9-14900K, 3200 MHz
41193 Points +101%
Intel Core i9-13900K
i9-13900K, 3000 MHz
40103 Points +96%
AMD Ryzen 9 7950X
R9 7950X, 4500 MHz
37792 Points +84%
AMD Ryzen 9 7950X3D
R9 7950X3D, 4200 MHz
36291 Points +77%
Intel Core i7-14700K
i7-14700K, 2500 MHz
35892 Points +75%
AMD Ryzen 9 7900X
R9 7900X, 4700 MHz
29480 Points +44%
AMD Ryzen 9 5950X
R9 5950X, 3400 MHz
27062 Points +32%
Intel Core i9-12900K
i9-12900K, 3200 MHz
27005 Points +32%
Intel Core i5-14600K
i5-14600K, 3500 MHz
24491 Points +20%
Intel Core i5-13600K
i5-13600K, 3500 MHz
24268 Points +18%
AMD Ryzen 7 9700X
Ryzen 7 9700X, 3800 MHz
20485 Points
AMD Ryzen 7 7700X
R7 7700X, 4500 MHz
19509 Points -5%
AMD Ryzen 7 7800X3D
R7 7800X3D, 4200 MHz
18086 Points -12%
Intel Core i5-12600K
i5-12600K, 2800 MHz
17491 Points -15%
AMD Ryzen 5 9600X
Ryzen 5 9600X, 3900 MHz
17176 Points -16%
Intel Core i5-13400
i5-13400, 2500 MHz
15953 Points -22%
AMD Ryzen 5 7600X
R5 7600X, 4700 MHz
15322 Points -25%
Intel Core i5-12400F
i5-12400F, 2500 MHz
12380 Points -40%
AMD Ryzen 5 5600X
R5 5600X, 3700 MHz
11838 Points -42%
Blender - v2.79 BMW27 CPU
Intel Core i5-12400F
i5-12400F, 2500 MHz
269 Seconds * -75%
AMD Ryzen 5 5600X
R5 5600X, 3700 MHz
260.2 Seconds * -69%
Intel Core i5-13400
i5-13400, 2500 MHz
206 Seconds * -34%
AMD Ryzen 5 7600X
R5 7600X, 4700 MHz
203 Seconds * -32%
Intel Core i5-12600K
i5-12600K, 2800 MHz
189.5 Seconds * -23%
AMD Ryzen 5 9600X
Ryzen 5 9600X, 3900 MHz
184 Seconds * -19%
AMD Ryzen 7 7800X3D
R7 7800X3D, 4200 MHz
169 Seconds * -10%
AMD Ryzen 7 7700X
R7 7700X, 4500 MHz
160 Seconds * -4%
AMD Ryzen 7 9700X
Ryzen 7 9700X, 3800 MHz
154 Seconds *
Intel Core i5-13600K
i5-13600K, 3500 MHz
135 Seconds * +12%
Intel Core i5-14600K
i5-14600K, 3500 MHz
134 Seconds * +13%
Intel Core i9-12900K
i9-12900K, 3200 MHz
121.1 Seconds * +21%
AMD Ryzen 9 5950X
R9 5950X, 3400 MHz
112.8 Seconds * +27%
AMD Ryzen 9 7900X
R9 7900X, 4700 MHz
106 Seconds * +31%
Intel Core i7-14700K
i7-14700K, 2500 MHz
91 Seconds * +41%
AMD Ryzen 9 7950X3D
R9 7950X3D, 4200 MHz
86 Seconds * +44%
AMD Ryzen 9 7950X
R9 7950X, 4500 MHz
85 Seconds * +45%
Intel Core i9-13900K
i9-13900K, 3000 MHz
80 Seconds * +48%
Intel Core i9-14900K
i9-14900K, 3200 MHz
80 Seconds * +48%
X264 HD Benchmark 4.0
Pass 1
Intel Core i9-14900K
i9-14900K, 3200 MHz
433.5 (424min - 434max) fps +15%
Intel Core i7-14700K
i7-14700K, 2500 MHz
419 (415min - 420max) fps +11%
Intel Core i9-13900K
i9-13900K, 3000 MHz
412 (410min - 417max) fps +10%
Intel Core i5-14600K
i5-14600K, 3500 MHz
411 (410min - 412max) fps +9%
AMD Ryzen 9 7950X3D
R9 7950X3D, 4200 MHz
392.5 (391min - 397max) fps +4%
Intel Core i5-13600K
i5-13600K, 3500 MHz
388 (386min - 388max) fps +3%
AMD Ryzen 9 7950X
R9 7950X, 4500 MHz
379.5 (378min - 385max) fps +1%
AMD Ryzen 9 7900X
R9 7900X, 4700 MHz
376 (369min - 378max) fps 0%
AMD Ryzen 7 9700X
Ryzen 7 9700X, 3800 MHz
376 (374min - 376max) fps
AMD Ryzen 7 7700X
R7 7700X, 4500 MHz
373.5 (363min - 381max) fps -1%
Intel Core i9-12900K
i9-12900K, 3200 MHz
368.5 (366min - 369max) fps -2%
AMD Ryzen 5 7600X
R5 7600X, 4700 MHz
367 (363min - 371max) fps -2%
AMD Ryzen 5 9600X
Ryzen 5 9600X, 3900 MHz
364 (361min - 367max) fps -3%
AMD Ryzen 7 7800X3D
R7 7800X3D, 4200 MHz
344 (339min - 346max) fps -9%
AMD Ryzen 9 5950X
R9 5950X, 3400 MHz
338.5 (337min - 340max) fps -10%
Intel Core i5-12600K
i5-12600K, 2800 MHz
333.5 (332min - 336max) fps -11%
AMD Ryzen 5 5600X
R5 5600X, 3700 MHz
320 (319min - 321max) fps -15%
Intel Core i5-13400
i5-13400, 2500 MHz
311 (310min - 312max) fps -17%
Intel Core i5-12400F
i5-12400F, 2500 MHz
252.5 (249min - 256max) fps -33%
Pass 2
Intel Core i9-14900K
i9-14900K, 3200 MHz
286.5 (285min - 287max) fps +63%
Intel Core i9-13900K
i9-13900K, 3000 MHz
267 (266min - 271max) fps +52%
AMD Ryzen 9 7950X
R9 7950X, 4500 MHz
266.5 (263min - 267max) fps +51%
AMD Ryzen 9 7950X3D
R9 7950X3D, 4200 MHz
265.5 (263min - 266max) fps +51%
Intel Core i7-14700K
i7-14700K, 2500 MHz
261 (259min - 262max) fps +48%
AMD Ryzen 9 7900X
R9 7900X, 4700 MHz
241 (240min - 242max) fps +37%
AMD Ryzen 9 5950X
R9 5950X, 3400 MHz
221 (220min - 221max) fps +26%
Intel Core i5-14600K
i5-14600K, 3500 MHz
209 (208min - 209max) fps +19%
Intel Core i9-12900K
i9-12900K, 3200 MHz
206 (206min - 206max) fps +17%
Intel Core i5-13600K
i5-13600K, 3500 MHz
199 (198.5min - 199.4max) fps +13%
AMD Ryzen 7 7700X
R7 7700X, 4500 MHz
181.2 (181min - 181.4max) fps +3%
AMD Ryzen 7 9700X
Ryzen 7 9700X, 3800 MHz
176.05 (175.9min - 176.1max) fps
AMD Ryzen 7 7800X3D
R7 7800X3D, 4200 MHz
169.25 (169.1min - 170max) fps -4%
AMD Ryzen 5 9600X
Ryzen 5 9600X, 3900 MHz
154 (153.4min - 154.3max) fps -13%
Intel Core i5-12600K
i5-12600K, 2800 MHz
148 (147min - 148max) fps -16%
AMD Ryzen 5 7600X
R5 7600X, 4700 MHz
147.8 (147.7min - 147.9max) fps -16%
Intel Core i5-13400
i5-13400, 2500 MHz
135.8 (135.7min - 135.9max) fps -23%
AMD Ryzen 5 5600X
R5 5600X, 3700 MHz
117 (117min - 117max) fps -34%
Intel Core i5-12400F
i5-12400F, 2500 MHz
101.35 (101.1min - 101.5max) fps -42%
HWBOT x265 Benchmark v2.2 - 4k Preset
AMD Ryzen 9 7950X
R9 7950X, 4500 MHz
44.4 fps +68%
Intel Core i9-14900K
i9-14900K, 3200 MHz
42.8 fps +62%
Intel Core i9-13900K
i9-13900K, 3000 MHz
42.6 fps +61%
AMD Ryzen 9 7950X3D
R9 7950X3D, 4200 MHz
42.4 fps +61%
Intel Core i7-14700K
i7-14700K, 2500 MHz
36.8 fps +39%
AMD Ryzen 9 7900X
R9 7900X, 4700 MHz
36.2 fps +37%
AMD Ryzen 9 5950X
R9 5950X, 3400 MHz
31.8 fps +20%
Intel Core i5-12600K
i5-12600K, 2800 MHz
30.1 fps +14%
Intel Core i9-12900K
i9-12900K, 3200 MHz
30 fps +14%
Intel Core i5-14600K
i5-14600K, 3500 MHz
28.6 fps +8%
Intel Core i5-13600K
i5-13600K, 3500 MHz
27.6 fps +5%
AMD Ryzen 7 9700X
Ryzen 7 9700X, 3800 MHz
26.4 fps
AMD Ryzen 7 7700X
R7 7700X, 4500 MHz
26.1 fps -1%
AMD Ryzen 7 7800X3D
R7 7800X3D, 4200 MHz
24.4 fps -8%
AMD Ryzen 5 9600X
Ryzen 5 9600X, 3900 MHz
23.2 fps -12%
AMD Ryzen 5 7600X
R5 7600X, 4700 MHz
21.1 fps -20%
Intel Core i5-13400
i5-13400, 2500 MHz
19.1 fps -28%
AMD Ryzen 5 5600X
R5 5600X, 3700 MHz
15.7 fps -41%
Intel Core i5-12400F
i5-12400F, 2500 MHz
15.2 fps -42%
WinRAR - Result
AMD Ryzen 9 7900X
R9 7900X, 4700 MHz
17225 KB/s +27%
AMD Ryzen 7 7800X3D
R7 7800X3D, 4200 MHz
16585 KB/s +22%
AMD Ryzen 9 7950X
R9 7950X, 4500 MHz
16351 KB/s +21%
AMD Ryzen 5 7600X
R5 7600X, 4700 MHz
16178 KB/s +19%
Intel Core i9-14900K
i9-14900K, 3200 MHz
16108 KB/s +19%
AMD Ryzen 9 7950X3D
R9 7950X3D, 4200 MHz
15779 KB/s +16%
AMD Ryzen 7 7700X
R7 7700X, 4500 MHz
14879 KB/s +10%
Intel Core i9-13900K
i9-13900K, 3000 MHz
14836 KB/s +9%
AMD Ryzen 5 9600X
Ryzen 5 9600X, 3900 MHz
14819 KB/s +9%
AMD Ryzen 7 9700X
Ryzen 7 9700X, 3800 MHz
13549 KB/s
AMD Ryzen 5 5600X
R5 5600X, 3700 MHz
13282 KB/s -2%
Intel Core i7-14700K
i7-14700K, 2500 MHz
12800 KB/s -6%
AMD Ryzen 9 5950X
R9 5950X, 3400 MHz
12503 KB/s -8%
Intel Core i5-14600K
i5-14600K, 3500 MHz
11491 KB/s -15%
Intel Core i5-13600K
i5-13600K, 3500 MHz
10937 KB/s -19%
Intel Core i9-12900K
i9-12900K, 3200 MHz
10792 KB/s -20%
Intel Core i5-13400
i5-13400, 2500 MHz
7979 KB/s -41%
Intel Core i5-12400F
i5-12400F, 2500 MHz
7816 KB/s -42%
Intel Core i5-12600K
i5-12600K, 2800 MHz
6239 KB/s -54%
TrueCrypt
AES Mean 100MB
AMD Ryzen 9 7950X
R9 7950X, 4500 MHz
30.7 GB/s +91%
Intel Core i9-13900K
i9-13900K, 3000 MHz
27 GB/s +68%
AMD Ryzen 9 5950X
R9 5950X, 3400 MHz
26.9 GB/s +67%
AMD Ryzen 9 7950X3D
R9 7950X3D, 4200 MHz
26.9 GB/s +67%
Intel Core i9-14900K
i9-14900K, 3200 MHz
26.7 GB/s +66%
Intel Core i7-14700K
i7-14700K, 2500 MHz
25.6 GB/s +59%
Intel Core i5-14600K
i5-14600K, 3500 MHz
19.5 GB/s +21%
Intel Core i5-13600K
i5-13600K, 3500 MHz
18.8 GB/s +17%
Intel Core i9-12900K
i9-12900K, 3200 MHz
18.5 GB/s +15%
AMD Ryzen 7 7700X
R7 7700X, 4500 MHz
17.5 GB/s +9%
AMD Ryzen 7 9700X
Ryzen 7 9700X, 3800 MHz
16.1 GB/s
AMD Ryzen 7 7800X3D
R7 7800X3D, 4200 MHz
15.3 GB/s -5%
AMD Ryzen 9 7900X
R9 7900X, 4700 MHz
14.8 GB/s -8%
AMD Ryzen 5 9600X
Ryzen 5 9600X, 3900 MHz
13.4 GB/s -17%
AMD Ryzen 5 7600X
R5 7600X, 4700 MHz
13.2 GB/s -18%
Intel Core i5-12600K
i5-12600K, 2800 MHz
12.8 GB/s -20%
Intel Core i5-13400
i5-13400, 2500 MHz
11.8 GB/s -27%
AMD Ryzen 5 5600X
R5 5600X, 3700 MHz
10.7 GB/s -34%
Intel Core i5-12400F
i5-12400F, 2500 MHz
9.3 GB/s -42%
Twofish Mean 100MB
Intel Core i9-14900K
i9-14900K, 3200 MHz
5.8 GB/s +107%
Intel Core i9-13900K
i9-13900K, 3000 MHz
5.4 GB/s +93%
Intel Core i7-14700K
i7-14700K, 2500 MHz
4.6 GB/s +64%
AMD Ryzen 9 7950X
R9 7950X, 4500 MHz
4.5 GB/s +61%
AMD Ryzen 9 7950X3D
R9 7950X3D, 4200 MHz
4.2 GB/s +50%
AMD Ryzen 9 5950X
R9 5950X, 3400 MHz
3.7 GB/s +32%
Intel Core i9-12900K
i9-12900K, 3200 MHz
3.7 GB/s +32%
Intel Core i5-14600K
i5-14600K, 3500 MHz
3.4 GB/s +21%
Intel Core i5-13600K
i5-13600K, 3500 MHz
3.1 GB/s +11%
AMD Ryzen 9 7900X
R9 7900X, 4700 MHz
2.8 GB/s 0%
AMD Ryzen 7 9700X
Ryzen 7 9700X, 3800 MHz
2.8 GB/s
AMD Ryzen 7 7700X
R7 7700X, 4500 MHz
2.3 GB/s -18%
Intel Core i5-12600K
i5-12600K, 2800 MHz
2.2 GB/s -21%
AMD Ryzen 5 9600X
Ryzen 5 9600X, 3900 MHz
2.2 GB/s -21%
AMD Ryzen 7 7800X3D
R7 7800X3D, 4200 MHz
2.1 GB/s -25%
Intel Core i5-13400
i5-13400, 2500 MHz
2 GB/s -29%
AMD Ryzen 5 7600X
R5 7600X, 4700 MHz
1.8 GB/s -36%
AMD Ryzen 5 5600X
R5 5600X, 3700 MHz
1.5 GB/s -46%
Intel Core i5-12400F
i5-12400F, 2500 MHz
1.4 GB/s -50%
Serpent Mean 100MB
Intel Core i9-13900K
i9-13900K, 3000 MHz
3 GB/s +76%
AMD Ryzen 9 7950X
R9 7950X, 4500 MHz
2.8 GB/s +65%
AMD Ryzen 9 7950X3D
R9 7950X3D, 4200 MHz
2.8 GB/s +65%
Intel Core i9-14900K
i9-14900K, 3200 MHz
2.8 GB/s +65%
Intel Core i7-14700K
i7-14700K, 2500 MHz
2.6 GB/s +53%
AMD Ryzen 9 5950X
R9 5950X, 3400 MHz
2.4 GB/s +41%
Intel Core i9-12900K
i9-12900K, 3200 MHz
1.9 GB/s +12%
Intel Core i5-14600K
i5-14600K, 3500 MHz
1.8 GB/s +6%
Intel Core i5-13600K
i5-13600K, 3500 MHz
1.7 GB/s 0%
AMD Ryzen 7 9700X
Ryzen 7 9700X, 3800 MHz
1.7 GB/s
AMD Ryzen 9 7900X
R9 7900X, 4700 MHz
1.5 GB/s -12%
AMD Ryzen 7 7700X
R7 7700X, 4500 MHz
1.4 GB/s -18%
AMD Ryzen 5 9600X
Ryzen 5 9600X, 3900 MHz
1.4 GB/s -18%
Intel Core i5-12600K
i5-12600K, 2800 MHz
1.3 GB/s -24%
AMD Ryzen 7 7800X3D
R7 7800X3D, 4200 MHz
1.3 GB/s -24%
Intel Core i5-13400
i5-13400, 2500 MHz
1.2 GB/s -29%
AMD Ryzen 5 7600X
R5 7600X, 4700 MHz
1.1 GB/s -35%
AMD Ryzen 5 5600X
R5 5600X, 3700 MHz
0.938 GB/s -45%
Intel Core i5-12400F
i5-12400F, 2500 MHz
0.884 GB/s -48%
Geekbench 4.4
64 Bit Single-Core Score
Intel Core i9-14900K
i9-14900K, 3200 MHz
9890 Points +1%
AMD Ryzen 7 9700X
Ryzen 7 9700X, 3800 MHz
9801 Points
AMD Ryzen 5 9600X
Ryzen 5 9600X, 3900 MHz
9757 Points 0%
Intel Core i9-13900K
i9-13900K, 3000 MHz
9598 Points -2%
AMD Ryzen 9 7950X
R9 7950X, 4500 MHz
9322 Points -5%
Intel Core i7-14700K
i7-14700K, 2500 MHz
9304 Points -5%
AMD Ryzen 9 7950X3D
R9 7950X3D, 4200 MHz
9240 Points -6%
AMD Ryzen 9 7900X
R9 7900X, 4700 MHz
9193 Points -6%
AMD Ryzen 7 7800X3D
R7 7800X3D, 4200 MHz
9097 Points -7%
AMD Ryzen 7 7700X
R7 7700X, 4500 MHz
8991 Points -8%
AMD Ryzen 5 7600X
R5 7600X, 4700 MHz
8926 Points -9%
Intel Core i5-14600K
i5-14600K, 3500 MHz
8904 Points -9%
Intel Core i9-12900K
i9-12900K, 3200 MHz
8665 Points -12%
Intel Core i5-13600K
i5-13600K, 3500 MHz
8618 Points -12%
Intel Core i5-12600K
i5-12600K, 2800 MHz
8223 Points -16%
Intel Core i5-13400
i5-13400, 2500 MHz
7683 Points -22%
Intel Core i5-12400F
i5-12400F, 2500 MHz
7548 Points -23%
AMD Ryzen 9 5950X
R9 5950X, 3400 MHz
7216 Points -26%
AMD Ryzen 5 5600X
R5 5600X, 3700 MHz
6953 Points -29%
64 Bit Multi-Core Score
AMD Ryzen 9 7950X
R9 7950X, 4500 MHz
89678 Points +50%
Intel Core i9-14900K
i9-14900K, 3200 MHz
89177 Points +50%
AMD Ryzen 9 7950X3D
R9 7950X3D, 4200 MHz
87922 Points +48%
Intel Core i9-13900K
i9-13900K, 3000 MHz
86695 Points +45%
Intel Core i7-14700K
i7-14700K, 2500 MHz
79501 Points +33%
AMD Ryzen 9 7900X
R9 7900X, 4700 MHz
74731 Points +25%
Intel Core i5-14600K
i5-14600K, 3500 MHz
64035 Points +7%
Intel Core i9-12900K
i9-12900K, 3200 MHz
63583 Points +7%
AMD Ryzen 9 5950X
R9 5950X, 3400 MHz
63233 Points +6%
Intel Core i5-13600K
i5-13600K, 3500 MHz
60407 Points +1%
AMD Ryzen 7 9700X
Ryzen 7 9700X, 3800 MHz
59594 Points
AMD Ryzen 7 7700X
R7 7700X, 4500 MHz
56909 Points -5%
AMD Ryzen 7 7800X3D
R7 7800X3D, 4200 MHz
54840 Points -8%
AMD Ryzen 5 9600X
Ryzen 5 9600X, 3900 MHz
51644 Points -13%
AMD Ryzen 5 7600X
R5 7600X, 4700 MHz
47407 Points -20%
Intel Core i5-12600K
i5-12600K, 2800 MHz
46557 Points -22%
Intel Core i5-13400
i5-13400, 2500 MHz
42509 Points -29%
AMD Ryzen 5 5600X
R5 5600X, 3700 MHz
35617 Points -40%
Intel Core i5-12400F
i5-12400F, 2500 MHz
35098 Points -41%
Geekbench 5.0
5.0 Multi-Core
Intel Core i9-14900K
i9-14900K, 3200 MHz
25459 Points +73%
AMD Ryzen 9 7950X
R9 7950X, 4500 MHz
24479 Points +67%
Intel Core i9-13900K
i9-13900K, 3000 MHz
24021 Points +63%
AMD Ryzen 9 7950X3D
R9 7950X3D, 4200 MHz
23720 Points +61%
Intel Core i7-14700K
i7-14700K, 2500 MHz
22756 Points +55%
AMD Ryzen 9 7900X
R9 7900X, 4700 MHz
19975 Points +36%
Intel Core i9-12900K
i9-12900K, 3200 MHz
17959 Points +22%
Intel Core i5-14600K
i5-14600K, 3500 MHz
17374 Points +18%
Intel Core i5-13600K
i5-13600K, 3500 MHz
16635 Points +13%
AMD Ryzen 9 5950X
R9 5950X, 3400 MHz
16570 Points +13%
AMD Ryzen 7 9700X
Ryzen 7 9700X, 3800 MHz
14698 Points
AMD Ryzen 7 7700X
R7 7700X, 4500 MHz
14215 Points -3%
AMD Ryzen 7 7800X3D
R7 7800X3D, 4200 MHz
13888 Points -6%
Intel Core i5-12600K
i5-12600K, 2800 MHz
12746 Points -13%
AMD Ryzen 5 9600X
Ryzen 5 9600X, 3900 MHz
12556 Points -15%
AMD Ryzen 5 7600X
R5 7600X, 4700 MHz
11880 Points -19%
Intel Core i5-13400
i5-13400, 2500 MHz
11801 Points -20%
Intel Core i5-12400F
i5-12400F, 2500 MHz
9368 Points -36%
AMD Ryzen 5 5600X
R5 5600X, 3700 MHz
8926 Points -39%
5.0 Single-Core
AMD Ryzen 7 9700X
Ryzen 7 9700X, 3800 MHz
2402 Points
AMD Ryzen 5 9600X
Ryzen 5 9600X, 3900 MHz
2397 Points 0%
Intel Core i9-14900K
i9-14900K, 3200 MHz
2272 Points -5%
AMD Ryzen 9 7950X
R9 7950X, 4500 MHz
2222 Points -7%
Intel Core i9-13900K
i9-13900K, 3000 MHz
2214 Points -8%
AMD Ryzen 9 7900X
R9 7900X, 4700 MHz
2194 Points -9%
AMD Ryzen 9 7950X3D
R9 7950X3D, 4200 MHz
2183 Points -9%
AMD Ryzen 5 7600X
R5 7600X, 4700 MHz
2126 Points -11%
AMD Ryzen 7 7700X
R7 7700X, 4500 MHz
2123 Points -12%
Intel Core i7-14700K
i7-14700K, 2500 MHz
2045 Points -15%
Intel Core i5-14600K
i5-14600K, 3500 MHz
2004 Points -17%
Intel Core i9-12900K
i9-12900K, 3200 MHz
1968 Points -18%
AMD Ryzen 7 7800X3D
R7 7800X3D, 4200 MHz
1938 Points -19%
Intel Core i5-13600K
i5-13600K, 3500 MHz
1931 Points -20%
Intel Core i5-12600K
i5-12600K, 2800 MHz
1821 Points -24%
Intel Core i5-13400
i5-13400, 2500 MHz
1706 Points -29%
AMD Ryzen 9 5950X
R9 5950X, 3400 MHz
1683 Points -30%
Intel Core i5-12400F
i5-12400F, 2500 MHz
1673 Points -30%
AMD Ryzen 5 5600X
R5 5600X, 3700 MHz
1587 Points -34%
Geekbench 5.5
Multi-Core
Intel Core i9-14900K
i9-14900K, 3200 MHz
25867 Points +77%
AMD Ryzen 9 7950X
R9 7950X, 4500 MHz
24625 Points +69%
AMD Ryzen 9 7950X3D
R9 7950X3D, 4200 MHz
24343 Points +67%
Intel Core i9-13900K
i9-13900K, 3000 MHz
24157 Points +65%
Intel Core i7-14700K
i7-14700K, 2500 MHz
23159 Points +58%
AMD Ryzen 9 7900X
R9 7900X, 4700 MHz
19987 Points +37%
Intel Core i9-12900K
i9-12900K, 3200 MHz
17854 Points +22%
Intel Core i5-14600K
i5-14600K, 3500 MHz
17516 Points +20%
AMD Ryzen 9 5950X
R9 5950X, 3400 MHz
16891 Points +16%
Intel Core i5-13600K
i5-13600K, 3500 MHz
16651 Points +14%
AMD Ryzen 7 9700X
Ryzen 7 9700X, 3800 MHz
14613 Points
AMD Ryzen 7 7700X
R7 7700X, 4500 MHz
14373 Points -2%
AMD Ryzen 7 7800X3D
R7 7800X3D, 4200 MHz
14252 Points -2%
Intel Core i5-12600K
i5-12600K, 2800 MHz
12797 Points -12%
AMD Ryzen 5 9600X
Ryzen 5 9600X, 3900 MHz
12751 Points -13%
Intel Core i5-13400
i5-13400, 2500 MHz
12107 Points -17%
AMD Ryzen 5 7600X
R5 7600X, 4700 MHz
11917 Points -18%
Intel Core i5-12400F
i5-12400F, 2500 MHz
9517 Points -35%
AMD Ryzen 5 5600X
R5 5600X, 3700 MHz
8980 Points -39%
Single-Core
AMD Ryzen 5 9600X
Ryzen 5 9600X, 3900 MHz
2523 Points +1%
AMD Ryzen 7 9700X
Ryzen 7 9700X, 3800 MHz
2507 Points
AMD Ryzen 9 7950X
R9 7950X, 4500 MHz
2311 Points -8%
AMD Ryzen 9 7950X3D
R9 7950X3D, 4200 MHz
2311 Points -8%
Intel Core i9-13900K
i9-13900K, 3000 MHz
2290 Points -9%
AMD Ryzen 9 7900X
R9 7900X, 4700 MHz
2274 Points -9%
Intel Core i9-14900K
i9-14900K, 3200 MHz
2243 Points -11%
AMD Ryzen 7 7700X
R7 7700X, 4500 MHz
2218 Points -12%
AMD Ryzen 5 7600X
R5 7600X, 4700 MHz
2205 Points -12%
Intel Core i7-14700K
i7-14700K, 2500 MHz
2121 Points -15%
Intel Core i9-12900K
i9-12900K, 3200 MHz
2042 Points -19%
AMD Ryzen 7 7800X3D
R7 7800X3D, 4200 MHz
2027 Points -19%
Intel Core i5-14600K
i5-14600K, 3500 MHz
2017 Points -20%
Intel Core i5-13600K
i5-13600K, 3500 MHz
1967 Points -22%
Intel Core i5-12600K
i5-12600K, 2800 MHz
1904 Points -24%
Intel Core i5-13400
i5-13400, 2500 MHz
1795 Points -28%
Intel Core i5-12400F
i5-12400F, 2500 MHz
1742 Points -31%
AMD Ryzen 9 5950X
R9 5950X, 3400 MHz
1682 Points -33%
AMD Ryzen 5 5600X
R5 5600X, 3700 MHz
1657 Points -34%
7-Zip 18.03
7z b 4
AMD Ryzen 9 7950X
R9 7950X, 4500 MHz
161724 MIPS +96%
AMD Ryzen 9 7950X3D
R9 7950X3D, 4200 MHz
159341 MIPS +93%
Intel Core i9-14900K
i9-14900K, 3200 MHz
149570 MIPS +81%
Intel Core i9-13900K
i9-13900K, 3000 MHz
147068 MIPS +78%
Intel Core i7-14700K
i7-14700K, 2500 MHz
135648 MIPS +64%
AMD Ryzen 9 5950X
R9 5950X, 3400 MHz
127792 MIPS +55%
AMD Ryzen 9 7900X
R9 7900X, 4700 MHz
124975 MIPS +51%
Intel Core i9-12900K
i9-12900K, 3200 MHz
97671 MIPS +18%
Intel Core i5-14600K
i5-14600K, 3500 MHz
93235 MIPS +13%
Intel Core i5-13600K
i5-13600K, 3500 MHz
89647 MIPS +9%
AMD Ryzen 7 7700X
R7 7700X, 4500 MHz
85789 MIPS +4%
AMD Ryzen 7 7800X3D
R7 7800X3D, 4200 MHz
85067 MIPS +3%
AMD Ryzen 7 9700X
Ryzen 7 9700X, 3800 MHz
82553 MIPS
AMD Ryzen 5 7600X
R5 7600X, 4700 MHz
69291 MIPS -16%
AMD Ryzen 5 9600X
Ryzen 5 9600X, 3900 MHz
68220 MIPS -17%
Intel Core i5-12600K
i5-12600K, 2800 MHz
64260 MIPS -22%
Intel Core i5-13400
i5-13400, 2500 MHz
59510 MIPS -28%
AMD Ryzen 5 5600X
R5 5600X, 3700 MHz
56607 MIPS -31%
Intel Core i5-12400F
i5-12400F, 2500 MHz
45043 MIPS -45%
7z b 4 -mmt1
AMD Ryzen 9 7950X
R9 7950X, 4500 MHz
8365 MIPS +6%
AMD Ryzen 9 7950X3D
R9 7950X3D, 4200 MHz
8321 MIPS +5%
AMD Ryzen 9 7900X
R9 7900X, 4700 MHz
8282 MIPS +5%
AMD Ryzen 7 7800X3D
R7 7800X3D, 4200 MHz
8235 MIPS +4%
AMD Ryzen 7 7700X
R7 7700X, 4500 MHz
8096 MIPS +3%
AMD Ryzen 5 7600X
R5 7600X, 4700 MHz
8063 MIPS +2%
AMD Ryzen 7 9700X
Ryzen 7 9700X, 3800 MHz
7894 MIPS
AMD Ryzen 5 9600X
Ryzen 5 9600X, 3900 MHz
7796 MIPS -1%
Intel Core i9-14900K
i9-14900K, 3200 MHz
7772 MIPS -2%
Intel Core i7-14700K
i7-14700K, 2500 MHz
7351 MIPS -7%
Intel Core i9-13900K
i9-13900K, 3000 MHz
7272 MIPS -8%
AMD Ryzen 9 5950X
R9 5950X, 3400 MHz
6974 MIPS -12%
Intel Core i5-14600K
i5-14600K, 3500 MHz
6910 MIPS -12%
AMD Ryzen 5 5600X
R5 5600X, 3700 MHz
6594 MIPS -16%
Intel Core i9-12900K
i9-12900K, 3200 MHz
6571 MIPS -17%
Intel Core i5-13600K
i5-13600K, 3500 MHz
6502 MIPS -18%
Intel Core i5-12600K
i5-12600K, 2800 MHz
5944 MIPS -25%
Intel Core i5-13400
i5-13400, 2500 MHz
5829 MIPS -26%
Intel Core i5-12400F
i5-12400F, 2500 MHz
5476 MIPS -31%
R Benchmark 2.5 - Overall mean
Intel Core i5-12400F
i5-12400F, 2500 MHz
0.4837 sec * -42%
AMD Ryzen 5 5600X
R5 5600X, 3700 MHz
0.4778 sec * -40%
Intel Core i5-13400
i5-13400, 2500 MHz
0.4654 sec * -36%
AMD Ryzen 9 5950X
R9 5950X, 3400 MHz
0.4556 sec * -33%
Intel Core i5-12600K
i5-12600K, 2800 MHz
0.4456 sec * -31%
Intel Core i9-12900K
i9-12900K, 3200 MHz
0.4216 sec * -23%
AMD Ryzen 7 7800X3D
R7 7800X3D, 4200 MHz
0.4152 sec * -22%
Intel Core i5-13600K
i5-13600K, 3500 MHz
0.405 sec * -19%
Intel Core i5-14600K
i5-14600K, 3500 MHz
0.3937 sec * -15%
Intel Core i7-14700K
i7-14700K, 2500 MHz
0.3826 sec * -12%
AMD Ryzen 7 7700X
R7 7700X, 4500 MHz
0.3758 sec * -10%
AMD Ryzen 5 7600X
R5 7600X, 4700 MHz
0.3749 sec * -10%
AMD Ryzen 9 7900X
R9 7900X, 4700 MHz
0.3736 sec * -9%
AMD Ryzen 9 7950X3D
R9 7950X3D, 4200 MHz
0.372 sec * -9%
AMD Ryzen 9 7950X
R9 7950X, 4500 MHz
0.3682 sec * -8%
Intel Core i9-13900K
i9-13900K, 3000 MHz
0.3539 sec * -4%
Intel Core i9-14900K
i9-14900K, 3200 MHz
0.345 sec * -1%
AMD Ryzen 7 9700X
Ryzen 7 9700X, 3800 MHz
0.3414 sec *
AMD Ryzen 5 9600X
Ryzen 5 9600X, 3900 MHz
0.3389 sec * +1%
LibreOffice - 20 Documents To PDF
Intel Core i5-12600K
i5-12600K, 2800 MHz
71.8 s * -64%
Intel Core i5-12400F
i5-12400F, 2500 MHz
46.5 s * -6%
AMD Ryzen 5 9600X
Ryzen 5 9600X, 3900 MHz
46.4 s * -6%
AMD Ryzen 9 5950X
R9 5950X, 3400 MHz
45.97 s * -5%
AMD Ryzen 5 5600X
R5 5600X, 3700 MHz
45.14 s * -3%
AMD Ryzen 7 9700X
Ryzen 7 9700X, 3800 MHz
43.8 s *
AMD Ryzen 7 7800X3D
R7 7800X3D, 4200 MHz
40.7 s * +7%
Intel Core i9-12900K
i9-12900K, 3200 MHz
40.6 s * +7%
Intel Core i7-14700K
i7-14700K, 2500 MHz
39.8 s * +9%
Intel Core i5-13400
i5-13400, 2500 MHz
38.7 s * +12%
AMD Ryzen 9 7950X3D
R9 7950X3D, 4200 MHz
38.6 s * +12%
AMD Ryzen 5 7600X
R5 7600X, 4700 MHz
36.8 s * +16%
Intel Core i9-13900K
i9-13900K, 3000 MHz
36.6 s * +16%
AMD Ryzen 9 7950X
R9 7950X, 4500 MHz
35.5 s * +19%
Intel Core i5-13600K
i5-13600K, 3500 MHz
35 s * +20%
AMD Ryzen 9 7900X
R9 7900X, 4700 MHz
34.9 s * +20%
AMD Ryzen 7 7700X
R7 7700X, 4500 MHz
33.6 s * +23%
Intel Core i9-14900K
i9-14900K, 3200 MHz
32.5 s * +26%
Intel Core i5-14600K
i5-14600K, 3500 MHz
31.9 s * +27%
WebXPRT 3 - Overall
AMD Ryzen 7 9700X
Ryzen 7 9700X, 3800 MHz
398 Points
AMD Ryzen 9 7950X3D
R9 7950X3D, 4200 MHz
383 Points -4%
Intel Core i9-14900K
i9-14900K, 3200 MHz
382 Points -4%
AMD Ryzen 9 7900X
R9 7900X, 4700 MHz
371 Points -7%
AMD Ryzen 9 7950X
R9 7950X, 4500 MHz
366 Points -8%
AMD Ryzen 5 9600X
Ryzen 5 9600X, 3900 MHz
364 Points -9%
AMD Ryzen 5 7600X
R5 7600X, 4700 MHz
362 Points -9%
Intel Core i9-13900K
i9-13900K, 3000 MHz
361 Points -9%
AMD Ryzen 7 7700X
R7 7700X, 4500 MHz
355 Points -11%
Intel Core i5-14600K
i5-14600K, 3500 MHz
354 Points -11%
AMD Ryzen 7 7800X3D
R7 7800X3D, 4200 MHz
353 Points -11%
Intel Core i7-14700K
i7-14700K, 2500 MHz
339 Points -15%
Intel Core i5-13600K
i5-13600K, 3500 MHz
333 Points -16%
Intel Core i9-12900K
i9-12900K, 3200 MHz
320 Points -20%
Intel Core i5-13400
i5-13400, 2500 MHz
306 Points -23%
Intel Core i5-12600K
i5-12600K, 2800 MHz
293 Points -26%
AMD Ryzen 9 5950X
R9 5950X, 3400 MHz
291 Points -27%
AMD Ryzen 5 5600X
R5 5600X, 3700 MHz
286 Points -28%
Intel Core i5-12400F
i5-12400F, 2500 MHz
272 Points -32%
Mozilla Kraken 1.1 - Total
AMD Ryzen 5 5600X
R5 5600X, 3700 MHz
578 ms * -51%
Intel Core i5-12400F
i5-12400F, 2500 MHz
573 ms * -50%
AMD Ryzen 9 5950X
R9 5950X, 3400 MHz
558 ms * -46%
Intel Core i5-13400
i5-13400, 2500 MHz
535 ms * -40%
Intel Core i5-12600K
i5-12600K, 2800 MHz
511 ms * -33%
AMD Ryzen 7 7800X3D
R7 7800X3D, 4200 MHz
487 ms * -27%
Intel Core i9-12900K
i9-12900K, 3200 MHz
481 ms * -26%
Intel Core i5-13600K
i5-13600K, 3500 MHz
469 ms * -22%
Intel Core i5-14600K
i5-14600K, 3500 MHz
450 ms * -17%
AMD Ryzen 5 7600X
R5 7600X, 4700 MHz
441 ms * -15%
AMD Ryzen 7 7700X
R7 7700X, 4500 MHz
440 ms * -15%
Intel Core i7-14700K
i7-14700K, 2500 MHz
439 ms * -15%
AMD Ryzen 9 7950X3D
R9 7950X3D, 4200 MHz
437 ms * -14%
AMD Ryzen 9 7950X
R9 7950X, 4500 MHz
433 ms * -13%
Intel Core i9-13900K
i9-13900K, 3000 MHz
432 ms * -13%
AMD Ryzen 9 7900X
R9 7900X, 4700 MHz
431 ms * -13%
Intel Core i9-14900K
i9-14900K, 3200 MHz
418 ms * -9%
AMD Ryzen 5 9600X
Ryzen 5 9600X, 3900 MHz
389 ms * -2%
AMD Ryzen 7 9700X
Ryzen 7 9700X, 3800 MHz
383 ms *
V-Ray Benchmark Next 4.10 - CPU
AMD Ryzen 9 7950X
R9 7950X, 4500 MHz
43529 ksamples +85%
AMD Ryzen 9 7950X3D
R9 7950X3D, 4200 MHz
42381 ksamples +80%
Intel Core i9-14900K
i9-14900K, 3200 MHz
40942 ksamples +74%
Intel Core i9-13900K
i9-13900K, 3000 MHz
40076 ksamples +70%
Intel Core i7-14700K
i7-14700K, 2500 MHz
35640 ksamples +51%
AMD Ryzen 9 7900X
R9 7900X, 4700 MHz
32353 ksamples +37%
AMD Ryzen 9 5950X
R9 5950X, 3400 MHz
31445 ksamples +33%
Intel Core i9-12900K
i9-12900K, 3200 MHz
27376 ksamples +16%
Intel Core i5-14600K
i5-14600K, 3500 MHz
24871 ksamples +5%
Intel Core i5-13600K
i5-13600K, 3500 MHz
24288 ksamples +3%
AMD Ryzen 7 9700X
Ryzen 7 9700X, 3800 MHz
23591 ksamples
AMD Ryzen 7 7700X
R7 7700X, 4500 MHz
22142 ksamples -6%
AMD Ryzen 5 9600X
Ryzen 5 9600X, 3900 MHz
19653 ksamples -17%
Intel Core i5-12600K
i5-12600K, 2800 MHz
17739 ksamples -25%
AMD Ryzen 5 7600X
R5 7600X, 4700 MHz
17582 ksamples -25%
Intel Core i5-13400
i5-13400, 2500 MHz
16383 ksamples -31%
AMD Ryzen 5 5600X
R5 5600X, 3700 MHz
13511 ksamples -43%
Intel Core i5-12400F
i5-12400F, 2500 MHz
10090 ksamples -57%
V-Ray 5 Benchmark - CPU
AMD Ryzen 9 7950X
R9 7950X, 4500 MHz
29602 mpaths +89%
AMD Ryzen 9 7950X3D
R9 7950X3D, 4200 MHz
28258 mpaths +81%
Intel Core i9-13900K
i9-13900K, 3000 MHz
27447 mpaths +75%
Intel Core i9-14900K
i9-14900K, 3200 MHz
27341 mpaths +75%
Intel Core i7-14700K
i7-14700K, 2500 MHz
23557 mpaths +51%
AMD Ryzen 9 7900X
R9 7900X, 4700 MHz
22376 mpaths +43%
Intel Core i9-12900K
i9-12900K, 3200 MHz
18056 mpaths +15%
Intel Core i5-14600K
i5-14600K, 3500 MHz
16552 mpaths +6%
Intel Core i5-13600K
i5-13600K, 3500 MHz
16034 mpaths +2%
AMD Ryzen 7 9700X
Ryzen 7 9700X, 3800 MHz
15648 mpaths
AMD Ryzen 7 7800X3D
R7 7800X3D, 4200 MHz
14397 mpaths -8%
AMD Ryzen 5 9600X
Ryzen 5 9600X, 3900 MHz
13355 mpaths -15%
Intel Core i5-12600K
i5-12600K, 2800 MHz
11579 mpaths -26%
AMD Ryzen 5 7600X
R5 7600X, 4700 MHz
11563 mpaths -26%
Intel Core i5-13400
i5-13400, 2500 MHz
10830 mpaths -31%
Intel Core i5-12400F
i5-12400F, 2500 MHz
8648 mpaths -45%
wPrime 2.10
32m
Intel Core i9-12900K
i9-12900K, 3200 MHz
4.924 s * -109%
Intel Core i5-12600K
i5-12600K, 2800 MHz
4.725 s * -100%
Intel Core i5-12400F
i5-12400F, 2500 MHz
4.078 s * -73%
AMD Ryzen 5 5600X
R5 5600X, 3700 MHz
3.891 s * -65%
Intel Core i5-13400
i5-13400, 2500 MHz
3.474 s * -47%
AMD Ryzen 5 7600X
R5 7600X, 4700 MHz
2.78 s * -18%
AMD Ryzen 5 9600X
Ryzen 5 9600X, 3900 MHz
2.617 s * -11%
AMD Ryzen 9 5950X
R9 5950X, 3400 MHz
2.538 s * -8%
Intel Core i5-13600K
i5-13600K, 3500 MHz
2.527 s * -7%
AMD Ryzen 7 7800X3D
R7 7800X3D, 4200 MHz
2.435 s * -3%
Intel Core i5-14600K
i5-14600K, 3500 MHz
2.39 s * -1%
AMD Ryzen 7 9700X
Ryzen 7 9700X, 3800 MHz
2.36 s *
AMD Ryzen 7 7700X
R7 7700X, 4500 MHz
2.154 s * +9%
Intel Core i7-14700K
i7-14700K, 2500 MHz
2.147 s * +9%
Intel Core i9-14900K
i9-14900K, 3200 MHz
2.07 s * +12%
AMD Ryzen 9 7950X3D
R9 7950X3D, 4200 MHz
2.007 s * +15%
Intel Core i9-13900K
i9-13900K, 3000 MHz
1.818 s * +23%
AMD Ryzen 9 7900X
R9 7900X, 4700 MHz
1.781 s * +25%
AMD Ryzen 9 7950X
R9 7950X, 4500 MHz
1.669 s * +29%
1024m
Intel Core i5-13400
i5-13400, 2500 MHz
452.309 s * -659%
Intel Core i5-12600K
i5-12600K, 2800 MHz
202.7 s * -240%
Intel Core i9-12900K
i9-12900K, 3200 MHz
190.6 s * -220%
Intel Core i5-13600K
i5-13600K, 3500 MHz
177.592 s * -198%
Intel Core i5-14600K
i5-14600K, 3500 MHz
158.77 s * -167%
AMD Ryzen 5 5600X
R5 5600X, 3700 MHz
113.9 s * -91%
Intel Core i5-12400F
i5-12400F, 2500 MHz
112.849 s * -89%
Intel Core i7-14700K
i7-14700K, 2500 MHz
109.801 s * -84%
Intel Core i9-13900K
i9-13900K, 3000 MHz
79.738 s * -34%
AMD Ryzen 5 7600X
R5 7600X, 4700 MHz
74.491 s * -25%
Intel Core i9-14900K
i9-14900K, 3200 MHz
74.47 s * -25%
AMD Ryzen 5 9600X
Ryzen 5 9600X, 3900 MHz
72.546 s * -22%
AMD Ryzen 9 5950X
R9 5950X, 3400 MHz
64.9 s * -9%
AMD Ryzen 7 7800X3D
R7 7800X3D, 4200 MHz
62.733 s * -5%
AMD Ryzen 7 7700X
R7 7700X, 4500 MHz
61.148 s * -3%
AMD Ryzen 7 9700X
Ryzen 7 9700X, 3800 MHz
59.56 s *
AMD Ryzen 9 7900X
R9 7900X, 4700 MHz
39.954 s * +33%
AMD Ryzen 9 7950X3D
R9 7950X3D, 4200 MHz
33.879 s * +43%
AMD Ryzen 9 7950X
R9 7950X, 4500 MHz
30.811 s * +48%
Super Pi mod 1.5 XS 1M - 1M
Intel Core i5-12400F
i5-12400F, 2500 MHz
8.298 s * -10%
AMD Ryzen 5 5600X
R5 5600X, 3700 MHz
8.083 s * -7%
Intel Core i5-13400
i5-13400, 2500 MHz
8.033 s * -7%
AMD Ryzen 5 9600X
Ryzen 5 9600X, 3900 MHz
7.614 s * -1%
AMD Ryzen 7 9700X
Ryzen 7 9700X, 3800 MHz
7.54 s *
AMD Ryzen 5 7600X
R5 7600X, 4700 MHz
7.423 s * +2%
Intel Core i5-12600K
i5-12600K, 2800 MHz
7.406 s * +2%
AMD Ryzen 7 7800X3D
R7 7800X3D, 4200 MHz
7.089 s * +6%
AMD Ryzen 9 5950X
R9 5950X, 3400 MHz
7.065 s * +6%
Intel Core i9-12900K
i9-12900K, 3200 MHz
7.063 s * +6%
Intel Core i5-13600K
i5-13600K, 3500 MHz
6.58 s * +13%
AMD Ryzen 7 7700X
R7 7700X, 4500 MHz
6.349 s * +16%
Intel Core i5-14600K
i5-14600K, 3500 MHz
6.234 s * +17%
AMD Ryzen 9 7900X
R9 7900X, 4700 MHz
6.141 s * +19%
AMD Ryzen 9 7950X3D
R9 7950X3D, 4200 MHz
6.109 s * +19%
AMD Ryzen 9 7950X
R9 7950X, 4500 MHz
6.088 s * +19%
Intel Core i7-14700K
i7-14700K, 2500 MHz
5.98 s * +21%
Intel Core i9-13900K
i9-13900K, 3000 MHz
5.655 s * +25%
Intel Core i9-14900K
i9-14900K, 3200 MHz
5.476 s * +27%
Super Pi mod 1.5 XS 2M - 2M
Intel Core i5-12400F
i5-12400F, 2500 MHz
18.473 s * -15%
Intel Core i5-13400
i5-13400, 2500 MHz
17.963 s * -12%
AMD Ryzen 5 5600X
R5 5600X, 3700 MHz
17.46 s * -8%
Intel Core i5-12600K
i5-12600K, 2800 MHz
16.42 s * -2%
AMD Ryzen 5 9600X
Ryzen 5 9600X, 3900 MHz
16.363 s * -2%
AMD Ryzen 7 9700X
Ryzen 7 9700X, 3800 MHz
16.1 s *
AMD Ryzen 5 7600X
R5 7600X, 4700 MHz
15.954 s * +1%
Intel Core i9-12900K
i9-12900K, 3200 MHz
15.59 s * +3%
AMD Ryzen 7 7800X3D
R7 7800X3D, 4200 MHz
15.335 s * +5%
AMD Ryzen 9 5950X
R9 5950X, 3400 MHz
15.28 s * +5%
Intel Core i5-13600K
i5-13600K, 3500 MHz
14.876 s * +8%
Intel Core i5-14600K
i5-14600K, 3500 MHz
13.657 s * +15%
AMD Ryzen 7 7700X
R7 7700X, 4500 MHz
13.641 s * +15%
AMD Ryzen 9 7950X
R9 7950X, 4500 MHz
13.291 s * +17%
AMD Ryzen 9 7900X
R9 7900X, 4700 MHz
13.251 s * +18%
Intel Core i9-13900K
i9-13900K, 3000 MHz
13.193 s * +18%
AMD Ryzen 9 7950X3D
R9 7950X3D, 4200 MHz
13.189 s * +18%
Intel Core i7-14700K
i7-14700K, 2500 MHz
12.844 s * +20%
Intel Core i9-14900K
i9-14900K, 3200 MHz
11.996 s * +25%
Super Pi Mod 1.5 XS 32M - 32M
Intel Core i5-12400F
i5-12400F, 2500 MHz
438.444 s * -19%
Intel Core i5-13400
i5-13400, 2500 MHz
427.158 s * -16%
AMD Ryzen 5 5600X
R5 5600X, 3700 MHz
400.9 s * -8%
AMD Ryzen 7 9700X
Ryzen 7 9700X, 3800 MHz
369.69 s *
AMD Ryzen 5 7600X
R5 7600X, 4700 MHz
367.068 s * +1%
Intel Core i5-12600K
i5-12600K, 2800 MHz
363.2 s * +2%
AMD Ryzen 5 9600X
Ryzen 5 9600X, 3900 MHz
360.414 s * +3%
AMD Ryzen 9 5950X
R9 5950X, 3400 MHz
349.3 s * +6%
Intel Core i9-12900K
i9-12900K, 3200 MHz
338.6 s * +8%
AMD Ryzen 7 7800X3D
R7 7800X3D, 4200 MHz
337.57 s * +9%
Intel Core i5-13600K
i5-13600K, 3500 MHz
328.929 s * +11%
AMD Ryzen 7 7700X
R7 7700X, 4500 MHz
322.796 s * +13%
Intel Core i5-14600K
i5-14600K, 3500 MHz
316.69 s * +14%
AMD Ryzen 9 7900X
R9 7900X, 4700 MHz
313.437 s * +15%
AMD Ryzen 9 7950X
R9 7950X, 4500 MHz
309.009 s * +16%
Intel Core i7-14700K
i7-14700K, 2500 MHz
305.942 s * +17%
AMD Ryzen 9 7950X3D
R9 7950X3D, 4200 MHz
305.11 s * +17%
Intel Core i9-13900K
i9-13900K, 3000 MHz
290.571 s * +21%
Intel Core i9-14900K
i9-14900K, 3200 MHz
280.25 s * +24%

* ... kleiner is beter

Cinebench R15 meervoudige lus

AMD levert geen koeler in de doos voor de Ryzen 7 9700X. Wij raden aan om voor een geschikte lucht- of AIO-vloeistofkoeling te kiezen, zodat de CPU zijn spieren volledig kan laten werken.

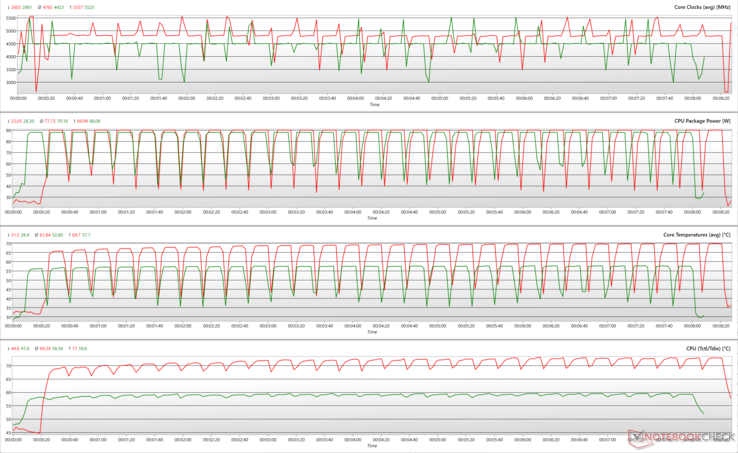
De Ryzen 7 9700X levert goed volgehouden, gasloze prestaties tijdens een Cinebench R15 multi-core loop-test met de Thermaltake TH420 V2 Ultra EX ARGB AIO.

01603204806408009601120128014401600176019202080224024002560272028803040Tooltip
AMD Ryzen 7 9700X AMD Ryzen 7 9700X: Ø3093 (3067.25-3120.37)
AMD Ryzen 5 9600X AMD Ryzen 5 9600X: Ø2623 (2586.99-2654.28)

Tijdens het uitvoeren van de Cinebench R15 multi-core loop kan de Ryzen 7 9700X 5,5 GHz boosts bereiken bij een verbruik van 88 W. Bij deze frequentie zijn de gemiddelde kerntemperaturen 57,7 °C, met een piek van Tdie op 59,6 °C. De cores halen gemiddeld 4,4 GHz bij 79 W en 52,8 °C tijdens de run.

In vergelijking met de Ryzen 7 7700X die beperkt was tot 65 W, laat de Ryzen 7 9700X bijna identieke klokken en stroomverbruik zien. De Ryzen 7 9700X bereikt deze waarden echter bij een aanzienlijk lagere bedrijfstemperatuur in vergelijking met zijn Zen 4-tegenhanger.

CPU-parameters tijdens Cinebench R15 multi-core loop (Rood: AMD Ryzen 7 7700X, Groen: Ryzen 7 9700X)
Cinebench R10 Rendering Single CPUs 64Bit
17765 Points
Cinebench R10 Rendering Multiple CPUs 64Bit
108170 Points
Cinebench R10 Shading 32Bit
16299
Cinebench R10 Rendering Multiple CPUs 32Bit
57914
Cinebench R10 Rendering Single 32Bit
9457
Cinebench R10 Shading 64Bit
16370 Points
Cinebench R11.5 CPU Multi 64Bit
36.24 Points
Cinebench R11.5 CPU Single 64Bit
4.06 Points
Cinebench R11.5 OpenGL 64Bit
245.39 fps
Cinebench R15 CPU Multi 64Bit
3178 Points
Cinebench R15 OpenGL 64Bit
423 fps
Cinebench R15 Ref. Match 64Bit
99.6 %
Cinebench R15 CPU Single 64Bit
346 Points
Cinebench R20 CPU (Single Core)
870 Points
Cinebench R20 CPU (Multi Core)
7956 Points
Cinebench R23 Multi Core
20485 Points
Cinebench R23 Single Core
2211 Points
Cinebench 2024 CPU Single Core
136 Points
Cinebench 2024 CPU Multi Core
1203 Points
Help

Systeemprestaties: Over het geheel genomen niet ver van de Ryzen 9 7900X en Ryzen 9 7950X3D

De AMD Ryzen 7 9700X kan dagelijkse productiviteitstoepassingen met gemak aan. De Zen 5 CPU staat bovenaan de ranglijst in PCMark 10 algemene prestaties en verslaat zelfs de Core i9-14900K met 6%. In CrossMark ligt de Ryzen 7 9700X echter 17% achter op het vlaggenschip van Intel.

De AIDA64 CPU-tests laten een gemengd beeld zien. Hoewel de Ryzen 7 9700X niet echt een topper op de grafiek is, verslaat hij de Core i5-14600K en zelfs de Core i9-14900K overtuigend in CPU AES, FP32 Ray-Trace en FP64 Ray-Trace tests, terwijl hij alleen achterblijft bij de Ryzen 9 7950X en de Ryzen 9 7950X3D.

Zoals opgemerkt in onze vorige review van de Ryzen 7 7700X, had de CPU problemen met het uitvoeren van PCMark 10 op standaardinstellingen, waardoor hij helaas 15% in het nadeel is ten opzichte van de Ryzen 7 9700X in deze vergelijking. Beide CPU's laten identieke algemene systeemprestaties zien wanneer PCMark 10 buiten beschouwing wordt gelaten.

System Performance Rating
Intel Core i9-14900K
58.7 pt
AMD Ryzen 9 7950X
57.2 pt
Intel Core i9-13900K
56.9 pt
AMD Ryzen 9 7950X3D -2!
53.7 pt
AMD Ryzen 9 7900X
53.1 pt
Intel Core i7-14700K
53.1 pt
AMD Ryzen 7 9700X
49.7 pt
Intel Core i5-14600K
49.7 pt
Intel Core i5-13600K
48.1 pt
AMD Ryzen 7 7800X3D
47.8 pt
AMD Ryzen 5 9600X
45.3 pt
AMD Ryzen 5 7600X
44 pt
AMD Ryzen 7 7700X -4!
42.1 pt
AMD Ryzen 9 5950X
41.5 pt
Intel Core i5-13400
39.4 pt
Intel Core i9-12900K -4!
36.6 pt
Intel Core i5-12400F
35.1 pt
Intel Core i5-12600K -4!
31.4 pt
AMD Ryzen 5 5600X -3!
29.9 pt
3DMark 11 / Performance Physics
AMD Ryzen 9 7950X3D
36991 Points +20%
AMD Ryzen 7 7800X3D
35127 Points +14%
Intel Core i7-14700K
32336 Points +5%
Intel Core i9-13900K
32273 Points +5%
Intel Core i9-14900K
32188 Points +5%
Intel Core i5-14600K
31641 Points +3%
AMD Ryzen 7 7700X
31467 Points +2%
AMD Ryzen 7 9700X
30757 Points
Intel Core i5-13600K
30480 Points -1%
AMD Ryzen 9 7900X
28618 Points -7%
AMD Ryzen 9 7950X
28618 Points -7%
Intel Core i9-12900K
28211 Points -8%
AMD Ryzen 5 9600X
25717 Points -16%
AMD Ryzen 5 7600X
25396 Points -17%
AMD Ryzen 9 5950X
25367 Points -18%
Intel Core i5-12600K
25017 Points -19%
Intel Core i5-13400
23120 Points -25%
AMD Ryzen 5 5600X
19649 Points -36%
Intel Core i5-12400F
19436 Points -37%
3DMark / Fire Strike Physics
Intel Core i9-14900K
56087 Points +47%
Intel Core i9-13900K
53853 Points +41%
Intel Core i7-14700K
49142 Points +29%
AMD Ryzen 9 7950X3D
44787 Points +18%
AMD Ryzen 9 7900X
42682 Points +12%
AMD Ryzen 9 7950X
42682 Points +12%
Intel Core i5-14600K
40164 Points +5%
AMD Ryzen 9 5950X
39600 Points +4%
Intel Core i9-12900K
39112 Points +3%
AMD Ryzen 7 9700X
38088 Points
Intel Core i5-13600K
35386 Points -7%
AMD Ryzen 7 7700X
35357 Points -7%
AMD Ryzen 5 9600X
33462 Points -12%
AMD Ryzen 7 7800X3D
33345 Points -12%
AMD Ryzen 5 7600X
30691 Points -19%
Intel Core i5-12600K
29671 Points -22%
Intel Core i5-13400
27135 Points -29%
AMD Ryzen 5 5600X
25990 Points -32%
Intel Core i5-12400F
24023 Points -37%
3DMark / Time Spy CPU
Intel Core i9-14900K
23721 Points +66%
Intel Core i7-14700K
21541 Points +51%
Intel Core i9-13900K
19392 Points +36%
Intel Core i5-14600K
18768 Points +31%
Intel Core i9-12900K
18431 Points +29%
AMD Ryzen 9 7950X3D
17206 Points +20%
Intel Core i5-13600K
17124 Points +20%
AMD Ryzen 9 7900X
16616 Points +16%
AMD Ryzen 9 7950X
16616 Points +16%
AMD Ryzen 7 9700X
14306 Points
AMD Ryzen 7 7700X
14182 Points -1%
AMD Ryzen 7 7800X3D
14098 Points -1%
Intel Core i5-12600K
13869 Points -3%
AMD Ryzen 9 5950X
13650 Points -5%
Intel Core i5-13400
12948 Points -9%
AMD Ryzen 5 9600X
10821 Points -24%
AMD Ryzen 5 7600X
10458 Points -27%
Intel Core i5-12400F
9745 Points -32%
AMD Ryzen 5 5600X
8911 Points -38%
CrossMark / Overall
Intel Core i9-14900K
2611 Points +20%
Intel Core i9-13900K
2589 Points +19%
AMD Ryzen 9 7950X
2512 Points +16%
AMD Ryzen 9 7900X
2405 Points +11%
Intel Core i5-14600K
2310 Points +6%
AMD Ryzen 7 7700X
2297 Points +6%
Intel Core i7-14700K
2288 Points +5%
Intel Core i5-13600K
2271 Points +4%
AMD Ryzen 5 7600X
2236 Points +3%
AMD Ryzen 7 7800X3D
2216 Points +2%
AMD Ryzen 9 7950X3D
2193 Points +1%
AMD Ryzen 7 9700X
2174 Points
AMD Ryzen 5 9600X
2103 Points -3%
Intel Core i5-13400
1877 Points -14%
Intel Core i5-12400F
1762 Points -19%
AMD Ryzen 9 5950X
1495 Points -31%
AMD Ryzen 5 5600X
1489 Points -32%
CrossMark / Responsiveness
Intel Core i9-13900K
2653 Points +64%
Intel Core i9-14900K
2413 Points +49%
Intel Core i5-13600K
2350 Points +45%
AMD Ryzen 9 7950X
2288 Points +42%
AMD Ryzen 9 7900X
2251 Points +39%
AMD Ryzen 5 7600X
2145 Points +33%
Intel Core i5-14600K
2090 Points +29%
AMD Ryzen 7 7800X3D
2039 Points +26%
Intel Core i7-14700K
2033 Points +26%
AMD Ryzen 7 7700X
2014 Points +25%
Intel Core i5-13400
1831 Points +13%
Intel Core i5-12400F
1799 Points +11%
AMD Ryzen 9 7950X3D
1795 Points +11%
AMD Ryzen 7 9700X
1616 Points
AMD Ryzen 5 9600X
1536 Points -5%
AMD Ryzen 9 5950X
1332 Points -18%
CrossMark / Creativity
Intel Core i9-14900K
2891 Points +12%
AMD Ryzen 9 7950X
2786 Points +8%
Intel Core i9-13900K
2784 Points +7%
AMD Ryzen 9 7900X
2673 Points +3%
Intel Core i7-14700K
2601 Points 0%
AMD Ryzen 7 9700X
2590 Points
Intel Core i5-14600K
2575 Points -1%
AMD Ryzen 9 7950X3D
2552 Points -1%
AMD Ryzen 7 7700X
2542 Points -2%
AMD Ryzen 5 9600X
2501 Points -3%
AMD Ryzen 7 7800X3D
2434 Points -6%
AMD Ryzen 5 7600X
2414 Points -7%
Intel Core i5-13600K
2412 Points -7%
Intel Core i5-13400
2039 Points -21%
Intel Core i5-12400F
1849 Points -29%
AMD Ryzen 9 5950X
1710 Points -34%
CrossMark / Productivity
Intel Core i9-14900K
2421 Points +20%
Intel Core i9-13900K
2388 Points +19%
AMD Ryzen 9 7950X
2336 Points +16%
AMD Ryzen 9 7900X
2211 Points +10%
AMD Ryzen 7 7700X
2168 Points +8%
Intel Core i5-14600K
2142 Points +6%
Intel Core i5-13600K
2115 Points +5%
AMD Ryzen 5 7600X
2101 Points +4%
Intel Core i7-14700K
2093 Points +4%
AMD Ryzen 7 7800X3D
2074 Points +3%
AMD Ryzen 7 9700X
2015 Points
AMD Ryzen 9 7950X3D
2014 Points 0%
AMD Ryzen 5 9600X
1962 Points -3%
Intel Core i5-13400
1741 Points -14%
Intel Core i5-12400F
1667 Points -17%
AMD Ryzen 9 5950X
1359 Points -33%
PCMark 10 / Score
AMD Ryzen 7 9700X
10699 Points
Intel Core i9-14900K
10101 Points -6%
AMD Ryzen 5 9600X
10060 Points -6%
AMD Ryzen 9 7900X
9911 Points -7%
AMD Ryzen 9 7950X
9911 Points -7%
Intel Core i9-13900K
9788 Points -9%
Intel Core i7-14700K
9741 Points -9%
Intel Core i5-14600K
9587 Points -10%
AMD Ryzen 7 7800X3D
9500 Points -11%
AMD Ryzen 5 7600X
9470 Points -11%
Intel Core i5-13600K
9362 Points -12%
AMD Ryzen 9 5950X
8778 Points -18%
Intel Core i5-13400
8614 Points -19%
Intel Core i9-12900K
8604 Points -20%
AMD Ryzen 5 5600X
8270 Points -23%
Intel Core i5-12600K
8259 Points -23%
Intel Core i5-12400F
7756 Points -28%
PCMark 10 / Essentials
Intel Core i9-13900K
12868 Points +2%
AMD Ryzen 9 7900X
12651 Points 0%
AMD Ryzen 9 7950X
12651 Points 0%
AMD Ryzen 7 9700X
12591 Points
Intel Core i9-14900K
12352 Points -2%
Intel Core i5-13600K
12306 Points -2%
AMD Ryzen 5 7600X
12259 Points -3%
AMD Ryzen 9 7950X3D
12130 Points -4%
AMD Ryzen 5 9600X
12047 Points -4%
Intel Core i7-14700K
11934 Points -5%
Intel Core i5-14600K
11532 Points -8%
AMD Ryzen 7 7800X3D
11337 Points -10%
AMD Ryzen 5 5600X
11280 Points -10%
AMD Ryzen 9 5950X
11255 Points -11%
Intel Core i9-12900K
11086 Points -12%
Intel Core i5-12600K
10650 Points -15%
Intel Core i5-13400
10635 Points -16%
Intel Core i5-12400F
10511 Points -17%
PCMark 10 / Productivity
AMD Ryzen 5 9600X
12915 Points 0%
AMD Ryzen 7 9700X
12873 Points
AMD Ryzen 5 7600X
12608 Points -2%
AMD Ryzen 9 7950X3D
12576 Points -2%
AMD Ryzen 7 7800X3D
12108 Points -6%
Intel Core i5-14600K
12075 Points -6%
Intel Core i7-14700K
11903 Points -8%
AMD Ryzen 9 7900X
11853 Points -8%
AMD Ryzen 9 7950X
11853 Points -8%
Intel Core i9-14900K
11784 Points -8%
Intel Core i5-13600K
11630 Points -10%
Intel Core i9-13900K
11370 Points -12%
AMD Ryzen 9 5950X
11163 Points -13%
Intel Core i5-12600K
11001 Points -15%
AMD Ryzen 5 5600X
10963 Points -15%
Intel Core i5-13400
10893 Points -15%
Intel Core i9-12900K
10699 Points -17%
Intel Core i5-12400F
8577 Points -33%
PCMark 10 / Digital Content Creation
AMD Ryzen 7 9700X
20506 Points
Intel Core i9-14900K
19214 Points -6%
AMD Ryzen 5 9600X
17760 Points -13%
Intel Core i7-14700K
17659 Points -14%
AMD Ryzen 9 7900X
17617 Points -14%
AMD Ryzen 9 7950X
17617 Points -14%
Intel Core i9-13900K
17393 Points -15%
Intel Core i5-14600K
17170 Points -16%
AMD Ryzen 7 7800X3D
16950 Points -17%
Intel Core i5-13600K
15558 Points -24%
Intel Core i5-13400
14969 Points -27%
AMD Ryzen 5 7600X
14908 Points -27%
AMD Ryzen 9 5950X
14607 Points -29%
Intel Core i9-12900K
14573 Points -29%
Intel Core i5-12400F
14046 Points -32%
Intel Core i5-12600K
13047 Points -36%
AMD Ryzen 5 5600X
12414 Points -39%
AIDA64 / FP32 Ray-Trace
AMD Ryzen 9 7950X
61180 KRay/s +49%
AMD Ryzen 9 7950X3D
58359 KRay/s +42%
AMD Ryzen 7 9700X
41146 KRay/s
Intel Core i9-14900K
37224 KRay/s -10%
Intel Core i9-13900K
36939 KRay/s -10%
AMD Ryzen 5 9600X
36389 KRay/s -12%
AMD Ryzen 9 7900X
33676 KRay/s -18%
AMD Ryzen 7 7700X
32035 KRay/s -22%
Intel Core i7-14700K
31200 KRay/s -24%
AMD Ryzen 7 7800X3D
29390 KRay/s -29%
AMD Ryzen 9 5950X
28150 KRay/s -32%
Intel Core i5-14600K
24047 KRay/s -42%
Intel Core i5-13600K
23446 KRay/s -43%
AMD Ryzen 5 7600X
17633 KRay/s -57%
Intel Core i5-13400
16649 KRay/s -60%
Intel Core i5-12400F
13789 KRay/s -66%
Intel Core i9-12900K
13266 KRay/s -68%
AMD Ryzen 5 5600X
12482 KRay/s -70%
Intel Core i5-12600K
8243 KRay/s -80%
AIDA64 / FPU Julia
AMD Ryzen 9 7950X3D
245308 Points +110%
AMD Ryzen 9 7950X
234844 Points +101%
AMD Ryzen 9 7900X
201995 Points +73%
Intel Core i9-14900K
184059 Points +57%
Intel Core i9-13900K
183390 Points +57%
Intel Core i7-14700K
157539 Points +35%
AMD Ryzen 9 5950X
144072 Points +23%
AMD Ryzen 7 7700X
133006 Points +14%
AMD Ryzen 7 7800X3D
121296 Points +4%
AMD Ryzen 7 9700X
116886 Points
Intel Core i5-14600K
113603 Points -3%
Intel Core i5-13600K
111374 Points -5%
AMD Ryzen 5 7600X
103526 Points -11%
AMD Ryzen 5 9600X
100758 Points -14%
Intel Core i5-13400
77776 Points -33%
Intel Core i5-12400F
63001 Points -46%
AMD Ryzen 5 5600X
61688 Points -47%
Intel Core i9-12900K
59419 Points -49%
Intel Core i5-12600K
37321 Points -68%
AIDA64 / CPU SHA3
AMD Ryzen 9 7950X3D
11001 MB/s +107%
AMD Ryzen 9 7950X
10076 MB/s +90%
Intel Core i9-13900K
9180 MB/s +73%
Intel Core i9-14900K
9166 MB/s +73%
Intel Core i7-14700K
7372 MB/s +39%
AMD Ryzen 9 7900X
7018 MB/s +32%
Intel Core i5-14600K
5326 MB/s 0%
AMD Ryzen 7 9700X
5307 MB/s
AMD Ryzen 7 7800X3D
5287 MB/s 0%
Intel Core i5-13600K
5253 MB/s -1%
AMD Ryzen 7 7700X
5214 MB/s -2%
Intel Core i9-12900K
4952 MB/s -7%
AMD Ryzen 9 5950X
4569 MB/s -14%
AMD Ryzen 5 9600X
4246 MB/s -20%
AMD Ryzen 5 7600X
3601 MB/s -32%
Intel Core i5-13400
3308 MB/s -38%
Intel Core i5-12600K
3250 MB/s -39%
Intel Core i5-12400F
2374 MB/s -55%
AMD Ryzen 5 5600X
1920 MB/s -64%
AIDA64 / CPU Queen
AMD Ryzen 9 7950X
203324 Points +72%
AMD Ryzen 9 7950X3D
199943 Points +69%
AMD Ryzen 9 7900X
172637 Points +46%
Intel Core i7-14700K
167941 Points +42%
AMD Ryzen 9 5950X
164437 Points +39%
Intel Core i9-14900K
163637 Points +38%
Intel Core i9-13900K
159676 Points +35%
AMD Ryzen 7 7700X
137151 Points +16%
Intel Core i5-14600K
123679 Points +5%
AMD Ryzen 7 7800X3D
121911 Points +3%
Intel Core i5-13600K
120485 Points +2%
AMD Ryzen 7 9700X
118203 Points
Intel Core i9-12900K
112694 Points -5%
AMD Ryzen 5 7600X
107954 Points -9%
AMD Ryzen 5 9600X
97731 Points -17%
Intel Core i5-12600K
88337 Points -25%
AMD Ryzen 5 5600X
85863 Points -27%
Intel Core i5-13400
83696 Points -29%
Intel Core i5-12400F
67663 Points -43%
AIDA64 / FPU SinJulia
AMD Ryzen 9 7950X
32823 Points +89%
AMD Ryzen 9 7950X3D
32423 Points +87%
AMD Ryzen 9 5950X
26364 Points +52%
AMD Ryzen 9 7900X
24881 Points +44%
Intel Core i9-14900K
20615 Points +19%
Intel Core i9-13900K
19920 Points +15%
Intel Core i7-14700K
18111 Points +5%
AMD Ryzen 7 9700X
17330 Points
AMD Ryzen 7 7700X
16496 Points -5%
AMD Ryzen 7 7800X3D
15299 Points -12%
Intel Core i9-12900K
14664 Points -15%
AMD Ryzen 5 9600X
13269 Points -23%
AMD Ryzen 5 7600X
12774 Points -26%
Intel Core i5-14600K
12663 Points -27%
Intel Core i5-13600K
12201 Points -30%
AMD Ryzen 5 5600X
10088 Points -42%
Intel Core i5-12600K
9510 Points -45%
Intel Core i5-13400
8656 Points -50%
Intel Core i5-12400F
7187 Points -59%
AIDA64 / FPU Mandel
AMD Ryzen 9 7950X3D
131740 Points +111%
AMD Ryzen 9 7950X
118564 Points +90%
AMD Ryzen 9 7900X
106620 Points +71%
Intel Core i9-14900K
92191 Points +48%
Intel Core i9-13900K
91721 Points +47%
AMD Ryzen 9 5950X
78269 Points +26%
Intel Core i7-14700K
76413 Points +23%
AMD Ryzen 7 7700X
69986 Points +12%
AMD Ryzen 7 7800X3D
65670 Points +5%
AMD Ryzen 7 9700X
62328 Points
Intel Core i5-14600K
58795 Points -6%
Intel Core i5-13600K
57797 Points -7%
AMD Ryzen 5 7600X
54555 Points -12%
AMD Ryzen 5 9600X
54123 Points -13%
Intel Core i5-13400
40491 Points -35%
Intel Core i9-12900K
38042 Points -39%
AMD Ryzen 5 5600X
33927 Points -46%
Intel Core i5-12400F
32420 Points -48%
Intel Core i5-12600K
24230 Points -61%
AIDA64 / CPU AES
AMD Ryzen 9 7950X
377952 MB/s +18%
AMD Ryzen 9 7950X3D
364030 MB/s +13%
AMD Ryzen 7 9700X
321370 MB/s
Intel Core i9-14900K
305071 MB/s -5%
Intel Core i9-13900K
297727 MB/s -7%
AMD Ryzen 9 7900X
279956 MB/s -13%
AMD Ryzen 5 9600X
264125 MB/s -18%
AMD Ryzen 7 7700X
189933 MB/s -41%
Intel Core i5-14600K
181167 MB/s -44%
AMD Ryzen 7 7800X3D
177487 MB/s -45%
Intel Core i5-13600K
175556 MB/s -45%
AMD Ryzen 9 5950X
153484 MB/s -52%
AMD Ryzen 5 7600X
144365 MB/s -55%
Intel Core i7-14700K
144308 MB/s -55%
Intel Core i9-12900K
94062 MB/s -71%
Intel Core i5-13400
65656 MB/s -80%
AMD Ryzen 5 5600X
62563 MB/s -81%
Intel Core i5-12600K
58635 MB/s -82%
Intel Core i5-12400F
51207 MB/s -84%
AIDA64 / CPU ZLib
Intel Core i9-14900K
2562 MB/s +101%
Intel Core i9-13900K
2490 MB/s +96%
AMD Ryzen 9 7950X
2427 MB/s +91%
AMD Ryzen 9 7950X3D
2315 MB/s +82%
Intel Core i7-14700K
2148 MB/s +69%
AMD Ryzen 9 7900X
1848 MB/s +45%
AMD Ryzen 9 5950X
1727 MB/s +36%
Intel Core i9-12900K
1560 MB/s +23%
Intel Core i5-14600K
1468 MB/s +15%
Intel Core i5-13600K
1426 MB/s +12%
AMD Ryzen 7 9700X
1272 MB/s
AMD Ryzen 7 7700X
1224 MB/s -4%
AMD Ryzen 7 7800X3D
1156 MB/s -9%
AMD Ryzen 5 9600X
1050 MB/s -17%
Intel Core i5-12600K
988 MB/s -22%
AMD Ryzen 5 7600X
945 MB/s -26%
Intel Core i5-13400
903 MB/s -29%
AMD Ryzen 5 5600X
719 MB/s -43%
Intel Core i5-12400F
655 MB/s -49%
AIDA64 / FP64 Ray-Trace
AMD Ryzen 9 7950X
32883 KRay/s +50%
AMD Ryzen 9 7950X3D
31732 KRay/s +44%
AMD Ryzen 7 9700X
21984 KRay/s
Intel Core i9-14900K
20599 KRay/s -6%
Intel Core i9-13900K
20298 KRay/s -8%
AMD Ryzen 5 9600X
19437 KRay/s -12%
AMD Ryzen 9 7900X
18490 KRay/s -16%
Intel Core i7-14700K
17130 KRay/s -22%
AMD Ryzen 7 7700X
17051 KRay/s -22%
AMD Ryzen 7 7800X3D
15690 KRay/s -29%
AMD Ryzen 9 5950X
15213 KRay/s -31%
Intel Core i5-14600K
13236 KRay/s -40%
Intel Core i5-13600K
12806 KRay/s -42%
AMD Ryzen 5 7600X
9488 KRay/s -57%
Intel Core i5-13400
9218 KRay/s -58%
Intel Core i9-12900K
8078 KRay/s -63%
Intel Core i5-12400F
7589 KRay/s -65%
AMD Ryzen 5 5600X
6894 KRay/s -69%
Intel Core i5-12600K
5149 KRay/s -77%
AIDA64 / CPU PhotoWorxx
Intel Core i9-14900K
55912 MPixel/s +37%
Intel Core i5-14600K
55888 MPixel/s +37%
Intel Core i7-14700K
54037 MPixel/s +32%
AMD Ryzen 9 7950X3D
53949 MPixel/s +32%
Intel Core i9-13900K
48674 MPixel/s +19%
Intel Core i5-13400
48619 MPixel/s +19%
Intel Core i5-12600K
48577 MPixel/s +19%
Intel Core i5-13600K
48434 MPixel/s +18%
Intel Core i9-12900K
48307 MPixel/s +18%
AMD Ryzen 7 7800X3D
46968 MPixel/s +15%
Intel Core i5-12400F
45672 MPixel/s +12%
AMD Ryzen 9 7950X
43947 MPixel/s +7%
AMD Ryzen 9 7900X
40893 MPixel/s 0%
AMD Ryzen 7 9700X
40890 MPixel/s
AMD Ryzen 5 9600X
40853 MPixel/s 0%
AMD Ryzen 5 7600X
32202 MPixel/s -21%
AMD Ryzen 7 7700X
31910 MPixel/s -22%
AMD Ryzen 9 5950X
27530 MPixel/s -33%
AMD Ryzen 5 5600X
24352 MPixel/s -40%
Performance Rating - Percent
Intel Core i9-12900K -1!
84.9 pt
Intel Core i5-12600K -1!
82.6 pt
Intel Core i9-14900K
77.3 pt
Intel Core i7-14700K
76.4 pt
Intel Core i5-14600K
75 pt
AMD Ryzen 9 7950X3D
72.2 pt
AMD Ryzen 9 7950X
70.7 pt
AMD Ryzen 9 7900X
67.5 pt
Intel Core i9-13900K
66.5 pt
AMD Ryzen 7 7800X3D
63.9 pt
Intel Core i5-13400
63.8 pt
Intel Core i5-12400F
62 pt
AMD Ryzen 7 9700X
61.8 pt
Intel Core i5-13600K
61.8 pt
AMD Ryzen 5 7600X
61.6 pt
AMD Ryzen 7 7700X
60.7 pt
AMD Ryzen 5 9600X
58.7 pt
AMD Ryzen 9 5950X
51.9 pt
AMD Ryzen 5 5600X
44.8 pt
AIDA64
Memory Copy
Intel Core i9-14900K
85662 MB/s +45%
Intel Core i7-14700K
85092 MB/s +44%
Intel Core i5-14600K
82790 MB/s +40%
Intel Core i9-13900K
74937 MB/s +27%
AMD Ryzen 9 7950X3D
73868 MB/s +25%
Intel Core i9-12900K
73146 MB/s +24%
AMD Ryzen 9 7950X
73104 MB/s +24%
Intel Core i5-13400
71766 MB/s +21%
Intel Core i5-13600K
71725 MB/s +21%
Intel Core i5-12400F
71074 MB/s +20%
Intel Core i5-12600K
70749 MB/s +20%
AMD Ryzen 9 7900X
69140 MB/s +17%
AMD Ryzen 7 7800X3D
63242 MB/s +7%
AMD Ryzen 5 7600X
59949 MB/s +1%
AMD Ryzen 7 7700X
59803 MB/s +1%
AMD Ryzen 9 5950X
59171 MB/s 0%
AMD Ryzen 7 9700X
59073 MB/s
AMD Ryzen 5 9600X
55115 MB/s -7%
AMD Ryzen 5 5600X
53947 MB/s -9%
Memory Latency
Intel Core i5-13600K
81.1 ns * -18%
Intel Core i5-12400F
79.2 ns * -16%
Intel Core i5-13400
77.2 ns * -13%
Intel Core i9-13900K
76.5 ns * -12%
Intel Core i7-14700K
71.5 ns * -4%
Intel Core i9-14900K
70.3 ns * -3%
Intel Core i5-14600K
69.7 ns * -2%
AMD Ryzen 7 9700X
68.5 ns *
AMD Ryzen 5 9600X
68.1 ns * +1%
AMD Ryzen 7 7800X3D
68 ns * +1%
AMD Ryzen 9 5950X
67.7 ns * +1%
AMD Ryzen 7 7700X
65.7 ns * +4%
AMD Ryzen 9 7950X3D
65.6 ns * +4%
AMD Ryzen 5 5600X
63.9 ns * +7%
AMD Ryzen 5 7600X
63.8 ns * +7%
AMD Ryzen 9 7900X
63.3 ns * +8%
AMD Ryzen 9 7950X
61.7 ns * +10%
Memory Read
Intel Core i9-14900K
95232 MB/s +53%
Intel Core i7-14700K
94830 MB/s +52%
Intel Core i5-14600K
88793 MB/s +42%
Intel Core i9-13900K
83883 MB/s +34%
Intel Core i9-12900K
81059 MB/s +30%
AMD Ryzen 9 7950X3D
80946 MB/s +30%
AMD Ryzen 9 7950X
78282 MB/s +26%
Intel Core i5-13400
77867 MB/s +25%
Intel Core i5-12600K
76864 MB/s +23%
Intel Core i5-13600K
75757 MB/s +21%
AMD Ryzen 9 7900X
75338 MB/s +21%
Intel Core i5-12400F
74338 MB/s +19%
AMD Ryzen 9 5950X
62991 MB/s +1%
AMD Ryzen 7 7800X3D
62528 MB/s 0%
AMD Ryzen 7 9700X
62369 MB/s
AMD Ryzen 5 5600X
59238 MB/s -5%
AMD Ryzen 7 7700X
59238 MB/s -5%
AMD Ryzen 5 9600X
59008 MB/s -5%
AMD Ryzen 5 7600X
59007 MB/s -5%
Memory Write
AMD Ryzen 7 7800X3D
87412 MB/s +3%
AMD Ryzen 9 7950X3D
85951 MB/s +1%
AMD Ryzen 7 9700X
84869 MB/s
Intel Core i5-14600K
84101 MB/s -1%
Intel Core i9-14900K
83670 MB/s -1%
Intel Core i7-14700K
82856 MB/s -2%
AMD Ryzen 5 7600X
81320 MB/s -4%
AMD Ryzen 5 9600X
80805 MB/s -5%
AMD Ryzen 7 7700X
80230 MB/s -5%
AMD Ryzen 9 7950X
79843 MB/s -6%
AMD Ryzen 9 7900X
76967 MB/s -9%
Intel Core i9-13900K
74140 MB/s -13%
Intel Core i5-13400
74029 MB/s -13%
Intel Core i5-12600K
73824 MB/s -13%
Intel Core i5-12400F
73805 MB/s -13%
Intel Core i9-12900K
73707 MB/s -13%
Intel Core i5-13600K
73484 MB/s -13%
AMD Ryzen 9 5950X
48748 MB/s -43%
AMD Ryzen 5 5600X
28798 MB/s -66%

* ... kleiner is beter

PCMark 10 Score
10699 punten
Help

3D- en gamingprestaties: Op gelijke voet met de Core i9-14900K en Ryzen 9 7950X

In combinatie met de Nvidia GeForce RTX 4090is de AMD Ryzen 7 9700X vrijwel gelijk aan de Ryzen 7 7800X3D en de Core i9-14900K in cumulatieve 3DMark grafische prestaties.

Afzonderlijk genomen laat de Ryzen 7 7800X3D goede verbeteringen zien ten opzichte van de Ryzen 7 9700X in 3DMark 11 Performance GPU en 3DMark Time Spy Graphics, maar de laatste behaalt een behoorlijke voorsprong in Fire Strike Graphics.

3DMark Performance Rating - Percent
Intel Core i5-14600K
NVIDIA GeForce RTX 4090
97.5 pt
AMD Ryzen 7 7800X3D
NVIDIA GeForce RTX 4090
93.7 pt
AMD Ryzen 5 9600X
NVIDIA GeForce RTX 4090
92.3 pt
AMD Ryzen 9 7950X
NVIDIA GeForce RTX 4090
90.7 pt
AMD Ryzen 7 9700X
NVIDIA GeForce RTX 4090
90.6 pt
Intel Core i9-14900K
NVIDIA GeForce RTX 4090
90.1 pt
AMD Ryzen 9 7950X3D
NVIDIA GeForce RTX 4090
90.1 pt
Intel Core i7-14700K
NVIDIA GeForce RTX 4090
89.3 pt
Intel Core i5-13400
NVIDIA GeForce RTX 4090
88.7 pt
Intel Core i5-12400F
NVIDIA GeForce RTX 4090
87.8 pt
Intel Core i9-13900K
NVIDIA GeForce RTX 4090
85.2 pt
3DMark 11 - 1280x720 Performance GPU
AMD Ryzen 7 7800X3D
NVIDIA GeForce RTX 4090
114641 Points +15%
Intel Core i5-14600K
NVIDIA GeForce RTX 4090
110994 Points +11%
AMD Ryzen 9 7950X
NVIDIA GeForce RTX 4090
107723 Points +8%
AMD Ryzen 9 7950X3D
NVIDIA GeForce RTX 4090
105886 Points +6%
Intel Core i9-14900K
NVIDIA GeForce RTX 4090
104998 Points +5%
Intel Core i5-13400
NVIDIA GeForce RTX 4090
104598 Points +5%
AMD Ryzen 5 9600X
NVIDIA GeForce RTX 4090
104516 Points +5%
Intel Core i7-14700K
NVIDIA GeForce RTX 4090
103598 Points +4%
Intel Core i5-12400F
NVIDIA GeForce RTX 4090
101294 Points +1%
AMD Ryzen 7 9700X
NVIDIA GeForce RTX 4090
99851 Points
Intel Core i9-13900K
NVIDIA GeForce RTX 4090
99834 Points 0%
3DMark
2560x1440 Time Spy Graphics
Intel Core i5-14600K
NVIDIA GeForce RTX 4090
37769 Points +3%
Intel Core i9-14900K
NVIDIA GeForce RTX 4090
37762 Points +3%
AMD Ryzen 7 7800X3D
NVIDIA GeForce RTX 4090
37664 Points +3%
Intel Core i7-14700K
NVIDIA GeForce RTX 4090
37589 Points +3%
AMD Ryzen 5 9600X
NVIDIA GeForce RTX 4090
37161 Points +2%
AMD Ryzen 9 7950X
NVIDIA GeForce RTX 4090
36836 Points +1%
AMD Ryzen 9 7950X3D
NVIDIA GeForce RTX 4090
36665 Points 0%
AMD Ryzen 7 9700X
NVIDIA GeForce RTX 4090
36564 Points
Intel Core i9-13900K
NVIDIA GeForce RTX 4090
36101 Points -1%
Intel Core i5-13400
NVIDIA GeForce RTX 4090
33624 Points -8%
Intel Core i5-12400F
NVIDIA GeForce RTX 4090
32740 Points -10%
1920x1080 Fire Strike Graphics
Intel Core i5-14600K
NVIDIA GeForce RTX 4090
86031 Points +9%
Intel Core i5-12400F
NVIDIA GeForce RTX 4090
79571 Points 0%
AMD Ryzen 7 9700X
NVIDIA GeForce RTX 4090
79185 Points
AMD Ryzen 5 9600X
NVIDIA GeForce RTX 4090
78579 Points -1%
Intel Core i5-13400
NVIDIA GeForce RTX 4090
77224 Points -2%
AMD Ryzen 7 7800X3D
NVIDIA GeForce RTX 4090
73447 Points -7%
AMD Ryzen 9 7950X3D
NVIDIA GeForce RTX 4090
72901 Points -8%
AMD Ryzen 9 7950X
NVIDIA GeForce RTX 4090
72678 Points -8%
Intel Core i9-14900K
NVIDIA GeForce RTX 4090
70971 Points -10%
Intel Core i7-14700K
NVIDIA GeForce RTX 4090
70246 Points -11%
Intel Core i9-13900K
NVIDIA GeForce RTX 4090
65879 Points -17%
3DMark 11 Performance
62688 punten
3DMark Fire Strike Score
54310 punten
3DMark Time Spy Score
29645 punten
Help

720p gaming komt tegenwoordig praktisch niet meer voor op PC's met discrete GPU's, maar het dient nog steeds om CPU-bottlenecking te bestuderen, vooral in combinatie met een top-of-the-line kaart zoals de RTX 4090.

De 3D V-Cache geeft zowel de Ryzen 7 7800X3D als de Ryzen 9 7950X3D een merkbaar voordeel in gamingtests. De Ryzen 7 9700X lijkt geen bijzondere voordelen te bieden ten opzichte van de Ryzen 5 9600X bij 720p en 1080p instellingen.

In feite zijn de prestaties van de Ryzen 7 9700X praktisch niet te onderscheiden van die van de Ryzen 9 7950X, Core i9-13900Ken de Core i9-14900K bij deze resoluties, terwijl hij over het geheel genomen 14% sneller is dan de Core i7-14700K.

Gaming Performance Rating - Percent
AMD Ryzen 7 7800X3D
NVIDIA GeForce RTX 4090
99.2 pt
AMD Ryzen 9 7950X3D
NVIDIA GeForce RTX 4090
92.5 pt
Intel Core i9-14900K
NVIDIA GeForce RTX 4090
89.8 pt
AMD Ryzen 7 9700X
NVIDIA GeForce RTX 4090
87.4 pt
AMD Ryzen 5 9600X
NVIDIA GeForce RTX 4090
85.7 pt
AMD Ryzen 9 7950X
NVIDIA GeForce RTX 4090
85.5 pt
Intel Core i9-13900K
NVIDIA GeForce RTX 4090
84.9 pt
Intel Core i5-14600K
NVIDIA GeForce RTX 4090
81.6 pt
Intel Core i7-14700K
NVIDIA GeForce RTX 4090
76.8 pt
Intel Core i5-13400
NVIDIA GeForce RTX 4090
60.2 pt
Intel Core i5-12400F
NVIDIA GeForce RTX 4090
58.8 pt
F1 22
1280x720 Ultra Low Preset AA:T AF:16x
AMD Ryzen 7 7800X3D
NVIDIA GeForce RTX 4090
629 (477min, 404P1 - 691max) fps +27%
Intel Core i9-14900K
NVIDIA GeForce RTX 4090
576 (428min, 362P1 - 644max) fps +16%
AMD Ryzen 9 7950X3D
NVIDIA GeForce RTX 4090
564 (406min, 353P1 - 626max) fps +13%
AMD Ryzen 9 7950X
NVIDIA GeForce RTX 4090
533 (379min, 335P1 - 591max) fps +7%
AMD Ryzen 5 9600X
NVIDIA GeForce RTX 4090
507 (370min, 322P1 - 562max) fps +2%
AMD Ryzen 7 9700X
NVIDIA GeForce RTX 4090
497 (363min, 324P1 - 552max) fps
Intel Core i9-13900K
NVIDIA GeForce RTX 4090
488 (349min, 305P1 - 553max) fps -2%
Intel Core i5-14600K
NVIDIA GeForce RTX 4090
463 (344min, 290P1 - 519max) fps -7%
Intel Core i7-14700K
NVIDIA GeForce RTX 4090
435 (343min, 277P1 - 488max) fps -12%
Intel Core i5-12400F
NVIDIA GeForce RTX 4090
311 (242min, 201P1 - 341max) fps -37%
Intel Core i5-13400
NVIDIA GeForce RTX 4090
276 (223min, 175P1 - 302max) fps -44%
1920x1080 Low Preset AA:T AF:16x
AMD Ryzen 7 7800X3D
NVIDIA GeForce RTX 4090
533 (380min, 288P1 - 637max) fps +28%
AMD Ryzen 9 7950X3D
NVIDIA GeForce RTX 4090
475 (338min, 264P1 - 542max) fps +14%
Intel Core i9-14900K
NVIDIA GeForce RTX 4090
462 (309min, 256P1 - 558max) fps +11%
AMD Ryzen 9 7950X
NVIDIA GeForce RTX 4090
443 (278min, 245P1 - 521max) fps +6%
AMD Ryzen 5 9600X
NVIDIA GeForce RTX 4090
439 (256min, 238P1 - 510max) fps +5%
AMD Ryzen 7 9700X
NVIDIA GeForce RTX 4090
418 (280min, 246P1 - 506max) fps
Intel Core i9-13900K
NVIDIA GeForce RTX 4090
387 (269min, 215P1 - 487max) fps -7%
Intel Core i5-14600K
NVIDIA GeForce RTX 4090
379 (280min, 225P1 - 455max) fps -9%
Intel Core i7-14700K
NVIDIA GeForce RTX 4090
359 (275min, 204P1 - 431max) fps -14%
Intel Core i5-12400F
NVIDIA GeForce RTX 4090
271 (200min, 165P1 - 305max) fps -35%
Intel Core i5-13400
NVIDIA GeForce RTX 4090
249 (197min, 152P1 - 284max) fps -40%
1920x1080 Ultra High Preset AA:T AF:16x
AMD Ryzen 7 7800X3D
NVIDIA GeForce RTX 4090
221 (196min, 145P1 - 248max) fps +4%
Intel Core i9-14900K
NVIDIA GeForce RTX 4090
217 (156min, 142P1 - 244max) fps +2%
AMD Ryzen 7 9700X
NVIDIA GeForce RTX 4090
213 (130min, 131P1 - 242max) fps
Intel Core i5-14600K
NVIDIA GeForce RTX 4090
210 (169min, 140P1 - 237max) fps -1%
AMD Ryzen 9 7950X3D
NVIDIA GeForce RTX 4090
204 (138min, 120P1 - 232max) fps -4%
AMD Ryzen 5 9600X
NVIDIA GeForce RTX 4090
202 (157min, 133P1 - 233max) fps -5%
Intel Core i9-13900K
NVIDIA GeForce RTX 4090
199.2 (162min, 134P1 - 219max) fps -6%
AMD Ryzen 9 7950X
NVIDIA GeForce RTX 4090
194.5 fps -9%
Intel Core i7-14700K
NVIDIA GeForce RTX 4090
187 (149min, 119P1 - 207max) fps -12%
Intel Core i5-12400F
NVIDIA GeForce RTX 4090
149 (120min, 99P1 - 165max) fps -30%
Intel Core i5-13400
NVIDIA GeForce RTX 4090
148.7 (114min, 95P1 - 173max) fps -30%
Far Cry 5
1280x720 Low Preset AA:T
AMD Ryzen 7 7800X3D
NVIDIA GeForce RTX 4090
344 (220min - 464max) fps +31%
AMD Ryzen 9 7950X3D
NVIDIA GeForce RTX 4090
299 (201min - 390max) fps +14%
Intel Core i9-14900K
NVIDIA GeForce RTX 4090
280 (214min - 355max) fps +6%
AMD Ryzen 5 9600X
NVIDIA GeForce RTX 4090
263 (201min - 342max) fps 0%
AMD Ryzen 7 9700X
NVIDIA GeForce RTX 4090
263 (202min - 350max) fps
Intel Core i5-14600K
NVIDIA GeForce RTX 4090
255 (199min - 343max) fps -3%
Intel Core i9-13900K
NVIDIA GeForce RTX 4090
239 (191min - 300max) fps -9%
AMD Ryzen 9 7950X
NVIDIA GeForce RTX 4090
238 (182min - 313max) fps -10%
Intel Core i5-13400
NVIDIA GeForce RTX 4090
185 (144min - 241max) fps -30%
Intel Core i7-14700K
NVIDIA GeForce RTX 4090
180 (138min - 249max) fps -32%
Intel Core i5-12400F
NVIDIA GeForce RTX 4090
173 (124min - 232max) fps -34%
1920x1080 Ultra Preset AA:T
AMD Ryzen 7 7800X3D
NVIDIA GeForce RTX 4090
278 (200min - 402max) fps +38%
AMD Ryzen 9 7950X3D
NVIDIA GeForce RTX 4090
248 (186min - 370max) fps +23%
Intel Core i9-14900K
NVIDIA GeForce RTX 4090
217 (159min - 296max) fps +7%
Intel Core i9-13900K
NVIDIA GeForce RTX 4090
203 (153min - 278max) fps 0%
AMD Ryzen 5 9600X
NVIDIA GeForce RTX 4090
203 (152min - 277max) fps 0%
AMD Ryzen 7 9700X
NVIDIA GeForce RTX 4090
202 (147min - 286max) fps
Intel Core i5-14600K
NVIDIA GeForce RTX 4090
196 (146min - 270max) fps -3%
AMD Ryzen 9 7950X
NVIDIA GeForce RTX 4090
188 (136min - 253max) fps -7%
Intel Core i7-14700K
NVIDIA GeForce RTX 4090
154 (115min - 213max) fps -24%
Intel Core i5-13400
NVIDIA GeForce RTX 4090
144 (109min - 202max) fps -29%
Intel Core i5-12400F
NVIDIA GeForce RTX 4090
133 (103min - 180max) fps -34%
X-Plane 11.11
1280x720 low (fps_test=1)
AMD Ryzen 7 9700X
NVIDIA GeForce RTX 4090
256 fps
Intel Core i9-13900K
NVIDIA GeForce RTX 4090
251 fps -2%
AMD Ryzen 5 9600X
NVIDIA GeForce RTX 4090
245 fps -4%
Intel Core i9-14900K
NVIDIA GeForce RTX 4090
244 fps -5%
Intel Core i5-14600K
NVIDIA GeForce RTX 4090
228 fps -11%
Intel Core i7-14700K
NVIDIA GeForce RTX 4090
227 fps -11%
AMD Ryzen 9 7950X3D
NVIDIA GeForce RTX 4090
225 fps -12%
AMD Ryzen 9 7950X
NVIDIA GeForce RTX 4090
223 fps -13%
AMD Ryzen 7 7800X3D
NVIDIA GeForce RTX 4090
219 fps -14%
Intel Core i5-13400
NVIDIA GeForce RTX 4090
155.7 fps -39%
Intel Core i5-12400F
NVIDIA GeForce RTX 4090
113 fps -56%
1920x1080 high (fps_test=3)
AMD Ryzen 7 7800X3D
NVIDIA GeForce RTX 4090
188.1 fps +9%
AMD Ryzen 9 7950X3D
NVIDIA GeForce RTX 4090
187.1 fps +9%
AMD Ryzen 7 9700X
NVIDIA GeForce RTX 4090
171.8 fps
AMD Ryzen 5 9600X
NVIDIA GeForce RTX 4090
166.1 fps -3%
Intel Core i9-13900K
NVIDIA GeForce RTX 4090
164.8 fps -4%
Intel Core i9-14900K
NVIDIA GeForce RTX 4090
161 fps -6%
Intel Core i7-14700K
NVIDIA GeForce RTX 4090
151.7 fps -12%
AMD Ryzen 9 7950X
NVIDIA GeForce RTX 4090
151.6 fps -12%
Intel Core i5-14600K
NVIDIA GeForce RTX 4090
147.8 fps -14%
Intel Core i5-13400
NVIDIA GeForce RTX 4090
108.9 fps -37%
Intel Core i5-12400F
NVIDIA GeForce RTX 4090
100.8 fps -41%
Final Fantasy XV Benchmark
1280x720 Lite Quality
AMD Ryzen 5 9600X
NVIDIA GeForce RTX 4090
237 fps +1%
AMD Ryzen 9 7950X
NVIDIA GeForce RTX 4090
236 fps 0%
Intel Core i9-13900K
NVIDIA GeForce RTX 4090
236 fps 0%
AMD Ryzen 7 7800X3D
NVIDIA GeForce RTX 4090
236 fps 0%
Intel Core i5-14600K
NVIDIA GeForce RTX 4090
236 fps 0%
Intel Core i9-14900K
NVIDIA GeForce RTX 4090
235 fps 0%
Intel Core i7-14700K
NVIDIA GeForce RTX 4090
235 fps 0%
AMD Ryzen 7 9700X
NVIDIA GeForce RTX 4090
235 fps
AMD Ryzen 9 7950X3D
NVIDIA GeForce RTX 4090
234 fps 0%
Intel Core i5-12400F
NVIDIA GeForce RTX 4090
217 fps -8%
Intel Core i5-13400
NVIDIA GeForce RTX 4090
217 fps -8%
1920x1080 High Quality
Intel Core i9-14900K
NVIDIA GeForce RTX 4090
234 fps +4%
AMD Ryzen 9 7950X
NVIDIA GeForce RTX 4090
233 fps +3%
AMD Ryzen 7 7800X3D
NVIDIA GeForce RTX 4090
233 fps +3%
Intel Core i5-14600K
NVIDIA GeForce RTX 4090
233 fps +3%
AMD Ryzen 9 7950X3D
NVIDIA GeForce RTX 4090
232 fps +3%
Intel Core i9-13900K
NVIDIA GeForce RTX 4090
230 fps +2%
AMD Ryzen 5 9600X
NVIDIA GeForce RTX 4090
229 fps +1%
Intel Core i7-14700K
NVIDIA GeForce RTX 4090
228 fps +1%
AMD Ryzen 7 9700X
NVIDIA GeForce RTX 4090
226 fps
Intel Core i5-13400
NVIDIA GeForce RTX 4090
183.9 fps -19%
Intel Core i5-12400F
NVIDIA GeForce RTX 4090
175.9 fps -22%
Dota 2 Reborn
1280x720 min (0/3) fastest
AMD Ryzen 7 7800X3D
NVIDIA GeForce RTX 4090
322.9 (268min) fps +1%
AMD Ryzen 7 9700X
NVIDIA GeForce RTX 4090
319.7 (274min) fps
AMD Ryzen 9 7950X3D
NVIDIA GeForce RTX 4090
314.1 (261.7min) fps -2%
AMD Ryzen 9 7950X
NVIDIA GeForce RTX 4090
310.6 (261.3min) fps -3%
Intel Core i9-14900K
NVIDIA GeForce RTX 4090
299.9 (248.4min) fps -6%
Intel Core i9-13900K
NVIDIA GeForce RTX 4090
292.4 (248.2min) fps -9%
AMD Ryzen 5 9600X
NVIDIA GeForce RTX 4090
291 (244.2min) fps -9%
Intel Core i5-14600K
NVIDIA GeForce RTX 4090
261.5 (226.3min) fps -18%
Intel Core i7-14700K
NVIDIA GeForce RTX 4090
239.4 (208min) fps -25%
Intel Core i5-12400F
NVIDIA GeForce RTX 4090
182.1 (159.5min) fps -43%
Intel Core i5-13400
NVIDIA GeForce RTX 4090
182.1 (160.5min) fps -43%
1920x1080 ultra (3/3) best looking
AMD Ryzen 7 7800X3D
NVIDIA GeForce RTX 4090
267.5 (216.9min) fps +12%
AMD Ryzen 9 7950X3D
NVIDIA GeForce RTX 4090
252.7 (208.9min) fps +6%
Intel Core i9-13900K
NVIDIA GeForce RTX 4090
239.8 (204min) fps 0%
AMD Ryzen 7 9700X
NVIDIA GeForce RTX 4090
239.4 (204.5min) fps
AMD Ryzen 9 7950X
NVIDIA GeForce RTX 4090
239.2 (203.6min) fps 0%
AMD Ryzen 5 9600X
NVIDIA GeForce RTX 4090
233 (200min) fps -3%
Intel Core i9-14900K
NVIDIA GeForce RTX 4090
231.4 (197.9min) fps -3%
Intel Core i5-14600K
NVIDIA GeForce RTX 4090
217 (186.1min) fps -9%
Intel Core i7-14700K
NVIDIA GeForce RTX 4090
200 (172.6min) fps -16%
Intel Core i5-13400
NVIDIA GeForce RTX 4090
153.8 (133.2min) fps -36%
Intel Core i5-12400F
NVIDIA GeForce RTX 4090
153.7 (134.4min) fps -36%
The Witcher 3
1024x768 Low Graphics & Postprocessing
AMD Ryzen 9 7950X3D
NVIDIA GeForce RTX 4090
864.7 fps +15%
AMD Ryzen 7 7800X3D
NVIDIA GeForce RTX 4090
858.4 fps +14%
Intel Core i9-14900K
NVIDIA GeForce RTX 4090
829 (31.9min, 380P0.1, 595P1 - 1296max) fps +10%
AMD Ryzen 9 7950X
NVIDIA GeForce RTX 4090
826 (23.6min, 360P0.1, 574P1 - 1357max) fps +10%
AMD Ryzen 5 9600X
NVIDIA GeForce RTX 4090
762 (66min, 266P0.1, 520P1 - 1355max) fps +1%
AMD Ryzen 7 9700X
NVIDIA GeForce RTX 4090
751 (650min - 945max) fps
Intel Core i9-13900K
NVIDIA GeForce RTX 4090
747 (631min, 633.24P1 - 949max) fps -1%
Intel Core i7-14700K
NVIDIA GeForce RTX 4090
634 (573min, 574.2P1 - 727max) fps -16%
Intel Core i5-14600K
NVIDIA GeForce RTX 4090
632 (29.4min, 209P0.1, 471P1 - 1028max) fps -16%
Intel Core i5-13400
NVIDIA GeForce RTX 4090
451.7 fps -40%
Intel Core i5-12400F
NVIDIA GeForce RTX 4090
414 fps -45%
1920x1080 Ultra Graphics & Postprocessing (HBAO+)
AMD Ryzen 9 7950X
NVIDIA GeForce RTX 4090
320 (30min, 161.1P0.1, 244P1 - 595max) fps +13%
Intel Core i5-14600K
NVIDIA GeForce RTX 4090
316 (105.2min, 154.9P0.1, 222P1 - 551max) fps +12%
AMD Ryzen 7 7800X3D
NVIDIA GeForce RTX 4090
314.3 fps +11%
Intel Core i9-14900K
NVIDIA GeForce RTX 4090
314 (65.8min, 172.6P0.1, 242P1 - 579max) fps +11%
AMD Ryzen 9 7950X3D
NVIDIA GeForce RTX 4090
305 fps +8%
Intel Core i9-13900K
NVIDIA GeForce RTX 4090
297 (271min, 271P1 - 345max) fps +5%
Intel Core i7-14700K
NVIDIA GeForce RTX 4090
287 (259min, 261.1P1 - 328max) fps +1%
AMD Ryzen 5 9600X
NVIDIA GeForce RTX 4090
286 (74.6min, 128.5P0.1, 200P1 - 609max) fps +1%
AMD Ryzen 7 9700X
NVIDIA GeForce RTX 4090
283 (259min, 259P1 - 322max) fps
Intel Core i5-13400
NVIDIA GeForce RTX 4090
277.3 fps -2%
Intel Core i5-12400F
NVIDIA GeForce RTX 4090
276 fps -2%
GTA V
1024x768 Lowest Settings possible
AMD Ryzen 7 7800X3D
NVIDIA GeForce RTX 4090
188.5 fps 0%
AMD Ryzen 9 7950X
NVIDIA GeForce RTX 4090
188.2 (5.44min, 200P1 - 724max) fps 0%
AMD Ryzen 5 9600X
NVIDIA GeForce RTX 4090
188.1 (3min, 200P1 - 713max) fps 0%
Intel Core i9-13900K
NVIDIA GeForce RTX 4090
188 (4.87min, 200P1 - 686max) fps 0%
AMD Ryzen 9 7950X3D
NVIDIA GeForce RTX 4090
188 (3.25min, 200P1 - 705max) fps 0%
Intel Core i9-14900K
NVIDIA GeForce RTX 4090
187.9 (3.8min, 200P1 - 705max) fps 0%
AMD Ryzen 7 9700X
NVIDIA GeForce RTX 4090
187.9 (7.35min, 200P1 - 714max) fps
Intel Core i5-14600K
NVIDIA GeForce RTX 4090
187.7 (4.67min, 200P1 - 640max) fps 0%
Intel Core i7-14700K
NVIDIA GeForce RTX 4090
187.6 (4.85min, 200P1 - 537max) fps 0%
Intel Core i5-13400
NVIDIA GeForce RTX 4090
186.8 (1.87min, 166.7P1 - 445max) fps -1%
Intel Core i5-12400F
NVIDIA GeForce RTX 4090
186.4 (2.09min, 166.7P1 - 413max) fps -1%
1920x1080 Highest Settings possible AA:4xMSAA + FX AF:16x
AMD Ryzen 7 7800X3D
NVIDIA GeForce RTX 4090
182 (2.73min, 142.9P1 - 445max) fps +7%
Intel Core i9-14900K
NVIDIA GeForce RTX 4090
170.9 (3.95min, 142.9P1 - 448max) fps 0%
AMD Ryzen 7 9700X
NVIDIA GeForce RTX 4090
170.4 (3.21min, 125P1 - 355max) fps
Intel Core i9-13900K
NVIDIA GeForce RTX 4090
168.6 (3.72min, 142.9P1 - 330max) fps -1%
AMD Ryzen 5 9600X
NVIDIA GeForce RTX 4090
166.3 (2.04min, 125P1 - 360max) fps -2%
Intel Core i5-14600K
NVIDIA GeForce RTX 4090
162.3 (14.2min, 125P1 - 354max) fps -5%
AMD Ryzen 9 7950X
NVIDIA GeForce RTX 4090
162 (3.52min, 111.1P1 - 353max) fps -5%
AMD Ryzen 9 7950X3D
NVIDIA GeForce RTX 4090
160.2 (11.4min, 111.1P1 - 366max) fps -6%
Intel Core i7-14700K
NVIDIA GeForce RTX 4090
151.2 (3.55min, 83.3P1 - 351max) fps -11%
Intel Core i5-13400
NVIDIA GeForce RTX 4090
124.5 (13.2min, 90.9P1 - 267max) fps -27%
Intel Core i5-12400F
NVIDIA GeForce RTX 4090
118.7 (4.84min, 83.3P1 - 208max) fps -30%
Borderlands 3
1280x720 Very Low Overall Quality (DX11)
AMD Ryzen 7 7800X3D
NVIDIA GeForce RTX 4090
310 fps +26%
AMD Ryzen 9 7950X3D
NVIDIA GeForce RTX 4090
308 fps +25%
Intel Core i9-14900K
NVIDIA GeForce RTX 4090
263 fps +6%
AMD Ryzen 7 9700X
NVIDIA GeForce RTX 4090
247 fps
AMD Ryzen 9 7950X
NVIDIA GeForce RTX 4090
242 fps -2%
Intel Core i9-13900K
NVIDIA GeForce RTX 4090
242 fps -2%
Intel Core i5-14600K
NVIDIA GeForce RTX 4090
237 fps -4%
AMD Ryzen 5 9600X
NVIDIA GeForce RTX 4090
228 fps -8%
Intel Core i7-14700K
NVIDIA GeForce RTX 4090
220 fps -11%
Intel Core i5-13400
NVIDIA GeForce RTX 4090
169 fps -32%
Intel Core i5-12400F
NVIDIA GeForce RTX 4090
155 fps -37%
1920x1080 Very Low Overall Quality (DX11)
AMD Ryzen 9 7950X3D
NVIDIA GeForce RTX 4090
306 fps +23%
AMD Ryzen 7 7800X3D
NVIDIA GeForce RTX 4090
305 fps +22%
Intel Core i9-14900K
NVIDIA GeForce RTX 4090
259 fps +4%
AMD Ryzen 7 9700X
NVIDIA GeForce RTX 4090
249 fps
Intel Core i9-13900K
NVIDIA GeForce RTX 4090
242 fps -3%
AMD Ryzen 9 7950X
NVIDIA GeForce RTX 4090
240 fps -4%
Intel Core i5-14600K
NVIDIA GeForce RTX 4090
233 fps -6%
AMD Ryzen 5 9600X
NVIDIA GeForce RTX 4090
227 fps -9%
Intel Core i7-14700K
NVIDIA GeForce RTX 4090
217 fps -13%
Intel Core i5-13400
NVIDIA GeForce RTX 4090
160.8 fps -35%
Intel Core i5-12400F
NVIDIA GeForce RTX 4090
153.1 fps -39%
1920x1080 Badass Overall Quality (DX11)
AMD Ryzen 9 7950X3D
NVIDIA GeForce RTX 4090
242 fps +26%
AMD Ryzen 7 7800X3D
NVIDIA GeForce RTX 4090
241 fps +25%
Intel Core i9-14900K
NVIDIA GeForce RTX 4090
204 fps +6%
Intel Core i9-13900K
NVIDIA GeForce RTX 4090
201 fps +4%
AMD Ryzen 7 9700X
NVIDIA GeForce RTX 4090
192.8 fps
AMD Ryzen 9 7950X
NVIDIA GeForce RTX 4090
186.8 fps -3%
Intel Core i5-14600K
NVIDIA GeForce RTX 4090
182 fps -6%
AMD Ryzen 5 9600X
NVIDIA GeForce RTX 4090
178.7 fps -7%
Intel Core i7-14700K
NVIDIA GeForce RTX 4090
170.4 fps -12%
Intel Core i5-13400
NVIDIA GeForce RTX 4090
128.8 fps -33%
Intel Core i5-12400F
NVIDIA GeForce RTX 4090
120.6 fps -37%
Shadow of the Tomb Raider
1920x1080 Highest Preset AA:T
AMD Ryzen 7 7800X3D
NVIDIA GeForce RTX 4090
375 fps +24%
AMD Ryzen 9 7950X3D
NVIDIA GeForce RTX 4090
361 fps +19%
Intel Core i9-14900K
NVIDIA GeForce RTX 4090
313 fps +3%
Intel Core i9-13900K
NVIDIA GeForce RTX 4090
306 fps +1%
AMD Ryzen 9 7950X
NVIDIA GeForce RTX 4090
304 fps 0%
AMD Ryzen 7 9700X
NVIDIA GeForce RTX 4090
303 fps
AMD Ryzen 5 9600X
NVIDIA GeForce RTX 4090
283 fps -7%
Intel Core i5-14600K
NVIDIA GeForce RTX 4090
272 fps -10%
Intel Core i7-14700K
NVIDIA GeForce RTX 4090
266 fps -12%
Intel Core i5-13400
NVIDIA GeForce RTX 4090
188.9 fps -38%
Intel Core i5-12400F
NVIDIA GeForce RTX 4090
185.1 fps -39%
1280x720 Lowest Preset
AMD Ryzen 7 7800X3D
NVIDIA GeForce RTX 4090
407 fps +21%
AMD Ryzen 9 7950X3D
NVIDIA GeForce RTX 4090
383 fps +14%
AMD Ryzen 7 9700X
NVIDIA GeForce RTX 4090
335 fps
AMD Ryzen 9 7950X
NVIDIA GeForce RTX 4090
332 fps -1%
Intel Core i9-14900K
NVIDIA GeForce RTX 4090
332 fps -1%
Intel Core i9-13900K
NVIDIA GeForce RTX 4090
324 fps -3%
AMD Ryzen 5 9600X
NVIDIA GeForce RTX 4090
319 fps -5%
Intel Core i5-14600K
NVIDIA GeForce RTX 4090
281 fps -16%
Intel Core i7-14700K
NVIDIA GeForce RTX 4090
278 fps -17%
Intel Core i5-13400
NVIDIA GeForce RTX 4090
204 fps -39%
Intel Core i5-12400F
NVIDIA GeForce RTX 4090
196.4 fps -41%
Metro Exodus
1280x720 Low Quality AF:4x
AMD Ryzen 7 7800X3D
NVIDIA GeForce RTX 4090
374 (214.41min - 571.76max) fps +7%
AMD Ryzen 7 9700X
NVIDIA GeForce RTX 4090
351 (190.8min - 547.05max) fps
AMD Ryzen 5 9600X
NVIDIA GeForce RTX 4090
349 (182.25min - 551.57max) fps -1%
Intel Core i9-14900K
NVIDIA GeForce RTX 4090
319 (166.53min - 527.7max) fps -9%
AMD Ryzen 9 7950X
NVIDIA GeForce RTX 4090
300 (162.95min - 476.42max) fps -15%
Intel Core i5-14600K
NVIDIA GeForce RTX 4090
296 (170.68min - 455.17max) fps -16%
AMD Ryzen 9 7950X3D
NVIDIA GeForce RTX 4090
293 (157.18min - 462.11max) fps -17%
Intel Core i7-14700K
NVIDIA GeForce RTX 4090
289 (165.56min - 442.67max) fps -18%
Intel Core i9-13900K
NVIDIA GeForce RTX 4090
273 (121.97min - 473.26max) fps -22%
Intel Core i5-12400F
NVIDIA GeForce RTX 4090
203 (112.65min - 299.76max) fps -42%
Intel Core i5-13400
NVIDIA GeForce RTX 4090
196.9 (110.05min - 286.04max) fps -44%
1920x1080 Ultra Quality AF:16x
AMD Ryzen 7 7800X3D
NVIDIA GeForce RTX 4090
219 (104.41min - 354.23max) fps +3%
AMD Ryzen 5 9600X
NVIDIA GeForce RTX 4090
218 (90.41min - 345.54max) fps +2%
Intel Core i9-14900K
NVIDIA GeForce RTX 4090
214 (96.03min - 351.12max) fps 0%
AMD Ryzen 7 9700X
NVIDIA GeForce RTX 4090
213 (90.34min - 345.18max) fps
Intel Core i5-14600K
NVIDIA GeForce RTX 4090
202 (100.6min - 297.35max) fps -5%
AMD Ryzen 9 7950X
NVIDIA GeForce RTX 4090
201 (109.06min - 313.19max) fps -6%
Intel Core i7-14700K
NVIDIA GeForce RTX 4090
194.7 (90.04min - 299.94max) fps -9%
AMD Ryzen 9 7950X3D
NVIDIA GeForce RTX 4090
193.5 (110.2min - 306.94max) fps -9%
Intel Core i9-13900K
NVIDIA GeForce RTX 4090
191.2 (84.99min - 313.09max) fps -10%
Intel Core i5-13400
NVIDIA GeForce RTX 4090
144 (81.05min - 208.64max) fps -32%
Intel Core i5-12400F
NVIDIA GeForce RTX 4090
141.8 (80.39min - 206.57max) fps -33%
F1 2021
1280x720 Ultra Low Preset
AMD Ryzen 7 7800X3D
NVIDIA GeForce RTX 4090
830 (632min, 515P1 - 919max) fps +29%
Intel Core i9-14900K
NVIDIA GeForce RTX 4090
733 (560min, 450P1 - 806max) fps +14%
AMD Ryzen 9 7950X3D
NVIDIA GeForce RTX 4090
682 (522min, 418P1 - 767max) fps +6%
AMD Ryzen 9 7950X
NVIDIA GeForce RTX 4090
677 (504min, 418P1 - 754max) fps +5%
AMD Ryzen 5 9600X
NVIDIA GeForce RTX 4090
669 (451min, 412P1 - 741max) fps +4%
Intel Core i9-13900K
NVIDIA GeForce RTX 4090
663 (502min, 405P1 - 740max) fps +3%
AMD Ryzen 7 9700X
NVIDIA GeForce RTX 4090
642 (470min, 407P1 - 708max) fps
Intel Core i5-14600K
NVIDIA GeForce RTX 4090
562 (468min, 364P1 - 618max) fps -12%
Intel Core i7-14700K
NVIDIA GeForce RTX 4090
547 (425min, 350P1 - 595max) fps -15%
Intel Core i5-12400F
NVIDIA GeForce RTX 4090
393 (309min, 274P1 - 416max) fps -39%
Intel Core i5-13400
NVIDIA GeForce RTX 4090
337 (277min, 237P1 - 358max) fps -48%
1920x1080 Ultra High Preset + Raytracing AA:T AF:16x
AMD Ryzen 7 7800X3D
NVIDIA GeForce RTX 4090
369 (301min, 276P1 - 395max) fps +29%
Intel Core i9-14900K
NVIDIA GeForce RTX 4090
307 (260min, 234P1 - 327max) fps +7%
Intel Core i9-13900K
NVIDIA GeForce RTX 4090
289 (248min, 217P1 - 307max) fps +1%
AMD Ryzen 7 9700X
NVIDIA GeForce RTX 4090
287 (244min, 221P1 - 309max) fps
AMD Ryzen 5 9600X
NVIDIA GeForce RTX 4090
280 (231min, 211P1 - 307max) fps -2%
Intel Core i5-14600K
NVIDIA GeForce RTX 4090
278 (237min, 198P1 - 299max) fps -3%
AMD Ryzen 9 7950X
NVIDIA GeForce RTX 4090
271 (224min, 205P1 - 294max) fps -6%
AMD Ryzen 9 7950X3D
NVIDIA GeForce RTX 4090
271 (216min, 208P1 - 293max) fps -6%
Intel Core i7-14700K
NVIDIA GeForce RTX 4090
260 (225min, 197P1 - 278max) fps -9%
Intel Core i5-12400F
NVIDIA GeForce RTX 4090
204 (166min, 150P1 - 218max) fps -29%
Intel Core i5-13400
NVIDIA GeForce RTX 4090
189 (158min, 136P1 - 204max) fps -34%

De delta met de X3D-chips wordt aanzienlijk kleiner bij QHD- en UHD Ultra-instellingen, omdat de belasting nu meer GPU-afhankelijk wordt.

Opnieuw zien we dat de Ryzen 7 9700X, Ryzen 5 9600X, Ryzen 9 7950X, Core i9-13900K, Core i9-14900K, en nu zelfs de Core i5-14600K allemaal hetzelfde podium delen wanneer de grafische instellingen tot het maximum worden opgevoerd.

Gaming Performance Rating - Percent
AMD Ryzen 7 7800X3D
NVIDIA GeForce RTX 4090
99.5 pt
AMD Ryzen 9 7950X3D
NVIDIA GeForce RTX 4090
95.4 pt
Intel Core i9-14900K
NVIDIA GeForce RTX 4090
95.2 pt
AMD Ryzen 7 9700X
NVIDIA GeForce RTX 4090
91.9 pt
Intel Core i5-14600K
NVIDIA GeForce RTX 4090
91.6 pt
AMD Ryzen 9 7950X
NVIDIA GeForce RTX 4090
91.6 pt
AMD Ryzen 5 9600X
NVIDIA GeForce RTX 4090
91.5 pt
Intel Core i9-13900K
NVIDIA GeForce RTX 4090
90.9 pt
Intel Core i7-14700K
NVIDIA GeForce RTX 4090
87 pt
Intel Core i5-13400
NVIDIA GeForce RTX 4090
75.9 pt
Intel Core i5-12400F -1!
NVIDIA GeForce RTX 4090
73.9 pt
F1 22
2560x1440 Ultra High Preset AA:T AF:16x
AMD Ryzen 7 7800X3D
NVIDIA GeForce RTX 4090
162.9 (140min, 114P1 - 191max) fps +2%
AMD Ryzen 5 9600X
NVIDIA GeForce RTX 4090
162.7 (141min, 119P1 - 186max) fps +2%
Intel Core i9-14900K
NVIDIA GeForce RTX 4090
161.1 (140min, 115P1 - 184max) fps +1%
Intel Core i5-14600K
NVIDIA GeForce RTX 4090
160.3 (139min, 112P1 - 182max) fps 0%
AMD Ryzen 7 9700X
NVIDIA GeForce RTX 4090
160 (114min, 112P1 - 185max) fps
AMD Ryzen 9 7950X3D
NVIDIA GeForce RTX 4090
158.9 (138min, 107P1 - 178max) fps -1%
AMD Ryzen 9 7950X
NVIDIA GeForce RTX 4090
157.5 (137min, 116P1 - 179max) fps -2%
Intel Core i7-14700K
NVIDIA GeForce RTX 4090
151.1 (130min, 105P1 - 173max) fps -6%
Intel Core i9-13900K
NVIDIA GeForce RTX 4090
149.6 (125min, 104P1 - 174max) fps -6%
Intel Core i5-12400F
NVIDIA GeForce RTX 4090
142.6 (115min, 94P1 - 156max) fps -11%
Intel Core i5-13400
NVIDIA GeForce RTX 4090
140.2 (112min, 91P1 - 152max) fps -12%
3840x2160 Ultra High Preset AA:T AF:16x
AMD Ryzen 5 9600X
NVIDIA GeForce RTX 4090
85 (73min, 72P1 - 99max) fps 0%
AMD Ryzen 7 9700X
NVIDIA GeForce RTX 4090
84.8 (73min, 72P1 - 98max) fps
AMD Ryzen 7 7800X3D
NVIDIA GeForce RTX 4090
84.5 (72min, 71P1 - 97max) fps 0%
Intel Core i5-14600K
NVIDIA GeForce RTX 4090
83.5 (72min, 71P1 - 96max) fps -2%
Intel Core i9-14900K
NVIDIA GeForce RTX 4090
83.4 (72min, 71P1 - 96max) fps -2%
AMD Ryzen 9 7950X
NVIDIA GeForce RTX 4090
82.5 (72min, 71P1 - 96max) fps -3%
AMD Ryzen 9 7950X3D
NVIDIA GeForce RTX 4090
82.3 (71min, 70P1 - 94max) fps -3%
Intel Core i7-14700K
NVIDIA GeForce RTX 4090
82.3 (71min, 70P1 - 95max) fps -3%
Intel Core i5-12400F
NVIDIA GeForce RTX 4090
81.7 (71min, 70P1 - 95max) fps -4%
Intel Core i5-13400
NVIDIA GeForce RTX 4090
81.2 (72min, 67P1 - 93max) fps -4%
Intel Core i9-13900K
NVIDIA GeForce RTX 4090
80.5 (70min, 70P1 - 92max) fps -5%
Far Cry 5
2560x1440 Ultra Preset AA:T
AMD Ryzen 7 7800X3D
NVIDIA GeForce RTX 4090
268 (202min - 364max) fps +32%
AMD Ryzen 9 7950X3D
NVIDIA GeForce RTX 4090
246 (178min - 355max) fps +21%
Intel Core i9-14900K
NVIDIA GeForce RTX 4090
216 (164min - 298max) fps +6%
Intel Core i9-13900K
NVIDIA GeForce RTX 4090
207 (156min - 282max) fps +2%
AMD Ryzen 5 9600X
NVIDIA GeForce RTX 4090
203 (148min - 267max) fps 0%
AMD Ryzen 7 9700X
NVIDIA GeForce RTX 4090
203 (151min - 282max) fps
Intel Core i5-14600K
NVIDIA GeForce RTX 4090
195 (148min - 267max) fps -4%
AMD Ryzen 9 7950X
NVIDIA GeForce RTX 4090
185 (140min - 248max) fps -9%
Intel Core i7-14700K
NVIDIA GeForce RTX 4090
155 (118min - 229max) fps -24%
Intel Core i5-13400
NVIDIA GeForce RTX 4090
142 (102min - 194max) fps -30%
Intel Core i5-12400F
NVIDIA GeForce RTX 4090
132 (96min - 177max) fps -35%
3840x2160 Ultra Preset AA:T
AMD Ryzen 7 7800X3D
NVIDIA GeForce RTX 4090
187 (166min - 215max) fps +13%
Intel Core i9-14900K
NVIDIA GeForce RTX 4090
187 (168min - 216max) fps +13%
AMD Ryzen 9 7950X3D
NVIDIA GeForce RTX 4090
182 (157min - 212max) fps +10%
Intel Core i5-14600K
NVIDIA GeForce RTX 4090
181 (151min - 215max) fps +10%
Intel Core i9-13900K
NVIDIA GeForce RTX 4090
176 (158min - 203max) fps +7%
AMD Ryzen 9 7950X
NVIDIA GeForce RTX 4090
175 (140min - 212max) fps +6%
AMD Ryzen 5 9600X
NVIDIA GeForce RTX 4090
170 (136min - 198max) fps +3%
AMD Ryzen 7 9700X
NVIDIA GeForce RTX 4090
165 (135min - 198max) fps
Intel Core i7-14700K
NVIDIA GeForce RTX 4090
152 (118min - 207max) fps -8%
Intel Core i5-13400
NVIDIA GeForce RTX 4090
142 (108min - 190max) fps -14%
Intel Core i5-12400F
NVIDIA GeForce RTX 4090
131 (97min - 177max) fps -21%
X-Plane 11.11 - 3840x2160 high (fps_test=3)
AMD Ryzen 7 7800X3D
NVIDIA GeForce RTX 4090
160.5 fps +13%
AMD Ryzen 9 7950X3D
NVIDIA GeForce RTX 4090
158.4 fps +12%
AMD Ryzen 7 9700X
NVIDIA GeForce RTX 4090
142 fps
Intel Core i9-13900K
NVIDIA GeForce RTX 4090
138.6 fps -2%
AMD Ryzen 5 9600X
NVIDIA GeForce RTX 4090
136.6 fps -4%
Intel Core i9-14900K
NVIDIA GeForce RTX 4090
136.3 fps -4%
Intel Core i7-14700K
NVIDIA GeForce RTX 4090
128.2 fps -10%
Intel Core i5-14600K
NVIDIA GeForce RTX 4090
124.6 fps -12%
AMD Ryzen 9 7950X
NVIDIA GeForce RTX 4090
124.5 fps -12%
Intel Core i5-13400
NVIDIA GeForce RTX 4090
95 fps -33%
Intel Core i5-12400F
NVIDIA GeForce RTX 4090
77 fps -46%
Final Fantasy XV Benchmark
2560x1440 High Quality
AMD Ryzen 7 7800X3D
NVIDIA GeForce RTX 4090
231 fps +8%
Intel Core i9-14900K
NVIDIA GeForce RTX 4090
229 fps +8%
Intel Core i5-14600K
NVIDIA GeForce RTX 4090
226 fps +6%
AMD Ryzen 9 7950X
NVIDIA GeForce RTX 4090
225 fps +6%
AMD Ryzen 9 7950X3D
NVIDIA GeForce RTX 4090
225 fps +6%
Intel Core i9-13900K
NVIDIA GeForce RTX 4090
220 fps +3%
Intel Core i7-14700K
NVIDIA GeForce RTX 4090
219 fps +3%
AMD Ryzen 5 9600X
NVIDIA GeForce RTX 4090
215 fps +1%
AMD Ryzen 7 9700X
NVIDIA GeForce RTX 4090
213 fps
Intel Core i5-13400
NVIDIA GeForce RTX 4090
183.9 fps -14%
Intel Core i5-12400F
NVIDIA GeForce RTX 4090
176.9 fps -17%
3840x2160 High Quality
Intel Core i9-14900K
NVIDIA GeForce RTX 4090
161.9 fps +9%
Intel Core i5-14600K
NVIDIA GeForce RTX 4090
161.5 fps +9%
AMD Ryzen 9 7950X
NVIDIA GeForce RTX 4090
161.1 fps +9%
Intel Core i7-14700K
NVIDIA GeForce RTX 4090
159.2 fps +7%
AMD Ryzen 7 7800X3D
NVIDIA GeForce RTX 4090
158.2 fps +7%
AMD Ryzen 9 7950X3D
NVIDIA GeForce RTX 4090
157.6 fps +6%
Intel Core i5-12400F
NVIDIA GeForce RTX 4090
151.9 fps +2%
Intel Core i9-13900K
NVIDIA GeForce RTX 4090
151.5 fps +2%
AMD Ryzen 5 9600X
NVIDIA GeForce RTX 4090
150.9 fps +2%
Intel Core i5-13400
NVIDIA GeForce RTX 4090
149.8 fps +1%
AMD Ryzen 7 9700X
NVIDIA GeForce RTX 4090
148.3 fps
Dota 2 Reborn - 3840x2160 ultra (3/3) best looking
AMD Ryzen 7 7800X3D
NVIDIA GeForce RTX 4090
258.2 (201.3min) fps +9%
AMD Ryzen 9 7950X3D
NVIDIA GeForce RTX 4090
245.4 (195.9min) fps +3%
AMD Ryzen 7 9700X
NVIDIA GeForce RTX 4090
237.2 (194.3min) fps
AMD Ryzen 9 7950X
NVIDIA GeForce RTX 4090
234.4 (192.2min) fps -1%
Intel Core i9-13900K
NVIDIA GeForce RTX 4090
228.9 (189.4min) fps -3%
Intel Core i9-14900K
NVIDIA GeForce RTX 4090
227.8 (188.3min) fps -4%
AMD Ryzen 5 9600X
NVIDIA GeForce RTX 4090
225 (189.1min) fps -5%
Intel Core i5-14600K
NVIDIA GeForce RTX 4090
211.5 (179.5min) fps -11%
Intel Core i7-14700K
NVIDIA GeForce RTX 4090
198.1 (161.6min) fps -16%
Intel Core i5-12400F
NVIDIA GeForce RTX 4090
150.3 (129.4min) fps -37%
Intel Core i5-13400
NVIDIA GeForce RTX 4090
149.8 (129.3min) fps -37%
The Witcher 3 - 3840x2160 Ultra Graphics & Postprocessing (HBAO+)
AMD Ryzen 9 7950X
NVIDIA GeForce RTX 4090
180.9 (76.6min, 113.1P0.1, 155.5P1 - 493max) fps +12%
Intel Core i9-14900K
NVIDIA GeForce RTX 4090
180.1 (98.9min, 123.4P0.1, 150.3P1 - 473max) fps +12%
AMD Ryzen 7 7800X3D
NVIDIA GeForce RTX 4090
174.8 fps +9%
Intel Core i5-12400F
NVIDIA GeForce RTX 4090
174.5 fps +8%
Intel Core i5-13400
NVIDIA GeForce RTX 4090
172.8 fps +7%
Intel Core i5-14600K
NVIDIA GeForce RTX 4090
172.6 (94.4min, 106.5P0.1, 142.2P1 - 408max) fps +7%
AMD Ryzen 9 7950X3D
NVIDIA GeForce RTX 4090
171.8 fps +7%
Intel Core i9-13900K
NVIDIA GeForce RTX 4090
170.7 (154min, 154.59P1 - 187max) fps +6%
AMD Ryzen 5 9600X
NVIDIA GeForce RTX 4090
168 (64min, 99P0.1, 134.4P1 - 449max) fps +4%
Intel Core i7-14700K
NVIDIA GeForce RTX 4090
164.7 (150min, 150.62P1 - 176max) fps +2%
AMD Ryzen 7 9700X
NVIDIA GeForce RTX 4090
160.9 (144min, 145.45P1 - 176max) fps
GTA V
2560x1440 Highest Settings possible AA:4xMSAA + FX AF:16x
AMD Ryzen 7 7800X3D
NVIDIA GeForce RTX 4090
181.1 (6.02min, 142.9P1 - 480max) fps +7%
Intel Core i9-14900K
NVIDIA GeForce RTX 4090
171.9 (4.45min, 142.9P1 - 406max) fps +2%
AMD Ryzen 7 9700X
NVIDIA GeForce RTX 4090
169.3 (2.93min, 125P1 - 341max) fps
Intel Core i9-13900K
NVIDIA GeForce RTX 4090
167.9 (6min, 125P1 - 387max) fps -1%
AMD Ryzen 5 9600X
NVIDIA GeForce RTX 4090
166.7 (6.04min, 125P1 - 387max) fps -2%
AMD Ryzen 9 7950X
NVIDIA GeForce RTX 4090
164.8 (6.47min, 125P1 - 357max) fps -3%
Intel Core i5-14600K
NVIDIA GeForce RTX 4090
163.5 (9.19min, 125P1 - 340max) fps -3%
AMD Ryzen 9 7950X3D
NVIDIA GeForce RTX 4090
160.9 (7.74min, 111.1P1 - 368max) fps -5%
Intel Core i7-14700K
NVIDIA GeForce RTX 4090
151.2 (2.91min, 83.3P1 - 363max) fps -11%
Intel Core i5-13400
NVIDIA GeForce RTX 4090
125.9 (8.49min, 90.9P1 - 210max) fps -26%
Intel Core i5-12400F
NVIDIA GeForce RTX 4090
118.4 (12.4min, 83.3P1 - 204max) fps -30%
3840x2160 Highest Settings possible AA:4xMSAA + FX AF:16x
AMD Ryzen 7 7800X3D
NVIDIA GeForce RTX 4090
146.2 (8.5min, 90.9P1 - 331max) fps +4%
Intel Core i9-14900K
NVIDIA GeForce RTX 4090
146.1 (4.68min, 100P1 - 354max) fps +4%
Intel Core i5-14600K
NVIDIA GeForce RTX 4090
141.9 (11.7min, 100P1 - 301max) fps +1%
AMD Ryzen 5 9600X
NVIDIA GeForce RTX 4090
140.8 (8.91min, 90.9P1 - 270max) fps 0%
AMD Ryzen 7 9700X
NVIDIA GeForce RTX 4090
140.7 (16min, 90.9P1 - 276max) fps
AMD Ryzen 9 7950X
NVIDIA GeForce RTX 4090
138 (8.49min, 90.9P1 - 306max) fps -2%
Intel Core i9-13900K
NVIDIA GeForce RTX 4090
137 (6.79min, 90.9P1 - 317max) fps -3%
AMD Ryzen 9 7950X3D
NVIDIA GeForce RTX 4090
136.9 (8.24min, 90.9P1 - 318max) fps -3%
Intel Core i7-14700K
NVIDIA GeForce RTX 4090
133.8 (5.14min, 83.3P1 - 293max) fps -5%
Intel Core i5-13400
NVIDIA GeForce RTX 4090
122.2 (8.01min, 90.9P1 - 227max) fps -13%
Borderlands 3
2560x1440 Badass Overall Quality (DX11)
AMD Ryzen 7 7800X3D
NVIDIA GeForce RTX 4090
224 fps +19%
AMD Ryzen 9 7950X3D
NVIDIA GeForce RTX 4090
223 fps +18%
Intel Core i9-14900K
NVIDIA GeForce RTX 4090
198.4 fps +5%
Intel Core i9-13900K
NVIDIA GeForce RTX 4090
190 fps +1%
AMD Ryzen 7 9700X
NVIDIA GeForce RTX 4090
188.3 fps
AMD Ryzen 9 7950X
NVIDIA GeForce RTX 4090
186 fps -1%
Intel Core i5-14600K
NVIDIA GeForce RTX 4090
179.3 fps -5%
Intel Core i7-14700K
NVIDIA GeForce RTX 4090
171.6 fps -9%
AMD Ryzen 5 9600X
NVIDIA GeForce RTX 4090
171.6 fps -9%
Intel Core i5-13400
NVIDIA GeForce RTX 4090
123.7 fps -34%
Intel Core i5-12400F
NVIDIA GeForce RTX 4090
118.9 fps -37%
3840x2160 Badass Overall Quality (DX11)
Intel Core i9-14900K
NVIDIA GeForce RTX 4090
137.9 fps +5%
AMD Ryzen 7 7800X3D
NVIDIA GeForce RTX 4090
137.4 fps +4%
AMD Ryzen 9 7950X3D
NVIDIA GeForce RTX 4090
136.4 fps +4%
Intel Core i5-14600K
NVIDIA GeForce RTX 4090
136.1 fps +3%
AMD Ryzen 9 7950X
NVIDIA GeForce RTX 4090
135 fps +3%
Intel Core i9-13900K
NVIDIA GeForce RTX 4090
133.4 fps +1%
Intel Core i7-14700K
NVIDIA GeForce RTX 4090
132.6 fps +1%
AMD Ryzen 5 9600X
NVIDIA GeForce RTX 4090
131.8 fps 0%
AMD Ryzen 7 9700X
NVIDIA GeForce RTX 4090
131.5 fps
Intel Core i5-13400
NVIDIA GeForce RTX 4090
120.5 fps -8%
Intel Core i5-12400F
NVIDIA GeForce RTX 4090
114.4 fps -13%
Shadow of the Tomb Raider
2560x1440 Highest Preset AA:T
AMD Ryzen 7 7800X3D
NVIDIA GeForce RTX 4090
322 fps +18%
AMD Ryzen 9 7950X3D
NVIDIA GeForce RTX 4090
315 fps +15%
Intel Core i9-14900K
NVIDIA GeForce RTX 4090
293 fps +7%
Intel Core i9-13900K
NVIDIA GeForce RTX 4090
282 fps +3%
AMD Ryzen 9 7950X
NVIDIA GeForce RTX 4090
279 fps +2%
AMD Ryzen 7 9700X
NVIDIA GeForce RTX 4090
273 fps
AMD Ryzen 5 9600X
NVIDIA GeForce RTX 4090
267 fps -2%
Intel Core i5-14600K
NVIDIA GeForce RTX 4090
266 fps -3%
Intel Core i7-14700K
NVIDIA GeForce RTX 4090
258 fps -5%
Intel Core i5-13400
NVIDIA GeForce RTX 4090
185.9 fps -32%
Intel Core i5-12400F
NVIDIA GeForce RTX 4090
183.7 fps -33%
3840x2160 Highest Preset AA:T
Intel Core i9-14900K
NVIDIA GeForce RTX 4090
189.7 fps +3%
Intel Core i5-14600K
NVIDIA GeForce RTX 4090
188.8 fps +2%
AMD Ryzen 5 9600X
NVIDIA GeForce RTX 4090
188.1 fps +2%
AMD Ryzen 7 7800X3D
NVIDIA GeForce RTX 4090
187.7 fps +1%
AMD Ryzen 9 7950X3D
NVIDIA GeForce RTX 4090
187.6 fps +1%
AMD Ryzen 9 7950X
NVIDIA GeForce RTX 4090
186 fps +1%
AMD Ryzen 7 9700X
NVIDIA GeForce RTX 4090
185 fps
Intel Core i9-13900K
NVIDIA GeForce RTX 4090
182 fps -2%
Intel Core i7-14700K
NVIDIA GeForce RTX 4090
180.4 fps -2%
Intel Core i5-13400
NVIDIA GeForce RTX 4090
173.1 fps -6%
Intel Core i5-12400F
NVIDIA GeForce RTX 4090
168.4 fps -9%
Metro Exodus
2560x1440 Ultra Quality AF:16x
AMD Ryzen 7 7800X3D
NVIDIA GeForce RTX 4090
199.8 (101.33min - 324.25max) fps +5%
Intel Core i9-14900K
NVIDIA GeForce RTX 4090
194.6 (92.87min - 333.22max) fps +2%
AMD Ryzen 5 9600X
NVIDIA GeForce RTX 4090
194.4 (86.13min - 328.84max) fps +2%
AMD Ryzen 7 9700X
NVIDIA GeForce RTX 4090
190.5 (88.41min - 319.18max) fps
Intel Core i5-14600K
NVIDIA GeForce RTX 4090
188.8 (91.88min - 291.97max) fps -1%
AMD Ryzen 9 7950X
NVIDIA GeForce RTX 4090
185.8 (90.83min - 288.85max) fps -2%
Intel Core i7-14700K
NVIDIA GeForce RTX 4090
181.3 (87.39min - 285.47max) fps -5%
AMD Ryzen 9 7950X3D
NVIDIA GeForce RTX 4090
178.9 (99.89min - 271.52max) fps -6%
Intel Core i9-13900K
NVIDIA GeForce RTX 4090
176 (81.25min - 295.51max) fps -8%
Intel Core i5-13400
NVIDIA GeForce RTX 4090
141 (84.07min - 206.65max) fps -26%
Intel Core i5-12400F
NVIDIA GeForce RTX 4090
136.6 (79.85min - 203.29max) fps -28%
3840x2160 Ultra Quality AF:16x
Intel Core i9-14900K
NVIDIA GeForce RTX 4090
143.4 (84.04min - 227.17max) fps +3%
Intel Core i5-14600K
NVIDIA GeForce RTX 4090
142.1 (81.45min - 230.73max) fps +3%
AMD Ryzen 7 7800X3D
NVIDIA GeForce RTX 4090
141.6 (85.41min - 213.31max) fps +2%
AMD Ryzen 9 7950X
NVIDIA GeForce RTX 4090
139.7 (76.95min - 229.15max) fps +1%
AMD Ryzen 9 7950X3D
NVIDIA GeForce RTX 4090
139.4 (76.47min - 227.32max) fps +1%
AMD Ryzen 7 9700X
NVIDIA GeForce RTX 4090
138.6 (75.99min - 226.65max) fps
Intel Core i7-14700K
NVIDIA GeForce RTX 4090
138.5 (76.17min - 231.7max) fps 0%
AMD Ryzen 5 9600X
NVIDIA GeForce RTX 4090
138 (71.03min - 235.4max) fps 0%
Intel Core i9-13900K
NVIDIA GeForce RTX 4090
135 (72.48min - 235.85max) fps -3%
Intel Core i5-13400
NVIDIA GeForce RTX 4090
126.7 (68.66min - 196.97max) fps -9%
Intel Core i5-12400F
NVIDIA GeForce RTX 4090
124.1 (74min - 188.01max) fps -10%
F1 2021
2560x1440 Ultra High Preset + Raytracing AA:T AF:16x
AMD Ryzen 7 7800X3D
NVIDIA GeForce RTX 4090
324 (276min, 240P1 - 345max) fps +11%
AMD Ryzen 7 9700X
NVIDIA GeForce RTX 4090
292 (240min, 215P1 - 314max) fps
Intel Core i9-14900K
NVIDIA GeForce RTX 4090
291 (246min, 214P1 - 308max) fps 0%
AMD Ryzen 5 9600X
NVIDIA GeForce RTX 4090
276 (222min, 198P1 - 303max) fps -5%
Intel Core i9-13900K
NVIDIA GeForce RTX 4090
273 (229min, 203P1 - 293max) fps -7%
AMD Ryzen 9 7950X3D
NVIDIA GeForce RTX 4090
271 (223min, 202P1 - 294max) fps -7%
Intel Core i5-14600K
NVIDIA GeForce RTX 4090
268 (219min, 187P1 - 288max) fps -8%
AMD Ryzen 9 7950X
NVIDIA GeForce RTX 4090
263 (216min, 198P1 - 285max) fps -10%
Intel Core i7-14700K
NVIDIA GeForce RTX 4090
257 (218min, 192P1 - 275max) fps -12%
Intel Core i5-12400F
NVIDIA GeForce RTX 4090
201 (158min, 145P1 - 215max) fps -31%
Intel Core i5-13400
NVIDIA GeForce RTX 4090
190.4 (159min, 137P1 - 204max) fps -35%
3840x2160 Ultra High Preset + Raytracing AA:T AF:16x
AMD Ryzen 7 7800X3D
NVIDIA GeForce RTX 4090
207 (179min, 176P1 - 230max) fps +2%
AMD Ryzen 5 9600X
NVIDIA GeForce RTX 4090
205 (176min, 168P1 - 232max) fps +1%
AMD Ryzen 9 7950X3D
NVIDIA GeForce RTX 4090
203 (169min, 169P1 - 225max) fps 0%
Intel Core i9-14900K
NVIDIA GeForce RTX 4090
203 (173min, 165P1 - 226max) fps 0%
AMD Ryzen 7 9700X
NVIDIA GeForce RTX 4090
203 (174min, 169P1 - 227max) fps
Intel Core i5-14600K
NVIDIA GeForce RTX 4090
201 (173min, 153P1 - 227max) fps -1%
AMD Ryzen 9 7950X
NVIDIA GeForce RTX 4090
199.1 (168min, 166P1 - 223max) fps -2%
Intel Core i7-14700K
NVIDIA GeForce RTX 4090
194.9 (158min, 156P1 - 217max) fps -4%
Intel Core i9-13900K
NVIDIA GeForce RTX 4090
192 (151min, 159P1 - 215max) fps -5%
Intel Core i5-12400F
NVIDIA GeForce RTX 4090
185 (153min, 132P1 - 197max) fps -9%
Intel Core i5-13400
NVIDIA GeForce RTX 4090
176.2 (144min, 127P1 - 189max) fps -13%

AMD Ryzen 7 9700X with Nvidia GeForce RTX 4090

lagegem.hogeultraQHD4K DLSS4K FSR4K
GTA V (2015) 187.9 187.8 187.6 170.4 169.3 187.6
The Witcher 3 (2015) 751 696 579 283 242 275
Dota 2 Reborn (2015) 319.7 273.5 261.7 239.4 237.2
Final Fantasy XV Benchmark (2018) 235 233 226 213 148.3
X-Plane 11.11 (2018) 256 226 171.8 142
Far Cry 5 (2018) 263 228 219 202 203 165
Strange Brigade (2018) 786 655 637 616 536 283
Shadow of the Tomb Raider (2018) 335 302 308 303 273 185
Metro Exodus (2019) 351 302 256 213 190.5 138.6
Borderlands 3 (2019) 247 222 202 192.8 188.3 131.5
F1 2021 (2021) 642 624 545 287 292 203
Tiny Tina's Wonderlands (2022) 445 392 331 288 225 128.9
F1 22 (2022) 418 463 419 213 160 84.8
F1 23 (2023) 426 449 426 197.6 154 133.3 80.3
Baldur's Gate 3 (2023) 353 334 307 302 250 215 143.2
Cyberpunk 2077 2.1 Phantom Liberty (2023) 257 258 236 214 156.6 74.5
Assassin's Creed Mirage (2023) 280 270 256 188 178 158 127
Call of Duty Modern Warfare 3 2023 (2023) 417 364 310 296 235 173 165
Avatar Frontiers of Pandora (2023) 244 228 203 168.1 124 112.9 69.7
Skull & Bones (2024) 243 225 194 171 144 132 129 100
F1 24 (2024) 406 427 406 203 147.7 126.3 143.6 79.8

Energieverbruik: Tastbare efficiëntiewinst in multi-core en gaming

Zen 4 stond al bekend om zijn superieure energie-efficiëntie ten opzichte van het aanbod van Intel, en AMD lijkt deze lijn ook door te trekken met Zen 5.

De Ryzen 7 9700X biedt de beste energie-efficiëntie van het stel in The Witcher 3 bij 1080p Ultra, en verslaat de Ryzen 7 7800X3D op een haar na.

De Ryzen 5 9600X is 13% efficiënter in Cinebench R23 single core, maar de Ryzen 7 9700X maakt zijn achterstand goed in Cinebench R23 multi-core efficiëntie dankzij hogere prestaties.

Hoewel de Core i5-14600K 21% beter presteert dan de Ryzen 7 9700X in Cinebench R23 multi-core, heeft de Zen 5 CPU 22% meer energie-efficiëntie dan zijn Intel-concurrent.

Power Consumption: External monitor

0255075100125150175200225250275300325350375400425450475Tooltip
AMD Ryzen 7 9700X; Prime95 V2810 Stress (external Monitor): Ø180.2 (178.9-181.7)
AMD Ryzen 7 9700X; Cinebench R15 Multi (external Monitor): Ø174.6 (173.6-175.1)
AMD Ryzen 7 9700X; Cinebench R20 Single (external Monitor): Ø111.5 (109.2-122.2)
AMD Ryzen 7 9700X; Cinebench R20 Multi (external Monitor): Ø174.9 (173.8-175.7)
AMD Ryzen 7 9700X; Cinebench R23 Single (external Monitor): Ø112.2 (110.2-131.2)
AMD Ryzen 7 9700X; Cinebench R23 Multi (external Monitor): Ø175.3 (172.5-176.2)
AMD Ryzen 7 9700X; Idle 1min (external Monitor): Ø83 (81.7-84.7)
AMD Ryzen 7 9700X; Cyberpunk 2077 FHD ultra no FSR - external Monitor: Ø475 (466-487)
AMD Ryzen 7 9700X; 1920x1080 The Witcher 3 ultra (external Monitor): Ø441 (430-454)
Power Consumption / Cinebench R15 Multi (external Monitor)
Intel Core i9-14900K, NVIDIA GeForce RTX 4090
548 (545min, 545P1 - 551max) Watt * -214%
Intel Core i9-13900K, NVIDIA GeForce RTX 3090
480 (263min, 277P1 - 553max) Watt * -175%
Intel Core i7-14700K, NVIDIA GeForce RTX 4090
428 (421min, 421P1 - 440max) Watt * -145%
Intel Core i5-14600K, NVIDIA GeForce RTX 4090
329 (323min, 324P1 - 331max) Watt * -88%
Intel Core i9-12900K, NVIDIA Titan RTX (Idle: 70.5 W)
324.4 Watt * -86%
AMD Ryzen 9 7950X, NVIDIA GeForce RTX 3090
320 (235min, 239P1 - 448max) Watt * -83%
AMD Ryzen 9 7900X, NVIDIA GeForce RTX 3090
313 (214min, 221P1 - 406max) Watt * -79%
Intel Core i5-13600K, NVIDIA GeForce RTX 3090
286 (232min, 235P1 - 343max) Watt * -64%
AMD Ryzen 9 7950X3D, NVIDIA GeForce RTX 4090
273 (264min, 264P1 - 304max) Watt * -56%
AMD Ryzen 7 7700X, NVIDIA GeForce RTX 3090 (Idle: 89.8 W)
240 (236min, 236P1 - 252max) Watt * -37%
AMD Ryzen 9 5950X, NVIDIA Titan RTX (Idle: 78 W)
226.1 (160min - 249max) Watt * -29%
AMD Ryzen 5 7600X, NVIDIA GeForce RTX 3090
215 (134.8min, 135.6P1 - 259max) Watt * -23%
AMD Ryzen 5 9600X, NVIDIA GeForce RTX 4090
210 (209min, 209P1 - 210max) Watt * -20%
AMD Ryzen 7 7800X3D, NVIDIA GeForce RTX 4090
207 (203min, 203P1 - 216max) Watt * -19%
Intel Core i5-12600K, NVIDIA Titan RTX (Idle: 70.45 W)
205.9 (145min - 213max) Watt * -18%
Intel Core i5-13400, NVIDIA GeForce RTX 4090
196.6 (194.6min, 194.6P1 - 207max) Watt * -13%
Intel Core i5-12400F, NVIDIA GeForce RTX 4090
194.4 (192.3min, 192.3P1 - 200max) Watt * -11%
AMD Ryzen 7 9700X, NVIDIA GeForce RTX 4090 (Idle: 83 W)
174.6 (173.6min, 173.6P1 - 175.1max) Watt *
Power Consumption / Cinebench R23 Single (external Monitor)
AMD Ryzen 7 7800X3D, NVIDIA GeForce RTX 4090
190.8 (180min, 184.6P1 - 261max) Watt * -70%
Intel Core i7-14700K, NVIDIA GeForce RTX 4090
153.6 (149.9min, 150.4P1 - 202max) Watt * -37%
Intel Core i9-14900K, NVIDIA GeForce RTX 4090
151.5 (145.4min, 146.4P1 - 205max) Watt * -35%
Intel Core i5-14600K, NVIDIA GeForce RTX 4090
149.7 (143.8min, 144.7P1 - 227max) Watt * -33%
AMD Ryzen 5 9600X, NVIDIA GeForce RTX 4090
143.5 (139.1min, 139.7P1 - 160.8max) Watt * -28%
AMD Ryzen 7 7700X, NVIDIA GeForce RTX 3090 (89.8)
137.8 (133.3min, 133.7P1 - 184.3max) Watt * -23%
AMD Ryzen 7 9700X, NVIDIA GeForce RTX 4090 (83)
112.2 (110.2min, 110.5P1 - 131.2max) Watt *
Power Consumption / Cinebench R23 Multi (external Monitor)
Intel Core i9-14900K, NVIDIA GeForce RTX 4090
531 (470min, 479P1 - 573max) Watt * -203%
Intel Core i7-14700K, NVIDIA GeForce RTX 4090
414 (402min, 402P1 - 450max) Watt * -136%
Intel Core i5-14600K, NVIDIA GeForce RTX 4090
332 (329min, 329P1 - 336max) Watt * -89%
AMD Ryzen 9 7950X3D, NVIDIA GeForce RTX 4090
289 (287min, 287P1 - 290max) Watt * -65%
AMD Ryzen 7 7700X, NVIDIA GeForce RTX 3090 (89.8)
237 (233min, 233P1 - 243max) Watt * -35%
AMD Ryzen 5 9600X, NVIDIA GeForce RTX 4090
209 (208min, 208P1 - 210max) Watt * -19%
AMD Ryzen 7 7800X3D, NVIDIA GeForce RTX 4090
203 (202min, 202P1 - 204max) Watt * -16%
AMD Ryzen 7 9700X, NVIDIA GeForce RTX 4090 (83)
175.3 (172.5min, 173.4P1 - 176.2max) Watt *
Power Consumption / The Witcher 3 ultra (external Monitor)
Intel Core i5-14600K, NVIDIA GeForce RTX 4090
564 (547min, 549P1 - 586max) Watt * -28%
Intel Core i9-14900K, NVIDIA GeForce RTX 4090
561 (551min, 552P1 - 597max) Watt * -27%
AMD Ryzen 9 7900X, NVIDIA GeForce RTX 3090
555 (547min, 549P1 - 607max) Watt * -26%
AMD Ryzen 9 7950X, NVIDIA GeForce RTX 3090
538 (532min, 532P1 - 570max) Watt * -22%
Intel Core i9-13900K, NVIDIA GeForce RTX 3090
533 (520min, 525P1 - 568max) Watt * -21%
Intel Core i7-14700K, NVIDIA GeForce RTX 4090
531 (516min, 519P1 - 557max) Watt * -20%
AMD Ryzen 5 7600X, NVIDIA GeForce RTX 3090
519 (510min, 513P1 - 564max) Watt * -18%
AMD Ryzen 9 7950X3D, NVIDIA GeForce RTX 4090
517 (508min, 510P1 - 539max) Watt * -17%
AMD Ryzen 7 7700X, NVIDIA GeForce RTX 3090 (Idle: 89.8 W)
516 (512min, 512P1 - 529max) Watt * -17%
Intel Core i5-13600K, NVIDIA GeForce RTX 3090
500 (491min, 493P1 - 528max) Watt * -13%
Intel Core i5-13400, NVIDIA GeForce RTX 4090
498 (476min, 490P1 - 507max) Watt * -13%
AMD Ryzen 7 7800X3D, NVIDIA GeForce RTX 4090
497 (482min, 484P1 - 510max) Watt * -13%
Intel Core i9-12900K, NVIDIA Titan RTX (Idle: 70.5 W)
463 (439min - 490max) Watt * -5%
AMD Ryzen 7 9700X, NVIDIA GeForce RTX 4090 (Idle: 83 W)
441 (430min, 431P1 - 454max) Watt *
AMD Ryzen 9 5950X, NVIDIA Titan RTX (Idle: 78 W)
440.5 (420min - 466max) Watt * -0%
Intel Core i5-12400F, NVIDIA GeForce RTX 4090
440 (410min, 419P1 - 455max) Watt * -0%
Intel Core i5-12600K, NVIDIA Titan RTX (Idle: 70.45 W)
408.9 (401min - 460max) Watt * +7%
Power Consumption / Prime95 V2810 Stress (external Monitor)
Intel Core i9-14900K, NVIDIA GeForce RTX 4090
537 (508min, 510P1 - 606max) Watt * -198%
Intel Core i9-13900K, NVIDIA GeForce RTX 3090
471 (414min, 427P1 - 561max) Watt * -161%
Intel Core i7-14700K, NVIDIA GeForce RTX 4090
400 (376min, 377P1 - 428max) Watt * -122%
Intel Core i5-14600K, NVIDIA GeForce RTX 4090
370 (349min, 349P1 - 422max) Watt * -105%
Intel Core i5-13600K, NVIDIA GeForce RTX 3090
348 (283min, 288P1 - 496max) Watt * -93%
AMD Ryzen 9 7950X, NVIDIA GeForce RTX 3090
321 (303min, 304P1 - 439max) Watt * -78%
AMD Ryzen 9 7900X, NVIDIA GeForce RTX 3090
319 (310min, 311P1 - 357max) Watt * -77%
Intel Core i9-12900K, NVIDIA Titan RTX (Idle: 70.5 W)
279.6 (261min - 357max) Watt * -55%
AMD Ryzen 9 7950X3D, NVIDIA GeForce RTX 4090
276 (267min, 267P1 - 329max) Watt * -53%
Intel Core i5-12600K, NVIDIA Titan RTX (Idle: 70.45 W)
256.5 (238min - 275max) Watt * -42%
AMD Ryzen 9 5950X, NVIDIA Titan RTX (Idle: 78 W)
252.3 (227min - 259max) Watt * -40%
Intel Core i5-12400F, NVIDIA GeForce RTX 4090
239 (225min, 226P1 - 252max) Watt * -33%
AMD Ryzen 7 7700X, NVIDIA GeForce RTX 3090 (Idle: 89.8 W)
230 (216min, 217P1 - 265max) Watt * -28%
Intel Core i5-13400, NVIDIA GeForce RTX 4090
229 (224min, 224P1 - 247max) Watt * -27%
AMD Ryzen 5 7600X, NVIDIA GeForce RTX 3090
227 (218min, 219P1 - 245max) Watt * -26%
AMD Ryzen 7 7800X3D, NVIDIA GeForce RTX 4090
218 (214min, 215P1 - 223max) Watt * -21%
AMD Ryzen 5 9600X, NVIDIA GeForce RTX 4090
213 (207min, 208P1 - 220max) Watt * -18%
AMD Ryzen 7 9700X, NVIDIA GeForce RTX 4090 (Idle: 83 W)
180.2 (178.9min, 178.9P1 - 181.7max) Watt *
Power Consumption
AMD Ryzen 7 9700X, NVIDIA GeForce RTX 4090
475 Watt *
AMD Ryzen 5 9600X, NVIDIA GeForce RTX 4090
561 Watt *

* ... kleiner is beter

Power Consumption / Cinebench R15 Multi Efficiency (external Monitor)
AMD Ryzen 9 7950X3D, NVIDIA GeForce RTX 4090
21.9 Points per Watt +20%
AMD Ryzen 7 9700X, NVIDIA GeForce RTX 4090
18.2 Points per Watt
AMD Ryzen 7 7800X3D, NVIDIA GeForce RTX 4090
14.4 Points per Watt -21%
Intel Core i7-14700K, NVIDIA GeForce RTX 4090
12.8 Points per Watt -30%
AMD Ryzen 5 9600X, NVIDIA GeForce RTX 4090
12.5 Points per Watt -31%
Intel Core i9-14900K, NVIDIA GeForce RTX 4090
11.5 Points per Watt -37%
Intel Core i5-14600K, NVIDIA GeForce RTX 4090
11.1 Points per Watt -39%
Power Consumption / Cinebench R23 Single Power Efficiency - external Monitor
AMD Ryzen 7 9700X, NVIDIA GeForce RTX 4090
19.7 Points per Watt
Intel Core i9-14900K, NVIDIA GeForce RTX 4090
15.51 Points per Watt -21%
AMD Ryzen 5 9600X, NVIDIA GeForce RTX 4090
15.2 Points per Watt -23%
Intel Core i7-14700K, NVIDIA GeForce RTX 4090
14 Points per Watt -29%
Intel Core i5-14600K, NVIDIA GeForce RTX 4090
13.8 Points per Watt -30%
AMD Ryzen 7 7800X3D, NVIDIA GeForce RTX 4090
9.54 Points per Watt -52%
Power Consumption / Cinebench R23 Multi Power Efficiency - external Monitor
AMD Ryzen 9 7950X3D, NVIDIA GeForce RTX 4090
125.6 Points per Watt +7%
AMD Ryzen 7 9700X, NVIDIA GeForce RTX 4090
116.9 Points per Watt
AMD Ryzen 7 7800X3D, NVIDIA GeForce RTX 4090
89.1 Points per Watt -24%
Intel Core i7-14700K, NVIDIA GeForce RTX 4090
86.7 Points per Watt -26%
AMD Ryzen 5 9600X, NVIDIA GeForce RTX 4090
82.2 Points per Watt -30%
Intel Core i9-14900K, NVIDIA GeForce RTX 4090
77.57 Points per Watt -34%
Intel Core i5-14600K, NVIDIA GeForce RTX 4090
73.8 Points per Watt -37%
Power Consumption / Witcher 3 ultra Efficiency (external Monitor)
AMD Ryzen 7 9700X, NVIDIA GeForce RTX 4090
0.642 fps per Watt
AMD Ryzen 7 7800X3D, NVIDIA GeForce RTX 4090
0.632 fps per Watt -2%
Intel Core i5-12400F, NVIDIA GeForce RTX 4090
0.627 fps per Watt -2%
AMD Ryzen 9 7950X3D, NVIDIA GeForce RTX 4090
0.59 fps per Watt -8%
AMD Ryzen 9 7950X, NVIDIA GeForce RTX 4090
0.56 fps per Watt -13%
Intel Core i9-14900K, NVIDIA GeForce RTX 4090
0.56 fps per Watt -13%
Intel Core i5-14600K, NVIDIA GeForce RTX 4090
0.56 fps per Watt -13%
Intel Core i5-13400, NVIDIA GeForce RTX 4090
0.557 fps per Watt -13%
Intel Core i7-14700K, NVIDIA GeForce RTX 4090
0.54 fps per Watt -16%

Pro

+ Nieuwe OC-functies
+ Volledige ondersteuning voor bestaande AM5 moederborden
+ Uitstekende single-core prestaties
+ Op gelijke voet met Intel's beste in gaming
+ Goede energie-efficiëntie en lage bedrijfstemperaturen

Contra

- Kan bij gaming niet tippen aan Ryzen 7000X3D CPU's
- Standaard 65 W TDP beperkt processorprestaties
- Geen significante verbeteringen ten opzichte van Zen 4 in de standaardconfiguratie
- Lange initiële DDR5-trainingstijden
- Hoge prijs in vergelijking met de concurrentie

Verdict: Deze Zen 5-chip is een ingewikkeld waardevoorstel

AMD Ryzen 7 9700X. Review-eenheid met dank aan AMD India

AMD had vorig jaar een winnende formule met Zen 4, en de Zen 5-chips van dit jaar zetten het momentum voort. Hoewel de 4 nm Zen 5 architectuur opmerkelijke veranderingen met zich meebrengt, vertalen veel van deze veranderingen zich niet altijd in rauwe prestatiewinst bij alle werklasten.

De standaard 65 W lagere TDP zorgt voor meer PBO headroom, waardoor de CPU de geadverteerde 5,5 GHz boosts gemakkelijker kan bereiken. Dit betekent echter ook lagere basisfrequenties en niet veel algehele prestatiewinst ten opzichte van Zen 4.

Single-core prestaties zijn waar de Ryzen 7 9700X schittert, vaak knagend aan de hielen van kolossen zoals de Intel Core i9-13900K en de Core i9-14900K. Multi-core prestaties blijven echter achter bij die van de Core i5-14600Kdie nu voor US$300 te koop is op Amazon, vergeleken met de US$360 vraagprijs voor de nieuwste van AMD.

De Ryzen 7 9700X komt ook over als een uitstekende CPU voor zowel lage als hoge-resolutie gaming, en komt vrijwel overeen met alle andere geprezen gaming CPU's in de vergelijking, behalve de Ryzen 7000 X3D chips. Het enkele CCD-ontwerp levert ook geen problemen op met de planning, wat betekent dat u met Windows 10 kunt blijven werken zonder de streken van Windows 11 te hoeven uithalen.

De AMD Ryzen 7 9700X bouwt voort op het succes van Zen 4 en blijkt een uitstekende keuze te zijn voor single-core workloads en gaming. Desondanks zorgt de prijsstelling voor een dilemma in vergelijking met mid-range opties van Intel en AMD's eigen lagere Ryzen 5 9600X."

Energie-efficiëntie is een ander aspect dat AMD blijft verbeteren. Hoewel single-core energie-efficiëntie niet veel is om over naar huis te schrijven - de Ryzen 5 9600X neemt de taart in dit opzicht - de Ryzen 7 9700X laat wel aanzienlijke efficiëntieverbeteringen zien in multi-core en gaming workloads in vergelijking met het aanbod van Intel.

Dus, is de AMD Ryzen 7 9700X de definitieve keuze voor een mid-range gaming build? Het is eigenlijk een moeilijke beslissing.

De Intel Core i7-14700K biedt een hoger aantal kernen en is nu verkrijgbaar voor US$397 op Amazon - dat zijn 14 meer kernen en 12 extra threads voor slechts US$37 meer. Zelfs de Core i5-14600K biedt inherente voordelen bij multi-core werklasten dankzij het hogere aantal cores/threads in vergelijking met de Ryzen 7 9700X.

Echter, Intel's huidige stand van zaken met 13e en 14e generatie processoren maakt het op dit moment een moeilijke aanbeveling. Natuurlijk heeft het bedrijf aanpassingen om de hoge spanningspieken aan te pakken en honoreert RMA's voor verslechterde CPU's, maar deze problemen hadden in eerste instantie niet mogen bestaan. Wij raden u aan te wachten tot Arrow Lake-S CPU's in de komende maanden aankomen als u een nieuwe build met Intel erin plant.

Als uw primaire toepassingen voornamelijk single-threaded workloads en gaming zijn, dan zou de Ryzen 5 9600X van US$279 prima moeten voldoen, aangezien de Ryzen 7 9700X geen praktisch voordeel biedt op deze gebieden. De Ryzen 7 7700X, die momenteel US$ 299 kost op Amazon, biedt ook veel waar voor uw geld.

De besparingen die dit oplevert, kunnen worden gebruikt voor de aanschaf van kwaliteits Socket AM5 moederborden en DDR5 RAM, die nog steeds aan de hogere kant geprijsd zijn.

Prijs en beschikbaarheid

De AMD Ryzen 7 9700X is momenteel verkrijgbaar op Amazon US voor US$359 en op Amazon DE voor €386.

De processor wordt momenteel verkocht op Amazon India voor ₹36.190 en is ook verkrijgbaar voor iets lagere prijzen bij lokale retailers.

Transparency

The selection of devices to be reviewed is made by our editorial team. The test sample was provided to the author as a loan by the manufacturer or retailer for the purpose of this review. The lender had no influence on this review, nor did the manufacturer receive a copy of this review before publication. There was no obligation to publish this review. We never accept compensation or payment in return for our reviews. As an independent media company, Notebookcheck is not subjected to the authority of manufacturers, retailers or publishers.

This is how Notebookcheck is testing

Every year, Notebookcheck independently reviews hundreds of laptops and smartphones using standardized procedures to ensure that all results are comparable. We have continuously developed our test methods for around 20 years and set industry standards in the process. In our test labs, high-quality measuring equipment is utilized by experienced technicians and editors. These tests involve a multi-stage validation process. Our complex rating system is based on hundreds of well-founded measurements and benchmarks, which maintains objectivity. Further information on our test methods can be found here.

Price comparison

Please share our article, every link counts!
> Overzichten en testrapporten over laptops en mobieltjes > Testrapporten > AMD Ryzen 7 9700X Review: Core i9-14900K niveaus van single-core en gaming prestaties met Zen 5 voor US$185 minder
Vaidyanathan Subramaniam, 2024-08-19 (Update: 2024-08-19)