

Intel Core Ultra 9 285K Arrow Lake-S Review: cPU van $589 offert gaming-kroon op om energie-efficiëntie te evenaren met AMD Zen 5 Ryzen 9000
Energiezuinig, maar niet geschikt voor gaming.
Intel's nieuwe Arrow Lake-S Core Ultra 9 285 introduceert een nieuwe compute tile layout die hyperthreading opoffert en is bedoeld om enthousiastelingen over de streep te trekken met aanzienlijke efficiëntieverbeteringen. Hoewel de Core Ultra 9 285K inderdaad goede ruwe CPU-prestaties en efficiëntie levert, verliest hij op het gebied van gaming zwaar van de Intel Raptor Lake-S Refresh en AMD Zen 5 Ryzen 9000 aanbiedingen.Vaidyanathan Subramaniam (vertaald door DeepL / Ninh Duy) Gepubliceerd 🇺🇸 🇩🇪 ...
Verdict: Intel's efficiëntiespel stuit op een probleem bij gaming
Intels desktopchips staan niet bepaald bekend om hun efficiëntie, maar het bedrijf hoopt het verhaal te herschrijven met de lancering van Arrow Lake-S vandaag.
Intels nieuwe Arrow Lake-S line-up, aangevoerd door de Core Ultra 9 285K, markeert een belangrijke verschuiving door hyperthreading te verwijderen voor alle modellen - een primeur sinds het Pentium 4-tijdperk. In cumulatieve CPU-benchmarks evenaart de Core Ultra 9 285K de Core i9-14900K en bereikt bijna het prestatieniveau van de Ryzen 9 9950X.
Dat gezegd hebbende, zien we dat de Core Ultra 9 285K beide CPU's overtreft in individuele single- en multi-core benchmarks.
Wat ons in het bijzonder beviel, is het vermogen van Arrow Lake-S om even goed of zelfs iets beter te presteren dan Raptor Lake-S Refresh, terwijl de energie-efficiëntie vergelijkbaar is met die van AMD's Zen 5-processoren.
Ondanks deze vooruitgang heeft de Core Ultra 9 285K echter moeite met gamingprestaties en valt hij achter zowel de Core i9-14900K als de Zen 5 CPU's in alle geteste resoluties.
De Core Ultra 9 285K is beperkt tot het concurreren met alleen de Core i7-14700K in gaming. Dit is verrassend gezien de ingebouwde APO-optimalisaties van Arrow Lake-S en het gebrek aan hyperthreading, die de CPU in theorie hadden moeten helpen betere gaming-scores te behalen.
Het nieuwe platform vereist ook extra investeringen in nieuwe 800-serie moederborden en DDR5-geheugen, en dit is iets waar u rekening mee moet houden voordat u gaat upgraden.
Pro
Contra
Prijs en beschikbaarheid
De Intel Core Ultra 9 285K is vanaf vandaag wereldwijd verkrijgbaar bij retailers tegen een adviesprijs van $589. De nu afgeprijsde Core i9-14900K blijft levensvatbaar als u prioriteit geeft aan zowel computing als gaming, ondanks lichte prestatieverminderingen door nieuwere BIOS'en.
De AMD Ryzen 9 9950X(momenteel $709 op Amazon) en Ryzen 9 9900X($429 op Amazon) blijven uitstekende alternatieven zonder de gaming-haperingen van de Core Ultra 9 285K.
Price comparison
Inhoudsopgave
- Verdict: Intel's efficiëntiespel stuit op een probleem bij gaming
- De testbank: GeForce RTX 4090 is een goede match voor de Core Ultra 9 285K
- CPU-prestaties: Over het algemeen op gelijke voet met Core i9-14900K met kleine verbeteringen ten opzichte van Ryzen 9 9950X
- Systeemprestaties: In dezelfde competitie als Core i9-14900K en AMD Zen 5
- 3D en gamingprestaties: Arrow Lake-S stelt enorm teleur
- Stroomverbruik: Intel krijgt energie-efficiëntie eindelijk onder de knie
- Notebookcheck's algemene indruk van de Core Ultra 9 285K
Intels vlaggenschip, de 13e en 14e generatie desktopprocessoren, waren in het nieuws om alle verkeerde redenen nog niet zo lang geleden, maar hopelijk verandert dat vandaag allemaal ten goede. Na een goede start met Lunar Lake voor laptops, richt Intel zich nu op Arrow Lake-S voor de desktop.
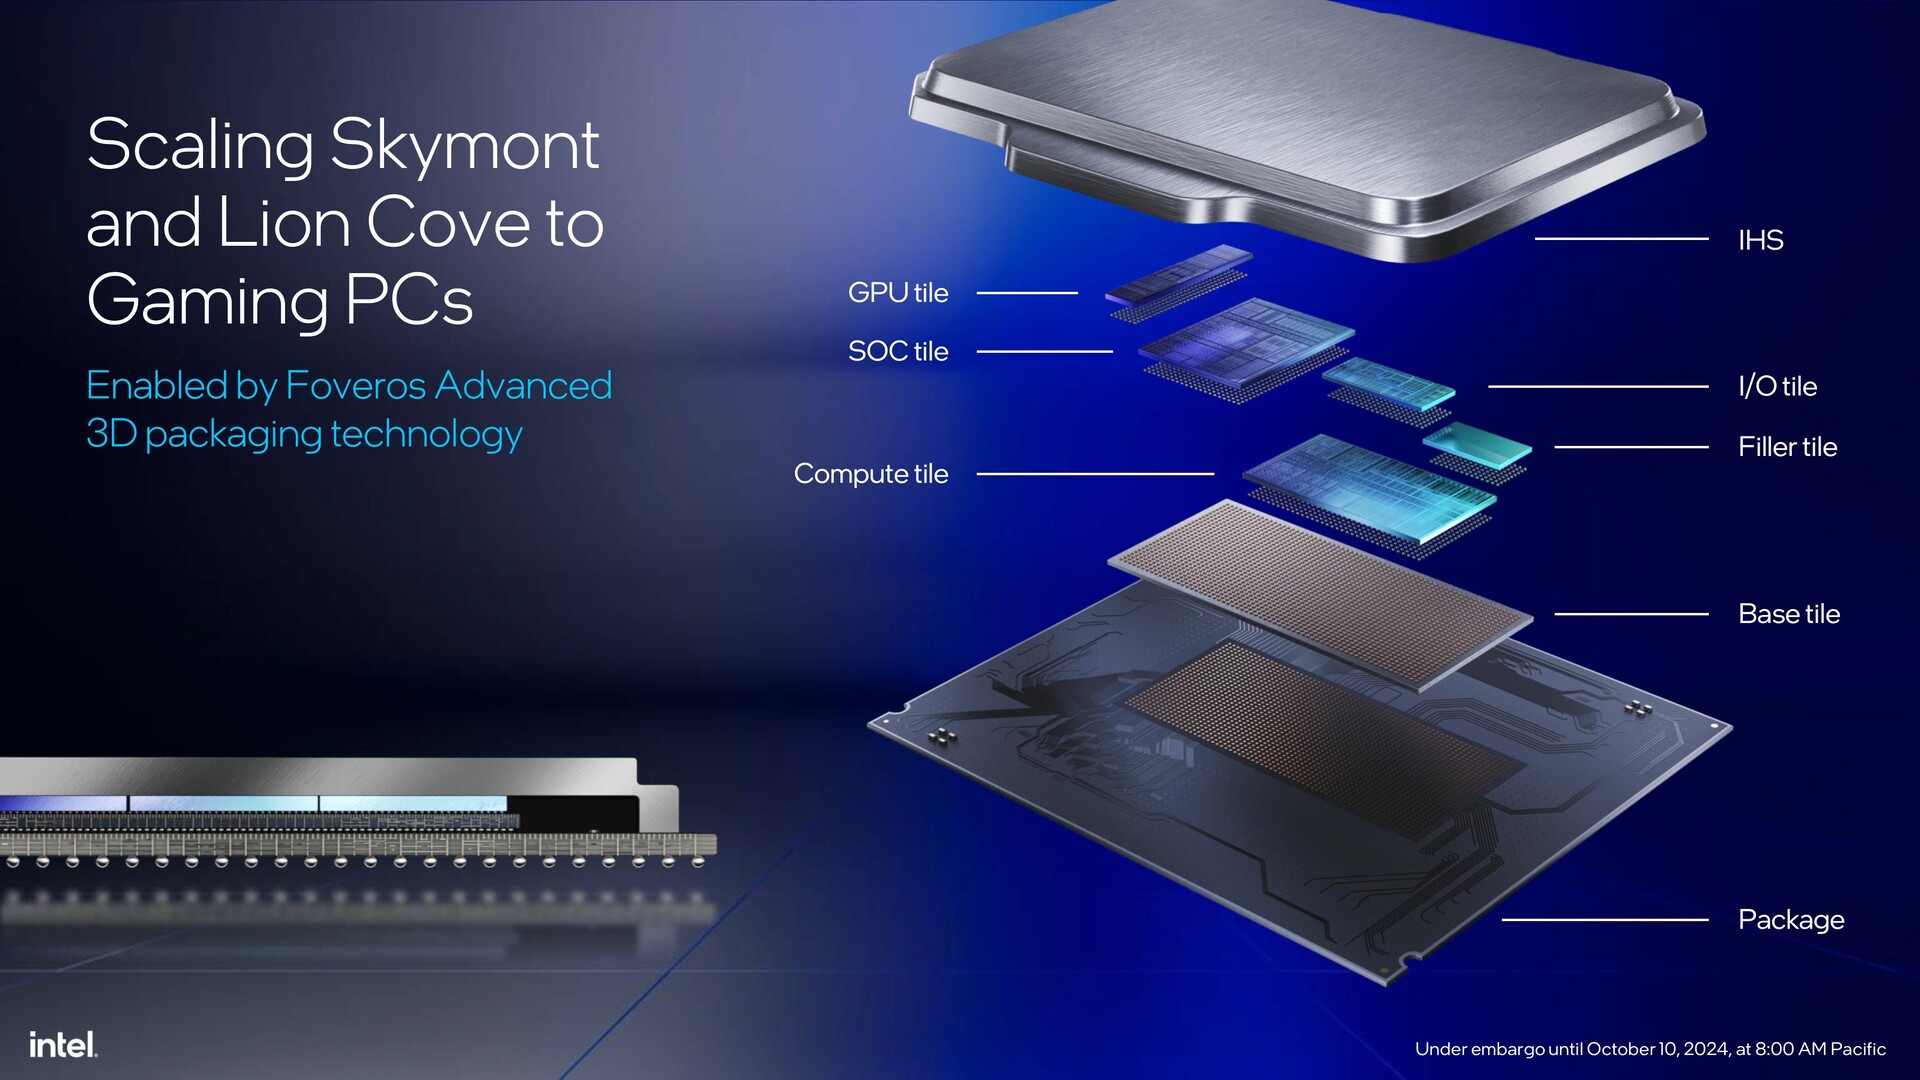
Arrow Lake-S, of de Core Ultra 200S Series zoals de marketing het om de een of andere reden wil noemen, markeert een paradigmaverschuiving in Intels strategie voor desktop CPU's. Deze generatie ziet Intel's Foveros 3D-verpakking voor het eerst naar desktops komen.
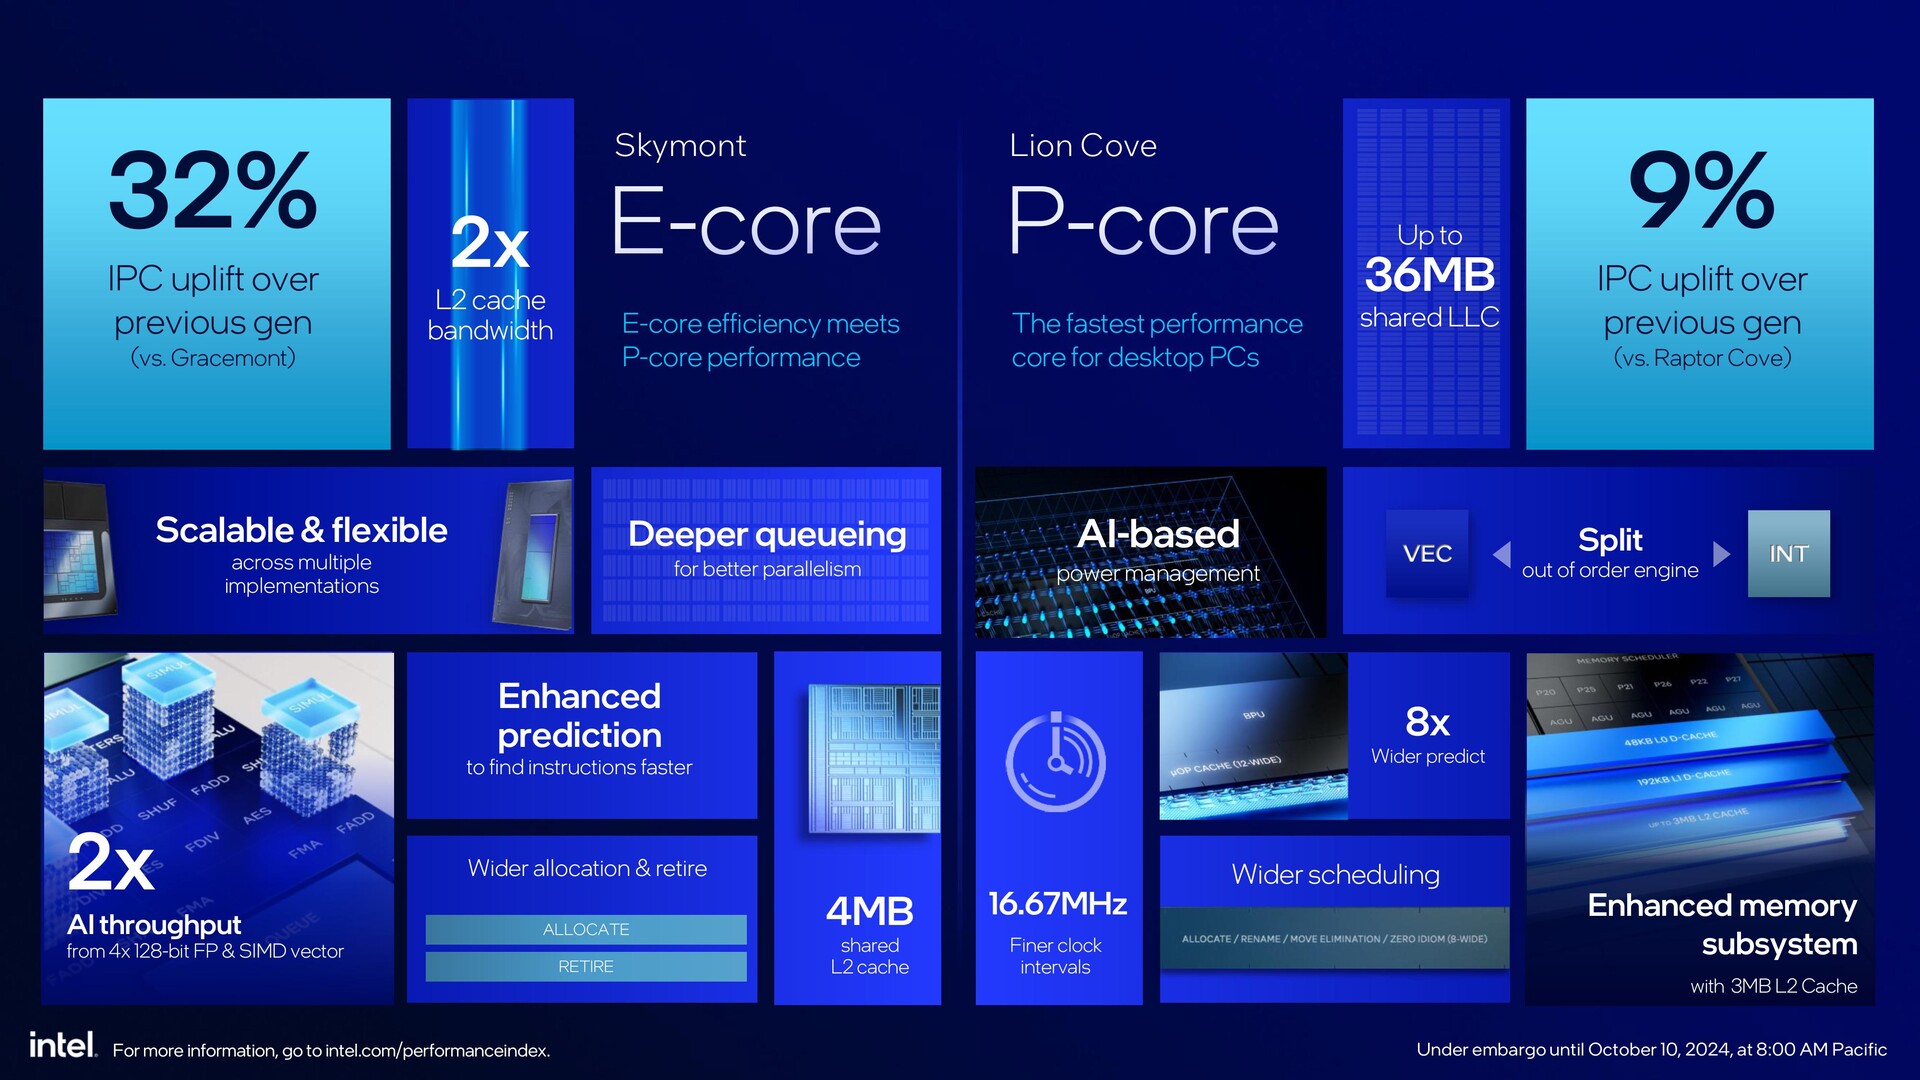
Deze generatie ziet Intel's Foveros 3D-verpakking voor het eerst naar desktops komen, het gebruik van TSMC's 3 nm productielijnen in plaats van die van Intel, een nieuwe Compute tile met herschikte Lion Cove P-cores en Skymont E-cores zonder hyperthreading, grotere L2-cache op de P-cores, en de komst van de Alchemist Xe iGPU en NPU - die beide hergebruikt zijn uit Meteor Lake.
De Foveros-verpakking van Arrow Lake-S bevat in totaal zes tegels, waarvan er vier gebaseerd zijn op TSMC-knooppunten. Dit zijn Compute (N3B), Xe-LPG Alchemist iGPU (N5P), SoC (N6), I/O (N6), een opvultegel voor stabiliteit en de Base-tegel (Intel 1227.1 22 nm FinFET).
Met al deze componenten op de verpakking zijn er onvermijdelijk nieuwe stroomvereisten en dus een nieuwe socket nodig. Arrow Lake-S processoren vereisen nieuwe 800-serie moederborden met de nieuwe LGA 1851 socket. Helaas weet Intel nog niet of de komende generaties CPU's deze nieuwe pin-layout zullen gebruiken.
Dit gaat ook gepaard met de noodzaak om volledig over te stappen op DDR5-geheugen, omdat deze CPU's de hybride geheugencontroller missen die aanwezig is in Raptor Lake-S en Alder Lake-S.
In deze review bekijken we de nieuwe Intel Core Ultra 9 285K en kijken we of Intels beslissingen voor desktopcomputers genoeg uitdaging kunnen bieden aan AMD's nieuwste Ryzen 9000-aanbiedingen en Intels eigen 14e generatie chips.
Een overzicht van Intel Core Ultra 200S serie Arrow Lake-S desktop processors
| SKU | Kernen / Draden | P-Core Klok / Turbo | E-Core Klok / Turbo | Turbo Boost Max 3.0 | Totale L2 Cache | L3 Cache | Geïntegreerde Graphics | NPU Peak TOPS | PBP (PL1) | MTP (PL2) | MSRP |
|---|---|---|---|---|---|---|---|---|---|---|---|
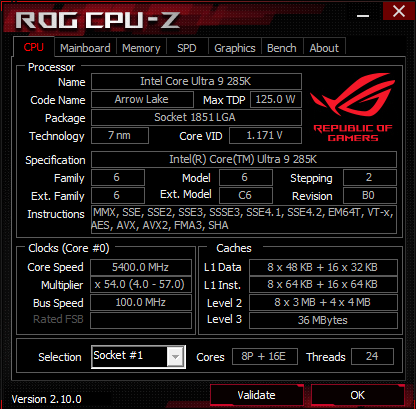
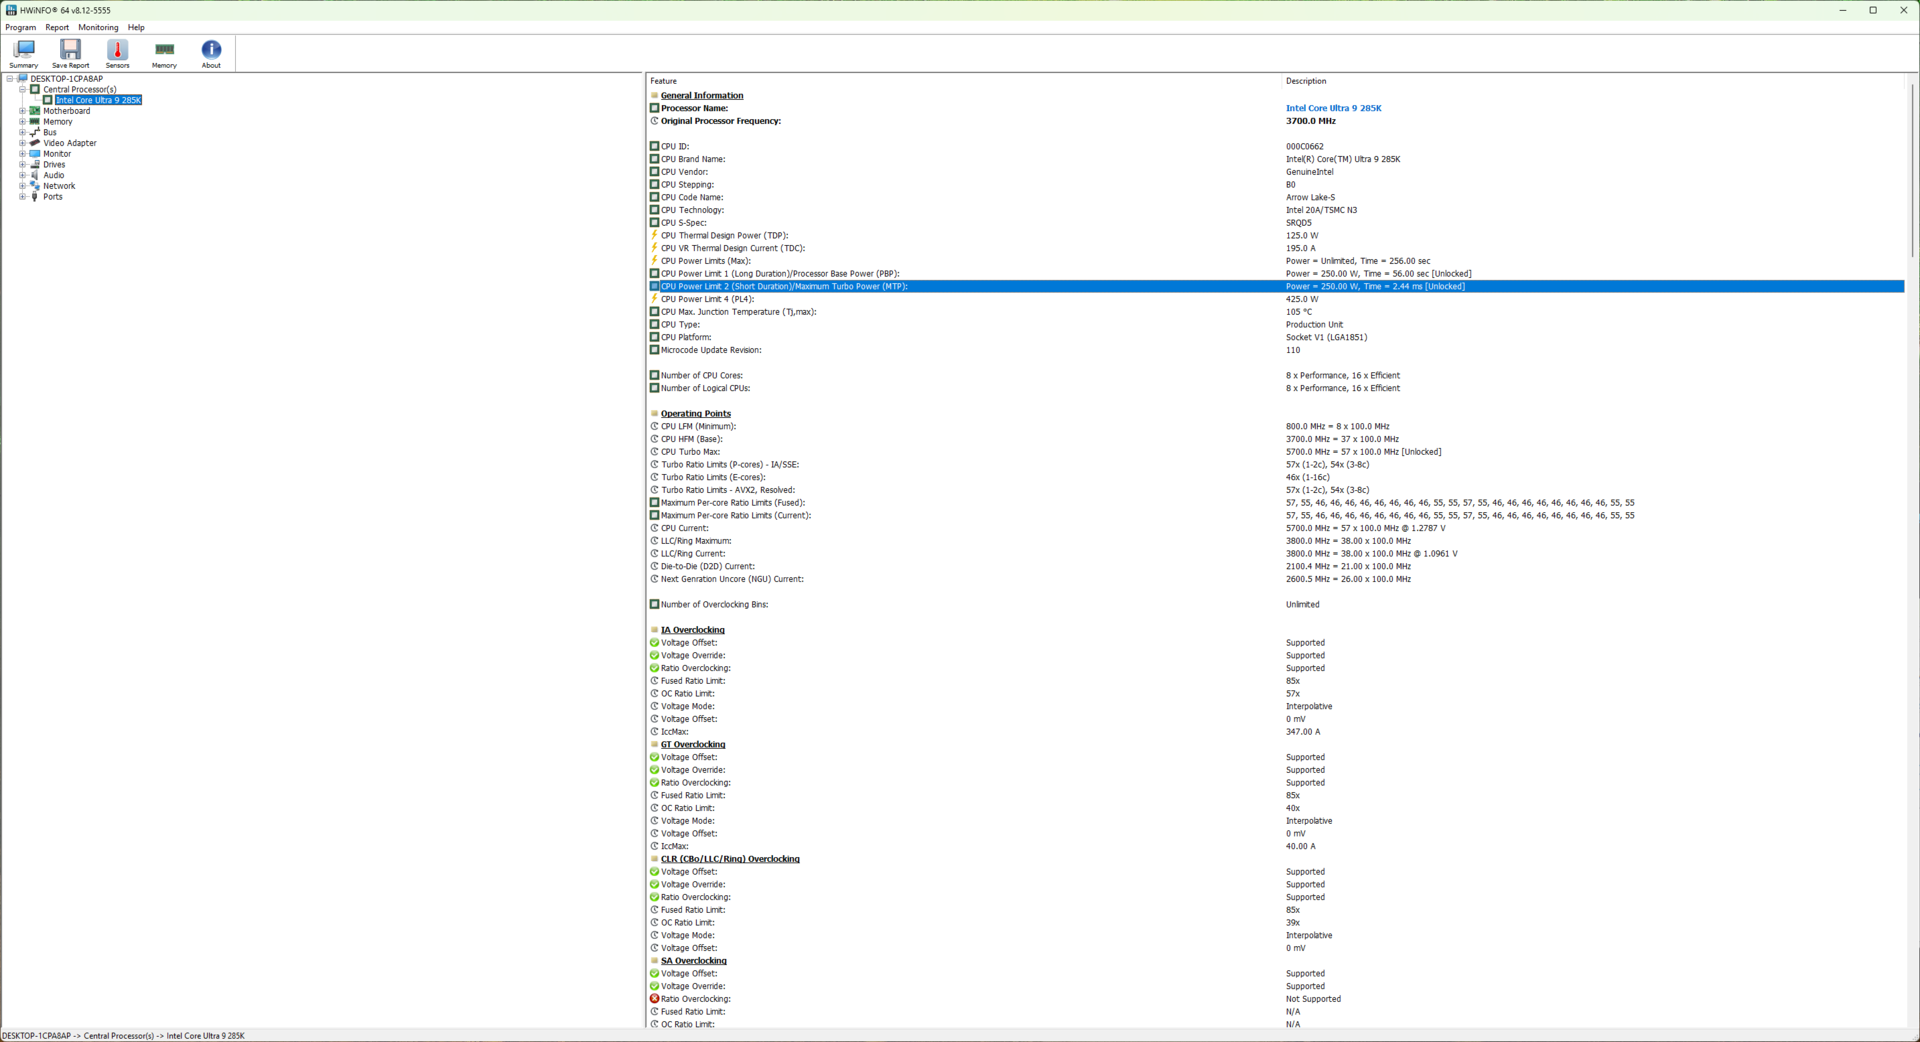
| Intel Core Ultra 9 285K | 24 (8P + 16E) /24 | 3,7 GHz / 5,5 GHz | 3,2 GHz / 4,6 GHz | 5,6 GHz | 40 MB | 36 MB | 4Xe kernen, 2,0 GHz | 13 TOPS | 125 W | 250 W | $589 |
| Intel Core Ultra 7 265K | 20 (8P + 12E) /20 | 3,9 GHz / 5,4 GHz | 3,3 GHz / 4,6 GHz | 5,6 GHz | 36 MB | 30 MB | 4 Xe kernen, 2,0 GHz | 13 TOPS | 125 W | 250 W | $394 |
| Intel Core Ultra 7 265KF | 20 (8P + 12E) /20 | 3,9 GHz / 5,4 GHz | 3,3 GHz / 4,6 GHz | 5,6 GHz | 36 MB | 30 MB | - | 13 TOPS | 125 W | 250 W | $379 |
| Intel Core Ultra 5 245K | 14 (6P + 8E) /14 | 3,9 GHz / 5,4 GHz | 4,2 GHz / 5,2 GHz | 5,2 GHz | 26 MB | 24 MB | 4 Xe kernen, 1,9 GHz | 13 TOPS | 125 W | 159 W | $309 |
| Intel Core Ultra 5 245KF | 14 (6P + 8E) /14 | 3,9 GHz / 5,4 GHz | 4,2 GHz / 5,2 GHz | 5,2 GHz | 26 MB | 24 MB | - | 13 TOPS | 125 W | 159 W | $294 |
De testbank: GeForce RTX 4090 is een goede match voor de Core Ultra 9 285K
We hebben de volgende componenten gebruikt om de Core Ultra 9 285K te testen:
- Cooler Master MasterFrame 700 open testbank
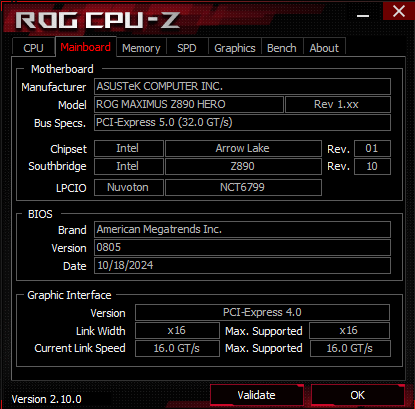
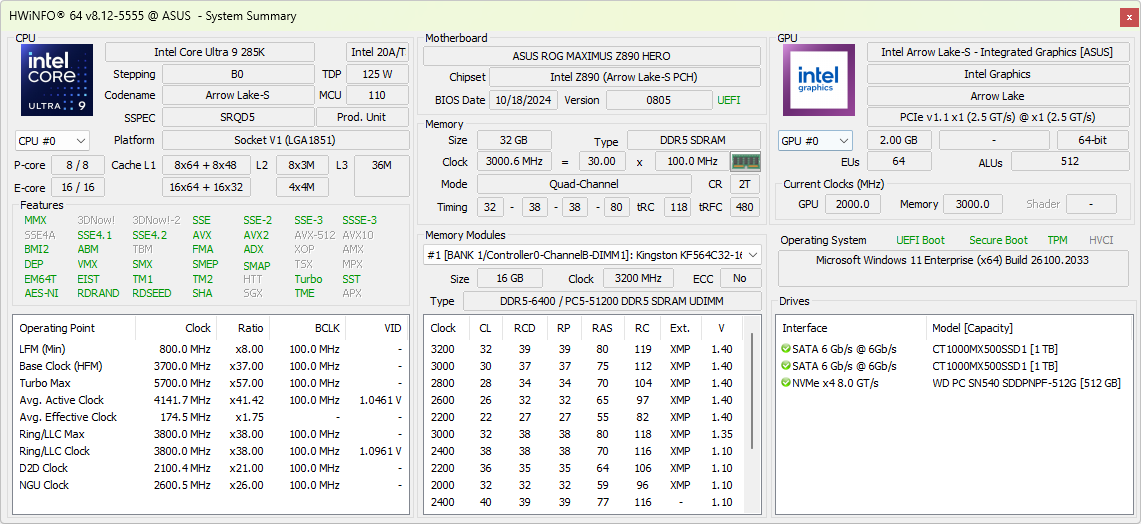
- Asus ROG Maximus Z890 Hero moederbord met BIOS versie 0805
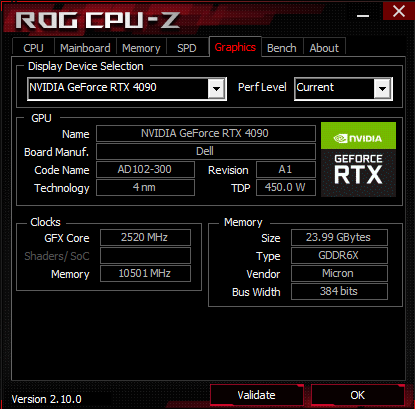
- Nvidia GeForce RTX 4090 stichterseditie GPU
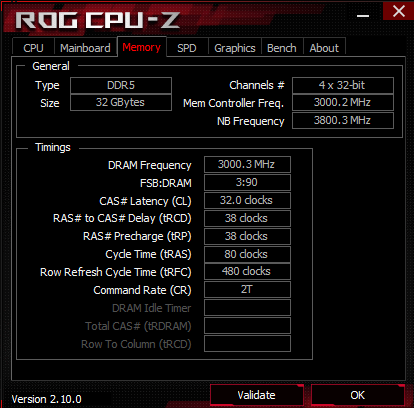
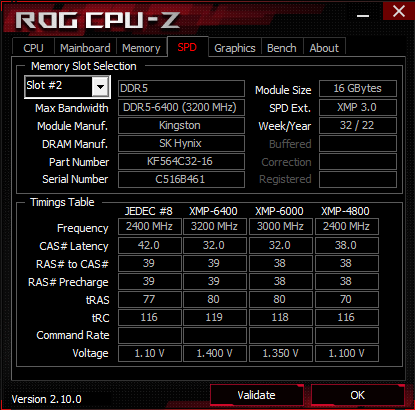
- 2x 16 GB Kingston Fury Beast DDR5-6400 RAM op DDR5-6000 met timings 32-38-38-80 bij 1,35 V
- Western Digital PC SN540 512 GB NVMe SSD en 2x Crucial MX500 1 TB SATA SSD's voor OS, benchmarks en games
- Alienware AW3225QF 4K 240 Hz QD-OLED monitor
- Thermaltake TH420 V2 Ultra EX ARGB AiO-koeler
- Cooler Master MVE Gold V2 1250 ATX 3.0 volledig modulaire PSU
We willen Intel bedanken voor het leveren van het Core Ultra 9 285K testmonster, Nvidia voor de RTX 4090 Founders Edition GPU, Asus voor het ROG Maximus Z890 Hero moederbord, Dell voor de AW3225QF monitor, Kingston voor de DDR5 geheugenkit, Thermaltake voor de TH420 V2 Ultra EX AIO, en tot slot Cooler Master voor de testbank en voeding.
Alle tests werden uitgevoerd op een nieuwe installatie van Windows 11 24H2 (Build 26100.2033) samen met de nieuwste platformstuurprogramma's en Nvidia Game Ready Driver 566.03.
We gebruikten de standaard Intel prestatie-instellingen in het BIOS en stelden het Windows energieplan in op Ultimate Performance, wat PL1=PL2=250 W instelt.
CPU-prestaties: Over het algemeen op gelijke voet met Core i9-14900K met kleine verbeteringen ten opzichte van Ryzen 9 9950X
Cumulatieve CPU-tests laten zien dat de Core Ultra 9 285K op gelijke voet staat met de Core i9-14900K en slechts een klein beetje achterblijft bij de AMD Ryzen 9 9950X. Dit is grotendeels te wijten aan het feit dat de Core Ultra 9 285K achterblijft bij de Ryzen 9 9950X in specifieke tests zoals Blender 2.79 BMW27 CPU, V-Ray tests, wPrime 2.1, en R benchmark, hoewel de verschillen niet zo significant zijn.
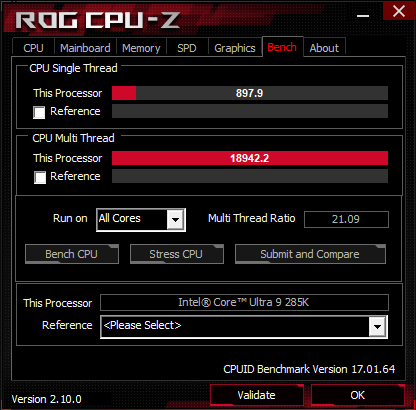
In Cinebench single-core tests weet de Ultra 9 285K de Core i9-14900K net voor te blijven, met de
Ryzen 9 9900X en de Ryzen 9 9950X op de hielen knagen. De situatie is echter anders in Geekbench, waar Zen 5-chips minuscule verbeteringen weten te behalen ten opzichte van Arrow Lake-S.De multikernwinsten zijn beter voelbaar, met de 24C/24T Core Ultra 9 285K die 4-6% winst laat zien ten opzichte van de 16C/32T Ryzen 9 9950X in Cinebench multikerntests, ondanks het ontbreken van hyperthreading. De Core Ultra 9 285K, Core i9-14900K en de Ryzen 9 9950X presteren allemaal vergelijkbaar in Geekbench 6.3 multi-core.
| CPU Performance Rating - Percent | |
| AMD Ryzen 9 9950X | |
| Intel Core i9-14900K -1! | |
| Intel Core Ultra 9 285K | |
| AMD Ryzen 9 7950X -2! | |
| Intel Core i9-13900K | |
| AMD Ryzen 9 7950X3D | |
| AMD Ryzen 9 9900X -9! | |
| Intel Core i7-14700K | |
| AMD Ryzen 9 7900X -2! | |
| AMD Ryzen 7 9700X | |
| Intel Core i5-14600K | |
| Intel Core Ultra 5 245K | |
| Intel Core i9-12900K -1! | |
| Intel Core i5-13600K -2! | |
| AMD Ryzen 5 9600X -2! | |
| AMD Ryzen 7 7800X3D -3! | |
| Intel Core i5-12600K -3! | |
* ... kleiner is beter
Cinebench R15 meervoudige lus
Net als zijn voorgangers wordt de Core Ultra 9 285K niet geleverd met een CPU-koeler in de doos. Intel zegt dat koelers die ontworpen zijn voor LGA 1700 compatibel zouden moeten zijn met LGA 1851. We hebben geen problemen ondervonden bij het monteren van onze Thermaltake TH420 V2 Ultra EX ARGB all-in-one koeler met behulp van dezelfde montagebeugels die bedoeld zijn voor de LGA 1700 socket.
Dit gezegd hebbende, verwacht nieuwe LGA 1851-specifieke koelers die rekening houden met de aanwezigheid van de Compute tile in het zuidwesten van de verpakking. Koelers die ontworpen zijn voor Arrow Lake-S kunnen iets betere koelprestaties bieden, maar uw bestaande LGA 1700 oplossing zal prima werken.
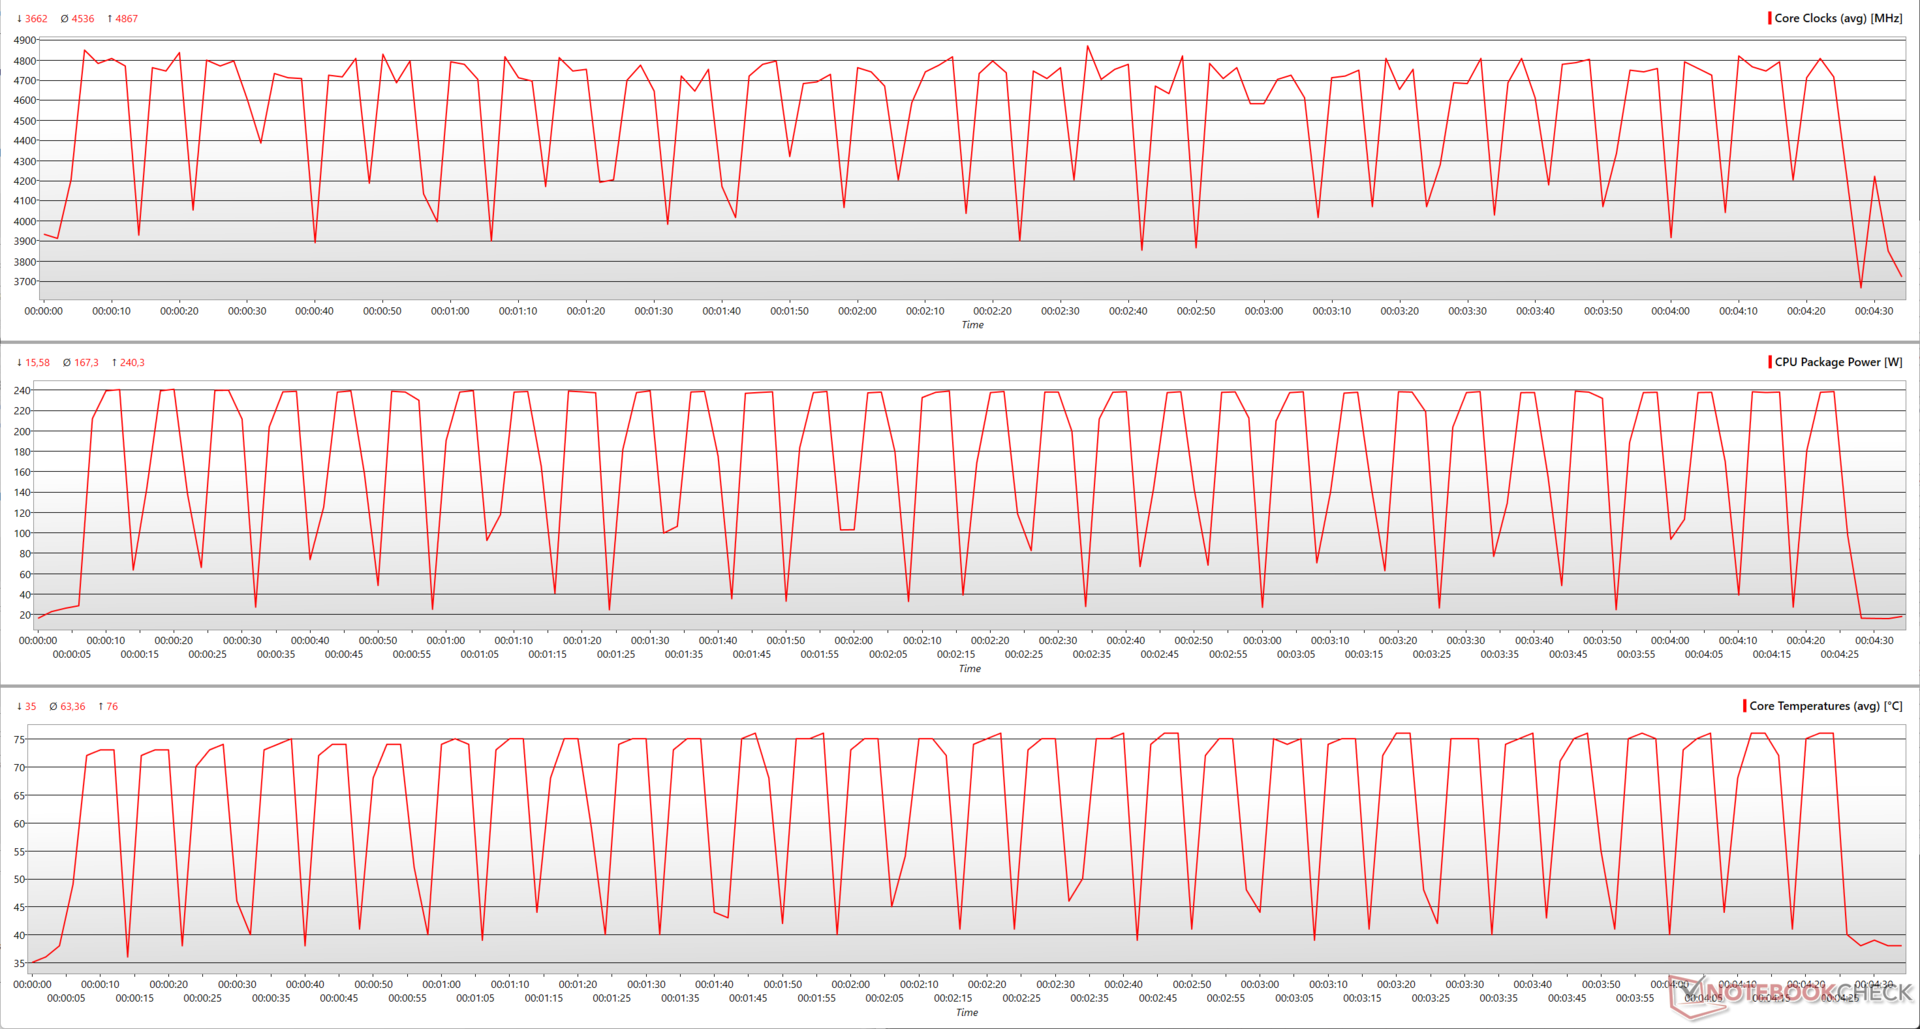
Het vermogen van de TH420 V2 Ultra EX om de Core Ultra 9 285K efficiënt te koelen blijkt duidelijk uit de consistente prestaties in de Cinebench R15 multi-core loop hieronder.
We zien dat de Core Ultra 9 285K kan opvoeren tot 4,86 GHz tijdens de Cinebench R15 multi-core loop, met gemiddelde kloksnelheden op 4,53 GHz.
Deze prestaties worden bereikt met een stroomverbruik van 240 W en een maximale kerntemperatuur van 76 °C, die aanzienlijk lager zijn dan de waarden van 349 W en 87 °C van de Core i9-14900K. Zelfs de Core i7-14700K laat hogere cijfers zien met 313 W opgenomen vermogen en een kerntemperatuur van 92 °C.
Gemiddeld houdt de Core Ultra 9 285K een pakketvermogen van 167 W en een kerntemperatuur van 63 °C aan, die beide lager zijn dan de respectievelijke waarden van 195 W en 76 °C van de Core i7-14700K.
Systeemprestaties: In dezelfde competitie als Core i9-14900K en AMD Zen 5
De algehele systeemprestaties van de Core Ultra 9 285K zijn vergelijkbaar met die van de Core i9-14900K en de Ryzen 9 9950X en verschillen niet veel van wat we zien bij de Ryzen 9 7950X, Core i9-13900Ken de Ryzen 9 9900X.
Individuele benchmarks laten echter iets betere resultaten zien met de Core i9-14900K in 3DMark Time Spy CPU, 3DMark 11 Performance Physics en CrossMark. PCMark 10 geeft de Core Ultra 9 285K een kleine voorsprong op de Core i9-14900K, maar komt grotendeels overeen met de AMD Zen 5.
AMD CPU's hebben een bijzonder voordeel in AIDA64 CPU-tests, behalve CPU PhotoWorxx, waar de Core Ultra 9 285K een merkbare voorsprong heeft.
Desondanks ondervinden gewone productiviteitstaken geen haperingen bij dagelijks gebruik.
3DMark 11: 1280x720 Performance Physics
3DMark: 1920x1080 Fire Strike Physics | 2560x1440 Time Spy CPU
CrossMark: Overall | Responsiveness | Creativity | Productivity
PCMark 10: Score | Essentials | Productivity | Digital Content Creation
AIDA64: FP32 Ray-Trace | FPU Julia | CPU SHA3 | CPU Queen | FPU SinJulia | FPU Mandel | CPU AES | CPU ZLib | FP64 Ray-Trace | CPU PhotoWorxx
| System Performance Rating | |
| AMD Ryzen 9 9950X | |
| Intel Core i9-14900K | |
| Intel Core Ultra 9 285K | |
| AMD Ryzen 9 7950X | |
| AMD Ryzen 9 9900X | |
| Intel Core i9-13900K | |
| AMD Ryzen 9 7950X3D -2! | |
| Intel Core i7-14700K | |
| AMD Ryzen 9 7900X | |
| AMD Ryzen 7 9700X | |
| Intel Core i5-14600K | |
| AMD Ryzen 7 7800X3D | |
| Intel Core i5-13600K | |
| AMD Ryzen 5 9600X | |
| Intel Core Ultra 5 245K | |
| Intel Core i9-12900K -4! | |
| Intel Core i5-12600K -4! | |
| PCMark 10 / Digital Content Creation | |
| Intel Core Ultra 9 285K | |
| AMD Ryzen 9 9950X | |
| AMD Ryzen 9 9900X | |
| AMD Ryzen 7 9700X | |
| Intel Core i9-14900K | |
| Intel Core Ultra 5 245K | |
| AMD Ryzen 5 9600X | |
| Intel Core i7-14700K | |
| AMD Ryzen 9 7900X | |
| AMD Ryzen 9 7950X | |
| Intel Core i9-13900K | |
| Intel Core i5-14600K | |
| AMD Ryzen 7 7800X3D | |
| Intel Core i5-13600K | |
| Intel Core i9-12900K | |
| Intel Core i5-12600K | |
3DMark 11: 1280x720 Performance Physics
3DMark: 1920x1080 Fire Strike Physics | 2560x1440 Time Spy CPU
CrossMark: Overall | Responsiveness | Creativity | Productivity
PCMark 10: Score | Essentials | Productivity | Digital Content Creation
AIDA64: FP32 Ray-Trace | FPU Julia | CPU SHA3 | CPU Queen | FPU SinJulia | FPU Mandel | CPU AES | CPU ZLib | FP64 Ray-Trace | CPU PhotoWorxx
| PCMark 10 Score | 10514 punten | |
Help | ||
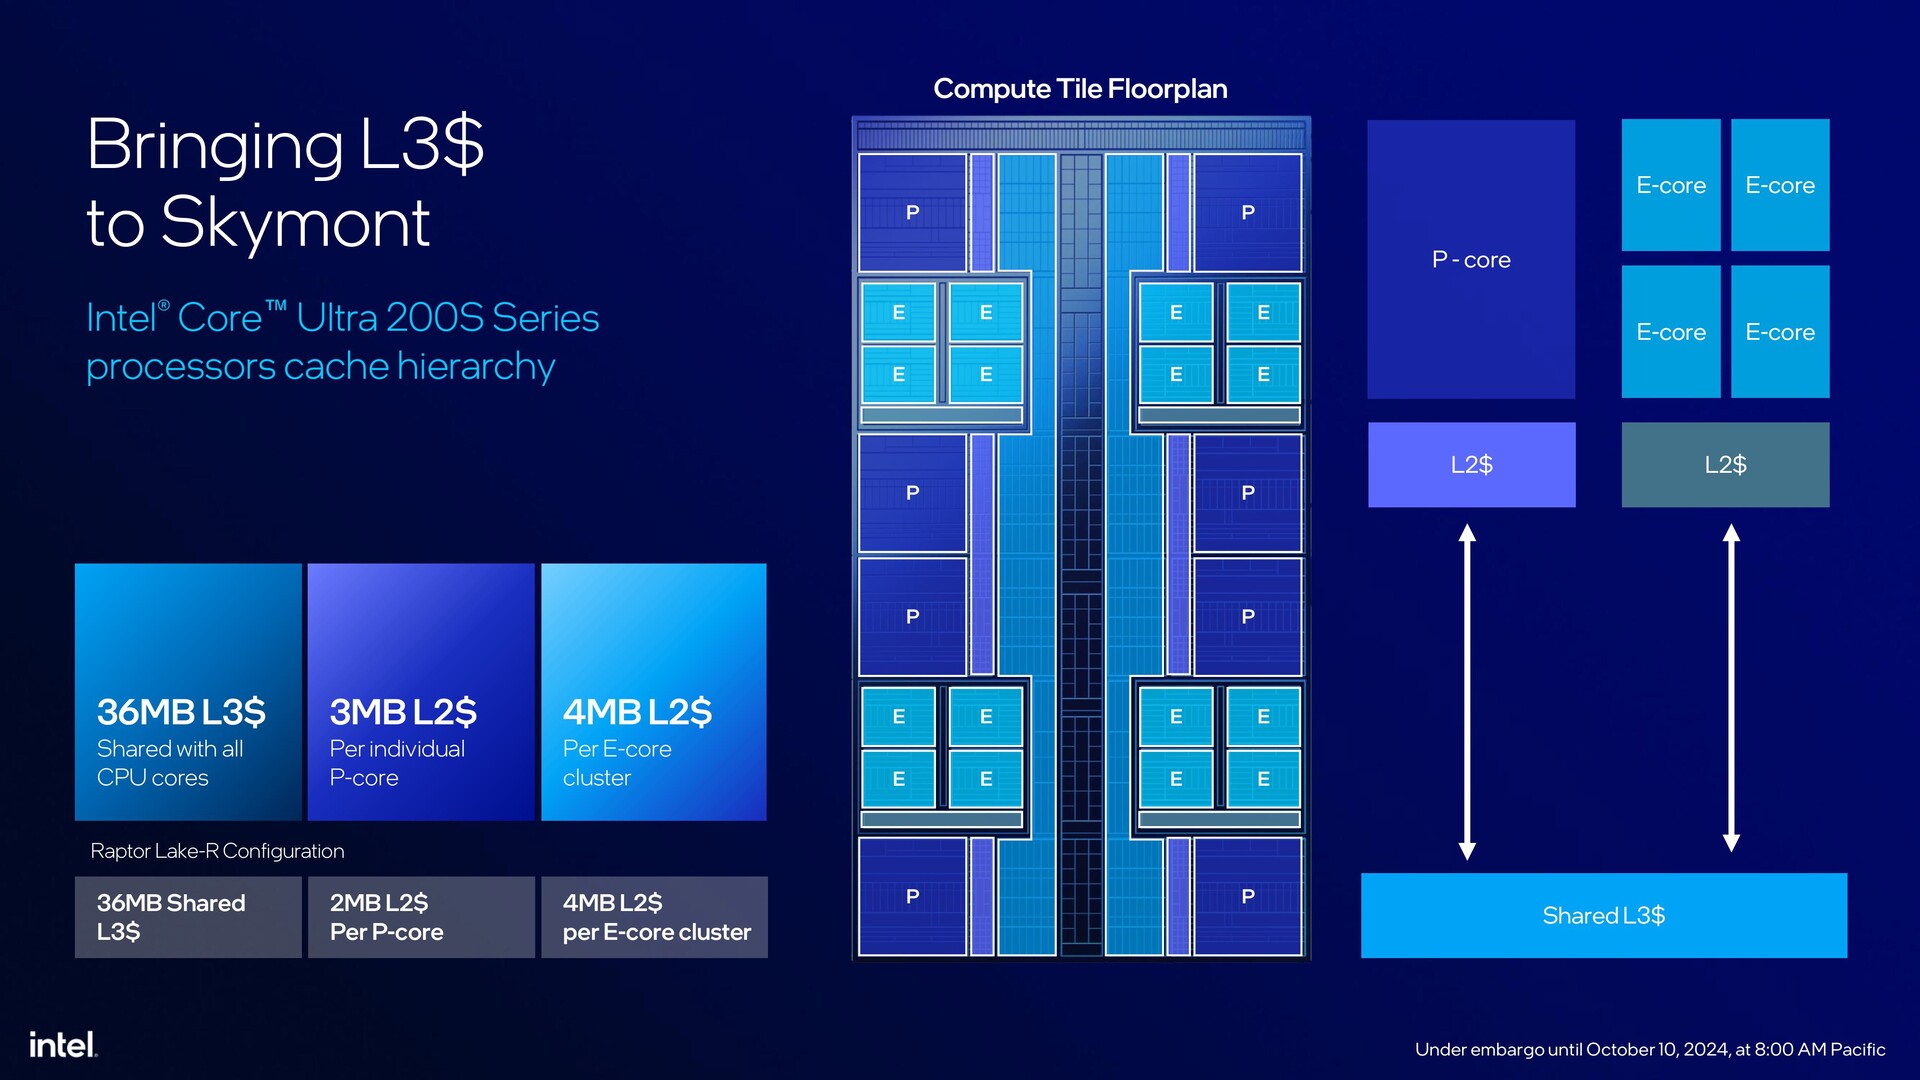
Intel heeft gekozen voor een radicaal nieuw Compute tile-ontwerp met Arrow Lake-S. De P-core en E-cores bevinden zich niet langer in hun eigen aaneengesloten blokken met hun eigen caches. In plaats daarvan worden E-cores in clusters van vier verdeeld tussen de P-cores op de hoeken van de tegel.
Alle cores delen nu een gemeenschappelijke L3-cache die door het midden van de tegel loopt en een gemeenschappelijke ringbus. Dit ontwerp zou theoretisch moeten helpen om gegevens sneller tussen de cores te verplaatsen en ook om te voorkomen dat warmte zich concentreert rond één of een groep cores.
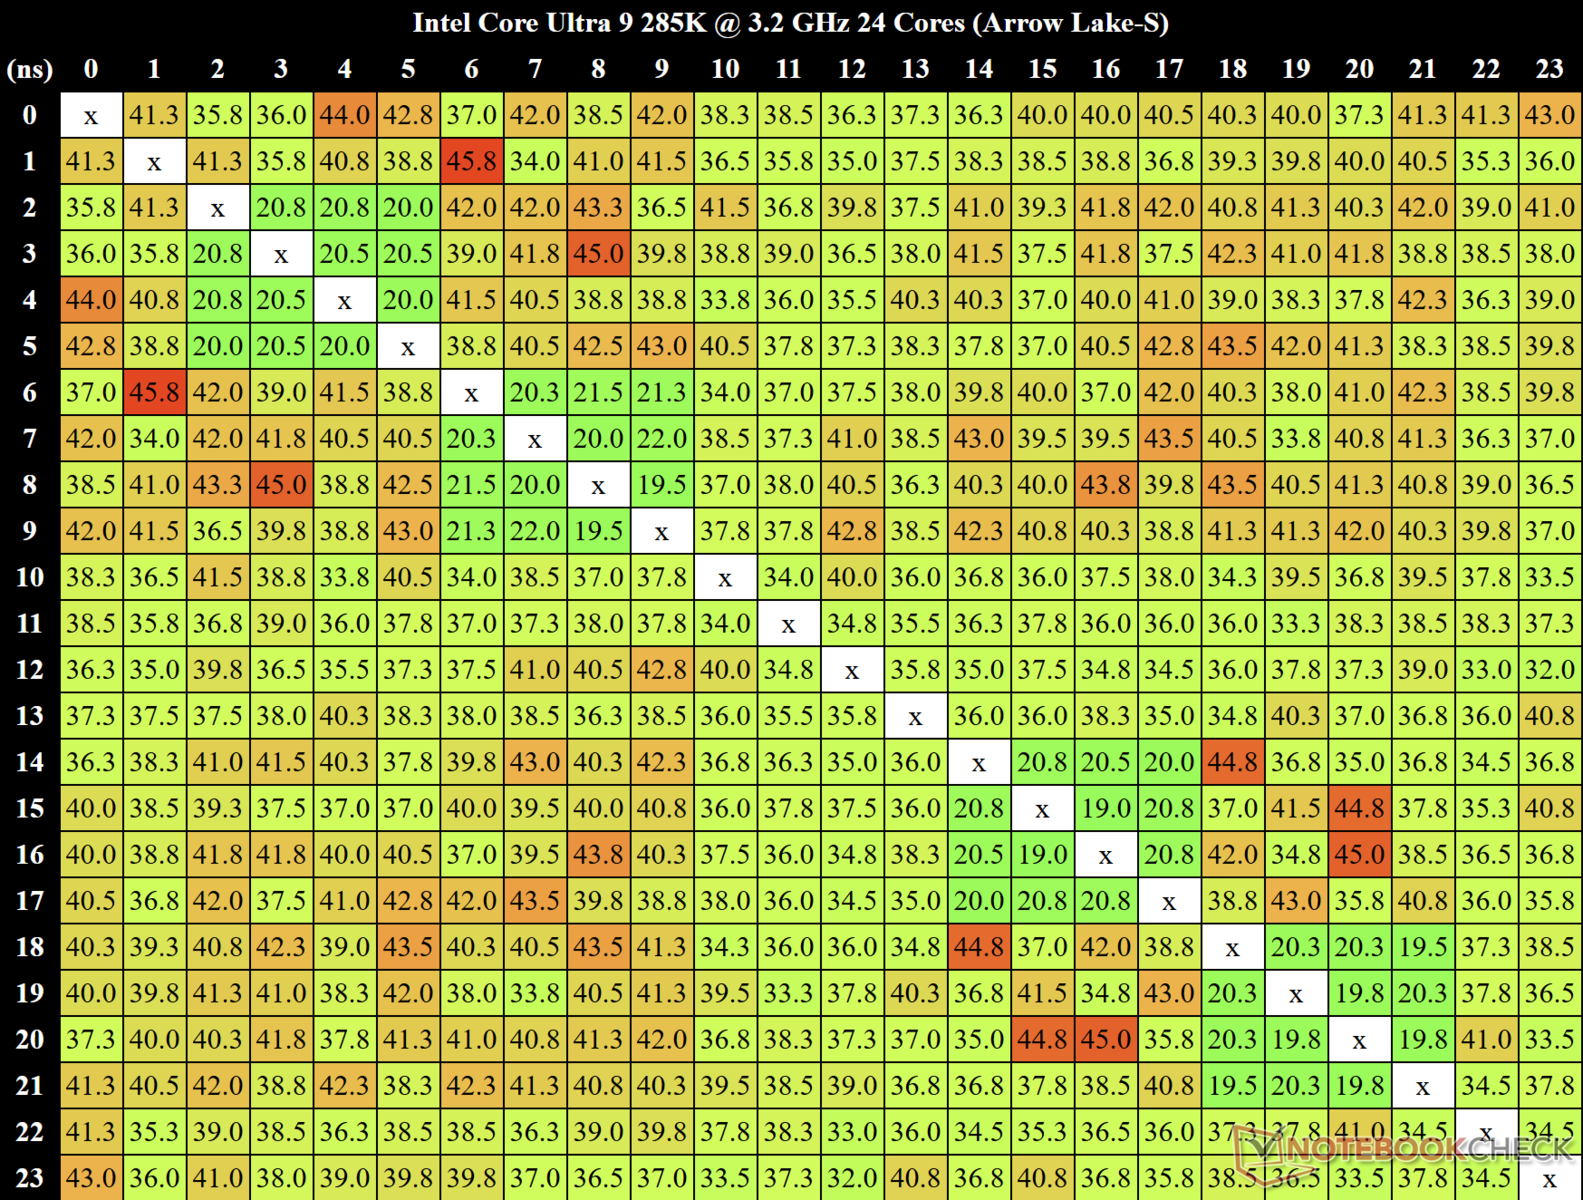
We gebruikten MicrobenchX om de inter-core latentie te berekenen. Core-to-core latenties lopen op tot 45,8 ns tussen Core 2 en Core 7, wat duidt op een mogelijk lange latentie terwijl gegevens van de E-core naar de E-core gaan.
De vier E-core clusters lijken echter een minimale latentie van 19 ns tot 21,3 ns te vertonen voor gegevensoverdracht binnen die clusters.
We hebben een algemene mediaan core-to-core latentie van 38,25 ns gemeten.
| AIDA64 Memory Performance Rating - Percent | |
| Intel Core i9-12900K -1! | |
| Intel Core i9-14900K | |
| Intel Core i7-14700K | |
| Intel Core i5-12600K -1! | |
| Intel Core i5-14600K | |
| Intel Core Ultra 9 285K | |
| AMD Ryzen 9 7950X3D | |
| AMD Ryzen 9 7950X | |
| AMD Ryzen 9 9950X | |
| Intel Core i9-13900K | |
| AMD Ryzen 9 9900X | |
| AMD Ryzen 9 7900X | |
| AMD Ryzen 7 7800X3D | |
| Intel Core i5-13600K | |
| AMD Ryzen 7 9700X | |
| AMD Ryzen 5 9600X | |
| Intel Core Ultra 5 245K | |
* ... kleiner is beter
3D en gamingprestaties: Arrow Lake-S stelt enorm teleur
Men zou verwachten dat de voordelen van het ontbreken van hyperthreading, Intel APO en verhoogde IPC, vooral op de Skymont-kernen, zich zouden vertalen in goede gaming-winst. Wees bereid om teleurgesteld te worden.
Terwijl de Core Ultra 9 285K prijzenswaardige CPU-prestaties liet zien met relatief minder stroomvereisten, draaien de rollen om als het aankomt op 3D- en gamingtaken.
De Core Ultra 9 285K in combinatie met de Nvidia GeForce RTX 4090 GPU slaagt erin om 13% voorsprong te behalen op de Ryzen 9 9900X in 3DMark 11 Performance GPU en 6% winst op de Ryzen 9 9950X in 3DMark Time Spy Graphics.
Het systeem verliest echter aanzienlijk van andere Raptor Lake-S Refresh en Zen 5 aanbiedingen in 3DMark Fire Strike Graphics, waardoor het over het algemeen in het nadeel is.
| 3DMark Performance Rating - Percent | |
| Intel Core i5-14600K | |
| AMD Ryzen 7 7800X3D | |
| AMD Ryzen 5 9600X | |
| Intel Core Ultra 5 245K | |
| AMD Ryzen 7 9700X | |
| AMD Ryzen 9 7950X3D | |
| Intel Core i9-14900K | |
| Intel Core i7-14700K | |
| AMD Ryzen 9 9950X | |
| AMD Ryzen 9 9900X | |
| Intel Core Ultra 9 285K | |
| 3DMark 11 - 1280x720 Performance GPU | |
| AMD Ryzen 7 7800X3D | |
| Intel Core i5-14600K | |
| AMD Ryzen 9 7950X3D | |
| Intel Core i9-14900K | |
| Intel Core Ultra 5 245K | |
| AMD Ryzen 5 9600X | |
| Intel Core i7-14700K | |
| AMD Ryzen 9 9950X | |
| AMD Ryzen 7 9700X | |
| Intel Core Ultra 9 285K | |
| AMD Ryzen 9 9900X | |
| 3DMark | |
| 2560x1440 Time Spy Graphics | |
| Intel Core i5-14600K | |
| Intel Core i9-14900K | |
| AMD Ryzen 7 7800X3D | |
| Intel Core i7-14700K | |
| AMD Ryzen 5 9600X | |
| Intel Core Ultra 5 245K | |
| AMD Ryzen 9 7950X3D | |
| AMD Ryzen 7 9700X | |
| AMD Ryzen 9 9900X | |
| Intel Core Ultra 9 285K | |
| AMD Ryzen 9 9950X | |
| 1920x1080 Fire Strike Graphics | |
| Intel Core i5-14600K | |
| AMD Ryzen 7 9700X | |
| AMD Ryzen 5 9600X | |
| Intel Core Ultra 5 245K | |
| AMD Ryzen 9 9950X | |
| AMD Ryzen 9 9900X | |
| AMD Ryzen 7 7800X3D | |
| AMD Ryzen 9 7950X3D | |
| Intel Core i9-14900K | |
| Intel Core i7-14700K | |
| Intel Core Ultra 9 285K | |
| 3DMark 11 Performance | 62846 punten | |
| 3DMark Fire Strike Score | 44363 punten | |
| 3DMark Time Spy Score | 30904 punten | |
Help | ||
Soortgelijke trends zien we ook bij gaming. In tegenstelling tot wat Intel bij de lancering beweerde, staat de Core Ultra 9 285K in combinatie met de RTX 4090 onderaan in onze vergelijkingsgrafiek voor gaming. Hij doet niet onder voor de Core i7-14700K en loopt aanzienlijk achter op de Zen 5-producten (tot 12%) in cumulatieve gametests op 720p Low en 1080p Ultra.
De Core Ultra 9 285K lijkt kleine verbeteringen te laten zien ten opzichte van de Core i7-14700K in Far Cry 5, Dota 2 Reborn, en Metro Exodus (niet Enhanced Edition), maar de verschillen zijn minuscuul en de algehele prestaties liggen nog steeds behoorlijk achter op die van de Core i9-14700K en Core i9-14900K.
Zelfs de Core i5-14600K lijkt een betere CPU voor gaming te zijn, met een behoorlijke algemene winst van 7% in vergelijking met de Core Ultra 9 285K
| Gaming Performance Rating - Percent | |
| AMD Ryzen 7 7800X3D | |
| AMD Ryzen 9 7950X3D | |
| Intel Core i9-14900K | |
| AMD Ryzen 7 9700X | |
| AMD Ryzen 9 9900X | |
| AMD Ryzen 5 9600X | |
| AMD Ryzen 9 9950X | |
| Intel Core i5-14600K | |
| Intel Core i7-14700K | |
| Intel Core Ultra 9 285K | |
| Intel Core Ultra 5 245K | |
| F1 22 | |
| 1280x720 Ultra Low Preset AA:T AF:16x | |
| AMD Ryzen 7 7800X3D | |
| Intel Core i9-14900K | |
| AMD Ryzen 9 7950X3D | |
| AMD Ryzen 9 9950X | |
| AMD Ryzen 5 9600X | |
| AMD Ryzen 7 9700X | |
| AMD Ryzen 9 9900X | |
| Intel Core i5-14600K | |
| Intel Core i7-14700K | |
| Intel Core Ultra 9 285K | |
| Intel Core Ultra 5 245K | |
| 1920x1080 Low Preset AA:T AF:16x | |
| AMD Ryzen 7 7800X3D | |
| AMD Ryzen 9 7950X3D | |
| Intel Core i9-14900K | |
| AMD Ryzen 5 9600X | |
| AMD Ryzen 9 9950X | |
| AMD Ryzen 7 9700X | |
| AMD Ryzen 9 9900X | |
| Intel Core i5-14600K | |
| Intel Core i7-14700K | |
| Intel Core Ultra 9 285K | |
| Intel Core Ultra 5 245K | |
| 1920x1080 Ultra High Preset AA:T AF:16x | |
| AMD Ryzen 7 7800X3D | |
| Intel Core i9-14900K | |
| AMD Ryzen 7 9700X | |
| Intel Core i5-14600K | |
| AMD Ryzen 9 7950X3D | |
| AMD Ryzen 5 9600X | |
| AMD Ryzen 9 9900X | |
| AMD Ryzen 9 9950X | |
| Intel Core i7-14700K | |
| Intel Core Ultra 9 285K | |
| Intel Core Ultra 5 245K | |
| X-Plane 11.11 | |
| 1280x720 low (fps_test=1) | |
| AMD Ryzen 7 9700X | |
| AMD Ryzen 9 9900X | |
| AMD Ryzen 5 9600X | |
| Intel Core i9-14900K | |
| Intel Core i5-14600K | |
| Intel Core i7-14700K | |
| AMD Ryzen 9 7950X3D | |
| AMD Ryzen 7 7800X3D | |
| AMD Ryzen 9 9950X | |
| Intel Core Ultra 9 285K | |
| Intel Core Ultra 5 245K | |
| 1920x1080 high (fps_test=3) | |
| AMD Ryzen 7 7800X3D | |
| AMD Ryzen 9 7950X3D | |
| AMD Ryzen 7 9700X | |
| AMD Ryzen 9 9900X | |
| AMD Ryzen 5 9600X | |
| Intel Core i9-14900K | |
| AMD Ryzen 9 9950X | |
| Intel Core i7-14700K | |
| Intel Core i5-14600K | |
| Intel Core Ultra 9 285K | |
| Intel Core Ultra 5 245K | |
| Final Fantasy XV Benchmark | |
| 1280x720 Lite Quality | |
| AMD Ryzen 5 9600X | |
| AMD Ryzen 7 7800X3D | |
| Intel Core i5-14600K | |
| AMD Ryzen 9 9950X | |
| Intel Core i9-14900K | |
| Intel Core i7-14700K | |
| AMD Ryzen 7 9700X | |
| Intel Core Ultra 5 245K | |
| AMD Ryzen 9 9900X | |
| AMD Ryzen 9 7950X3D | |
| Intel Core Ultra 9 285K | |
| 1920x1080 High Quality | |
| Intel Core i9-14900K | |
| AMD Ryzen 7 7800X3D | |
| Intel Core i5-14600K | |
| AMD Ryzen 9 7950X3D | |
| AMD Ryzen 9 9900X | |
| AMD Ryzen 5 9600X | |
| Intel Core i7-14700K | |
| Intel Core Ultra 9 285K | |
| AMD Ryzen 7 9700X | |
| AMD Ryzen 9 9950X | |
| Intel Core Ultra 5 245K | |
| Dota 2 Reborn | |
| 1280x720 min (0/3) fastest | |
| AMD Ryzen 7 7800X3D | |
| AMD Ryzen 7 9700X | |
| AMD Ryzen 9 7950X3D | |
| AMD Ryzen 9 9900X | |
| AMD Ryzen 9 9950X | |
| Intel Core i9-14900K | |
| AMD Ryzen 5 9600X | |
| Intel Core i5-14600K | |
| Intel Core Ultra 9 285K | |
| Intel Core i7-14700K | |
| Intel Core Ultra 5 245K | |
| 1920x1080 ultra (3/3) best looking | |
| AMD Ryzen 7 7800X3D | |
| AMD Ryzen 9 7950X3D | |
| AMD Ryzen 9 9900X | |
| AMD Ryzen 9 9950X | |
| AMD Ryzen 7 9700X | |
| AMD Ryzen 5 9600X | |
| Intel Core i9-14900K | |
| Intel Core i5-14600K | |
| Intel Core Ultra 9 285K | |
| Intel Core i7-14700K | |
| Intel Core Ultra 5 245K | |
| The Witcher 3 | |
| 1024x768 Low Graphics & Postprocessing | |
| AMD Ryzen 9 7950X3D | |
| AMD Ryzen 7 7800X3D | |
| Intel Core i9-14900K | |
| AMD Ryzen 9 9950X | |
| AMD Ryzen 5 9600X | |
| AMD Ryzen 7 9700X | |
| AMD Ryzen 9 9900X | |
| Intel Core i7-14700K | |
| Intel Core i5-14600K | |
| Intel Core Ultra 9 285K | |
| Intel Core Ultra 5 245K | |
| 1920x1080 Ultra Graphics & Postprocessing (HBAO+) | |
| Intel Core i5-14600K | |
| AMD Ryzen 7 7800X3D | |
| Intel Core i9-14900K | |
| Intel Core Ultra 5 245K | |
| AMD Ryzen 9 7950X3D | |
| Intel Core Ultra 9 285K | |
| Intel Core i7-14700K | |
| AMD Ryzen 5 9600X | |
| AMD Ryzen 9 9950X | |
| AMD Ryzen 7 9700X | |
| AMD Ryzen 9 9900X | |
| GTA V | |
| 1024x768 Lowest Settings possible | |
| AMD Ryzen 7 7800X3D | |
| AMD Ryzen 5 9600X | |
| AMD Ryzen 9 7950X3D | |
| Intel Core i9-14900K | |
| AMD Ryzen 7 9700X | |
| AMD Ryzen 9 9900X | |
| Intel Core i5-14600K | |
| Intel Core Ultra 5 245K | |
| Intel Core i7-14700K | |
| AMD Ryzen 9 9950X | |
| Intel Core Ultra 9 285K | |
| 1920x1080 Highest Settings possible AA:4xMSAA + FX AF:16x | |
| AMD Ryzen 7 7800X3D | |
| Intel Core i9-14900K | |
| AMD Ryzen 9 9900X | |
| AMD Ryzen 7 9700X | |
| AMD Ryzen 5 9600X | |
| AMD Ryzen 9 9950X | |
| Intel Core i5-14600K | |
| Intel Core Ultra 9 285K | |
| AMD Ryzen 9 7950X3D | |
| Intel Core i7-14700K | |
| Intel Core Ultra 5 245K | |
| Borderlands 3 | |
| 1280x720 Very Low Overall Quality (DX11) | |
| AMD Ryzen 7 7800X3D | |
| AMD Ryzen 9 7950X3D | |
| Intel Core i9-14900K | |
| AMD Ryzen 7 9700X | |
| AMD Ryzen 9 9900X | |
| AMD Ryzen 9 9950X | |
| Intel Core i5-14600K | |
| AMD Ryzen 5 9600X | |
| Intel Core i7-14700K | |
| Intel Core Ultra 9 285K | |
| Intel Core Ultra 5 245K | |
| 1920x1080 Very Low Overall Quality (DX11) | |
| AMD Ryzen 9 7950X3D | |
| AMD Ryzen 7 7800X3D | |
| Intel Core i9-14900K | |
| AMD Ryzen 9 9900X | |
| AMD Ryzen 7 9700X | |
| AMD Ryzen 9 9950X | |
| Intel Core i5-14600K | |
| AMD Ryzen 5 9600X | |
| Intel Core i7-14700K | |
| Intel Core Ultra 9 285K | |
| Intel Core Ultra 5 245K | |
| 1920x1080 Badass Overall Quality (DX11) | |
| AMD Ryzen 9 7950X3D | |
| AMD Ryzen 7 7800X3D | |
| Intel Core i9-14900K | |
| AMD Ryzen 7 9700X | |
| AMD Ryzen 9 9900X | |
| Intel Core i5-14600K | |
| AMD Ryzen 9 9950X | |
| AMD Ryzen 5 9600X | |
| Intel Core i7-14700K | |
| Intel Core Ultra 9 285K | |
| Intel Core Ultra 5 245K | |
| Shadow of the Tomb Raider | |
| 1280x720 Lowest Preset | |
| AMD Ryzen 7 7800X3D | |
| AMD Ryzen 9 7950X3D | |
| AMD Ryzen 7 9700X | |
| AMD Ryzen 9 9950X | |
| Intel Core i9-14900K | |
| AMD Ryzen 9 9900X | |
| AMD Ryzen 5 9600X | |
| Intel Core Ultra 9 285K | |
| Intel Core i5-14600K | |
| Intel Core i7-14700K | |
| Intel Core Ultra 5 245K | |
| 1920x1080 Highest Preset AA:T | |
| AMD Ryzen 7 7800X3D | |
| AMD Ryzen 9 7950X3D | |
| Intel Core i9-14900K | |
| AMD Ryzen 9 9900X | |
| AMD Ryzen 7 9700X | |
| AMD Ryzen 9 9950X | |
| AMD Ryzen 5 9600X | |
| Intel Core i5-14600K | |
| Intel Core Ultra 9 285K | |
| Intel Core i7-14700K | |
| Intel Core Ultra 5 245K | |
| Metro Exodus | |
| 1280x720 Low Quality AF:4x | |
| AMD Ryzen 7 7800X3D | |
| AMD Ryzen 7 9700X | |
| AMD Ryzen 5 9600X | |
| AMD Ryzen 9 9950X | |
| AMD Ryzen 9 9900X | |
| Intel Core i9-14900K | |
| Intel Core Ultra 9 285K | |
| Intel Core i5-14600K | |
| AMD Ryzen 9 7950X3D | |
| Intel Core i7-14700K | |
| Intel Core Ultra 5 245K | |
| 1920x1080 Ultra Quality AF:16x | |
| AMD Ryzen 7 7800X3D | |
| AMD Ryzen 5 9600X | |
| Intel Core i9-14900K | |
| AMD Ryzen 7 9700X | |
| AMD Ryzen 9 9900X | |
| AMD Ryzen 9 9950X | |
| Intel Core i5-14600K | |
| Intel Core i7-14700K | |
| Intel Core Ultra 9 285K | |
| AMD Ryzen 9 7950X3D | |
| Intel Core Ultra 5 245K | |
| F1 2021 | |
| 1280x720 Ultra Low Preset | |
| AMD Ryzen 7 7800X3D | |
| Intel Core i9-14900K | |
| AMD Ryzen 9 7950X3D | |
| AMD Ryzen 5 9600X | |
| AMD Ryzen 9 9950X | |
| AMD Ryzen 7 9700X | |
| AMD Ryzen 9 9900X | |
| Intel Core i5-14600K | |
| Intel Core i7-14700K | |
| Intel Core Ultra 9 285K | |
| Intel Core Ultra 5 245K | |
| 1920x1080 Ultra High Preset + Raytracing AA:T AF:16x | |
| AMD Ryzen 7 7800X3D | |
| Intel Core i9-14900K | |
| AMD Ryzen 7 9700X | |
| AMD Ryzen 5 9600X | |
| Intel Core i5-14600K | |
| AMD Ryzen 9 7950X3D | |
| AMD Ryzen 9 9900X | |
| AMD Ryzen 9 9950X | |
| Intel Core i7-14700K | |
| Intel Core Ultra 9 285K | |
| Intel Core Ultra 5 245K | |
Zelfs GPU-gebonden instellingen zoals QHD Ultra en UHD Ultra lijken de liefde voor de Core Ultra 9 285K te hebben verloren. De cumulatieve prestatiedelta ten opzichte van de Core i9-14900K is nu echter 10% bij deze instellingen, vergeleken met 15% bij meer CPU-gebonden resoluties.
Hoewel het een beetje vergezocht zou zijn om te zeggen dat de Core Ultra 9 285K de RTX 4090 bottleneckt, hebt u betere (en goedkopere) opties als gaming uw primaire gebruiksdoel is.
| Gaming Performance Rating - Percent | |
| AMD Ryzen 7 7800X3D | |
| AMD Ryzen 9 7950X3D | |
| Intel Core i9-14900K | |
| AMD Ryzen 7 9700X | |
| AMD Ryzen 9 9900X | |
| Intel Core i5-14600K | |
| AMD Ryzen 5 9600X | |
| AMD Ryzen 9 9950X | |
| Intel Core i7-14700K | |
| Intel Core Ultra 9 285K | |
| Intel Core Ultra 5 245K | |
| F1 22 | |
| 2560x1440 Ultra High Preset AA:T AF:16x | |
| AMD Ryzen 7 7800X3D | |
| AMD Ryzen 5 9600X | |
| Intel Core i9-14900K | |
| AMD Ryzen 9 9900X | |
| Intel Core i5-14600K | |
| AMD Ryzen 7 9700X | |
| AMD Ryzen 9 7950X3D | |
| AMD Ryzen 9 9950X | |
| Intel Core Ultra 5 245K | |
| Intel Core i7-14700K | |
| Intel Core Ultra 9 285K | |
| 3840x2160 Ultra High Preset AA:T AF:16x | |
| AMD Ryzen 9 9900X | |
| Intel Core Ultra 5 245K | |
| AMD Ryzen 5 9600X | |
| AMD Ryzen 7 9700X | |
| AMD Ryzen 7 7800X3D | |
| AMD Ryzen 9 9950X | |
| Intel Core i5-14600K | |
| Intel Core i9-14900K | |
| Intel Core Ultra 9 285K | |
| AMD Ryzen 9 7950X3D | |
| Intel Core i7-14700K | |
| Far Cry 5 | |
| 2560x1440 Ultra Preset AA:T | |
| AMD Ryzen 7 7800X3D | |
| AMD Ryzen 9 7950X3D | |
| AMD Ryzen 9 9900X | |
| Intel Core i9-14900K | |
| AMD Ryzen 5 9600X | |
| AMD Ryzen 7 9700X | |
| Intel Core i5-14600K | |
| AMD Ryzen 9 9950X | |
| Intel Core Ultra 9 285K | |
| Intel Core i7-14700K | |
| Intel Core Ultra 5 245K | |
| 3840x2160 Ultra Preset AA:T | |
| AMD Ryzen 7 7800X3D | |
| Intel Core i9-14900K | |
| AMD Ryzen 9 7950X3D | |
| Intel Core i5-14600K | |
| AMD Ryzen 5 9600X | |
| AMD Ryzen 9 9900X | |
| AMD Ryzen 9 9950X | |
| AMD Ryzen 7 9700X | |
| Intel Core Ultra 9 285K | |
| Intel Core Ultra 5 245K | |
| Intel Core i7-14700K | |
| X-Plane 11.11 - 3840x2160 high (fps_test=3) | |
| AMD Ryzen 7 7800X3D | |
| AMD Ryzen 9 7950X3D | |
| AMD Ryzen 7 9700X | |
| AMD Ryzen 5 9600X | |
| Intel Core i9-14900K | |
| AMD Ryzen 9 9900X | |
| Intel Core i7-14700K | |
| Intel Core i5-14600K | |
| AMD Ryzen 9 9950X | |
| Intel Core Ultra 9 285K | |
| Intel Core Ultra 5 245K | |
| Final Fantasy XV Benchmark | |
| 2560x1440 High Quality | |
| AMD Ryzen 7 7800X3D | |
| Intel Core i9-14900K | |
| Intel Core i5-14600K | |
| AMD Ryzen 9 7950X3D | |
| AMD Ryzen 9 9950X | |
| Intel Core Ultra 9 285K | |
| Intel Core i7-14700K | |
| AMD Ryzen 5 9600X | |
| Intel Core Ultra 5 245K | |
| AMD Ryzen 7 9700X | |
| AMD Ryzen 9 9900X | |
| 3840x2160 High Quality | |
| Intel Core Ultra 5 245K | |
| Intel Core i9-14900K | |
| Intel Core i5-14600K | |
| Intel Core i7-14700K | |
| AMD Ryzen 7 7800X3D | |
| AMD Ryzen 9 7950X3D | |
| Intel Core Ultra 9 285K | |
| AMD Ryzen 9 9950X | |
| AMD Ryzen 9 9900X | |
| AMD Ryzen 5 9600X | |
| AMD Ryzen 7 9700X | |
| Dota 2 Reborn - 3840x2160 ultra (3/3) best looking | |
| AMD Ryzen 7 7800X3D | |
| AMD Ryzen 9 7950X3D | |
| AMD Ryzen 9 9950X | |
| AMD Ryzen 7 9700X | |
| AMD Ryzen 9 9900X | |
| Intel Core i9-14900K | |
| AMD Ryzen 5 9600X | |
| Intel Core i5-14600K | |
| Intel Core i7-14700K | |
| Intel Core Ultra 9 285K | |
| Intel Core Ultra 5 245K | |
| The Witcher 3 - 3840x2160 Ultra Graphics & Postprocessing (HBAO+) | |
| Intel Core i9-14900K | |
| Intel Core Ultra 5 245K | |
| AMD Ryzen 7 7800X3D | |
| Intel Core i5-14600K | |
| AMD Ryzen 9 7950X3D | |
| AMD Ryzen 5 9600X | |
| Intel Core i7-14700K | |
| Intel Core Ultra 9 285K | |
| AMD Ryzen 7 9700X | |
| AMD Ryzen 9 9900X | |
| AMD Ryzen 9 9950X | |
| GTA V | |
| 2560x1440 Highest Settings possible AA:4xMSAA + FX AF:16x | |
| AMD Ryzen 7 7800X3D | |
| Intel Core i9-14900K | |
| AMD Ryzen 9 9900X | |
| AMD Ryzen 7 9700X | |
| AMD Ryzen 5 9600X | |
| AMD Ryzen 9 9950X | |
| Intel Core i5-14600K | |
| AMD Ryzen 9 7950X3D | |
| Intel Core Ultra 9 285K | |
| Intel Core Ultra 5 245K | |
| Intel Core i7-14700K | |
| 3840x2160 Highest Settings possible AA:4xMSAA + FX AF:16x | |
| AMD Ryzen 7 7800X3D | |
| Intel Core i9-14900K | |
| Intel Core i5-14600K | |
| AMD Ryzen 9 9900X | |
| AMD Ryzen 5 9600X | |
| AMD Ryzen 7 9700X | |
| AMD Ryzen 9 7950X3D | |
| Intel Core Ultra 9 285K | |
| Intel Core Ultra 5 245K | |
| Intel Core i7-14700K | |
| AMD Ryzen 9 9950X | |
| Borderlands 3 | |
| 2560x1440 Badass Overall Quality (DX11) | |
| AMD Ryzen 7 7800X3D | |
| AMD Ryzen 9 7950X3D | |
| Intel Core i9-14900K | |
| AMD Ryzen 7 9700X | |
| AMD Ryzen 9 9900X | |
| Intel Core i5-14600K | |
| AMD Ryzen 9 9950X | |
| Intel Core i7-14700K | |
| AMD Ryzen 5 9600X | |
| Intel Core Ultra 9 285K | |
| Intel Core Ultra 5 245K | |
| 3840x2160 Badass Overall Quality (DX11) | |
| Intel Core i9-14900K | |
| AMD Ryzen 7 7800X3D | |
| AMD Ryzen 9 7950X3D | |
| Intel Core i5-14600K | |
| Intel Core i7-14700K | |
| AMD Ryzen 9 9900X | |
| AMD Ryzen 5 9600X | |
| AMD Ryzen 7 9700X | |
| AMD Ryzen 9 9950X | |
| Intel Core Ultra 9 285K | |
| Intel Core Ultra 5 245K | |
| Shadow of the Tomb Raider | |
| 2560x1440 Highest Preset AA:T | |
| AMD Ryzen 7 7800X3D | |
| AMD Ryzen 9 7950X3D | |
| Intel Core i9-14900K | |
| AMD Ryzen 9 9900X | |
| AMD Ryzen 9 9950X | |
| AMD Ryzen 7 9700X | |
| AMD Ryzen 5 9600X | |
| Intel Core i5-14600K | |
| Intel Core i7-14700K | |
| Intel Core Ultra 9 285K | |
| Intel Core Ultra 5 245K | |
| 3840x2160 Highest Preset AA:T | |
| Intel Core i9-14900K | |
| Intel Core i5-14600K | |
| AMD Ryzen 5 9600X | |
| AMD Ryzen 7 7800X3D | |
| AMD Ryzen 9 7950X3D | |
| Intel Core Ultra 5 245K | |
| AMD Ryzen 9 9900X | |
| AMD Ryzen 7 9700X | |
| Intel Core i7-14700K | |
| Intel Core Ultra 9 285K | |
| AMD Ryzen 9 9950X | |
| Metro Exodus | |
| 2560x1440 Ultra Quality AF:16x | |
| AMD Ryzen 7 7800X3D | |
| Intel Core i9-14900K | |
| AMD Ryzen 5 9600X | |
| AMD Ryzen 7 9700X | |
| Intel Core i5-14600K | |
| AMD Ryzen 9 9900X | |
| Intel Core i7-14700K | |
| AMD Ryzen 9 9950X | |
| AMD Ryzen 9 7950X3D | |
| Intel Core Ultra 9 285K | |
| Intel Core Ultra 5 245K | |
| 3840x2160 Ultra Quality AF:16x | |
| Intel Core i9-14900K | |
| Intel Core i5-14600K | |
| AMD Ryzen 7 7800X3D | |
| AMD Ryzen 9 7950X3D | |
| AMD Ryzen 7 9700X | |
| Intel Core i7-14700K | |
| AMD Ryzen 9 9900X | |
| AMD Ryzen 5 9600X | |
| Intel Core Ultra 5 245K | |
| Intel Core Ultra 9 285K | |
| AMD Ryzen 9 9950X | |
| F1 2021 | |
| 2560x1440 Ultra High Preset + Raytracing AA:T AF:16x | |
| AMD Ryzen 7 7800X3D | |
| AMD Ryzen 7 9700X | |
| Intel Core i9-14900K | |
| AMD Ryzen 5 9600X | |
| AMD Ryzen 9 7950X3D | |
| Intel Core i5-14600K | |
| AMD Ryzen 9 9950X | |
| Intel Core i7-14700K | |
| AMD Ryzen 9 9900X | |
| Intel Core Ultra 9 285K | |
| Intel Core Ultra 5 245K | |
| 3840x2160 Ultra High Preset + Raytracing AA:T AF:16x | |
| AMD Ryzen 7 7800X3D | |
| AMD Ryzen 9 9950X | |
| AMD Ryzen 5 9600X | |
| AMD Ryzen 9 7950X3D | |
| Intel Core i9-14900K | |
| AMD Ryzen 7 9700X | |
| AMD Ryzen 9 9900X | |
| Intel Core i5-14600K | |
| Intel Core Ultra 9 285K | |
| Intel Core Ultra 5 245K | |
| Intel Core i7-14700K | |
| lage | gem. | hoge | ultra | QHD DLSS | QHD | 4K DLSS | 4K FSR | 4K | |
|---|---|---|---|---|---|---|---|---|---|
| GTA V (2015) | 186.9 | 185.6 | 183.2 | 161.3 | 154.2 | 182.4 | |||
| The Witcher 3 (2015) | 626 | 584 | 545 | 294 | 251 | 276 | |||
| Dota 2 Reborn (2015) | 256 | 230 | 218 | 204 | 196.3 | ||||
| Final Fantasy XV Benchmark (2018) | 234 | 237 | 228 | 221 | 154.3 | ||||
| X-Plane 11.11 (2018) | 189.1 | 172.5 | 140.5 | 117.3 | |||||
| Far Cry 5 (2018) | 225 | 194 | 186 | 171 | 172 | 162 | |||
| Strange Brigade (2018) | 705 | 557 | 552 | 547 | 501 | 276 | |||
| Shadow of the Tomb Raider (2018) | 282 | 273 | 275 | 270 | 255 | 178.4 | |||
| Metro Exodus (2019) | 299 | 271 | 230 | 193.8 | 177.7 | 131.3 | |||
| Borderlands 3 (2019) | 209 | 183 | 166.8 | 159.1 | 158.2 | 127.3 | |||
| F1 2021 (2021) | 530 | 510 | 486 | 232 | 229 | 198.2 | |||
| F1 22 (2022) | 357 | 388 | 373 | 174.6 | 149.9 | 83 | |||
| F1 23 (2023) | 376 | 394 | 393 | 182.9 | 145.7 | 127 | 78.5 | ||
| Baldur's Gate 3 (2023) | 304 | 293 | 271 | 269 | 225 | 193.2 | 131.7 | ||
| Cyberpunk 2077 2.2 Phantom Liberty (2023) | 212 | 214 | 195.1 | 180.3 | 145.2 | 73.2 | |||
| Assassin's Creed Mirage (2023) | 287 | 268 | 255 | 198 | 178 | 156 | 125 | ||
| F1 24 (2024) | 373 | 394 | 365 | 184.8 | 139.9 | 121 | 137.2 | 77 | |
| Black Myth: Wukong (2024) | 214 | 162 | 128 | 81 | 89 | 65 | 68 | 42 |
Stroomverbruik: Intel krijgt energie-efficiëntie eindelijk onder de knie
Intel prijst energiezuinigheid aan als de belangrijkste USP van Arrow Lake-S, en we hebben kunnen zien dat de Core Ultra 9 285K in dit opzicht inderdaad aan de verwachtingen voldoet.
De Core Ultra 9 285K verbruikt 37% minder stroom uit het stopcontact tijdens het uitvoeren van Cinebench R23 multi-core vergeleken met de Core i9-14900K, waarbij het Cinebench R23 single-core stroomverbruik ongeveer 27% lager is.
Het stroomverbruik tijdens het uitvoeren van Prime95 in-place grote FFT's is ook 29% lager dan wat we hadden waargenomen met de Core i9-14900K, waarbij de Core Ultra 9 285K dichter in de buurt komt van de Core i5-14600K niveaus.
Deze winst is ook te zien bij het gamen, waarbij het Core Ultra 9 285K systeem 18% minder stroom verbruikt in vergelijking met de Core i9-14900K in The Witcher 3 bij 1080p Ultra en 22% minder dan de Ryzen 9 9950X in Cyberpunk 2077: Phantom Liberty bij 1080p Ultra.
Power Consumption: External monitor
: Cyberpunk 2077 ultra external monitor
| Power Consumption / Cinebench R15 Multi (external Monitor) | |
| Intel Core i9-14900K, NVIDIA GeForce RTX 4090 | |
| Intel Core i9-13900K, NVIDIA GeForce RTX 3090 | |
| Intel Core i7-14700K, NVIDIA GeForce RTX 4090 | |
| Intel Core Ultra 9 285K, NVIDIA GeForce RTX 4090 (Idle: 76.2 W) | |
| Intel Core i5-14600K, NVIDIA GeForce RTX 4090 | |
| Intel Core i9-12900K, NVIDIA Titan RTX (Idle: 70.5 W) | |
| AMD Ryzen 9 7950X, NVIDIA GeForce RTX 3090 | |
| AMD Ryzen 9 7900X, NVIDIA GeForce RTX 3090 | |
| AMD Ryzen 9 9950X, NVIDIA GeForce RTX 4090 (Idle: 100 W) | |
| Intel Core i5-13600K, NVIDIA GeForce RTX 3090 | |
| AMD Ryzen 9 9900X, NVIDIA GeForce RTX 4090 (Idle: 85.1 W) | |
| AMD Ryzen 9 7950X3D, NVIDIA GeForce RTX 4090 | |
| Intel Core Ultra 5 245K, NVIDIA GeForce RTX 4090 | |
| AMD Ryzen 5 9600X, NVIDIA GeForce RTX 4090 | |
| AMD Ryzen 7 7800X3D, NVIDIA GeForce RTX 4090 | |
| Intel Core i5-12600K, NVIDIA Titan RTX (Idle: 70.45 W) | |
| AMD Ryzen 7 9700X, NVIDIA GeForce RTX 4090 (Idle: 83 W) | |
| Power Consumption / Cinebench R23 Single (external Monitor) | |
| AMD Ryzen 7 7800X3D, NVIDIA GeForce RTX 4090 | |
| Intel Core i7-14700K, NVIDIA GeForce RTX 4090 | |
| Intel Core i9-14900K, NVIDIA GeForce RTX 4090 | |
| Intel Core i5-14600K, NVIDIA GeForce RTX 4090 | |
| AMD Ryzen 5 9600X, NVIDIA GeForce RTX 4090 | |
| AMD Ryzen 9 9950X, NVIDIA GeForce RTX 4090 (100) | |
| AMD Ryzen 9 9900X, NVIDIA GeForce RTX 4090 (85.1) | |
| Intel Core Ultra 5 245K, NVIDIA GeForce RTX 4090 | |
| AMD Ryzen 7 9700X, NVIDIA GeForce RTX 4090 (83) | |
| Intel Core Ultra 9 285K, NVIDIA GeForce RTX 4090 (76.2) | |
| Power Consumption / Cinebench R23 Multi (external Monitor) | |
| Intel Core i9-14900K, NVIDIA GeForce RTX 4090 | |
| Intel Core i7-14700K, NVIDIA GeForce RTX 4090 | |
| Intel Core Ultra 9 285K, NVIDIA GeForce RTX 4090 (76.2) | |
| Intel Core i5-14600K, NVIDIA GeForce RTX 4090 | |
| AMD Ryzen 9 9950X, NVIDIA GeForce RTX 4090 (100) | |
| AMD Ryzen 9 7950X3D, NVIDIA GeForce RTX 4090 | |
| AMD Ryzen 9 9900X, NVIDIA GeForce RTX 4090 (85.1) | |
| Intel Core Ultra 5 245K, NVIDIA GeForce RTX 4090 | |
| AMD Ryzen 5 9600X, NVIDIA GeForce RTX 4090 | |
| AMD Ryzen 7 7800X3D, NVIDIA GeForce RTX 4090 | |
| AMD Ryzen 7 9700X, NVIDIA GeForce RTX 4090 (83) | |
| Power Consumption / Prime95 V2810 Stress (external Monitor) | |
| Intel Core i9-14900K, NVIDIA GeForce RTX 4090 | |
| Intel Core i9-13900K, NVIDIA GeForce RTX 3090 | |
| Intel Core i7-14700K, NVIDIA GeForce RTX 4090 | |
| Intel Core Ultra 9 285K, NVIDIA GeForce RTX 4090 (Idle: 76.2 W) | |
| Intel Core i5-14600K, NVIDIA GeForce RTX 4090 | |
| Intel Core i5-13600K, NVIDIA GeForce RTX 3090 | |
| AMD Ryzen 9 7950X, NVIDIA GeForce RTX 3090 | |
| AMD Ryzen 9 7900X, NVIDIA GeForce RTX 3090 | |
| AMD Ryzen 9 9950X, NVIDIA GeForce RTX 4090 (Idle: 100 W) | |
| Intel Core i9-12900K, NVIDIA Titan RTX (Idle: 70.5 W) | |
| AMD Ryzen 9 9900X, NVIDIA GeForce RTX 4090 (Idle: 85.1 W) | |
| AMD Ryzen 9 7950X3D, NVIDIA GeForce RTX 4090 | |
| Intel Core Ultra 5 245K, NVIDIA GeForce RTX 4090 | |
| Intel Core i5-12600K, NVIDIA Titan RTX (Idle: 70.45 W) | |
| AMD Ryzen 7 7800X3D, NVIDIA GeForce RTX 4090 | |
| AMD Ryzen 5 9600X, NVIDIA GeForce RTX 4090 | |
| AMD Ryzen 7 9700X, NVIDIA GeForce RTX 4090 (Idle: 83 W) | |
| Power Consumption / The Witcher 3 ultra (external Monitor) | |
| Intel Core i5-14600K, NVIDIA GeForce RTX 4090 | |
| Intel Core i9-14900K, NVIDIA GeForce RTX 4090 | |
| AMD Ryzen 9 7900X, NVIDIA GeForce RTX 3090 | |
| AMD Ryzen 9 7950X, NVIDIA GeForce RTX 3090 | |
| Intel Core i9-13900K, NVIDIA GeForce RTX 3090 | |
| Intel Core i7-14700K, NVIDIA GeForce RTX 4090 | |
| AMD Ryzen 9 7950X3D, NVIDIA GeForce RTX 4090 | |
| Intel Core i5-13600K, NVIDIA GeForce RTX 3090 | |
| AMD Ryzen 7 7800X3D, NVIDIA GeForce RTX 4090 | |
| Intel Core Ultra 5 245K, NVIDIA GeForce RTX 4090 | |
| AMD Ryzen 9 9950X, NVIDIA GeForce RTX 4090 (Idle: 100 W) | |
| AMD Ryzen 9 9900X, NVIDIA GeForce RTX 4090 (Idle: 85.1 W) | |
| Intel Core i9-12900K, NVIDIA Titan RTX (Idle: 70.5 W) | |
| Intel Core Ultra 9 285K, NVIDIA GeForce RTX 4090 (Idle: 76.2 W) | |
| AMD Ryzen 7 9700X, NVIDIA GeForce RTX 4090 (Idle: 83 W) | |
| Intel Core i5-12600K, NVIDIA Titan RTX (Idle: 70.45 W) | |
| Power Consumption | |
| Intel Core Ultra 9 285K, NVIDIA GeForce RTX 4090 | |
| AMD Ryzen 5 9600X, NVIDIA GeForce RTX 4090 | |
| AMD Ryzen 9 9900X, NVIDIA GeForce RTX 4090 | |
| AMD Ryzen 9 9950X, NVIDIA GeForce RTX 4090 | |
| AMD Ryzen 7 9700X, NVIDIA GeForce RTX 4090 | |
| Intel Core Ultra 5 245K, NVIDIA GeForce RTX 4090 | |
: Cyberpunk 2077 ultra external monitor
* ... kleiner is beter
Deze lagere stroomopname vertaalt zich natuurlijk in een hoge efficiëntiewinst. In Cinebench R15 multi-core is de Core Ultra 9 285K maar liefst 61% efficiënter dan de Core i9-14900K, terwijl hij 64% beter is in Cinebench R23 multi-core.
In Cinebench R23 single-core is de Core Ultra 9 285K 37% efficiënter met 21,2 punten per W vergeleken met de 15,51 punten per W van de Core i9-14900K.
Zelfs tegen de Ryzen 9 9950X behoudt de Core Ultra 9 285K een ruime 32% tot 34% voorsprong in single-core energie-efficiëntie in Cinebench single-core tests.
De Arrow Lake-S CPU laat ook een goede 14% efficiëntiewinst zien ten opzichte van de Core i9-14900K tijdens het afspelen van The Witcher 3 op 1080p Ultra en is zelfs marginaal beter dan een Ryzen 7 7800X3D systeem.
| Power Consumption / Cinebench R15 Multi Efficiency (external Monitor) | |
| AMD Ryzen 9 7950X3D, NVIDIA GeForce RTX 4090 | |
| AMD Ryzen 9 9950X, NVIDIA GeForce RTX 4090 | |
| Intel Core Ultra 9 285K, NVIDIA GeForce RTX 4090 | |
| AMD Ryzen 9 9900X, NVIDIA GeForce RTX 4090 | |
| Intel Core Ultra 5 245K, NVIDIA GeForce RTX 4090 | |
| AMD Ryzen 7 7800X3D, NVIDIA GeForce RTX 4090 | |
| Intel Core i7-14700K, NVIDIA GeForce RTX 4090 | |
| AMD Ryzen 5 9600X, NVIDIA GeForce RTX 4090 | |
| Intel Core i9-14900K, NVIDIA GeForce RTX 4090 | |
| Intel Core i5-14600K, NVIDIA GeForce RTX 4090 | |
| Power Consumption / Cinebench R23 Single Power Efficiency - external Monitor | |
| Intel Core Ultra 9 285K, NVIDIA GeForce RTX 4090 | |
| Intel Core Ultra 5 245K, NVIDIA GeForce RTX 4090 | |
| AMD Ryzen 9 9900X, NVIDIA GeForce RTX 4090 | |
| AMD Ryzen 9 9950X, NVIDIA GeForce RTX 4090 | |
| Intel Core i9-14900K, NVIDIA GeForce RTX 4090 | |
| AMD Ryzen 5 9600X, NVIDIA GeForce RTX 4090 | |
| Intel Core i7-14700K, NVIDIA GeForce RTX 4090 | |
| Intel Core i5-14600K, NVIDIA GeForce RTX 4090 | |
| AMD Ryzen 7 7800X3D, NVIDIA GeForce RTX 4090 | |
| Power Consumption / Cinebench R23 Multi Power Efficiency - external Monitor | |
| AMD Ryzen 9 9950X, NVIDIA GeForce RTX 4090 | |
| Intel Core Ultra 9 285K, NVIDIA GeForce RTX 4090 | |
| AMD Ryzen 9 7950X3D, NVIDIA GeForce RTX 4090 | |
| AMD Ryzen 9 9900X, NVIDIA GeForce RTX 4090 | |
| Intel Core Ultra 5 245K, NVIDIA GeForce RTX 4090 | |
| AMD Ryzen 7 7800X3D, NVIDIA GeForce RTX 4090 | |
| Intel Core i7-14700K, NVIDIA GeForce RTX 4090 | |
| AMD Ryzen 5 9600X, NVIDIA GeForce RTX 4090 | |
| Intel Core i9-14900K, NVIDIA GeForce RTX 4090 | |
| Intel Core i5-14600K, NVIDIA GeForce RTX 4090 | |
| Power Consumption / Cinebench 2024 Single Power Efficiency - external Monitor | |
| Intel Core Ultra 9 285K, NVIDIA GeForce RTX 4090 | |
| AMD Ryzen 9 9900X, NVIDIA GeForce RTX 4090 | |
| AMD Ryzen 9 9950X, NVIDIA GeForce RTX 4090 | |
| Power Consumption / Cinebench 2024 Multi Power Efficiency - external Monitor | |
| Intel Core Ultra 9 285K, NVIDIA GeForce RTX 4090 | |
| AMD Ryzen 9 9950X, NVIDIA GeForce RTX 4090 | |
| AMD Ryzen 9 9900X, NVIDIA GeForce RTX 4090 | |
| Power Consumption / Witcher 3 ultra Efficiency (external Monitor) | |
| Intel Core Ultra 9 285K, NVIDIA GeForce RTX 4090 | |
| AMD Ryzen 7 7800X3D, NVIDIA GeForce RTX 4090 | |
| Intel Core i5-12400F, NVIDIA GeForce RTX 4090 | |
| Intel Core Ultra 5 245K, NVIDIA GeForce RTX 4090 | |
| AMD Ryzen 9 7950X3D, NVIDIA GeForce RTX 4090 | |
| AMD Ryzen 9 9900X, NVIDIA GeForce RTX 4090 | |
| AMD Ryzen 9 9950X, NVIDIA GeForce RTX 4090 | |
| AMD Ryzen 9 7950X, NVIDIA GeForce RTX 4090 | |
| Intel Core i9-14900K, NVIDIA GeForce RTX 4090 | |
| Intel Core i5-14600K, NVIDIA GeForce RTX 4090 | |
| Intel Core i5-13400, NVIDIA GeForce RTX 4090 | |
| Intel Core i7-14700K, NVIDIA GeForce RTX 4090 | |
| Intel Core i9-14900K, NVIDIA GeForce RTX 4090 | |
Notebookcheck's algemene indruk van de Core Ultra 9 285K
De Intel Core Ultra 9 285K slaagt erin om Core i9-14900K-niveaus van ruwe CPU-prestaties te bieden bij lagere vermogensniveaus.
De gamingprestaties zijn echter niet toereikend, waardoor de vraagprijs van $589 in twijfel wordt getrokken.
Hardcore gamers kunnen misschien beter wachten tot de Ryzen 9000X3D chips begin november uitkomen voordat ze hun geld uitgeven.
Transparantie
De selectie van te beoordelen apparaten wordt gemaakt door onze redactie. Het testexemplaar werd ten behoeve van deze beoordeling door de fabrikant of detailhandelaar in bruikleen aan de auteur verstrekt. De kredietverstrekker had geen invloed op deze recensie, noch ontving de fabrikant vóór publicatie een exemplaar van deze recensie. Er bestond geen verplichting om deze recensie te publiceren. Wij accepteren nooit een compensatie of betaling in ruil voor onze beoordelingen. Als onafhankelijk mediabedrijf is Notebookcheck niet onderworpen aan het gezag van fabrikanten, detailhandelaren of uitgevers.
[transparency_disclaimer]Dit is hoe Notebookcheck test
Elk jaar beoordeelt Notebookcheck onafhankelijk honderden laptops en smartphones met behulp van gestandaardiseerde procedures om ervoor te zorgen dat alle resultaten vergelijkbaar zijn. We hebben onze testmethoden al zo'n 20 jaar voortdurend ontwikkeld en daarbij de industriestandaard bepaald. In onze testlaboratoria wordt gebruik gemaakt van hoogwaardige meetapparatuur door ervaren technici en redacteuren. Deze tests omvatten een validatieproces in meerdere fasen. Ons complexe beoordelingssysteem is gebaseerd op honderden goed onderbouwde metingen en benchmarks, waardoor de objectiviteit behouden blijft. Meer informatie over onze testmethoden kunt u hier vinden.

