Notebookcheck Logo

Asus ROG Strix Scar 15 G533zm beoordeling: Moderne RTX 3060 gaming laptop met veel sterke punten

Pas uw Scar aan met 3D-printen.

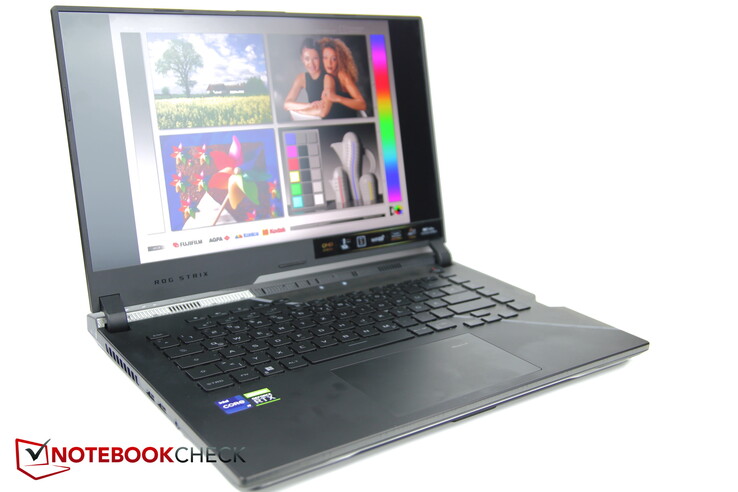
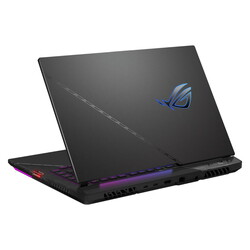
Nadat we de Scar 15 G533zw met een RTX 3070 Ti hebben bekeken, hebben we nu ook de G533zm met een RTX 3060 in handen gekregen. De Scar-laptop is aanpasbaar en biedt veel moderne functies, zoals Wi-Fi 6E, DDR5 RAM en Thunderbolt 4. In onze review bespreken we of deze functies genoeg zijn om de vrij hoge prijs van € 1.999 (US$ 2.166) voor een RTX 3060 gaming laptop te rechtvaardigen.

We hebben momenteel twee modellen van de Asus ROG Strix Scar 15 beschikbaar om te testen. Dit artikel zal zich richten op de RTX 3060 versie, terwijl een review van de RTX 3070 Ti model parallel zal worden gepubliceerd. Naast de RTX 3060 is onze SKU uitgerust met een krachtige Alder Lake i9-12900H CPU, 16 GB RAM en een 240Hz QHD beeldscherm.

Vorig jaar hebben we de vorige Scar 15 met een RTX 3080dus is het logischer om onze revieweenheid te vergelijken met zijn RTX 3070 Ti broer. Bovendien hebben we ervoor gekozen om andere 15-inch gaming laptops met dezelfde GPU in onze vergelijking op te nemen, zoals de Asus TUF Gaming F15, de MSI Pulse GL66 en de Alienware m15 R5. Hoewel de vergelijking ook de Lenovo Legion 5 met een Radeon RX6600Mbevindt deze laptop zich niet in dezelfde prijsklasse als de Strix Scar, aangezien onze reviewconfiguratie rond de €2.000 (US$2.170) kost, terwijl de Legion iets meer dan €1.000 (US$1.085) kost.

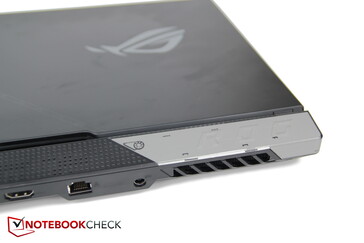
Voor delen over het chassis, onderhoud, invoerapparaten en meer, verwijzen wij u naar onze hoofdrecensie van de Asus ROG Strix Scar met RTX 3070 Ti.

Asus ROG Strix Scar 15 G533zm (ROG Strix Scar 15 Serie)
Processor
Intel Core i9-12900H 14 x 1.8 - 5 GHz, 135 W PL2 / Short Burst, 135 W PL1 / Sustained, Alder Lake-H
Grafische kaart
NVIDIA GeForce RTX 3060 Laptop GPU - 6 GB VRAM, 140 W TDP ( waaronder 25 W Dynamic Boost), Geforce 512.77, MUX Switch + Optimus
Geheugen
16 GB 
, 2x 8 GB Samsung DDR5-4800
Beeldscherm
15.60 inch 16:9, 2560 x 1440 pixel 188 PPI, BOE CQ NE156QHM-NZ2 (BOE0A55), IPS, glimmend: ja, 240 Hz
Moederbord
Intel Alder Lake-P PCH
Geluidskaart
Intel Alder Lake-P PCH - cAVS (Audio, Voice, Speech)
Verbindingen
2 USB 3.0, 2 USB 3.2 Gen 2x2 20Gbps, 1 Thunderbolt, USB-C Power Delivery (PD), 1 HDMI, 2 DisplayPort, Audio Verbindingen: Headset jack port
Netwerkmogelijkheden
Realtek RTL8125 2.5GBe Family Ethernet Controller (10/100/1000/2500MBit/s), Intel Wi-Fi 6E AX211 (a/b/g/h/n = Wi-Fi 4/ac = Wi-Fi 5/ax = Wi-Fi 6/ Wi-Fi 6E 6 GHz), Bluetooth Bluetooth 5.2
Afmetingen
hoogte x breedte x diepte (in mm): 27.2 x 354 x 259
Batterij
90 Wh Lithium-Ion
Besturingssysteem
Microsoft Windows 11 Home
Bijkomende functionaliteiten
Luidsprekers: 4-speaker system with Smart Amplifier Technology, Toetsenbord: chiclet with RGB per key, Toetsenbordverlichting: ja, 24 Maanden Garantie
Gewicht
2.328 kg, Voeding: 734 g
Prijs
1999 Euro
Opmerking: De fabrikant kan onderdelen van verschillende leveranciers gebruiken, waaronder beeldschermen, schijven of geheugensticks met vergelijkbare specificaties.


Mogelijke alternatieven vergeleken

Evaluatie
Datum
Model
Gewicht
Hoogte
Formaat
Resolutie
Beste prijs
89.2 %
v7 (old)
11-2024
Asus ROG Strix Scar 15 G533zm
i9-12900H, GeForce RTX 3060 Laptop GPU
2.3 kg27.2 mm15.60"2560x1440
86.3 %
v7 (old)
06-2022
Asus ROG Strix Scar 15 G533ZW-LN106WS
i9-12900H, GeForce RTX 3070 Ti Laptop GPU
2.3 kg27.2 mm15.60"2560x1440
87.2 %
v7 (old)
03-2022
Asus TUF Gaming F15 FX507ZM
i7-12700H, GeForce RTX 3060 Laptop GPU
2.1 kg24.95 mm15.60"1920x1080
80.7 %
v7 (old)
04-2022
MSI Pulse GL66 12UEK
i9-12900H, GeForce RTX 3060 Laptop GPU
2.3 kg25 mm15.60"1920x1080
84.7 %
v7 (old)
06-2021
Alienware m15 R5 Ryzen Edition
R7 5800H, GeForce RTX 3060 Laptop GPU
2.5 kg22.85 mm15.60"1920x1080
82.6 %
v7 (old)
05-2022
Lenovo Legion 5 15ACH6A-82NW0010GE
R5 5600H, Radeon RX 6600M
2.5 kg25.75 mm15.60"1920x1080
Heldere rubberen voetjes, diagonale lijnen

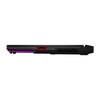
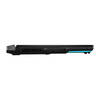
Er loopt bijvoorbeeld een lichtstrip over de hele voorkant, maar deze is iets verzonken, waardoor hij minder opvallend aanvoelt. Deze lichtstrip kan ook worden gesynchroniseerd met het toetsenbord en het ROG-logo op de bovenkant.

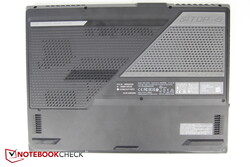
Aan de onderkant zitten brede, felgekleurde rubberen voetjes, die contrast toevoegen aan het overwegend zwarte chassis.

Ondanks de bijna volledig plastic constructie voelt de Strix Scar 15 vrij stevig aan. Het scherm maakt geen geluid als het gedraaid wordt, terwijl de onderkant slechts licht kraakt.

Het scherm wordt stevig op zijn plaats gehouden door twee scharnieren en wiebelt nauwelijks als het wordt bewogen.

Grootte vergelijking

Over het geheel genomen is de Scar 15 iets dikker, maar een fractie kleiner dan sommige van zijn concurrenten. Hij is ook relatief licht; de Alienware- en Legion -modellen zijn bijvoorbeeld zwaarder, en alleen de TUF Gaming F15 is iets lichter.

362.5 mm 260.6 mm 25.75 mm 2.5 kg359 mm 259 mm 25 mm 2.3 kg354 mm 259 mm 27.2 mm 2.3 kg354 mm 259 mm 27.2 mm 2.3 kg354.9 mm 251.9 mm 24.95 mm 2.1 kg356.2 mm 272.5 mm 22.85 mm 2.5 kg297 mm 210 mm 1 mm 5.7 g

Specificaties - Thunderbolt 4, Keystone, maar geen Webcam

De Strix is uitgerust met twee USB-C poorten, waarvan er één Thunderbolt 4 ondersteunt en de andere USB 3.2 Gen 2 snelheden aankan; beide bieden DisplayPort-functionaliteit. Hieruit blijkt dat de laptop over redelijk moderne functies beschikt. De I/O's zijn goed verdeeld over de linkerkant en achterkant van het apparaat.

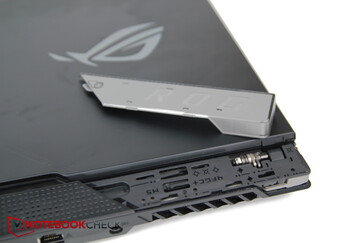
De rechterkant heeft alleen een Keystone-sleuf. De Keystone is een soort klein opslagapparaat en schakelaar in één. Hij kan bijvoorbeeld worden gebruikt om instellingen op te slaan en over te zetten naar laptops die deze functie ondersteunen (een lijst met compatibele modellen wordt door Asus geleverd)). Het kan ook functioneren als een beveiligingssleutel op de Strix Scar: eenmaal geconfigureerd, zal de laptop alleen aan gaan als de Keystone erin gestoken is. Een andere toepassing is het mogelijk maken van snelle toegang tot programma's. Gebruikers kunnen de laptop opdracht geven om automatisch een bepaald programma, zoals een game, te openen als de Keystone is aangesloten. De laptop kan ook geprogrammeerd worden om een combinatie van acties uit te voeren, zoals overschakelen naar een krachtige ventilatormodus en tegelijkertijd Cyberpunk starten. De gebruiker heeft de keuze.

Er ontbreekt echter één ding op het apparaat van Asus - een webcam. Hierdoor is de Scar Strix een van de weinige (gaming) laptops zonder webcam.

Links: 2x USB-A 3.0 (3.2 Gen1), combo audio-aansluiting
Rechts: Keystone
Rechts: Keystone
Achterkant: USB-C Thunderbolt 4 met DP, USB-C 3.2 Gen2 met DP en PD, HDMI 2.1, LAN, voedingspoort

Connectiviteit

Networking
iperf3 transmit AX12
Alienware m15 R5 Ryzen Edition
Killer Wi-Fi 6 AX1650x Wireless Network Adapter (200NGW)
1371 (925min - 1499max) MBit/s
Gemiddeld Intel Wi-Fi 6E AX211
  (1003 - 1501, n=4)
1320 MBit/s
Asus TUF Gaming F15 FX507ZM
Intel Wi-Fi 6 AX201
1045 (936min - 1115max) MBit/s
Lenovo Legion 5 15ACH6A-82NW0010GE
Realtek RTL8852AE
865 (767min - 911max) MBit/s
MSI Pulse GL66 12UEK
Intel Wi-Fi 6 AX201
690 (352min - 713max) MBit/s
iperf3 receive AX12
Asus TUF Gaming F15 FX507ZM
Intel Wi-Fi 6 AX201
1445 (1383min - 1538max) MBit/s
Gemiddeld Intel Wi-Fi 6E AX211
  (1178 - 1623, n=4)
1409 MBit/s
Alienware m15 R5 Ryzen Edition
Killer Wi-Fi 6 AX1650x Wireless Network Adapter (200NGW)
1330 (711min - 1563max) MBit/s
Lenovo Legion 5 15ACH6A-82NW0010GE
Realtek RTL8852AE
708 (665min - 735max) MBit/s
MSI Pulse GL66 12UEK
Intel Wi-Fi 6 AX201
702 (588min - 717max) MBit/s
iperf3 receive AXE11000 6GHz
Asus ROG Strix Scar 15 G533ZW-LN106WS
Intel Wi-Fi 6E AX211
1857 (831min - 1948max) MBit/s +16%
Asus ROG Strix Scar 15 G533zm
Intel Wi-Fi 6E AX211
1601 (639min - 1624max) MBit/s
Gemiddeld Intel Wi-Fi 6E AX211
  (700 - 1857, n=207)
1494 MBit/s -7%
Gemiddelde van klas Gaming
  (853 - 1788, n=73, laatste 2 jaar)
1485 MBit/s -7%
iperf3 transmit AXE11000 6GHz
Asus ROG Strix Scar 15 G533ZW-LN106WS
Intel Wi-Fi 6E AX211
1481 (1314min - 1543max) MBit/s +5%
Gemiddelde van klas Gaming
  (648 - 1878, n=73, laatste 2 jaar)
1428 MBit/s +2%
Asus ROG Strix Scar 15 G533zm
Intel Wi-Fi 6E AX211
1404 (693min - 1451max) MBit/s
Gemiddeld Intel Wi-Fi 6E AX211
  (632 - 1851, n=208)
1375 MBit/s -2%
0501001502002503003504004505005506006507007508008509009501000105011001150120012501300135014001450150015501600Tooltip
Asus ROG Strix Scar 15 G533zm; iperf3 transmit AXE11000 6GHz; iperf 3.1.3: Ø1381 (693-1451)
Asus ROG Strix Scar 15 G533zm; iperf3 receive AXE11000 6GHz; iperf 3.1.3: Ø1532 (639-1624)

Invoerapparaten - Touchpad-knop kan enigszins vast komen te zitten

Touchpad

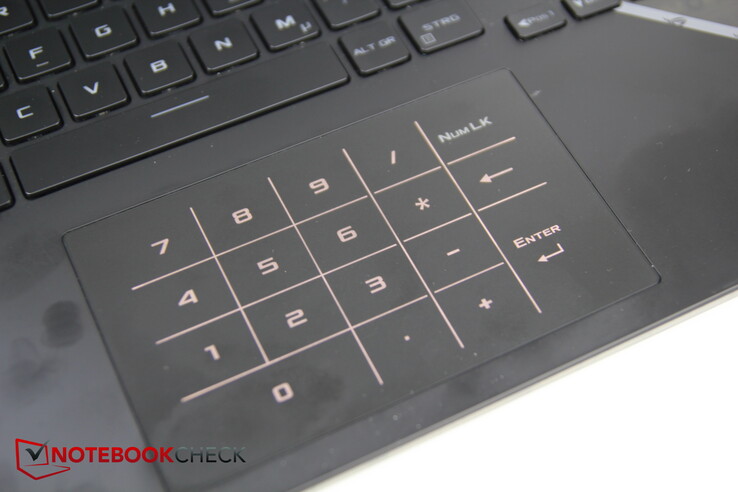
Het enorme touchpad heeft nog een leuk trucje achter de hand: het kan een numeriek toetsenblok weergeven. Dat gezegd hebbende, kunnen de geïntegreerde knoppen op ons beoordelingstoestel soms een beetje vast komen te zitten, vooral de linkerknop, wat we erg vervelend vonden.

Beeldscherm - QHD met 240Hz en Dolby Vision Atmos

Het QHD IPS-scherm (2.560 x 1.440 pixels) van BOE heeft vrij snelle responstijden, een hoge vernieuwingsfrequentie van 240 Hz en een uitstekende kleurdekking, waarmee vrijwel het gehele sRGB- en AdobeRGB-gamma gereproduceerd kan worden.

Het paneel heeft een gemiddelde piekhelderheid van 300 nits en een vrij goede helderheidsverdeling van 89%. Het zwartniveau en contrast zijn echter vrij gemiddeld.

De laptop maakt geen gebruik van PWM om de helderheid aan te passen, en er is slechts een minuscuul beetje screen bleeding.

314
cd/m²
354
cd/m²
346
cd/m²
330
cd/m²
349
cd/m²
349
cd/m²
320
cd/m²
321
cd/m²
317
cd/m²
Helderheidsverdeling
BOE CQ NE156QHM-NZ2 (BOE0A55) tested with X-Rite i1Pro 3
Maximum: 354 cd/m² (Nits) Gemiddelde: 333.3 cd/m² Minimum: 4.3 cd/m²
Helderheidsverdeling: 89 %
Helderheid in Batterij-modus: 357 cd/m²
Contrast: 1026:1 (Zwart: 0.34 cd/m²)
ΔE Color 3.44 | 0.5-29.43 Ø4.93, calibrated: 2.43
ΔE Greyscale 3.34 | 0.5-98 Ø5.2
84.1% AdobeRGB 1998 (Argyll 2.2.0 3D)
99.6% sRGB (Argyll 2.2.0 3D)
95% Display P3 (Argyll 2.2.0 3D)
Gamma: 2.5
Asus ROG Strix Scar 15 G533zm
BOE CQ NE156QHM-NZ2 (BOE0A55), IPS, 2560x1440, 15.6"
Asus ROG Strix Scar 15 G533ZW-LN106WS
BOE CQ NE156QHM-NZ2, IPS-level, 2560x1440, 15.6"
Asus TUF Gaming F15 FX507ZM
TL156VDXP0101, IPS, 1920x1080, 15.6"
MSI Pulse GL66 12UEK
AU Optronics B156HAN08.4 (AUOAF90), IPS, 1920x1080, 15.6"
Alienware m15 R5 Ryzen Edition
B156HAN, IPS, 1920x1080, 15.6"
Lenovo Legion 5 15ACH6A-82NW0010GE
LGD06A5, IPS, 1920x1080, 15.6"
Display
0%
-17%
-51%
-13%
Display P3 Coverage
95
96.2
1%
66.4
-30%
39
-59%
71.1
-25%
sRGB Coverage
99.6
99.9
0%
97
-3%
58.4
-41%
99.1
-1%
AdobeRGB 1998 Coverage
84.1
84.5
0%
68.5
-19%
40.3
-52%
72.3
-14%
Response Times
14%
-4%
-333%
30%
-45%
Response Time Grey 50% / Grey 80% *
6.4 ?(3, 3.4)
7.86 ?(4.02, 3.84)
-23%

4.21 ?(1.98, 2.23)
34%

5.6 ?(3.2, 2.4)
12%
38.8 ?(18.2, 20.6)
-506%
4 ?(1.2, 2.8)
37%
15 ?(7, 8)
-134%
Response Time Black / White *
10.8 ?(5.7, 5.1)
7.5 ?(3.89, 3.61)
31%
12.8 ?(6.8, 6)
-19%
28 ?(14.6, 13.4)
-159%
8.4 ?(4.4, 4)
22%
6 ?(2, 4)
44%
PWM Frequency
Screen
-14%
23%
15%
14%
2%
Brightness middle
349
346
-1%
353.7
1%
248
-29%
329
-6%
371
6%
Brightness
333
329
-1%
340
2%
245
-26%
321
-4%
328
-2%
Brightness Distribution
89
91
2%
89
0%
86
-3%
92
3%
85
-4%
Black Level *
0.34
0.59
-74%
0.34
-0%
0.13
62%
0.27
21%
0.32
6%
Contrast
1026
586
-43%
1040
1%
1908
86%
1219
19%
1159
13%
Colorchecker dE 2000 *
3.44
3.06
11%
1.74
49%
3.14
9%
2.78
19%
3.25
6%
Colorchecker dE 2000 max. *
5.78
5.81
-1%
3.63
37%
5.82
-1%
4.88
16%
6.33
-10%
Colorchecker dE 2000 calibrated *
2.43
2.57
-6%
0.5
79%
3.14
-29%
1.63
33%
1.11
54%
Greyscale dE 2000 *
3.34
2.1
37%
1.2
64%
2.5
25%
4.94
-48%
Gamma
2.5 88%
2.12 104%
2.3 96%
2.49 88%
2.106 104%
2.45 90%
CCT
6641 98%
7021 93%
6257 104%
6468 100%
6201 105%
6064 107%
Color Space (Percent of AdobeRGB 1998)
76
Color Space (Percent of sRGB)
99
Totaal Gemiddelde (Programma / Instellingen)
0% / -5%
1% / 11%
-123% / -49%
22% / 17%
-19% / -8%

* ... kleiner is beter

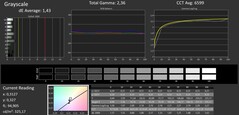
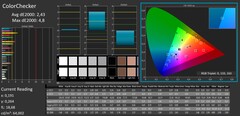
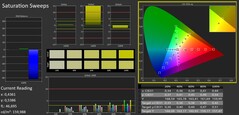
Met behulp van de Calman kleurkalibratietool van Portrait Displays hebben we direct uit de verpakking normale tot matige kleurverschillen gemeten, waarbij het beeldscherm een meer oranje tint had. Met onze kalibratie zijn we erin geslaagd om de kleurverschillen aanzienlijk te verminderen.

Grijswaarden
Grijswaarden
Verzadiging
Verzadiging
Kleurencontrole
Kleurencontrole
Grijswaarden gekalibreerd
ColorChecker gekalibreerd
Verzadiging gekalibreerd

Responstijd Scherm

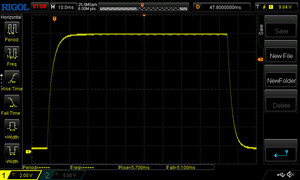
De responstijden van het scherm tonen hoe snel het scherm in staat is om van één kleur naar de andere te veranderen. Trage responstijden kunnen aanleiding geven tot 'nabeelden' rond bewegende objecten of het scherm wazig maken (blur). Vooral spelers van snelle 3D-games hebben baat bij een scherm met snelle responstijden.
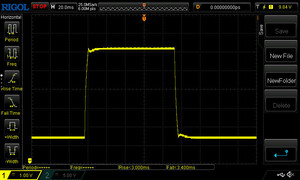
       Responstijd Zwart naar Wit
10.8 ms ... stijging ↗ en daling ↘ gecombineerd↗ 5.7 ms stijging
↘ 5.1 ms daling
Het scherm vertoonde prima responstijden in onze tests maar is misschien wat te traag voor competitieve games.
Ter vergelijking: alle testtoestellen variëren van 0.1 (minimum) tot 240 (maximum) ms. » 25 % van alle toestellen zijn beter.
Dit betekent dat de gemeten responstijd beter is dan het gemiddelde (21 ms) van alle geteste toestellen.
       Responstijd 50% Grijs naar 80% Grijs
6.4 ms ... stijging ↗ en daling ↘ gecombineerd↗ 3 ms stijging
↘ 3.4 ms daling
Het scherm vertoonde erg snelle responstijden in onze tests en zou zeer geschikt moeten zijn voor snelle games.
Ter vergelijking: alle testtoestellen variëren van 0.165 (minimum) tot 636 (maximum) ms. » 15 % van alle toestellen zijn beter.
Dit betekent dat de gemeten responstijd beter is dan het gemiddelde (32.9 ms) van alle geteste toestellen.

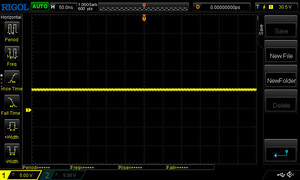
Screen Flickering / PWM (Pulse-Width Modulation)

Om de schermhelderheid te verlagen schakelen sommige laptops het backlight erg snel aan en uit. Dit gebeurt aan een dergelijk hoge frequentie dat het niet zichtbaar is voor het menselijk oog. Als de frequentie te laag is kunnen personen met gevoelige ogen geïrriteerd geraken, hoofdpijn krijgen en zelfs flickering waarnemen.
Screen flickering / PWM niet waargenomen

Ter vergelijking: 53 % van alle geteste toestellen maakten geen gebruik van PWM om de schermhelderheid te verlagen. Als het wel werd gebruikt, werd een gemiddelde van 8774 (minimum: 5 - maximum: 343500) Hz waargenomen.

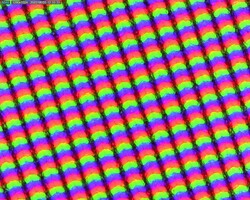
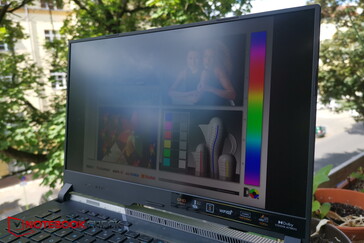
Dankzij het matte oppervlak van het scherm en de solide helderheidsniveaus blijft de inhoud van het scherm ook buiten in de schaduw leesbaar. Vermijd echter bij voorkeur direct zonlicht en probeer het scherm van voren te bekijken.

Buiten in de schaduw
Reflecties wanneer u het scherm onder een hoek bekijkt

De kijkhoek is vrij goed, wat typisch is voor een IPS-paneel. Kleurvervorming en helderheidsafrolling worden alleen merkbaar als het scherm vanuit een extreme hoek wordt bekeken.

Prestaties - Goede gamingprestaties met een 140W RTX 3060

De Core i9-12900H behoort tot de beste in zijn hardwareklasse. Hoewel de RTX 3060 in staat zou moeten zijn om alle games op FHD aan te kunnen, kan het worstelen met zeer veeleisende games op de eigen QHD-resolutie van het scherm. Asus heeft ook snel DDR5 RAM meegeleverd. Over het geheel genomen is de Strix Scar een gaming-laptop uit het hogere middensegment die voor sommige foto- en videobewerkers ook aantrekkelijk kan zijn.

Testomstandigheden

Naar onze mening is Asus te ver gegaan met hun software. Asus gaming notebooks worden geleverd met de Armoury Crate software bovenop het MyASUS programma, dat ook vooraf geïnstalleerd is op hun gewone laptops. Met Armoury Crate kunt u ventilator- en prestatieprofielen aanpassen, en wij hebben de Turbomodus gebruikt om de best mogelijke benchmarkresultaten te behalen tijdens onze tests. Aan de andere kant bevat MyASUS instellingen voor het oplaadgedrag van de batterij, Wi-Fi-opties en manieren om contact op te nemen met de klantenservice. Asus zou kunnen overwegen om de twee programma's te combineren om onnodige softwarebloat voor hun klanten te voorkomen.

Overzicht Armoury Krat
Wapenarsenaal Krat instellingen
MyASUS
MyASUS

Processor

Asus heeft ervoor gekozen om de meeste modellen uit te rusten met de high-end Intel Core i9-12900Hmet 6 Performance (P) en 8 Efficiency (E) cores, die 20 threads tegelijk aankunnen. Elke P-core kan tot 5 GHz draaien. Zowel de Strix G533zm als de G533zw zijn verkrijgbaar met de iets minder krachtige i7-12700H.

In onze Cinebench R15 looptest leverde de CPU zoals verwacht geweldige prestaties, en overtrof zowel de i7-12700H in de Asus TUF Gaming F15 als de vorige generatie Ryzen-chips. Alleen in Cinebench R20 bleef hij reproduceerbaar achter.

Door over te schakelen op batterijvoeding daalde de Cinebench R15-score naar 1.752.

Cinebench R15 Multi sustained load

01553104656207759301085124013951550170518602015217023252480263527902945Tooltip
Asus ROG Strix Scar 15 G533zm Intel Core i9-12900H: Ø3056 (3039.05-3076.92)
Asus TUF Gaming F15 FX507ZM Intel Core i7-12700H: Ø2656 (2614.89-2735.42)
Alienware m15 R5 Ryzen Edition AMD Ryzen 7 5800H: Ø1977 (1921.88-2004.51)
Lenovo Legion 5 15ACH6A-82NW0010GE AMD Ryzen 5 5600H: Ø1622 (1447.86-1653.64)
CPU Performance Rating: Percent
Cinebench R23: Multi Core | Single Core
Cinebench R20: CPU (Multi Core) | CPU (Single Core)
Cinebench R15: CPU Multi 64Bit | CPU Single 64Bit
Blender: v2.79 BMW27 CPU
7-Zip 18.03: 7z b 4 | 7z b 4 -mmt1
Geekbench 5.5: Multi-Core | Single-Core
HWBOT x265 Benchmark v2.2: 4k Preset
LibreOffice : 20 Documents To PDF
R Benchmark 2.5: Overall mean
CPU Performance Rating
Gemiddelde van klas Gaming
 
83.9 pt
Asus ROG Strix Scar 15 G533ZW-LN106WS
Intel Core i9-12900H
79.4 pt
Asus ROG Strix Scar 15 G533zm
Intel Core i9-12900H
77.5 pt
MSI Pulse GL66 12UEK
Intel Core i9-12900H
76 pt
Asus TUF Gaming F15 FX507ZM
Intel Core i7-12700H
72.6 pt
Gemiddeld Intel Core i9-12900H
 
69.8 pt
Alienware m15 R5 Ryzen Edition
AMD Ryzen 7 5800H
55.1 pt
Lenovo Legion 5 15ACH6A-82NW0010GE
AMD Ryzen 5 5600H
49.2 pt
Cinebench R23 / Multi Core
Gemiddelde van klas Gaming
  (5668 - 36249, n=194, laatste 2 jaar)
21642 Points +28%
Asus ROG Strix Scar 15 G533ZW-LN106WS
Intel Core i9-12900H
19064 Points +13%
Asus TUF Gaming F15 FX507ZM
Intel Core i7-12700H
17713 (16651.9min - 17712.9max) Points +5%
MSI Pulse GL66 12UEK
Intel Core i9-12900H
17667 Points +4%
Asus ROG Strix Scar 15 G533zm
Intel Core i9-12900H
16917 Points
Gemiddeld Intel Core i9-12900H
  (7359 - 19648, n=28)
15133 Points -11%
Alienware m15 R5 Ryzen Edition
AMD Ryzen 7 5800H
12195 Points -28%
Lenovo Legion 5 15ACH6A-82NW0010GE
AMD Ryzen 5 5600H
10416 Points -38%
Cinebench R23 / Single Core
Asus ROG Strix Scar 15 G533ZW-LN106WS
Intel Core i9-12900H
1918 Points +6%
MSI Pulse GL66 12UEK
Intel Core i9-12900H
1914 Points +6%
Gemiddelde van klas Gaming
  (1088 - 2235, n=192, laatste 2 jaar)
1878 Points +4%
Gemiddeld Intel Core i9-12900H
  (1634 - 1930, n=28)
1829 Points +1%
Asus ROG Strix Scar 15 G533zm
Intel Core i9-12900H
1805 Points
Asus TUF Gaming F15 FX507ZM
Intel Core i7-12700H
1771 Points -2%
Alienware m15 R5 Ryzen Edition
AMD Ryzen 7 5800H
1430 Points -21%
Lenovo Legion 5 15ACH6A-82NW0010GE
AMD Ryzen 5 5600H
1366 Points -24%
Cinebench R20 / CPU (Multi Core)
Gemiddelde van klas Gaming
  (2179 - 13832, n=192, laatste 2 jaar)
8236 Points +55%
Asus ROG Strix Scar 15 G533ZW-LN106WS
Intel Core i9-12900H
7109 Points +33%
Asus TUF Gaming F15 FX507ZM
Intel Core i7-12700H
6754 Points +27%
MSI Pulse GL66 12UEK
Intel Core i9-12900H
6675 Points +25%
Gemiddeld Intel Core i9-12900H
  (2681 - 7471, n=28)
5717 Points +7%
Asus ROG Strix Scar 15 G533zm
Intel Core i9-12900H
5329 Points
Alienware m15 R5 Ryzen Edition
AMD Ryzen 7 5800H
4711 Points -12%
Lenovo Legion 5 15ACH6A-82NW0010GE
AMD Ryzen 5 5600H
4059 Points -24%
Cinebench R20 / CPU (Single Core)
MSI Pulse GL66 12UEK
Intel Core i9-12900H
735 Points +1%
Asus ROG Strix Scar 15 G533zm
Intel Core i9-12900H
730 Points
Asus ROG Strix Scar 15 G533ZW-LN106WS
Intel Core i9-12900H
728 Points 0%
Gemiddelde van klas Gaming
  (427 - 856, n=192, laatste 2 jaar)
722 Points -1%
Gemiddeld Intel Core i9-12900H
  (624 - 738, n=28)
706 Points -3%
Asus TUF Gaming F15 FX507ZM
Intel Core i7-12700H
680 Points -7%
Alienware m15 R5 Ryzen Edition
AMD Ryzen 7 5800H
559 Points -23%
Lenovo Legion 5 15ACH6A-82NW0010GE
AMD Ryzen 5 5600H
535 Points -27%
Cinebench R15 / CPU Multi 64Bit
Gemiddelde van klas Gaming
  (905 - 5663, n=199, laatste 2 jaar)
3392 Points +10%
Asus ROG Strix Scar 15 G533zm
Intel Core i9-12900H
3077 (3039.05min - 3076.92max) Points
Asus ROG Strix Scar 15 G533ZW-LN106WS
Intel Core i9-12900H
2978 (2732.8min - 2978.18max) Points -3%
Asus TUF Gaming F15 FX507ZM
Intel Core i7-12700H
2735 (2614.89min - 2735.42max) Points -11%
MSI Pulse GL66 12UEK
Intel Core i9-12900H
2729 (2493.77min - 2729.26max) Points -11%
Gemiddeld Intel Core i9-12900H
  (1395 - 3077, n=28)
2454 Points -20%
Alienware m15 R5 Ryzen Edition
AMD Ryzen 7 5800H
2005 (1921.88min - 2004.51max) Points -35%
Lenovo Legion 5 15ACH6A-82NW0010GE
AMD Ryzen 5 5600H
1723 Points -44%
Cinebench R15 / CPU Single 64Bit
MSI Pulse GL66 12UEK
Intel Core i9-12900H
277 Points 0%
Asus ROG Strix Scar 15 G533zm
Intel Core i9-12900H
276 Points
Gemiddelde van klas Gaming
  (176.6 - 318, n=196, laatste 2 jaar)
276 Points 0%
Asus ROG Strix Scar 15 G533ZW-LN106WS
Intel Core i9-12900H
275 Points 0%
Gemiddeld Intel Core i9-12900H
  (235 - 277, n=29)
262 Points -5%
Asus TUF Gaming F15 FX507ZM
Intel Core i7-12700H
253 Points -8%
Alienware m15 R5 Ryzen Edition
AMD Ryzen 7 5800H
232 Points -16%
Lenovo Legion 5 15ACH6A-82NW0010GE
AMD Ryzen 5 5600H
223 Points -19%
Blender / v2.79 BMW27 CPU
Lenovo Legion 5 15ACH6A-82NW0010GE
AMD Ryzen 5 5600H
305.2 Seconds * -76%
Alienware m15 R5 Ryzen Edition
AMD Ryzen 7 5800H
253 Seconds * -46%
Gemiddeld Intel Core i9-12900H
  (160 - 451, n=28)
231 Seconds * -33%
MSI Pulse GL66 12UEK
Intel Core i9-12900H
187 Seconds * -8%
Asus TUF Gaming F15 FX507ZM
Intel Core i7-12700H
182 Seconds * -5%
Asus ROG Strix Scar 15 G533ZW-LN106WS
Intel Core i9-12900H
175.4 Seconds * -1%
Asus ROG Strix Scar 15 G533zm
Intel Core i9-12900H
173.7 Seconds *
Gemiddelde van klas Gaming
  (87 - 555, n=187, laatste 2 jaar)
172.1 Seconds * +1%
7-Zip 18.03 / 7z b 4
Gemiddelde van klas Gaming
  (23795 - 140932, n=191, laatste 2 jaar)
84613 MIPS +15%
Asus ROG Strix Scar 15 G533zm
Intel Core i9-12900H
73489 MIPS
Asus ROG Strix Scar 15 G533ZW-LN106WS
Intel Core i9-12900H
67680 MIPS -8%
Asus TUF Gaming F15 FX507ZM
Intel Core i7-12700H
67160 MIPS -9%
MSI Pulse GL66 12UEK
Intel Core i9-12900H
64918 MIPS -12%
Gemiddeld Intel Core i9-12900H
  (34684 - 76677, n=28)
60849 MIPS -17%
Alienware m15 R5 Ryzen Edition
AMD Ryzen 7 5800H
53902 MIPS -27%
Lenovo Legion 5 15ACH6A-82NW0010GE
AMD Ryzen 5 5600H
44503 MIPS -39%
7-Zip 18.03 / 7z b 4 -mmt1
Gemiddelde van klas Gaming
  (4168 - 7581, n=191, laatste 2 jaar)
6280 MIPS +4%
MSI Pulse GL66 12UEK
Intel Core i9-12900H
6033 MIPS 0%
Asus ROG Strix Scar 15 G533zm
Intel Core i9-12900H
6028 MIPS
Asus ROG Strix Scar 15 G533ZW-LN106WS
Intel Core i9-12900H
5881 MIPS -2%
Gemiddeld Intel Core i9-12900H
  (5302 - 6289, n=28)
5843 MIPS -3%
Alienware m15 R5 Ryzen Edition
AMD Ryzen 7 5800H
5591 MIPS -7%
Asus TUF Gaming F15 FX507ZM
Intel Core i7-12700H
5381 MIPS -11%
Lenovo Legion 5 15ACH6A-82NW0010GE
AMD Ryzen 5 5600H
5330 MIPS -12%
Geekbench 5.5 / Multi-Core
Gemiddelde van klas Gaming
  (4557 - 23194, n=192, laatste 2 jaar)
14892 Points +12%
Asus ROG Strix Scar 15 G533ZW-LN106WS
Intel Core i9-12900H
14140 Points +6%
Asus ROG Strix Scar 15 G533zm
Intel Core i9-12900H
13319 Points
Asus TUF Gaming F15 FX507ZM
Intel Core i7-12700H
12358 Points -7%
Gemiddeld Intel Core i9-12900H
  (8519 - 14376, n=31)
11913 Points -11%
MSI Pulse GL66 12UEK
Intel Core i9-12900H
11794 Points -11%
Alienware m15 R5 Ryzen Edition
AMD Ryzen 7 5800H
7522 Points -44%
Lenovo Legion 5 15ACH6A-82NW0010GE
AMD Ryzen 5 5600H
6567 Points -51%
Geekbench 5.5 / Single-Core
Gemiddelde van klas Gaming
  (986 - 2210, n=192, laatste 2 jaar)
1882 Points +2%
Asus ROG Strix Scar 15 G533ZW-LN106WS
Intel Core i9-12900H
1849 Points 0%
MSI Pulse GL66 12UEK
Intel Core i9-12900H
1847 Points 0%
Asus ROG Strix Scar 15 G533zm
Intel Core i9-12900H
1843 Points
Gemiddeld Intel Core i9-12900H
  (1631 - 1897, n=31)
1800 Points -2%
Asus TUF Gaming F15 FX507ZM
Intel Core i7-12700H
1751 Points -5%
Alienware m15 R5 Ryzen Edition
AMD Ryzen 7 5800H
1481 Points -20%
Lenovo Legion 5 15ACH6A-82NW0010GE
AMD Ryzen 5 5600H
1414 Points -23%
HWBOT x265 Benchmark v2.2 / 4k Preset
Gemiddelde van klas Gaming
  (6.72 - 38.9, n=191, laatste 2 jaar)
23.3 fps +4%
Asus ROG Strix Scar 15 G533zm
Intel Core i9-12900H
22.5 fps
Asus ROG Strix Scar 15 G533ZW-LN106WS
Intel Core i9-12900H
21.1 fps -6%
Asus TUF Gaming F15 FX507ZM
Intel Core i7-12700H
20.5 fps -9%
MSI Pulse GL66 12UEK
Intel Core i9-12900H
19.3 fps -14%
Gemiddeld Intel Core i9-12900H
  (8.05 - 22.5, n=28)
17.1 fps -24%
Alienware m15 R5 Ryzen Edition
AMD Ryzen 7 5800H
14.7 fps -35%
Lenovo Legion 5 15ACH6A-82NW0010GE
AMD Ryzen 5 5600H
12.8 fps -43%
LibreOffice / 20 Documents To PDF
Alienware m15 R5 Ryzen Edition
AMD Ryzen 7 5800H
57.4 s * -44%
Lenovo Legion 5 15ACH6A-82NW0010GE
AMD Ryzen 5 5600H
55.1 s * -38%
Asus TUF Gaming F15 FX507ZM
Intel Core i7-12700H
49.9 s * -25%
Gemiddelde van klas Gaming
  (31.4 - 96.6, n=188, laatste 2 jaar)
47.6 s * -19%
Gemiddeld Intel Core i9-12900H
  (36.8 - 59.8, n=28)
42.4 s * -6%
MSI Pulse GL66 12UEK
Intel Core i9-12900H
41.3 s * -3%
Asus ROG Strix Scar 15 G533zm
Intel Core i9-12900H
40 s *
Asus ROG Strix Scar 15 G533ZW-LN106WS
Intel Core i9-12900H
39.7 s * +1%
R Benchmark 2.5 / Overall mean
Lenovo Legion 5 15ACH6A-82NW0010GE
AMD Ryzen 5 5600H
0.537 sec * -23%
Alienware m15 R5 Ryzen Edition
AMD Ryzen 7 5800H
0.524 sec * -20%
Asus TUF Gaming F15 FX507ZM
Intel Core i7-12700H
0.4655 sec * -6%
Gemiddeld Intel Core i9-12900H
  (0.4218 - 0.506, n=28)
0.454 sec * -4%
Gemiddelde van klas Gaming
  (0.3609 - 0.759, n=192, laatste 2 jaar)
0.4401 sec * -1%
Asus ROG Strix Scar 15 G533zm
Intel Core i9-12900H
0.4377 sec *
Asus ROG Strix Scar 15 G533ZW-LN106WS
Intel Core i9-12900H
0.4316 sec * +1%
MSI Pulse GL66 12UEK
Intel Core i9-12900H
0.424 sec * +3%

* ... kleiner is beter

Cinebench R15 CPU Multi 64Bit
3077 Points
Cinebench R15 OpenGL 64Bit
200 fps
Cinebench R15 Ref. Match 64Bit
99.6 %
Cinebench R15 CPU Single 64Bit
276 Points
Help
Performance Rating
Gemiddelde van klas Gaming
 
99.1 pt
Alienware m15 R5 Ryzen Edition
AMD Ryzen 7 5800H, GeForce RTX 3060 Laptop GPU
73 pt
Asus ROG Strix Scar 15 G533zm
Intel Core i9-12900H, GeForce RTX 3060 Laptop GPU
69.9 pt
Asus ROG Strix Scar 15 G533ZW-LN106WS
Intel Core i9-12900H, GeForce RTX 3070 Ti Laptop GPU
69.5 pt
Gemiddeld Intel Core i9-12900H
 
66.1 pt
MSI Pulse GL66 12UEK
Intel Core i9-12900H, GeForce RTX 3060 Laptop GPU
63.4 pt
Asus TUF Gaming F15 FX507ZM
Intel Core i7-12700H, GeForce RTX 3060 Laptop GPU
63.3 pt
Lenovo Legion 5 15ACH6A-82NW0010GE
AMD Ryzen 5 5600H, Radeon RX 6600M
61.7 pt
AIDA64 / FP32 Ray-Trace
Gemiddelde van klas Gaming
  (4986 - 60169, n=188, laatste 2 jaar)
21618 KRay/s +115%
Alienware m15 R5 Ryzen Edition
AMD Ryzen 7 5800H, GeForce RTX 3060 Laptop GPU
14245 KRay/s +41%
Lenovo Legion 5 15ACH6A-82NW0010GE
AMD Ryzen 5 5600H, Radeon RX 6600M
12360 KRay/s +23%
Gemiddeld Intel Core i9-12900H
  (4074 - 18289, n=28)
11191 KRay/s +11%
Asus ROG Strix Scar 15 G533zm
Intel Core i9-12900H, GeForce RTX 3060 Laptop GPU
10077 KRay/s
Asus ROG Strix Scar 15 G533ZW-LN106WS
Intel Core i9-12900H, GeForce RTX 3070 Ti Laptop GPU
9592 KRay/s -5%
Asus TUF Gaming F15 FX507ZM
Intel Core i7-12700H, GeForce RTX 3060 Laptop GPU
9486 KRay/s -6%
MSI Pulse GL66 12UEK
Intel Core i9-12900H, GeForce RTX 3060 Laptop GPU
8965 KRay/s -11%
AIDA64 / FPU Julia
Gemiddelde van klas Gaming
  (25360 - 252486, n=188, laatste 2 jaar)
105988 Points +142%
Alienware m15 R5 Ryzen Edition
AMD Ryzen 7 5800H, GeForce RTX 3060 Laptop GPU
88952 Points +103%
Lenovo Legion 5 15ACH6A-82NW0010GE
AMD Ryzen 5 5600H, Radeon RX 6600M
76011 Points +74%
Gemiddeld Intel Core i9-12900H
  (22307 - 93236, n=28)
55458 Points +27%
Asus ROG Strix Scar 15 G533zm
Intel Core i9-12900H, GeForce RTX 3060 Laptop GPU
43760 Points
Asus ROG Strix Scar 15 G533ZW-LN106WS
Intel Core i9-12900H, GeForce RTX 3070 Ti Laptop GPU
42697 Points -2%
Asus TUF Gaming F15 FX507ZM
Intel Core i7-12700H, GeForce RTX 3060 Laptop GPU
41434 Points -5%
MSI Pulse GL66 12UEK
Intel Core i9-12900H, GeForce RTX 3060 Laptop GPU
40863 Points -7%
AIDA64 / CPU SHA3
Gemiddelde van klas Gaming
  (1339 - 10389, n=188, laatste 2 jaar)
4848 MB/s +36%
Asus ROG Strix Scar 15 G533zm
Intel Core i9-12900H, GeForce RTX 3060 Laptop GPU
3570 MB/s
Asus ROG Strix Scar 15 G533ZW-LN106WS
Intel Core i9-12900H, GeForce RTX 3070 Ti Laptop GPU
3471 MB/s -3%
Asus TUF Gaming F15 FX507ZM
Intel Core i7-12700H, GeForce RTX 3060 Laptop GPU
3288 MB/s -8%
MSI Pulse GL66 12UEK
Intel Core i9-12900H, GeForce RTX 3060 Laptop GPU
3213 MB/s -10%
Alienware m15 R5 Ryzen Edition
AMD Ryzen 7 5800H, GeForce RTX 3060 Laptop GPU
3055 MB/s -14%
Gemiddeld Intel Core i9-12900H
  (1378 - 4215, n=28)
3048 MB/s -15%
Lenovo Legion 5 15ACH6A-82NW0010GE
AMD Ryzen 5 5600H, Radeon RX 6600M
2607 MB/s -27%
AIDA64 / CPU Queen
Gemiddelde van klas Gaming
  (50699 - 200651, n=188, laatste 2 jaar)
116174 Points +9%
Asus ROG Strix Scar 15 G533zm
Intel Core i9-12900H, GeForce RTX 3060 Laptop GPU
107003 Points
MSI Pulse GL66 12UEK
Intel Core i9-12900H, GeForce RTX 3060 Laptop GPU
105616 Points -1%
Asus ROG Strix Scar 15 G533ZW-LN106WS
Intel Core i9-12900H, GeForce RTX 3070 Ti Laptop GPU
104784 Points -2%
Gemiddeld Intel Core i9-12900H
  (78172 - 111241, n=28)
100462 Points -6%
Asus TUF Gaming F15 FX507ZM
Intel Core i7-12700H, GeForce RTX 3060 Laptop GPU
99267 Points -7%
Alienware m15 R5 Ryzen Edition
AMD Ryzen 7 5800H, GeForce RTX 3060 Laptop GPU
95789 Points -10%
Lenovo Legion 5 15ACH6A-82NW0010GE
AMD Ryzen 5 5600H, Radeon RX 6600M
76998 Points -28%
AIDA64 / FPU SinJulia
Gemiddelde van klas Gaming
  (4800 - 32988, n=188, laatste 2 jaar)
13167 Points +27%
Alienware m15 R5 Ryzen Edition
AMD Ryzen 7 5800H, GeForce RTX 3060 Laptop GPU
11665 Points +12%
Asus ROG Strix Scar 15 G533zm
Intel Core i9-12900H, GeForce RTX 3060 Laptop GPU
10383 Points
Asus ROG Strix Scar 15 G533ZW-LN106WS
Intel Core i9-12900H, GeForce RTX 3070 Ti Laptop GPU
10220 Points -2%
MSI Pulse GL66 12UEK
Intel Core i9-12900H, GeForce RTX 3060 Laptop GPU
9889 Points -5%
Asus TUF Gaming F15 FX507ZM
Intel Core i7-12700H, GeForce RTX 3060 Laptop GPU
9852 Points -5%
Gemiddeld Intel Core i9-12900H
  (5709 - 10410, n=28)
9016 Points -13%
Lenovo Legion 5 15ACH6A-82NW0010GE
AMD Ryzen 5 5600H, Radeon RX 6600M
8894 Points -14%
AIDA64 / FPU Mandel
Gemiddelde van klas Gaming
  (12321 - 134044, n=188, laatste 2 jaar)
53413 Points +87%
Alienware m15 R5 Ryzen Edition
AMD Ryzen 7 5800H, GeForce RTX 3060 Laptop GPU
45972 Points +61%
Lenovo Legion 5 15ACH6A-82NW0010GE
AMD Ryzen 5 5600H, Radeon RX 6600M
41691 Points +46%
Gemiddeld Intel Core i9-12900H
  (11257 - 45581, n=28)
28667 Points 0%
Asus ROG Strix Scar 15 G533zm
Intel Core i9-12900H, GeForce RTX 3060 Laptop GPU
28598 Points
Asus TUF Gaming F15 FX507ZM
Intel Core i7-12700H, GeForce RTX 3060 Laptop GPU
26379 Points -8%
Asus ROG Strix Scar 15 G533ZW-LN106WS
Intel Core i9-12900H, GeForce RTX 3070 Ti Laptop GPU
25718 Points -10%
MSI Pulse GL66 12UEK
Intel Core i9-12900H, GeForce RTX 3060 Laptop GPU
24991 Points -13%
AIDA64 / CPU AES
Alienware m15 R5 Ryzen Edition
AMD Ryzen 7 5800H, GeForce RTX 3060 Laptop GPU
119968 MB/s +12%
Gemiddelde van klas Gaming
  (19065 - 328679, n=188, laatste 2 jaar)
109484 MB/s +2%
Asus ROG Strix Scar 15 G533zm
Intel Core i9-12900H, GeForce RTX 3060 Laptop GPU
107508 MB/s
Asus ROG Strix Scar 15 G533ZW-LN106WS
Intel Core i9-12900H, GeForce RTX 3070 Ti Laptop GPU
104589 MB/s -3%
MSI Pulse GL66 12UEK
Intel Core i9-12900H, GeForce RTX 3060 Laptop GPU
97298 MB/s -9%
Lenovo Legion 5 15ACH6A-82NW0010GE
AMD Ryzen 5 5600H, Radeon RX 6600M
96790 MB/s -10%
Gemiddeld Intel Core i9-12900H
  (31935 - 151546, n=28)
85711 MB/s -20%
Asus TUF Gaming F15 FX507ZM
Intel Core i7-12700H, GeForce RTX 3060 Laptop GPU
66712 MB/s -38%
AIDA64 / CPU ZLib
Gemiddelde van klas Gaming
  (373 - 2409, n=188, laatste 2 jaar)
1348 MB/s +14%
Asus ROG Strix Scar 15 G533ZW-LN106WS
Intel Core i9-12900H, GeForce RTX 3070 Ti Laptop GPU
1188 MB/s 0%
Asus ROG Strix Scar 15 G533zm
Intel Core i9-12900H, GeForce RTX 3060 Laptop GPU
1183 MB/s
Asus TUF Gaming F15 FX507ZM
Intel Core i7-12700H, GeForce RTX 3060 Laptop GPU
1164 MB/s -2%
MSI Pulse GL66 12UEK
Intel Core i9-12900H, GeForce RTX 3060 Laptop GPU
1084 MB/s -8%
Gemiddeld Intel Core i9-12900H
  (449 - 1193, n=28)
932 MB/s -21%
Alienware m15 R5 Ryzen Edition
AMD Ryzen 7 5800H, GeForce RTX 3060 Laptop GPU
782 MB/s -34%
Lenovo Legion 5 15ACH6A-82NW0010GE
AMD Ryzen 5 5600H, Radeon RX 6600M
632 MB/s -47%
AIDA64 / FP64 Ray-Trace
Gemiddelde van klas Gaming
  (2540 - 31796, n=188, laatste 2 jaar)
11643 KRay/s +92%
Alienware m15 R5 Ryzen Edition
AMD Ryzen 7 5800H, GeForce RTX 3060 Laptop GPU
7532 KRay/s +24%
Lenovo Legion 5 15ACH6A-82NW0010GE
AMD Ryzen 5 5600H, Radeon RX 6600M
6652 KRay/s +10%
Gemiddeld Intel Core i9-12900H
  (2235 - 10511, n=28)
6205 KRay/s +2%
Asus ROG Strix Scar 15 G533zm
Intel Core i9-12900H, GeForce RTX 3060 Laptop GPU
6068 KRay/s
Asus ROG Strix Scar 15 G533ZW-LN106WS
Intel Core i9-12900H, GeForce RTX 3070 Ti Laptop GPU
5498 KRay/s -9%
Asus TUF Gaming F15 FX507ZM
Intel Core i7-12700H, GeForce RTX 3060 Laptop GPU
5486 KRay/s -10%
MSI Pulse GL66 12UEK
Intel Core i9-12900H, GeForce RTX 3060 Laptop GPU
5184 KRay/s -15%
AIDA64 / CPU PhotoWorxx
Gemiddelde van klas Gaming
  (10805 - 60161, n=189, laatste 2 jaar)
39933 MPixel/s +19%
Asus ROG Strix Scar 15 G533ZW-LN106WS
Intel Core i9-12900H, GeForce RTX 3070 Ti Laptop GPU
39856 MPixel/s +19%
Gemiddeld Intel Core i9-12900H
  (20960 - 48269, n=29)
36660 MPixel/s +9%
Asus ROG Strix Scar 15 G533zm
Intel Core i9-12900H, GeForce RTX 3060 Laptop GPU
33519 MPixel/s
Asus TUF Gaming F15 FX507ZM
Intel Core i7-12700H, GeForce RTX 3060 Laptop GPU
33509 MPixel/s 0%
MSI Pulse GL66 12UEK
Intel Core i9-12900H, GeForce RTX 3060 Laptop GPU
27374 MPixel/s -18%
Lenovo Legion 5 15ACH6A-82NW0010GE
AMD Ryzen 5 5600H, Radeon RX 6600M
15135 MPixel/s -55%
Alienware m15 R5 Ryzen Edition
AMD Ryzen 7 5800H, GeForce RTX 3060 Laptop GPU
14784 MPixel/s -56%

Systeemprestaties

De Asus Strix nam meestal de toppositie in PCMark 10 in en leverde iets betere prestaties dan wat dezelfde CPU/GPU-combinatie gemiddeld biedt, gebaseerd op onze database.

PCMark 10
PCMark 10
PCMark 10 / Score
Asus ROG Strix Scar 15 G533ZW-LN106WS
GeForce RTX 3070 Ti Laptop GPU, i9-12900H, Samsung PM9A1 MZVL22T0HBLB
7904 Points +1%
Asus ROG Strix Scar 15 G533zm
GeForce RTX 3060 Laptop GPU, i9-12900H
7861 Points
Gemiddelde van klas Gaming
  (5776 - 9852, n=169, laatste 2 jaar)
7771 Points -1%
Gemiddeld Intel Core i9-12900H, NVIDIA GeForce RTX 3060 Laptop GPU
  (7135 - 7861, n=4)
7518 Points -4%
Asus TUF Gaming F15 FX507ZM
GeForce RTX 3060 Laptop GPU, i7-12700H, SK Hynix HFM001TD3JX013N
7426 Points -6%
MSI Pulse GL66 12UEK
GeForce RTX 3060 Laptop GPU, i9-12900H, Micron 2450 512GB MTFDKBA512TFK
7135 Points -9%
Lenovo Legion 5 15ACH6A-82NW0010GE
Radeon RX 6600M, R5 5600H, Micron 2210 MTFDHBA512QFD
7091 Points -10%
Alienware m15 R5 Ryzen Edition
GeForce RTX 3060 Laptop GPU, R7 5800H, Toshiba KBG40ZNS512G NVMe
6465 Points -18%
PCMark 10 / Essentials
Asus ROG Strix Scar 15 G533zm
GeForce RTX 3060 Laptop GPU, i9-12900H
11198 Points
Gemiddeld Intel Core i9-12900H, NVIDIA GeForce RTX 3060 Laptop GPU
  (10380 - 11198, n=4)
10931 Points -2%
Gemiddelde van klas Gaming
  (9057 - 12334, n=168, laatste 2 jaar)
10833 Points -3%
Asus ROG Strix Scar 15 G533ZW-LN106WS
GeForce RTX 3070 Ti Laptop GPU, i9-12900H, Samsung PM9A1 MZVL22T0HBLB
10708 Points -4%
Lenovo Legion 5 15ACH6A-82NW0010GE
Radeon RX 6600M, R5 5600H, Micron 2210 MTFDHBA512QFD
10506 Points -6%
Asus TUF Gaming F15 FX507ZM
GeForce RTX 3060 Laptop GPU, i7-12700H, SK Hynix HFM001TD3JX013N
10499 Points -6%
MSI Pulse GL66 12UEK
GeForce RTX 3060 Laptop GPU, i9-12900H, Micron 2450 512GB MTFDKBA512TFK
10380 Points -7%
Alienware m15 R5 Ryzen Edition
GeForce RTX 3060 Laptop GPU, R7 5800H, Toshiba KBG40ZNS512G NVMe
9589 Points -14%
PCMark 10 / Productivity
Asus ROG Strix Scar 15 G533zm
GeForce RTX 3060 Laptop GPU, i9-12900H
10486 Points
Asus ROG Strix Scar 15 G533ZW-LN106WS
GeForce RTX 3070 Ti Laptop GPU, i9-12900H, Samsung PM9A1 MZVL22T0HBLB
10424 Points -1%
Gemiddeld Intel Core i9-12900H, NVIDIA GeForce RTX 3060 Laptop GPU
  (9751 - 10486, n=4)
10103 Points -4%
Gemiddelde van klas Gaming
  (6662 - 14612, n=168, laatste 2 jaar)
9878 Points -6%
MSI Pulse GL66 12UEK
GeForce RTX 3060 Laptop GPU, i9-12900H, Micron 2450 512GB MTFDKBA512TFK
9751 Points -7%
Lenovo Legion 5 15ACH6A-82NW0010GE
Radeon RX 6600M, R5 5600H, Micron 2210 MTFDHBA512QFD
9299 Points -11%
Asus TUF Gaming F15 FX507ZM
GeForce RTX 3060 Laptop GPU, i7-12700H, SK Hynix HFM001TD3JX013N
9070 Points -14%
Alienware m15 R5 Ryzen Edition
GeForce RTX 3060 Laptop GPU, R7 5800H, Toshiba KBG40ZNS512G NVMe
8913 Points -15%
PCMark 10 / Digital Content Creation
Gemiddelde van klas Gaming
  (6703 - 18475, n=168, laatste 2 jaar)
12018 Points +7%
Asus ROG Strix Scar 15 G533ZW-LN106WS
GeForce RTX 3070 Ti Laptop GPU, i9-12900H, Samsung PM9A1 MZVL22T0HBLB
12007 Points +7%
Asus TUF Gaming F15 FX507ZM
GeForce RTX 3060 Laptop GPU, i7-12700H, SK Hynix HFM001TD3JX013N
11672 Points +4%
Asus ROG Strix Scar 15 G533zm
GeForce RTX 3060 Laptop GPU, i9-12900H
11226 Points
Gemiddeld Intel Core i9-12900H, NVIDIA GeForce RTX 3060 Laptop GPU
  (9741 - 11226, n=4)
10445 Points -7%
Lenovo Legion 5 15ACH6A-82NW0010GE
Radeon RX 6600M, R5 5600H, Micron 2210 MTFDHBA512QFD
9907 Points -12%
MSI Pulse GL66 12UEK
GeForce RTX 3060 Laptop GPU, i9-12900H, Micron 2450 512GB MTFDKBA512TFK
9741 Points -13%
Alienware m15 R5 Ryzen Edition
GeForce RTX 3060 Laptop GPU, R7 5800H, Toshiba KBG40ZNS512G NVMe
8582 Points -24%
CrossMark / Overall
MSI Pulse GL66 12UEK
GeForce RTX 3060 Laptop GPU, i9-12900H, Micron 2450 512GB MTFDKBA512TFK
2096 Points +3%
Asus ROG Strix Scar 15 G533ZW-LN106WS
GeForce RTX 3070 Ti Laptop GPU, i9-12900H, Samsung PM9A1 MZVL22T0HBLB
2044 Points +1%
Asus ROG Strix Scar 15 G533zm
GeForce RTX 3060 Laptop GPU, i9-12900H
2026 Points
Gemiddeld Intel Core i9-12900H, NVIDIA GeForce RTX 3060 Laptop GPU
  (1789 - 2096, n=4)
1971 Points -3%
Gemiddelde van klas Gaming
  (1247 - 2344, n=152, laatste 2 jaar)
1900 Points -6%
CrossMark / Productivity
MSI Pulse GL66 12UEK
GeForce RTX 3060 Laptop GPU, i9-12900H, Micron 2450 512GB MTFDKBA512TFK
2062 Points +6%
Asus ROG Strix Scar 15 G533ZW-LN106WS
GeForce RTX 3070 Ti Laptop GPU, i9-12900H, Samsung PM9A1 MZVL22T0HBLB
1968 Points +1%
Asus ROG Strix Scar 15 G533zm
GeForce RTX 3060 Laptop GPU, i9-12900H
1951 Points
Gemiddeld Intel Core i9-12900H, NVIDIA GeForce RTX 3060 Laptop GPU
  (1677 - 2062, n=4)
1892 Points -3%
Gemiddelde van klas Gaming
  (1299 - 2204, n=152, laatste 2 jaar)
1802 Points -8%
CrossMark / Creativity
Asus ROG Strix Scar 15 G533zm
GeForce RTX 3060 Laptop GPU, i9-12900H
2125 Points
Asus ROG Strix Scar 15 G533ZW-LN106WS
GeForce RTX 3070 Ti Laptop GPU, i9-12900H, Samsung PM9A1 MZVL22T0HBLB
2115 Points 0%
Gemiddeld Intel Core i9-12900H, NVIDIA GeForce RTX 3060 Laptop GPU
  (2032 - 2125, n=4)
2088 Points -2%
MSI Pulse GL66 12UEK
GeForce RTX 3060 Laptop GPU, i9-12900H, Micron 2450 512GB MTFDKBA512TFK
2086 Points -2%
Gemiddelde van klas Gaming
  (1275 - 2660, n=152, laatste 2 jaar)
2084 Points -2%
CrossMark / Responsiveness
MSI Pulse GL66 12UEK
GeForce RTX 3060 Laptop GPU, i9-12900H, Micron 2450 512GB MTFDKBA512TFK
2230 Points +14%
Asus ROG Strix Scar 15 G533ZW-LN106WS
GeForce RTX 3070 Ti Laptop GPU, i9-12900H, Samsung PM9A1 MZVL22T0HBLB
2069 Points +5%
Asus ROG Strix Scar 15 G533zm
GeForce RTX 3060 Laptop GPU, i9-12900H
1964 Points
Gemiddeld Intel Core i9-12900H, NVIDIA GeForce RTX 3060 Laptop GPU
  (1486 - 2230, n=4)
1887 Points -4%
Gemiddelde van klas Gaming
  (1030 - 2330, n=152, laatste 2 jaar)
1700 Points -13%
PCMark 10 Score
7861 punten
Help
AIDA64 / Memory Copy
Gemiddelde van klas Gaming
  (21842 - 94222, n=188, laatste 2 jaar)
64901 MB/s +28%
Asus ROG Strix Scar 15 G533ZW-LN106WS
Intel Core i9-12900H, GeForce RTX 3070 Ti Laptop GPU
61561 MB/s +21%
Gemiddeld Intel Core i9-12900H
  (34438 - 74264, n=28)
58945 MB/s +16%
Asus TUF Gaming F15 FX507ZM
Intel Core i7-12700H, GeForce RTX 3060 Laptop GPU
53661 MB/s +6%
Asus ROG Strix Scar 15 G533zm
Intel Core i9-12900H, GeForce RTX 3060 Laptop GPU
50769 MB/s
MSI Pulse GL66 12UEK
Intel Core i9-12900H, GeForce RTX 3060 Laptop GPU
45624 MB/s -10%
Alienware m15 R5 Ryzen Edition
AMD Ryzen 7 5800H, GeForce RTX 3060 Laptop GPU
37687 MB/s -26%
Lenovo Legion 5 15ACH6A-82NW0010GE
AMD Ryzen 5 5600H, Radeon RX 6600M
37007 MB/s -27%
AIDA64 / Memory Read
Gemiddelde van klas Gaming
  (23681 - 99713, n=188, laatste 2 jaar)
68661 MB/s +21%
Asus ROG Strix Scar 15 G533ZW-LN106WS
Intel Core i9-12900H, GeForce RTX 3070 Ti Laptop GPU
65018 MB/s +14%
Gemiddeld Intel Core i9-12900H
  (36365 - 74642, n=28)
61718 MB/s +8%
Asus TUF Gaming F15 FX507ZM
Intel Core i7-12700H, GeForce RTX 3060 Laptop GPU
59205 MB/s +4%
Asus ROG Strix Scar 15 G533zm
Intel Core i9-12900H, GeForce RTX 3060 Laptop GPU
56905 MB/s
MSI Pulse GL66 12UEK
Intel Core i9-12900H, GeForce RTX 3060 Laptop GPU
48866 MB/s -14%
Alienware m15 R5 Ryzen Edition
AMD Ryzen 7 5800H, GeForce RTX 3060 Laptop GPU
44146 MB/s -22%
Lenovo Legion 5 15ACH6A-82NW0010GE
AMD Ryzen 5 5600H, Radeon RX 6600M
42375 MB/s -26%
AIDA64 / Memory Write
Gemiddelde van klas Gaming
  (22986 - 108954, n=188, laatste 2 jaar)
66722 MB/s +13%
Asus ROG Strix Scar 15 G533ZW-LN106WS
Intel Core i9-12900H, GeForce RTX 3070 Ti Laptop GPU
64873 MB/s +10%
Gemiddeld Intel Core i9-12900H
  (32276 - 67858, n=28)
59318 MB/s +1%
Asus ROG Strix Scar 15 G533zm
Intel Core i9-12900H, GeForce RTX 3060 Laptop GPU
58908 MB/s
Asus TUF Gaming F15 FX507ZM
Intel Core i7-12700H, GeForce RTX 3060 Laptop GPU
58758 MB/s 0%
MSI Pulse GL66 12UEK
Intel Core i9-12900H, GeForce RTX 3060 Laptop GPU
47016 MB/s -20%
Alienware m15 R5 Ryzen Edition
AMD Ryzen 7 5800H, GeForce RTX 3060 Laptop GPU
35891 MB/s -39%
Lenovo Legion 5 15ACH6A-82NW0010GE
AMD Ryzen 5 5600H, Radeon RX 6600M
30785 MB/s -48%
AIDA64 / Memory Latency
Asus ROG Strix Scar 15 G533zm
Intel Core i9-12900H, GeForce RTX 3060 Laptop GPU
98.3 ns *
Asus ROG Strix Scar 15 G533ZW-LN106WS
Intel Core i9-12900H, GeForce RTX 3070 Ti Laptop GPU
97.6 ns * +1%
Gemiddelde van klas Gaming
  (59.5 - 259, n=188, laatste 2 jaar)
94.1 ns * +4%
MSI Pulse GL66 12UEK
Intel Core i9-12900H, GeForce RTX 3060 Laptop GPU
91.9 ns * +7%
Lenovo Legion 5 15ACH6A-82NW0010GE
AMD Ryzen 5 5600H, Radeon RX 6600M
87.9 ns * +11%
Gemiddeld Intel Core i9-12900H
  (74.7 - 118.1, n=27)
85.7 ns * +13%
Alienware m15 R5 Ryzen Edition
AMD Ryzen 7 5800H, GeForce RTX 3060 Laptop GPU
78.2 ns * +20%
Asus TUF Gaming F15 FX507ZM
Intel Core i7-12700H, GeForce RTX 3060 Laptop GPU
0 ns * +100%

* ... kleiner is beter

DPC latentie

LatencyMon meldde onmiddellijk problemen zodra een browser werd gestart. Het openen van meerdere tabbladen verergerde de problemen. De latentiewaarden namen verder toe tijdens het afspelen van onze YouTube-testvideo met 4K en 60 fps. De video liep echter zonder dropped frames.

DPC Latencies / LatencyMon - interrupt to process latency (max), Web, Youtube, Prime95
Asus ROG Strix Scar 15 G533zm
GeForce RTX 3060 Laptop GPU, i9-12900H
1005.8 μs *
MSI Pulse GL66 12UEK
GeForce RTX 3060 Laptop GPU, i9-12900H, Micron 2450 512GB MTFDKBA512TFK
911 μs * +9%
Asus ROG Strix Scar 15 G533ZW-LN106WS
GeForce RTX 3070 Ti Laptop GPU, i9-12900H, Samsung PM9A1 MZVL22T0HBLB
892.1 μs * +11%
Lenovo Legion 5 15ACH6A-82NW0010GE
Radeon RX 6600M, R5 5600H, Micron 2210 MTFDHBA512QFD
833 μs * +17%
Asus TUF Gaming F15 FX507ZM
GeForce RTX 3060 Laptop GPU, i7-12700H, SK Hynix HFM001TD3JX013N
719 μs * +29%
Alienware m15 R5 Ryzen Edition
GeForce RTX 3060 Laptop GPU, R7 5800H, Toshiba KBG40ZNS512G NVMe
428.6 μs * +57%

* ... kleiner is beter

Massa-opslag

De Micron SSD
De Micron SSD

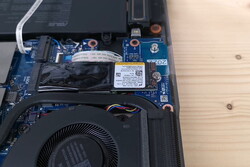
Asus heeft een vrij nieuwe 1TB PCIe 4.0 NVMe SSD van Micron ingebouwd. Hoewel de schijf uitstekende overdrachtsnelheden biedt, werden de snelheden van de relatief nieuwe standaard niet volledig benut. Dat gezegd hebbende, leverde de schijf meestal de beste prestaties in vergelijking met de opslagschijven in concurrerende laptops. De prestaties zijn ook uitstekend bij langdurige belasting.

CDM 5/6 Read Seq Q32T1: 6489.8 MB/s
CDM 5/6 Write Seq Q32T1: 4988 MB/s
CDM 5/6 Read 4K Q32T1: 818.11 MB/s
CDM 5/6 Write 4K Q32T1: 760.89 MB/s
CDM 5/6 Read 4K: 71.35 MB/s
CDM 5/6 Write 4K: 271.37 MB/s
CDM 6 Write 4K Q8T8: 2509.59 MB/s
CDM 6 Read 4K Q8T8: 2298.39 MB/s
Drive Performance Rating - Percent
Asus ROG Strix Scar 15 G533ZW-LN106WS
Samsung PM9A1 MZVL22T0HBLB
93.5 pt
Asus ROG Strix Scar 15 G533zm
 
80.7 pt
Gemiddelde van klas Gaming
 
77.5 pt
MSI Pulse GL66 12UEK
Micron 2450 512GB MTFDKBA512TFK
67.8 pt
Asus TUF Gaming F15 FX507ZM
SK Hynix HFM001TD3JX013N
65.6 pt
Lenovo Legion 5 15ACH6A-82NW0010GE
Micron 2210 MTFDHBA512QFD
40.3 pt
Alienware m15 R5 Ryzen Edition
Toshiba KBG40ZNS512G NVMe
38 pt
Global Average -3
 
36.7 pt
DiskSpd
seq read
Gemiddelde van klas Gaming
  (1319 - 7045, n=169, laatste 2 jaar)
3500 MB/s +5%
Asus ROG Strix Scar 15 G533zm
 
3321 (3197.01min - 3321.47max) MB/s
Asus ROG Strix Scar 15 G533ZW-LN106WS
Samsung PM9A1 MZVL22T0HBLB
2397 (2152.62min - 2396.66max) MB/s -28%
Asus TUF Gaming F15 FX507ZM
SK Hynix HFM001TD3JX013N
2383 (2361.29min - 2382.94max) MB/s -28%
Global Average -3
  (38.2 - 7045, n=1697)
2337 MB/s -30%
MSI Pulse GL66 12UEK
Micron 2450 512GB MTFDKBA512TFK
2038 (1650.93min - 2038.34max) MB/s -39%
Lenovo Legion 5 15ACH6A-82NW0010GE
Micron 2210 MTFDHBA512QFD
1935 (1931.9min - 1934.83max) MB/s -42%
Alienware m15 R5 Ryzen Edition
Toshiba KBG40ZNS512G NVMe
1726 (1693.24min - 1725.96max) MB/s -48%
seq write
Asus ROG Strix Scar 15 G533zm
 
4889 (4577.32min - 4888.96max) MB/s
Asus ROG Strix Scar 15 G533ZW-LN106WS
Samsung PM9A1 MZVL22T0HBLB
4488 (4442.32min - 4488.16max) MB/s -8%
Gemiddelde van klas Gaming
  (535 - 9307, n=169, laatste 2 jaar)
3819 MB/s -22%
MSI Pulse GL66 12UEK
Micron 2450 512GB MTFDKBA512TFK
3275 (3243.25min - 3275.12max) MB/s -33%
Asus TUF Gaming F15 FX507ZM
SK Hynix HFM001TD3JX013N
2894 (2651.7min - 2893.78max) MB/s -41%
Global Average -3
  (38.2 - 9307, n=1697)
2372 MB/s -51%
Alienware m15 R5 Ryzen Edition
Toshiba KBG40ZNS512G NVMe
1520 (983.77min - 1519.6max) MB/s -69%
Lenovo Legion 5 15ACH6A-82NW0010GE
Micron 2210 MTFDHBA512QFD
1146 (903.24min - 1146.3max) MB/s -77%
seq q8 t1 read
Asus ROG Strix Scar 15 G533ZW-LN106WS
Samsung PM9A1 MZVL22T0HBLB
7006 (6563.67min - 7005.79max) MB/s +10%
Asus ROG Strix Scar 15 G533zm
 
6379 (5807.98min - 6378.73max) MB/s
Gemiddelde van klas Gaming
  (2594 - 16089, n=169, laatste 2 jaar)
6365 MB/s 0%
Global Average -3
  (38.5 - 16089, n=1697)
3930 MB/s -38%
MSI Pulse GL66 12UEK
Micron 2450 512GB MTFDKBA512TFK
3613 (3227.14min - 3613.09max) MB/s -43%
Asus TUF Gaming F15 FX507ZM
SK Hynix HFM001TD3JX013N
3554 (3284.35min - 3554.02max) MB/s -44%
Alienware m15 R5 Ryzen Edition
Toshiba KBG40ZNS512G NVMe
2314 (1882.82min - 2314max) MB/s -64%
Lenovo Legion 5 15ACH6A-82NW0010GE
Micron 2210 MTFDHBA512QFD
2213 (2018.77min - 2212.5max) MB/s -65%
seq q8 t1 write
Asus ROG Strix Scar 15 G533ZW-LN106WS
Samsung PM9A1 MZVL22T0HBLB
5263 (5104.74min - 5263.39max) MB/s +5%
Asus ROG Strix Scar 15 G533zm
 
4992 (4753.75min - 4992.35max) MB/s
Gemiddelde van klas Gaming
  (539 - 14571, n=169, laatste 2 jaar)
4855 MB/s -3%
MSI Pulse GL66 12UEK
Micron 2450 512GB MTFDKBA512TFK
3351 (3295.17min - 3351.25max) MB/s -33%
Global Average -3
  (38.2 - 14571, n=1697)
2962 MB/s -41%
Asus TUF Gaming F15 FX507ZM
SK Hynix HFM001TD3JX013N
2869 (2667.88min - 2869.19max) MB/s -43%
Alienware m15 R5 Ryzen Edition
Toshiba KBG40ZNS512G NVMe
1449 (1364.2min - 1448.71max) MB/s -71%
Lenovo Legion 5 15ACH6A-82NW0010GE
Micron 2210 MTFDHBA512QFD
1145 (65.64min - 1144.64max) MB/s -77%
4k q1 t1 read
Asus ROG Strix Scar 15 G533ZW-LN106WS
Samsung PM9A1 MZVL22T0HBLB
86.8 (82.52min - 86.79max) MB/s +30%
MSI Pulse GL66 12UEK
Micron 2450 512GB MTFDKBA512TFK
71.5 (69.67min - 71.5max) MB/s +7%
Asus TUF Gaming F15 FX507ZM
SK Hynix HFM001TD3JX013N
69.4 (68.09min - 69.4max) MB/s +4%
Asus ROG Strix Scar 15 G533zm
 
66.7 (65.36min - 66.73max) MB/s
Gemiddelde van klas Gaming
  (30.6 - 95.9, n=169, laatste 2 jaar)
65.9 MB/s -1%
Lenovo Legion 5 15ACH6A-82NW0010GE
Micron 2210 MTFDHBA512QFD
60.5 (60.38min - 60.5max) MB/s -9%
Global Average -3
  (0.67 - 361, n=1697)
58.2 MB/s -13%
Alienware m15 R5 Ryzen Edition
Toshiba KBG40ZNS512G NVMe
48.3 (47.05min - 48.34max) MB/s -28%
4k q1 t1 write
MSI Pulse GL66 12UEK
Micron 2450 512GB MTFDKBA512TFK
421 (225.22min - 421.18max) MB/s +61%
Asus ROG Strix Scar 15 G533ZW-LN106WS
Samsung PM9A1 MZVL22T0HBLB
294 (279.47min - 294.26max) MB/s +12%
Asus ROG Strix Scar 15 G533zm
 
262 (260.4min - 261.85max) MB/s
Gemiddelde van klas Gaming
  (66.6 - 397, n=169, laatste 2 jaar)
222 MB/s -15%
Asus TUF Gaming F15 FX507ZM
SK Hynix HFM001TD3JX013N
211 (210.13min - 210.73max) MB/s -19%
Global Average -3
  (1.23 - 435, n=1696)
165.5 MB/s -37%
Lenovo Legion 5 15ACH6A-82NW0010GE
Micron 2210 MTFDHBA512QFD
153 (151.1min - 152.72max) MB/s -42%
Alienware m15 R5 Ryzen Edition
Toshiba KBG40ZNS512G NVMe
121 (117.79min - 121.25max) MB/s -54%
4k q32 t16 read
Asus ROG Strix Scar 15 G533ZW-LN106WS
Samsung PM9A1 MZVL22T0HBLB
3975 (3854.22min - 3974.57max) MB/s +40%
Asus ROG Strix Scar 15 G533zm
 
2835 (2764.71min - 2834.6max) MB/s
Gemiddelde van klas Gaming
  (417 - 6172, n=169, laatste 2 jaar)
2553 MB/s -10%
Asus TUF Gaming F15 FX507ZM
SK Hynix HFM001TD3JX013N
2217 (2210.73min - 2217.07max) MB/s -22%
MSI Pulse GL66 12UEK
Micron 2450 512GB MTFDKBA512TFK
1550 (1546.75min - 1549.91max) MB/s -45%
Global Average -3
  (1.03 - 6172, n=1696)
1405 MB/s -50%
Alienware m15 R5 Ryzen Edition
Toshiba KBG40ZNS512G NVMe
1301 (981.55min - 1301max) MB/s -54%
Lenovo Legion 5 15ACH6A-82NW0010GE
Micron 2210 MTFDHBA512QFD
646 (644.91min - 645.74max) MB/s -77%
4k q32 t16 write
Asus ROG Strix Scar 15 G533ZW-LN106WS
Samsung PM9A1 MZVL22T0HBLB
3509 (3396.26min - 3509.01max) MB/s +29%
MSI Pulse GL66 12UEK
Micron 2450 512GB MTFDKBA512TFK
3249 (265.37min - 3249.37max) MB/s +20%
Asus ROG Strix Scar 15 G533zm
 
2717 (2628.09min - 2717.29max) MB/s
Asus TUF Gaming F15 FX507ZM
SK Hynix HFM001TD3JX013N
2314 (2299.73min - 2313.93max) MB/s -15%
Gemiddelde van klas Gaming
  (162.3 - 4869, n=169, laatste 2 jaar)
2101 MB/s -23%
Global Average -3
  (1.5 - 5015, n=1696)
1207 MB/s -56%
Lenovo Legion 5 15ACH6A-82NW0010GE
Micron 2210 MTFDHBA512QFD
1061 (62.92min - 1061.17max) MB/s -61%
Alienware m15 R5 Ryzen Edition
Toshiba KBG40ZNS512G NVMe
497 (490.94min - 497.29max) MB/s -82%
AS SSD
Score Total
Asus ROG Strix Scar 15 G533ZW-LN106WS
Samsung PM9A1 MZVL22T0HBLB
9031 Points +28%
Asus ROG Strix Scar 15 G533zm
 
7076 Points
Gemiddelde van klas Gaming
  (2271 - 13854, n=160, laatste 2 jaar)
6742 Points -5%
Asus TUF Gaming F15 FX507ZM
SK Hynix HFM001TD3JX013N
6117 Points -14%
MSI Pulse GL66 12UEK
Micron 2450 512GB MTFDKBA512TFK
4693 Points -34%
Alienware m15 R5 Ryzen Edition
Toshiba KBG40ZNS512G NVMe
3136 Points -56%
Global Average -3
  (19 - 13854, n=3367)
2860 Points -60%
Lenovo Legion 5 15ACH6A-82NW0010GE
Micron 2210 MTFDHBA512QFD
2499 Points -65%
Score Read
Asus ROG Strix Scar 15 G533ZW-LN106WS
Samsung PM9A1 MZVL22T0HBLB
3378 Points +21%
Asus ROG Strix Scar 15 G533zm
 
2784 Points
Gemiddelde van klas Gaming
  (776 - 4721, n=160, laatste 2 jaar)
2445 Points -12%
Asus TUF Gaming F15 FX507ZM
SK Hynix HFM001TD3JX013N
2291 Points -18%
MSI Pulse GL66 12UEK
Micron 2450 512GB MTFDKBA512TFK
1878 Points -33%
Alienware m15 R5 Ryzen Edition
Toshiba KBG40ZNS512G NVMe
1506 Points -46%
Global Average -3
  (6 - 4721, n=3368)
1101 Points -60%
Lenovo Legion 5 15ACH6A-82NW0010GE
Micron 2210 MTFDHBA512QFD
841 Points -70%
Score Write
Asus ROG Strix Scar 15 G533ZW-LN106WS
Samsung PM9A1 MZVL22T0HBLB
3999 Points +35%
Gemiddelde van klas Gaming
  (515 - 7208, n=160, laatste 2 jaar)
3113 Points +5%
Asus ROG Strix Scar 15 G533zm
 
2969 Points
Asus TUF Gaming F15 FX507ZM
SK Hynix HFM001TD3JX013N
2660 Points -10%
MSI Pulse GL66 12UEK
Micron 2450 512GB MTFDKBA512TFK
1837 Points -38%
Lenovo Legion 5 15ACH6A-82NW0010GE
Micron 2210 MTFDHBA512QFD
1251 Points -58%
Global Average -3
  (4 - 7208, n=3368)
1226 Points -59%
Alienware m15 R5 Ryzen Edition
Toshiba KBG40ZNS512G NVMe
918 Points -69%
Seq Read
Asus ROG Strix Scar 15 G533ZW-LN106WS
Samsung PM9A1 MZVL22T0HBLB
5563.48 MB/s +21%
Gemiddelde van klas Gaming
  (2260 - 12763, n=160, laatste 2 jaar)
4976 MB/s +8%
Asus ROG Strix Scar 15 G533zm
 
4599 MB/s
MSI Pulse GL66 12UEK
Micron 2450 512GB MTFDKBA512TFK
3127 MB/s -32%
Asus TUF Gaming F15 FX507ZM
SK Hynix HFM001TD3JX013N
3013 MB/s -34%
Alienware m15 R5 Ryzen Edition
Toshiba KBG40ZNS512G NVMe
2082 MB/s -55%
Lenovo Legion 5 15ACH6A-82NW0010GE
Micron 2210 MTFDHBA512QFD
1948 MB/s -58%
Global Average -3
  (226 - 12763, n=3584)
1939 MB/s -58%
Seq Write
Asus ROG Strix Scar 15 G533ZW-LN106WS
Samsung PM9A1 MZVL22T0HBLB
4045.87 MB/s +57%
Gemiddelde van klas Gaming
  (495 - 11316, n=160, laatste 2 jaar)
3750 MB/s +46%
MSI Pulse GL66 12UEK
Micron 2450 512GB MTFDKBA512TFK
2977 MB/s +16%
Asus TUF Gaming F15 FX507ZM
SK Hynix HFM001TD3JX013N
2768 MB/s +8%
Asus ROG Strix Scar 15 G533zm
 
2570 MB/s
Global Average -3
  (52.2 - 11316, n=3587)
1304 MB/s -49%
Lenovo Legion 5 15ACH6A-82NW0010GE
Micron 2210 MTFDHBA512QFD
1094 MB/s -57%
Alienware m15 R5 Ryzen Edition
Toshiba KBG40ZNS512G NVMe
825 MB/s -68%
4K Read
MSI Pulse GL66 12UEK
Micron 2450 512GB MTFDKBA512TFK
95.9 MB/s +46%
Asus ROG Strix Scar 15 G533ZW-LN106WS
Samsung PM9A1 MZVL22T0HBLB
81.3 MB/s +24%
Asus TUF Gaming F15 FX507ZM
SK Hynix HFM001TD3JX013N
66.9 MB/s +2%
Asus ROG Strix Scar 15 G533zm
 
65.68 MB/s
Gemiddelde van klas Gaming
  (27.8 - 112.1, n=160, laatste 2 jaar)
65.1 MB/s -1%
Lenovo Legion 5 15ACH6A-82NW0010GE
Micron 2210 MTFDHBA512QFD
60.58 MB/s -8%
Alienware m15 R5 Ryzen Edition
Toshiba KBG40ZNS512G NVMe
42.41 MB/s -35%
Global Average -3
  (6.08 - 314, n=3577)
41.9 MB/s -36%
4K Write
MSI Pulse GL66 12UEK
Micron 2450 512GB MTFDKBA512TFK
363.5 MB/s +50%
Asus ROG Strix Scar 15 G533ZW-LN106WS
Samsung PM9A1 MZVL22T0HBLB
248.96 MB/s +3%
Asus ROG Strix Scar 15 G533zm
 
242.84 MB/s
Gemiddelde van klas Gaming
  (108.8 - 512, n=160, laatste 2 jaar)
211 MB/s -13%
Asus TUF Gaming F15 FX507ZM
SK Hynix HFM001TD3JX013N
184.8 MB/s -24%
Lenovo Legion 5 15ACH6A-82NW0010GE
Micron 2210 MTFDHBA512QFD
145.7 MB/s -40%
Global Average -3
  (13.3 - 512, n=3577)
111.8 MB/s -54%
Alienware m15 R5 Ryzen Edition
Toshiba KBG40ZNS512G NVMe
98.3 MB/s -60%
4K-64 Read
Asus ROG Strix Scar 15 G533ZW-LN106WS
Samsung PM9A1 MZVL22T0HBLB
2740.24 MB/s +21%
Asus ROG Strix Scar 15 G533zm
 
2257.92 MB/s
Asus TUF Gaming F15 FX507ZM
SK Hynix HFM001TD3JX013N
1923 MB/s -15%
Gemiddelde van klas Gaming
  (451 - 3475, n=160, laatste 2 jaar)
1876 MB/s -17%
MSI Pulse GL66 12UEK
Micron 2450 512GB MTFDKBA512TFK
1469 MB/s -35%
Alienware m15 R5 Ryzen Edition
Toshiba KBG40ZNS512G NVMe
1255 MB/s -44%
Global Average -3
  (13.1 - 3589, n=3576)
812 MB/s -64%
Lenovo Legion 5 15ACH6A-82NW0010GE
Micron 2210 MTFDHBA512QFD
585.23 MB/s -74%
4K-64 Write
Asus ROG Strix Scar 15 G533ZW-LN106WS
Samsung PM9A1 MZVL22T0HBLB
3345.62 MB/s +35%
Gemiddelde van klas Gaming
  (277 - 5909, n=160, laatste 2 jaar)
2529 MB/s +2%
Asus ROG Strix Scar 15 G533zm
 
2469.12 MB/s
Asus TUF Gaming F15 FX507ZM
SK Hynix HFM001TD3JX013N
2198 MB/s -11%
MSI Pulse GL66 12UEK
Micron 2450 512GB MTFDKBA512TFK
1175 MB/s -52%
Lenovo Legion 5 15ACH6A-82NW0010GE
Micron 2210 MTFDHBA512QFD
995.52 MB/s -60%
Global Average -3
  (13.7 - 5909, n=3574)
922 MB/s -63%
Alienware m15 R5 Ryzen Edition
Toshiba KBG40ZNS512G NVMe
738 MB/s -70%
Access Time Read
Global Average -3
  (0.012 - 33, n=3508)
0.631 ms * -2643%
Alienware m15 R5 Ryzen Edition
Toshiba KBG40ZNS512G NVMe
0.109 ms * -374%
Lenovo Legion 5 15ACH6A-82NW0010GE
Micron 2210 MTFDHBA512QFD
0.077 ms * -235%
Gemiddelde van klas Gaming
  (0.016 - 0.379, n=159, laatste 2 jaar)
0.05489 ms * -139%
MSI Pulse GL66 12UEK
Micron 2450 512GB MTFDKBA512TFK
0.051 ms * -122%
Asus TUF Gaming F15 FX507ZM
SK Hynix HFM001TD3JX013N
0.03 ms * -30%
Asus ROG Strix Scar 15 G533zm
 
0.023 ms *
Asus ROG Strix Scar 15 G533ZW-LN106WS
Samsung PM9A1 MZVL22T0HBLB
0.022 ms * +4%
Access Time Write
Global Average -3
  (0.011 - 60.7, n=3550)
0.539 ms * -2737%
Alienware m15 R5 Ryzen Edition
Toshiba KBG40ZNS512G NVMe
0.17 ms * -795%
MSI Pulse GL66 12UEK
Micron 2450 512GB MTFDKBA512TFK
0.167 ms * -779%
Asus TUF Gaming F15 FX507ZM
SK Hynix HFM001TD3JX013N
0.081 ms * -326%
Gemiddelde van klas Gaming
  (0.011 - 1.028, n=160, laatste 2 jaar)
0.04827 ms * -154%
Lenovo Legion 5 15ACH6A-82NW0010GE
Micron 2210 MTFDHBA512QFD
0.039 ms * -105%
Asus ROG Strix Scar 15 G533zm
 
0.019 ms *
Asus ROG Strix Scar 15 G533ZW-LN106WS
Samsung PM9A1 MZVL22T0HBLB
0.017 ms * +11%

* ... kleiner is beter

Sustained load Read: DiskSpd Read Loop, Queue Depth 8

02605207801040130015601820208023402600286031203380364039004160442046804940Tooltip
Asus ROG Strix Scar 15 G533zm: Ø5140 (3821.01-5186.89)

Grafische kaart

De Nividia GeForce RTX 3060 neemt de ruimte in tussen het middensegment en het topsegment. Zijn TGP kan variëren van 60 tot 115 watt, en de stroomconfiguratie heeft een blijvende invloed op de 3D-prestaties van de kaart. De RTX 3060 in de Strix Scar heeft toegang tot de volle 115 watt en kan tot 140 watt gaan met een Dynamic Boost van 25 watt.

In synthetische 3D benchmarks presteert de GPU iets beter dan een gemiddelde RTX 3060 uit onze database, maar de Lenovo Legion 5 en de Asus TUF Gaming F15 zijn marginaal sneller dan de Strix Scar. De RTX 3070 Ti in de Scar 15 G533zw is ongeveer 35% krachtiger.

Op batterijvoeding kelderden de 3D-prestaties van de laptop met ongeveer 67% in een nieuwe Fire Strike testrun, wat resulteerde in een grafische score van slechts 7.168 in plaats van de gebruikelijke 21.671.

Time Spy
Time Spy
Fire Strike
Fire Strike
3DMark Performance Rating - Percent
Gemiddelde van klas Gaming
 
100 pt
Asus ROG Strix Scar 15 G533ZW-LN106WS
NVIDIA GeForce RTX 3070 Ti Laptop GPU, Intel Core i9-12900H
90.3 pt
Lenovo Legion 5 15ACH6A-82NW0010GE
AMD Radeon RX 6600M, AMD Ryzen 5 5600H
71.8 pt
Asus TUF Gaming F15 FX507ZM
NVIDIA GeForce RTX 3060 Laptop GPU, Intel Core i7-12700H
71.5 pt
Asus ROG Strix Scar 15 G533zm
NVIDIA GeForce RTX 3060 Laptop GPU, Intel Core i9-12900H
66.2 pt
Alienware m15 R5 Ryzen Edition
NVIDIA GeForce RTX 3060 Laptop GPU, AMD Ryzen 7 5800H
63.5 pt
Gemiddeld NVIDIA GeForce RTX 3060 Laptop GPU
 
62.9 pt
MSI Pulse GL66 12UEK
NVIDIA GeForce RTX 3060 Laptop GPU, Intel Core i9-12900H
52.1 pt
3DMark 11 - 1280x720 Performance GPU
Gemiddelde van klas Gaming
  (1029 - 72178, n=187, laatste 2 jaar)
43524 Points +51%
Asus ROG Strix Scar 15 G533ZW-LN106WS
NVIDIA GeForce RTX 3070 Ti Laptop GPU, Intel Core i9-12900H
39673 Points +38%
Lenovo Legion 5 15ACH6A-82NW0010GE
AMD Radeon RX 6600M, AMD Ryzen 5 5600H
31702 Points +10%
Asus TUF Gaming F15 FX507ZM
NVIDIA GeForce RTX 3060 Laptop GPU, Intel Core i7-12700H
30772 Points +7%
Asus ROG Strix Scar 15 G533zm
NVIDIA GeForce RTX 3060 Laptop GPU, Intel Core i9-12900H
28848 Points
Alienware m15 R5 Ryzen Edition
NVIDIA GeForce RTX 3060 Laptop GPU, AMD Ryzen 7 5800H
26881 Points -7%
Gemiddeld NVIDIA GeForce RTX 3060 Laptop GPU
  (13799 - 30772, n=43)
26816 Points -7%
MSI Pulse GL66 12UEK
NVIDIA GeForce RTX 3060 Laptop GPU, Intel Core i9-12900H
13799 Points -52%
3DMark
1920x1080 Fire Strike Graphics
Gemiddelde van klas Gaming
  (781 - 53059, n=197, laatste 2 jaar)
31252 Points +44%
Asus ROG Strix Scar 15 G533ZW-LN106WS
NVIDIA GeForce RTX 3070 Ti Laptop GPU, Intel Core i9-12900H
29292 Points +35%
Lenovo Legion 5 15ACH6A-82NW0010GE
AMD Radeon RX 6600M, AMD Ryzen 5 5600H
24788 Points +14%
Asus TUF Gaming F15 FX507ZM
NVIDIA GeForce RTX 3060 Laptop GPU, Intel Core i7-12700H
22915 Points +6%
Asus ROG Strix Scar 15 G533zm
NVIDIA GeForce RTX 3060 Laptop GPU, Intel Core i9-12900H
21671 Points
Gemiddeld NVIDIA GeForce RTX 3060 Laptop GPU
  (16354 - 23109, n=49)
20436 Points -6%
Alienware m15 R5 Ryzen Edition
NVIDIA GeForce RTX 3060 Laptop GPU, AMD Ryzen 7 5800H
20312 Points -6%
MSI Pulse GL66 12UEK
NVIDIA GeForce RTX 3060 Laptop GPU, Intel Core i9-12900H
20286 Points -6%
2560x1440 Time Spy Graphics
Gemiddelde van klas Gaming
  (224 - 22717, n=192, laatste 2 jaar)
13032 Points +59%
Asus ROG Strix Scar 15 G533ZW-LN106WS
NVIDIA GeForce RTX 3070 Ti Laptop GPU, Intel Core i9-12900H
11197 Points +36%
Asus TUF Gaming F15 FX507ZM
NVIDIA GeForce RTX 3060 Laptop GPU, Intel Core i7-12700H
9174 Points +12%
Alienware m15 R5 Ryzen Edition
NVIDIA GeForce RTX 3060 Laptop GPU, AMD Ryzen 7 5800H
8295 Points +1%
Lenovo Legion 5 15ACH6A-82NW0010GE
AMD Radeon RX 6600M, AMD Ryzen 5 5600H
8234 Points 0%
Asus ROG Strix Scar 15 G533zm
NVIDIA GeForce RTX 3060 Laptop GPU, Intel Core i9-12900H
8222 Points
Gemiddeld NVIDIA GeForce RTX 3060 Laptop GPU
  (6285 - 9235, n=49)
8057 Points -2%
MSI Pulse GL66 12UEK
NVIDIA GeForce RTX 3060 Laptop GPU, Intel Core i9-12900H
7780 Points -5%
3DMark 11 Performance
27156 punten
3DMark Fire Strike Score
19296 punten
3DMark Time Spy Score
8606 punten
Help

Gamingprestaties

Helaas beperkt Optimus de Strix tot het uitvoeren van DirectX 11 games met slechts 60 fps. Dit is een algemeen probleem bij sommige laptops met Optimus. Behalve het spelen van deze spellen op een externe monitor, is de enige oplossing om de MUX-schakelaar in te schakelen en de dGPU direct te gebruiken.

De Strix 15 biedt meestal de beste prestaties van alle apparaten in onze vergelijking. Alleen de TUF Gaming F15 is marginaal sneller in sommige games.

Het loskoppelen van de Strix zorgde ervoor dat de framerates stabiliseerden op 30 fps in Witcher 3 op Ultra, en de ventilatoren bleven de hele tijd aangenaam stil.

The Witcher 3
1366x768 Medium Graphics & Postprocessing
Gemiddelde van klas Gaming
  (168.5 - 617, n=102, laatste 2 jaar)
361 fps +24%
Asus ROG Strix Scar 15 G533ZW-LN106WS
Intel Core i9-12900H, NVIDIA GeForce RTX 3070 Ti Laptop GPU
326 (275min, 280.6P1) fps +12%
Asus ROG Strix Scar 15 G533ZW-LN106WS
Intel Core i9-12900H, NVIDIA GeForce RTX 3070 Ti Laptop GPU
251 (213min, 216.92P1) fps -13%
Asus TUF Gaming F15 FX507ZM
Intel Core i7-12700H, NVIDIA GeForce RTX 3060 Laptop GPU
291.8 (268min) fps +1%
Asus ROG Strix Scar 15 G533zm
Intel Core i9-12900H, NVIDIA GeForce RTX 3060 Laptop GPU
290 fps
MSI Pulse GL66 12UEK
Intel Core i9-12900H, NVIDIA GeForce RTX 3060 Laptop GPU
247.2 fps -15%
Gemiddeld NVIDIA GeForce RTX 3060 Laptop GPU
  (204 - 296, n=33)
237 fps -18%
Lenovo Legion 5 15ACH6A-82NW0010GE
AMD Ryzen 5 5600H, AMD Radeon RX 6600M
194 (8.99min, 82.6P0.1, 156P1) fps -33%
1920x1080 High Graphics & Postprocessing (Nvidia HairWorks Off)
Gemiddelde van klas Gaming
  (35.6 - 449, n=125, laatste 2 jaar)
238 fps +44%
Asus ROG Strix Scar 15 G533ZW-LN106WS
Intel Core i9-12900H, NVIDIA GeForce RTX 3070 Ti Laptop GPU
209 (173min, 174.1P1) fps +27%
Asus TUF Gaming F15 FX507ZM
Intel Core i7-12700H, NVIDIA GeForce RTX 3060 Laptop GPU
186.8 (175min) fps +13%
Asus ROG Strix Scar 15 G533zm
Intel Core i9-12900H, NVIDIA GeForce RTX 3060 Laptop GPU
165 fps
Gemiddeld NVIDIA GeForce RTX 3060 Laptop GPU
  (81 - 186.8, n=41)
144.8 fps -12%
Alienware m15 R5 Ryzen Edition
AMD Ryzen 7 5800H, NVIDIA GeForce RTX 3060 Laptop GPU
142 fps -14%
Lenovo Legion 5 15ACH6A-82NW0010GE
AMD Ryzen 5 5600H, AMD Radeon RX 6600M
141 (8.84min, 64.6P0.1, 114P1) fps -15%
MSI Pulse GL66 12UEK
Intel Core i9-12900H, NVIDIA GeForce RTX 3060 Laptop GPU
139.6 fps -15%
1920x1080 Ultra Graphics & Postprocessing (HBAO+)
Gemiddelde van klas Gaming
  (18.4 - 216, n=169, laatste 2 jaar)
126.8 fps +43%
Asus ROG Strix Scar 15 G533ZW-LN106WS
Intel Core i9-12900H, NVIDIA GeForce RTX 3070 Ti Laptop GPU
111 (95min, 95P1) fps +25%
Asus TUF Gaming F15 FX507ZM
Intel Core i7-12700H, NVIDIA GeForce RTX 3060 Laptop GPU
91.5 (87min) fps +3%
Asus ROG Strix Scar 15 G533zm
Intel Core i9-12900H, NVIDIA GeForce RTX 3060 Laptop GPU
88.7 fps
Lenovo Legion 5 15ACH6A-82NW0010GE
AMD Ryzen 5 5600H, AMD Radeon RX 6600M
81.3 (9.27min, 52.3P0.1, 66.2P1) fps -8%
MSI Pulse GL66 12UEK
Intel Core i9-12900H, NVIDIA GeForce RTX 3060 Laptop GPU
78 fps -12%
Gemiddeld NVIDIA GeForce RTX 3060 Laptop GPU
  (58.2 - 91.5, n=48)
76.9 fps -13%
Alienware m15 R5 Ryzen Edition
AMD Ryzen 7 5800H, NVIDIA GeForce RTX 3060 Laptop GPU
75.6 (64min) fps -15%
Far Cry 5
1920x1080 Medium Preset AA:T
Gemiddelde van klas Gaming
  (38 - 248, n=86, laatste 2 jaar)
145.6 fps +13%
Asus ROG Strix Scar 15 G533ZW-LN106WS
Intel Core i9-12900H, NVIDIA GeForce RTX 3070 Ti Laptop GPU
143 (121min) fps +11%
Asus ROG Strix Scar 15 G533zm
Intel Core i9-12900H, NVIDIA GeForce RTX 3060 Laptop GPU
129 fps
MSI Pulse GL66 12UEK
Intel Core i9-12900H, NVIDIA GeForce RTX 3060 Laptop GPU
128 fps -1%
Asus TUF Gaming F15 FX507ZM
Intel Core i7-12700H, NVIDIA GeForce RTX 3060 Laptop GPU
123 (89min) fps -5%
Gemiddeld NVIDIA GeForce RTX 3060 Laptop GPU
  (88 - 135, n=25)
114.2 fps -11%
Alienware m15 R5 Ryzen Edition
AMD Ryzen 7 5800H, NVIDIA GeForce RTX 3060 Laptop GPU
105 fps -19%
Lenovo Legion 5 15ACH6A-82NW0010GE
AMD Ryzen 5 5600H, AMD Radeon RX 6600M
97 (79min) fps -25%
1920x1080 High Preset AA:T
Gemiddelde van klas Gaming
  (35 - 232, n=100, laatste 2 jaar)
139.4 fps +13%
Asus ROG Strix Scar 15 G533ZW-LN106WS
Intel Core i9-12900H, NVIDIA GeForce RTX 3070 Ti Laptop GPU
138 (117min) fps +12%
Asus ROG Strix Scar 15 G533zm
Intel Core i9-12900H, NVIDIA GeForce RTX 3060 Laptop GPU
123 fps
MSI Pulse GL66 12UEK
Intel Core i9-12900H, NVIDIA GeForce RTX 3060 Laptop GPU
120 fps -2%
Asus TUF Gaming F15 FX507ZM
Intel Core i7-12700H, NVIDIA GeForce RTX 3060 Laptop GPU
114 (82min) fps -7%
Gemiddeld NVIDIA GeForce RTX 3060 Laptop GPU
  (85 - 129, n=29)
107.7 fps -12%
Alienware m15 R5 Ryzen Edition
AMD Ryzen 7 5800H, NVIDIA GeForce RTX 3060 Laptop GPU
100 fps -19%
Lenovo Legion 5 15ACH6A-82NW0010GE
AMD Ryzen 5 5600H, AMD Radeon RX 6600M
93 (74min) fps -24%
1920x1080 Ultra Preset AA:T
Gemiddelde van klas Gaming
  (34 - 218, n=103, laatste 2 jaar)
130.5 fps +12%
Asus ROG Strix Scar 15 G533ZW-LN106WS
Intel Core i9-12900H, NVIDIA GeForce RTX 3070 Ti Laptop GPU
130 (102min) fps +11%
Asus ROG Strix Scar 15 G533zm
Intel Core i9-12900H, NVIDIA GeForce RTX 3060 Laptop GPU
117 fps
Asus TUF Gaming F15 FX507ZM
Intel Core i7-12700H, NVIDIA GeForce RTX 3060 Laptop GPU
114 (86min) fps -3%
MSI Pulse GL66 12UEK
Intel Core i9-12900H, NVIDIA GeForce RTX 3060 Laptop GPU
112 fps -4%
Gemiddeld NVIDIA GeForce RTX 3060 Laptop GPU
  (80 - 120, n=31)
101.6 fps -13%
Alienware m15 R5 Ryzen Edition
AMD Ryzen 7 5800H, NVIDIA GeForce RTX 3060 Laptop GPU
96 fps -18%
Lenovo Legion 5 15ACH6A-82NW0010GE
AMD Ryzen 5 5600H, AMD Radeon RX 6600M
86 (64min) fps -26%
Cyberpunk 2077 1.6
1920x1080 Medium Preset
Asus ROG Strix Scar 15 G533zm
Intel Core i9-12900H, NVIDIA GeForce RTX 3060 Laptop GPU
118 fps
Asus ROG Strix Scar 15 G533ZW-LN106WS
Intel Core i9-12900H, NVIDIA GeForce RTX 3070 Ti Laptop GPU
114.6 (27min) fps -3%
Gemiddelde van klas Gaming
  (15 - 178.6, n=48, laatste 2 jaar)
108.8 fps -8%
Lenovo Legion 5 15ACH6A-82NW0010GE
AMD Ryzen 5 5600H, AMD Radeon RX 6600M
98.1 fps -17%
Gemiddeld NVIDIA GeForce RTX 3060 Laptop GPU
  (68 - 118, n=14)
89.3 fps -24%
MSI Pulse GL66 12UEK
Intel Core i9-12900H, NVIDIA GeForce RTX 3060 Laptop GPU
87.1 fps -26%
1920x1080 High Preset
Gemiddelde van klas Gaming
  (12.2 - 205, n=61, laatste 2 jaar)
98 fps +56%
Asus ROG Strix Scar 15 G533ZW-LN106WS
Intel Core i9-12900H, NVIDIA GeForce RTX 3070 Ti Laptop GPU
89.5 (60.3min) fps +42%
Lenovo Legion 5 15ACH6A-82NW0010GE
AMD Ryzen 5 5600H, AMD Radeon RX 6600M
75.1 fps +19%
Gemiddeld NVIDIA GeForce RTX 3060 Laptop GPU
  (42.2 - 87.7, n=14)
68 fps +8%
Asus ROG Strix Scar 15 G533zm
Intel Core i9-12900H, NVIDIA GeForce RTX 3060 Laptop GPU
63 fps
MSI Pulse GL66 12UEK
Intel Core i9-12900H, NVIDIA GeForce RTX 3060 Laptop GPU
42.2 fps -33%
1920x1080 Ultra Preset
Gemiddelde van klas Gaming
  (16.7 - 159.7, n=72, laatste 2 jaar)
92.3 fps +47%
Asus ROG Strix Scar 15 G533ZW-LN106WS
Intel Core i9-12900H, NVIDIA GeForce RTX 3070 Ti Laptop GPU
76 (31min) fps +21%
Asus ROG Strix Scar 15 G533zm
Intel Core i9-12900H, NVIDIA GeForce RTX 3060 Laptop GPU
63 fps
Gemiddeld NVIDIA GeForce RTX 3060 Laptop GPU
  (40 - 78.8, n=16)
61.1 fps -3%
Lenovo Legion 5 15ACH6A-82NW0010GE
AMD Ryzen 5 5600H, AMD Radeon RX 6600M
60.7 fps -4%
MSI Pulse GL66 12UEK
Intel Core i9-12900H, NVIDIA GeForce RTX 3060 Laptop GPU
40.7 fps -35%
2560x1440 Ultra Preset
Gemiddelde van klas Gaming
  (37.7 - 116, n=59, laatste 2 jaar)
68.8 fps
Asus ROG Strix Scar 15 G533ZW-LN106WS
Intel Core i9-12900H, NVIDIA GeForce RTX 3070 Ti Laptop GPU
46 (29.7min) fps
Gemiddeld NVIDIA GeForce RTX 3060 Laptop GPU
  (23 - 45.8, n=9)
36.5 fps
1920x1080 Ray Tracing Ultra Preset (DLSS off)
Gemiddelde van klas Gaming
  (19.1 - 74, n=26, laatste 2 jaar)
48.1 fps +84%
Asus ROG Strix Scar 15 G533ZW-LN106WS
Intel Core i9-12900H, NVIDIA GeForce RTX 3070 Ti Laptop GPU
34.7 (23.7min) fps +33%
Asus ROG Strix Scar 15 G533zm
Intel Core i9-12900H, NVIDIA GeForce RTX 3060 Laptop GPU
26.1 fps
Gemiddeld NVIDIA GeForce RTX 3060 Laptop GPU
  (12.6 - 28.9, n=7)
23.9 fps -8%
MSI Pulse GL66 12UEK
Intel Core i9-12900H, NVIDIA GeForce RTX 3060 Laptop GPU
23.8 fps -9%
Lenovo Legion 5 15ACH6A-82NW0010GE
AMD Ryzen 5 5600H, AMD Radeon RX 6600M
15.6 fps -40%
GTA V
1920x1080 Normal/Off AF:4x
Asus TUF Gaming F15 FX507ZM
Intel Core i7-12700H, NVIDIA GeForce RTX 3060 Laptop GPU
183 (3.66min, 143P1) fps +1%
Asus ROG Strix Scar 15 G533zm
Intel Core i9-12900H, NVIDIA GeForce RTX 3060 Laptop GPU
180.5 fps
Asus ROG Strix Scar 15 G533ZW-LN106WS
Intel Core i9-12900H, NVIDIA GeForce RTX 3070 Ti Laptop GPU
179.8 (4.84min, 18.5P1) fps 0%
Gemiddelde van klas Gaming
  (79.6 - 187.7, n=124, laatste 2 jaar)
178.5 fps -1%
Gemiddeld NVIDIA GeForce RTX 3060 Laptop GPU
  (146 - 183.7, n=33)
170.2 fps -6%
Alienware m15 R5 Ryzen Edition
AMD Ryzen 7 5800H, NVIDIA GeForce RTX 3060 Laptop GPU
158 (4.71min, 100P1) fps -12%
Lenovo Legion 5 15ACH6A-82NW0010GE
AMD Ryzen 5 5600H, AMD Radeon RX 6600M
157 (4.98min, 90.9P1) fps -13%
1920x1080 High/On (Advanced Graphics Off) AA:2xMSAA + FX AF:8x
Asus ROG Strix Scar 15 G533ZW-LN106WS
Intel Core i9-12900H, NVIDIA GeForce RTX 3070 Ti Laptop GPU
172.2 (3.94min, 111.1P1) fps +3%
Gemiddelde van klas Gaming
  (24.2 - 187.1, n=147, laatste 2 jaar)
168.8 fps +1%
Asus ROG Strix Scar 15 G533zm
Intel Core i9-12900H, NVIDIA GeForce RTX 3060 Laptop GPU
166.9 (4.78min, 125P1) fps
Asus TUF Gaming F15 FX507ZM
Intel Core i7-12700H, NVIDIA GeForce RTX 3060 Laptop GPU
162 (4.65min, 100P1) fps -3%
Gemiddeld NVIDIA GeForce RTX 3060 Laptop GPU
  (120 - 179.4, n=42)
154 fps -8%
Alienware m15 R5 Ryzen Edition
AMD Ryzen 7 5800H, NVIDIA GeForce RTX 3060 Laptop GPU
133 (17.8min, 90.9P1) fps -20%
Lenovo Legion 5 15ACH6A-82NW0010GE
AMD Ryzen 5 5600H, AMD Radeon RX 6600M
130.2 (19.1min, 83.3P1) fps -22%
1920x1080 Highest Settings possible AA:4xMSAA + FX AF:16x
Asus ROG Strix Scar 15 G533ZW-LN106WS
Intel Core i9-12900H, NVIDIA GeForce RTX 3070 Ti Laptop GPU
123.9 (6.53min, 76.9P1) fps +18%
Gemiddelde van klas Gaming
  (12.1 - 167.7, n=172, laatste 2 jaar)
113.1 fps +8%
Asus ROG Strix Scar 15 G533zm
Intel Core i9-12900H, NVIDIA GeForce RTX 3060 Laptop GPU
105 fps
Asus TUF Gaming F15 FX507ZM
Intel Core i7-12700H, NVIDIA GeForce RTX 3060 Laptop GPU
97.9 (4.48min, 62.5P1) fps -7%
Gemiddeld NVIDIA GeForce RTX 3060 Laptop GPU
  (69.2 - 109.8, n=46)
89.7 fps -15%
Alienware m15 R5 Ryzen Edition
AMD Ryzen 7 5800H, NVIDIA GeForce RTX 3060 Laptop GPU
81.5 (9.89min, 58.8P1) fps -22%
Lenovo Legion 5 15ACH6A-82NW0010GE
AMD Ryzen 5 5600H, AMD Radeon RX 6600M
73.8 (17.6min, 52.6P1) fps -30%
Final Fantasy XV Benchmark
1920x1080 Standard Quality
Gemiddelde van klas Gaming
  (33.5 - 230, n=147, laatste 2 jaar)
153.5 fps +31%
Asus ROG Strix Scar 15 G533ZW-LN106WS
Intel Core i9-12900H, NVIDIA GeForce RTX 3070 Ti Laptop GPU
129.7 fps +11%
Asus TUF Gaming F15 FX507ZM
Intel Core i7-12700H, NVIDIA GeForce RTX 3060 Laptop GPU
122 fps +4%
Asus ROG Strix Scar 15 G533zm
Intel Core i9-12900H, NVIDIA GeForce RTX 3060 Laptop GPU
117.2 fps
Gemiddeld NVIDIA GeForce RTX 3060 Laptop GPU
  (70.4 - 133.5, n=37)
105.6 fps -10%
Lenovo Legion 5 15ACH6A-82NW0010GE
AMD Ryzen 5 5600H, AMD Radeon RX 6600M
104.5 fps -11%
Alienware m15 R5 Ryzen Edition
AMD Ryzen 7 5800H, NVIDIA GeForce RTX 3060 Laptop GPU
102 fps -13%
1920x1080 High Quality
Gemiddelde van klas Gaming
  (19.2 - 201, n=185, laatste 2 jaar)
119 fps +36%
Asus ROG Strix Scar 15 G533ZW-LN106WS
Intel Core i9-12900H, NVIDIA GeForce RTX 3070 Ti Laptop GPU
95.7 fps +9%
Asus TUF Gaming F15 FX507ZM
Intel Core i7-12700H, NVIDIA GeForce RTX 3060 Laptop GPU
91.9 fps +5%
Asus ROG Strix Scar 15 G533zm
Intel Core i9-12900H, NVIDIA GeForce RTX 3060 Laptop GPU
87.5 fps
Gemiddeld NVIDIA GeForce RTX 3060 Laptop GPU
  (55 - 100.9, n=42)
79.4 fps -9%
Lenovo Legion 5 15ACH6A-82NW0010GE
AMD Ryzen 5 5600H, AMD Radeon RX 6600M
78.4 fps -10%
Alienware m15 R5 Ryzen Edition
AMD Ryzen 7 5800H, NVIDIA GeForce RTX 3060 Laptop GPU
78.1 fps -11%
2560x1440 High Quality
Gemiddelde van klas Gaming
  (32.5 - 169.2, n=135, laatste 2 jaar)
103.9 fps +60%
Asus ROG Strix Scar 15 G533ZW-LN106WS
Intel Core i9-12900H, NVIDIA GeForce RTX 3070 Ti Laptop GPU
72.2 fps +11%
Asus ROG Strix Scar 15 G533zm
Intel Core i9-12900H, NVIDIA GeForce RTX 3060 Laptop GPU
65.1 fps
Gemiddeld NVIDIA GeForce RTX 3060 Laptop GPU
  (41.1 - 73.7, n=25)
59.5 fps -9%
Strange Brigade
1920x1080 medium AA:medium AF:4
Gemiddelde van klas Gaming
  (58.5 - 508, n=141, laatste 2 jaar)
292 fps +35%
Asus ROG Strix Scar 15 G533ZW-LN106WS
Intel Core i9-12900H, NVIDIA GeForce RTX 3070 Ti Laptop GPU
274 (64.3min, 228P1) fps +27%
Asus TUF Gaming F15 FX507ZM
Intel Core i7-12700H, NVIDIA GeForce RTX 3060 Laptop GPU
232 (74.6min, 191P1) fps +7%
Asus ROG Strix Scar 15 G533zm
Intel Core i9-12900H, NVIDIA GeForce RTX 3060 Laptop GPU
216 (71.2min, 170.2P1) fps
Gemiddeld NVIDIA GeForce RTX 3060 Laptop GPU
  (154.9 - 242, n=38)
193.8 fps -10%
Lenovo Legion 5 15ACH6A-82NW0010GE
AMD Ryzen 5 5600H, AMD Radeon RX 6600M
188.1 (133.1min, 138.4P1) fps -13%
Alienware m15 R5 Ryzen Edition
AMD Ryzen 7 5800H, NVIDIA GeForce RTX 3060 Laptop GPU
160 (82.3min, 124P1) fps -26%
1920x1080 high AA:high AF:8
Gemiddelde van klas Gaming
  (49.4 - 465, n=156, laatste 2 jaar)
253 fps +43%
Asus ROG Strix Scar 15 G533ZW-LN106WS
Intel Core i9-12900H, NVIDIA GeForce RTX 3070 Ti Laptop GPU
235 (5min, 176P1) fps +33%
Asus TUF Gaming F15 FX507ZM
Intel Core i7-12700H, NVIDIA GeForce RTX 3060 Laptop GPU
185 (121min, 137P1) fps +5%
Asus ROG Strix Scar 15 G533zm
Intel Core i9-12900H, NVIDIA GeForce RTX 3060 Laptop GPU
176.4 (40.6min, 128.3P1) fps
Lenovo Legion 5 15ACH6A-82NW0010GE
AMD Ryzen 5 5600H, AMD Radeon RX 6600M
170 (120min, 126P1) fps -4%
Gemiddeld NVIDIA GeForce RTX 3060 Laptop GPU
  (115.6 - 192.1, n=41)
157 fps -11%
Alienware m15 R5 Ryzen Edition
AMD Ryzen 7 5800H, NVIDIA GeForce RTX 3060 Laptop GPU
146 (5min, 109P1) fps -17%
1920x1080 ultra AA:ultra AF:16
Gemiddelde van klas Gaming
  (38.9 - 421, n=183, laatste 2 jaar)
227 fps +48%
Asus ROG Strix Scar 15 G533ZW-LN106WS
Intel Core i9-12900H, NVIDIA GeForce RTX 3070 Ti Laptop GPU
196.2 (70.2min, 148.7P1) fps +28%
Asus TUF Gaming F15 FX507ZM
Intel Core i7-12700H, NVIDIA GeForce RTX 3060 Laptop GPU
160 (75.9min, 121P1) fps +5%
Asus ROG Strix Scar 15 G533zm
Intel Core i9-12900H, NVIDIA GeForce RTX 3060 Laptop GPU
153 (44min, 114.2P1) fps
Lenovo Legion 5 15ACH6A-82NW0010GE
AMD Ryzen 5 5600H, AMD Radeon RX 6600M
151 (104min, 109P1) fps -1%
Gemiddeld NVIDIA GeForce RTX 3060 Laptop GPU
  (102.2 - 166.3, n=43)
137.6 fps -10%
Alienware m15 R5 Ryzen Edition
AMD Ryzen 7 5800H, NVIDIA GeForce RTX 3060 Laptop GPU
134 (92.7min, 100P1) fps -12%
2560x1440 ultra AA:ultra AF:16
Gemiddelde van klas Gaming
  (52.8 - 322, n=124, laatste 2 jaar)
189.6 fps
Asus ROG Strix Scar 15 G533ZW-LN106WS
Intel Core i9-12900H, NVIDIA GeForce RTX 3070 Ti Laptop GPU
148.5 (30.1min, 117.7P1) fps
Gemiddeld NVIDIA GeForce RTX 3060 Laptop GPU
  (75.4 - 118.4, n=17)
99.7 fps
X-Plane 11.11
1280x720 low (fps_test=1)
Gemiddelde van klas Gaming
  (39 - 221, n=187, laatste 2 jaar)
155.7 fps +7%
Asus TUF Gaming F15 FX507ZM
Intel Core i7-12700H, NVIDIA GeForce RTX 3060 Laptop GPU
153 fps +5%
Asus ROG Strix Scar 15 G533zm
Intel Core i9-12900H, NVIDIA GeForce RTX 3060 Laptop GPU
145.8 fps
MSI Pulse GL66 12UEK
Intel Core i9-12900H, NVIDIA GeForce RTX 3060 Laptop GPU
142 fps -3%
Gemiddeld NVIDIA GeForce RTX 3060 Laptop GPU
  (83.6 - 157.1, n=48)
115.1 fps -21%
Alienware m15 R5 Ryzen Edition
AMD Ryzen 7 5800H, NVIDIA GeForce RTX 3060 Laptop GPU
94.6 fps -35%
Lenovo Legion 5 15ACH6A-82NW0010GE
AMD Ryzen 5 5600H, AMD Radeon RX 6600M
64.7 fps -56%
1920x1080 med (fps_test=2)
Gemiddelde van klas Gaming
  (36.5 - 193.1, n=190, laatste 2 jaar)
136.5 fps +10%
Asus TUF Gaming F15 FX507ZM
Intel Core i7-12700H, NVIDIA GeForce RTX 3060 Laptop GPU
136 fps +10%
Asus ROG Strix Scar 15 G533zm
Intel Core i9-12900H, NVIDIA GeForce RTX 3060 Laptop GPU
123.9 fps
MSI Pulse GL66 12UEK
Intel Core i9-12900H, NVIDIA GeForce RTX 3060 Laptop GPU
123 fps -1%
Gemiddeld NVIDIA GeForce RTX 3060 Laptop GPU
  (73 - 138.3, n=48)
100.9 fps -19%
Alienware m15 R5 Ryzen Edition
AMD Ryzen 7 5800H, NVIDIA GeForce RTX 3060 Laptop GPU
82.4 fps -33%
Lenovo Legion 5 15ACH6A-82NW0010GE
AMD Ryzen 5 5600H, AMD Radeon RX 6600M
50.7 fps -59%
1920x1080 high (fps_test=3)
Gemiddelde van klas Gaming
  (31.5 - 166.2, n=197, laatste 2 jaar)
107.2 fps +7%
Asus TUF Gaming F15 FX507ZM
Intel Core i7-12700H, NVIDIA GeForce RTX 3060 Laptop GPU
107 fps +7%
MSI Pulse GL66 12UEK
Intel Core i9-12900H, NVIDIA GeForce RTX 3060 Laptop GPU
100 fps 0%
Asus ROG Strix Scar 15 G533zm
Intel Core i9-12900H, NVIDIA GeForce RTX 3060 Laptop GPU
99.8 fps
Gemiddeld NVIDIA GeForce RTX 3060 Laptop GPU
  (61.9 - 109.3, n=48)
82 fps -18%
Alienware m15 R5 Ryzen Edition
AMD Ryzen 7 5800H, NVIDIA GeForce RTX 3060 Laptop GPU
70 fps -30%
Lenovo Legion 5 15ACH6A-82NW0010GE
AMD Ryzen 5 5600H, AMD Radeon RX 6600M
45.1 fps -55%

Witcher 3 liep gedurende de testperiode van een uur vrij stabiel, met slechts een kleine afname in framerate.

Witcher 3 FPS chart

0510152025303540455055606570758085Tooltip
Asus ROG Strix Scar 15 G533zm i9-12900H, GeForce RTX 3060 Laptop GPU: Ø80.8 (76-86)
lagegem.hogeultraQHD
GTA V (2015) 186.2 181.6 166.9 105 80.5
The Witcher 3 (2015) 400 290 165 88.7
Dota 2 Reborn (2015) 182.6 167.7 159.1 151.4
Final Fantasy XV Benchmark (2018) 178.9 117.2 87.5 65.1
X-Plane 11.11 (2018) 145.8 123.9 99.8
Far Cry 5 (2018) 160 129 123 117 92
Strange Brigade (2018) 398 216 176.4 153
Cyberpunk 2077 1.6 (2022) 120 118 63 63

Uitstoot - Koel, maar niet per se stil

Geluidsemissies

In de Turbo-modus draaien de ventilatoren binnenin regelmatig een paar seconden heel hard, voordat ze weer stationair draaien. Asus zou kunnen overwegen om het koelsysteem in een toekomstige update minder agressief te maken. Dat gezegd hebbende, de ventilatoren draaien meestal niet in de Stille modus.

De Asus Strix Scar is niet per se stil onder belasting. Tijdens het gamen en de stresstest waren de Asus TUF en MSI Pulse even luid, terwijl de Lenovo Legion en Alienware stiller bleven.

Bij het starten van bepaalde belastingen (bijv. Witcher 3), merkten we ook zachte elektronische piepgeluiden op die uit het apparaat kwamen, maar deze waren slechts tijdelijk aanwezig.

Geluidsniveau

Onbelast
23 / 23 / 37.75 dB (A)
Belasting
45.35 / 56.22 dB (A)
  red to green bar
 
 
30 dB
stil
40 dB(A)
hoorbaar
50 dB(A)
luid
 
min: dark, med: mid, max: light   Earthworks M23R, Arta (15 cm afstand)   omgevingslawaai: 23 dB(A)
dB(A) 0102030405060708090Deep BassMiddle BassHigh BassLower RangeMidsHigher MidsLower HighsMid HighsUpper HighsSuper Highs2038.832.538.82541.538.241.53143.841.743.84031.931.731.95033.733.333.76337.131.537.18033.324.433.31004125.14112532.321.132.316031.71931.720035.423.235.425035.519.635.531536.213.636.240039.212.339.250038.71038.763040.610.540.680042.38.842.3100044.47.844.4125047.48.647.4160048948200044.39.244.3250043.91043.9315044.110.544.1400044.210.644.2500040.310.840.3630042.110.942.1800045.311.145.31000041.211.241.21250038.61138.61600031.51031.5SPL56.223.356.2N110.511median 41median 10.8median 41Delta4.234.234.436.434.835.530.525.225.828.228.327.424.224.224.225.323.624.523.322.922.625.223.122.622.123.624.723.223.527.628.123.326.72321.321.526.727.522.619.120.127.427.221.518.120.826.827.722.412.713.129.731.121.914.413.332.834.924.215.114.334.835.92616.515.940.837.526.814.312.838.737.427.412.912.740.938.426.810.91141.441.428.19.89.64340.626.89.99.343.34328.7109.34644.128.310.49.546.34326.810.710.14643.425.111.110.646.54325.111.410.746.241.525.811.5114542.625.411.411.245.942.719.411.711.745.942.618.512.211.945.838.619.612.212.243.934.819.512.11240.53117.911.311.53654.23823.623.257.29.62.90.50.511.7median 38.6median 25.1median 11.7median 11.7median 435.72.81.91.35.9hearing rangehide median Fan NoiseAsus ROG Strix Scar 15 G533zmAsus TUF Gaming F15 FX507ZM
Asus ROG Strix Scar 15 G533zm
GeForce RTX 3060 Laptop GPU, i9-12900H
Asus ROG Strix Scar 15 G533ZW-LN106WS
GeForce RTX 3070 Ti Laptop GPU, i9-12900H, Samsung PM9A1 MZVL22T0HBLB
Asus TUF Gaming F15 FX507ZM
GeForce RTX 3060 Laptop GPU, i7-12700H, SK Hynix HFM001TD3JX013N
MSI Pulse GL66 12UEK
GeForce RTX 3060 Laptop GPU, i9-12900H, Micron 2450 512GB MTFDKBA512TFK
Alienware m15 R5 Ryzen Edition
GeForce RTX 3060 Laptop GPU, R7 5800H, Toshiba KBG40ZNS512G NVMe
Lenovo Legion 5 15ACH6A-82NW0010GE
Radeon RX 6600M, R5 5600H, Micron 2210 MTFDHBA512QFD
Noise
-26%
6%
0%
2%
-4%
uit / omgeving *
23
26.86
-17%
23.2
-1%
23
-0%
24
-4%
25
-9%
Idle Minimum *
23
39.07
-70%
23.6
-3%
23
-0%
24
-4%
25
-9%
Idle Average *
23
39.07
-70%
23.6
-3%
27
-17%
25
-9%
25
-9%
Idle Maximum *
37.75
39.07
-3%
25.4
33%
27
28%
35
7%
34.5
9%
Load Average *
45.35
53.34
-18%
38
16%
48.2
-6%
44
3%
51.1
-13%
Witcher 3 ultra *
55.48
56.6
-2%
54.1
2%
56.9
-3%
48
13%
Load Maximum *
56.22
56.6
-1%
57.2
-2%
56.94
-1%
50
11%
51.3
9%

* ... kleiner is beter

Temperatuur

De Asus gaming laptop blijft zowel in ruststand als onder belasting relatief koel. De Alienware loopt bijvoorbeeld veel heter ondanks zijn uitstekende koelsysteem. De Strix Scar heeft een hoorbaar agressievere ventilatorcurve, waardoor de oppervlaktetemperaturen op een redelijk niveau blijven.

Max. Belasting
 43 °C43 °C38 °C 
 39 °C40 °C39 °C 
 20 °C21 °C20 °C 
Maximum: 43 °C
Gemiddelde: 33.7 °C
41 °C47 °C43 °C
33 °C41 °C35 °C
22 °C33 °C26 °C
Maximum: 47 °C
Gemiddelde: 35.7 °C
Stroomadapter (max.)  53 °C | Kamertemperatuur 22.5 °C | Fluke t3000FC (calibrated), Fluke 62 Mini
(±) De gemiddelde temperatuur voor de bovenzijde bij maximale belasting bedraagt 33.7 °C / 93 F, vergeleken met het gemiddelde van 33.9 °C / ###class_avg_f## F voor de apparaten van de klasse Gaming.
(±) De maximumtemperatuur aan de bovenzijde bedraagt 43 °C / 109 F, vergeleken met het gemiddelde van 40.5 °C / 105 F, variërend van 21.2 tot 68.8 °C voor de klasse Gaming.
(-) De bodem warmt op tot een maximum van 47 °C / 117 F, vergeleken met een gemiddelde van 43.2 °C / 110 F
(+) Bij onbelast gebruik bedraagt de gemiddelde temperatuur voor de bovenzijde 29.2 °C / 85 F, vergeleken met het apparaatgemiddelde van 33.9 °C / 93 F.
(±) Bij het spelen van The Witcher 3 is de gemiddelde temperatuur voor de bovenzijde 32.9 °C / 91 F, vergeleken met het apparaatgemiddelde van 33.9 °C / 93 F.
(+) De palmsteunen en het touchpad zijn met een maximum van ###max## °C / 77 F koeler dan de huidtemperatuur en voelen daarom koel aan.
(+) De gemiddelde temperatuur van de handpalmsteun van soortgelijke toestellen bedroeg 28.9 °C / 84 F (+3.9 °C / 7 F).
Toetsenbord tijdens stresstest
Bodemkap tijdens stresstest
Voedingsadapter
Voedingsadapter
Asus ROG Strix Scar 15 G533zm
Intel Core i9-12900H, NVIDIA GeForce RTX 3060 Laptop GPU
Asus ROG Strix Scar 15 G533ZW-LN106WS
Intel Core i9-12900H, NVIDIA GeForce RTX 3070 Ti Laptop GPU
Asus TUF Gaming F15 FX507ZM
Intel Core i7-12700H, NVIDIA GeForce RTX 3060 Laptop GPU
MSI Pulse GL66 12UEK
Intel Core i9-12900H, NVIDIA GeForce RTX 3060 Laptop GPU
Alienware m15 R5 Ryzen Edition
AMD Ryzen 7 5800H, NVIDIA GeForce RTX 3060 Laptop GPU
Lenovo Legion 5 15ACH6A-82NW0010GE
AMD Ryzen 5 5600H, AMD Radeon RX 6600M
Heat
-10%
-11%
-11%
-22%
3%
Maximum Upper Side *
43
42.6
1%
44.4
-3%
50
-16%
62
-44%
39.9
7%
Maximum Bottom *
47
50.2
-7%
48.8
-4%
47
-0%
61
-30%
43.8
7%
Idle Upper Side *
32
36.2
-13%
37.8
-18%
36
-13%
36
-13%
34.1
-7%
Idle Bottom *
33
40.2
-22%
39.6
-20%
38
-15%
33
-0%
31.7
4%

* ... kleiner is beter

Stresstest

Tijdens de stresstest bereikte de TDP een paar seconden lang ongeveer 95 watt, voordat hij daalde naar de nominale 45 watt. Tegelijkertijd daalde de kloksnelheid van de CPU tot gemiddeld ongeveer 2,3 GHz, met kerntemperaturen die rond de 76°C schommelden.

De klok van de GPU liep op ongeveer 1,6 GHz met slechts kleine fluctuaties. De geheugenklok liep op een absoluut constante 1.750 MHz. De GPU-temperaturen waren echter relatief hoog, ongeveer 81°C (177.8°F), wat desondanks nog steeds binnen een veilig bereik valt en aangeeft dat de headroom goed benut werd. De hele kaart verbruikte gemiddeld 109 watt.

Begin van de stresstest
Na 30s stresstest
Na 30s stresstest
Einde stresstest
Einde stresstest
CPU kloksnelheid
CPU kloksnelheid
Kloksnelheid GPU
Kloksnelheid GPU
CPU-pakketvermogen
CPU-pakketvermogen
Stroomverbruik GPU
Stroomverbruik GPU
CPU temperaturen
CPU temperaturen
GPU temperaturen
GPU temperaturen
CPU-klok (GHz) GPU-klok (MHz) Gemiddelde CPU-temperatuur (°C) Gemiddelde GPU-temperatuur (°C)
Prime95 + FurMark Stress 2.3 1.600 76 81

Luidsprekers

De luidsprekers zijn zelfs op maximaal volume niet luid genoeg. Dat gezegd hebbende, zijn ze in ieder geval in staat om een fatsoenlijke bas te produceren voor laptopspeakers. Aan de andere kant zijn de hoge tonen niet zo indrukwekkend als op concurrerende apparaten.

Er is een gecombineerde audio-aansluiting voor gebruikers om externe analoge audio-apparaten aan te sluiten.

dB(A) 0102030405060708090Deep BassMiddle BassHigh BassLower RangeMidsHigher MidsLower HighsMid HighsUpper HighsSuper Highs2044.532.544.52540.738.240.73144.441.744.44039.731.739.75039.833.339.86342.531.542.58049.324.449.310053.125.153.112558.321.158.316059.61959.620062.323.262.325063.519.663.531563.713.663.740066.612.366.650064.61064.663069.810.569.880070.58.870.5100072.27.872.2125072.68.672.6160070.9970.9200065.19.265.1250065.21065.2315065.810.565.8400056.810.656.850005410.854630054.410.954.4800060.111.160.11000048.611.248.61250039.81139.816000411041SPL79.523.379.5N45.10.545.1median 63.5median 10.8median 63.5Delta6.636.636.634.836.627.928.227.923.924.223.923.222.923.222.522.122.525.927.625.930.521.330.535.619.135.638.318.138.34312.74347.114.447.154.715.154.759.716.559.762.414.362.466.512.966.568.210.968.268.89.868.863.89.963.862.41062.465.110.465.165.710.765.760.111.160.16511.46569.111.569.160.711.460.756.311.756.355.312.255.354.812.254.858.312.158.359.311.359.376.723.676.739.30.539.3median 60.1median 11.7median 60.171.97hearing rangehide median Pink NoiseAsus ROG Strix Scar 15 G533zmAsus TUF Gaming F15 FX507ZM
Frequentiediagram (selectievakjes kunnen worden aan- en uitgezet om toestellen te vergelijken)
Asus ROG Strix Scar 15 G533zm audioanalyse

(±) | luidspreker luidheid is gemiddeld maar goed (79.48 dB)
Bas 100 - 315 Hz
(+) | goede baars - slechts 3.5% verwijderd van de mediaan
(+) | de lage tonen zijn lineair (4.6% delta naar de vorige frequentie)
Mids 400 - 2000 Hz
(±) | hogere middens - gemiddeld 5.6% hoger dan de mediaan
(+) | de middentonen zijn lineair (4.8% delta ten opzichte van de vorige frequentie)
Hoog 2 - 16 kHz
(±) | lagere maxima - gemiddeld 6.8% lager dan de mediaan
(±) | lineariteit van de hoogtepunten is gemiddeld (8.2% delta ten opzichte van de vorige frequentie)
Algemeen 100 - 16.000 Hz
(+) | het totale geluid is lineair (14.7% verschil met de mediaan)
Vergeleken met dezelfde klasse
» 27% van alle geteste apparaten in deze klasse waren beter, 7% vergelijkbaar, 66% slechter
» De beste had een delta van 6%, het gemiddelde was 18%, de slechtste was 132%
Vergeleken met alle geteste toestellen
» 17% van alle geteste apparaten waren beter, 4% gelijk, 79% slechter
» De beste had een delta van 4%, het gemiddelde was 25%, de slechtste was 134%

Asus TUF Gaming F15 FX507ZM audioanalyse

(±) | luidspreker luidheid is gemiddeld maar goed (76.7 dB)
Bas 100 - 315 Hz
(±) | verminderde zeebaars - gemiddeld 13.7% lager dan de mediaan
(±) | lineariteit van de lage tonen is gemiddeld (10.1% delta ten opzichte van de vorige frequentie)
Mids 400 - 2000 Hz
(±) | hogere middens - gemiddeld 5.2% hoger dan de mediaan
(+) | de middentonen zijn lineair (4.9% delta ten opzichte van de vorige frequentie)
Hoog 2 - 16 kHz
(+) | evenwichtige hoogtepunten - slechts 4.1% verwijderd van de mediaan
(±) | lineariteit van de hoogtepunten is gemiddeld (8.6% delta ten opzichte van de vorige frequentie)
Algemeen 100 - 16.000 Hz
(±) | lineariteit van het totale geluid is gemiddeld (15.9% verschil met de mediaan)
Vergeleken met dezelfde klasse
» 36% van alle geteste apparaten in deze klasse waren beter, 6% vergelijkbaar, 58% slechter
» De beste had een delta van 6%, het gemiddelde was 18%, de slechtste was 132%
Vergeleken met alle geteste toestellen
» 22% van alle geteste apparaten waren beter, 5% gelijk, 73% slechter
» De beste had een delta van 4%, het gemiddelde was 25%, de slechtste was 134%

Energiebeheer - Fatsoenlijke batterijlevensduur

Stroomverbruik

Over het geheel genomen is de Asus Strix Scar 15, ondanks dat hij niet bijzonder energiezuinig is, ook in dit opzicht niet al te problematisch. Hij verbruikt iets meer stroom dan zijn concurrenten in de energiebesparende inactieve modus en tijdens het gamen. Toch is het piekverbruik van 221 watt niet hoger dan dat van zijn rivalen en ligt het ruim binnen de mogelijkheden van de 240-watt lader.

Stroomgebruik
Inactiefdarkmidlight 13 / 17 / 17 Watt
Belasting midlight 135 / 221 Watt
 color bar
Key: min: dark, med: mid, max: light        Metrahit Energy
Asus ROG Strix Scar 15 G533zm
i9-12900H, GeForce RTX 3060 Laptop GPU, , IPS, 2560x1440, 15.6"
Asus ROG Strix Scar 15 G533ZW-LN106WS
i9-12900H, GeForce RTX 3070 Ti Laptop GPU, Samsung PM9A1 MZVL22T0HBLB, IPS-level, 2560x1440, 15.6"
Asus TUF Gaming F15 FX507ZM
i7-12700H, GeForce RTX 3060 Laptop GPU, SK Hynix HFM001TD3JX013N, IPS, 1920x1080, 15.6"
MSI Pulse GL66 12UEK
i9-12900H, GeForce RTX 3060 Laptop GPU, Micron 2450 512GB MTFDKBA512TFK, IPS, 1920x1080, 15.6"
Alienware m15 R5 Ryzen Edition
R7 5800H, GeForce RTX 3060 Laptop GPU, Toshiba KBG40ZNS512G NVMe, IPS, 1920x1080, 15.6"
Lenovo Legion 5 15ACH6A-82NW0010GE
R5 5600H, Radeon RX 6600M, Micron 2210 MTFDHBA512QFD, IPS, 1920x1080, 15.6"
Gemiddeld NVIDIA GeForce RTX 3060 Laptop GPU
 
Gemiddelde van klas Gaming
 
Power Consumption
7%
9%
28%
1%
8%
7%
-14%
Idle Minimum *
13
7.56
42%
6.3
52%
7
46%
11
15%
10
23%
10.4 ?(5 - 22.8, n=41)
20%
Idle Average *
17
13.5
21%
9.8
42%
13
24%
14
18%
13.2
22%
Idle Maximum *
17
16.87
1%
26.5
-56%
13.7
19%
25
-47%
15.6
8%
21.4 ?(11.8 - 48.2, n=41)
-26%
Load Average *
135
128.9
5%
103.8
23%
48.4
64%
123
9%
178
-32%
109.3 ?(48.4 - 191, n=41)
19%
Witcher 3 ultra *
195
196.2
-1%
189
3%
148
24%
176
10%
181
7%
Load Maximum *
221
274.86
-24%
241.9
-9%
244
-10%
226
-2%
180
19%

* ... kleiner is beter

Power consumption Witcher 3 / stress test

0153045607590105120135150165180195210Tooltip
Asus ROG Strix Scar 15 G533zm; Witcher 3 ultra: Ø194.8 (84.81-220.53)
Asus ROG Strix Scar 15 G533zm; 1280x720 Prime95 28.10 and Furmark 1.25: Ø189.8 (87.8-205.65)

Power consumption with external monitor

0153045607590105120135150165180195Tooltip
Asus ROG Strix Scar 15 G533zm; Prime95 V2810 Stress (external Monitor): Ø92 (71.11-116.55)
Asus ROG Strix Scar 15 G533zm; Cinebench R15 Multi (external Monitor): Ø112.2 (111.46-113.47)
Asus ROG Strix Scar 15 G533zm; 1280x720 FurMark 1.19 GPU Stress Test (external Monitor): Ø202 (189.93-207.29)
Asus ROG Strix Scar 15 G533zm; 1920x1080 The Witcher 3 ultra (external Monitor): Ø185.3 (175.52-208.09)

Levensduur batterij

Asus heeft de laptop uitgerust met een grote 90Wh batterij die in onze tests, die werden uitgevoerd met verminderde schermhelderheid, een uitstekende 8,5 uur video afspelen en 9 uur internetten kon bieden.

Batterijduur
Witcher 3 ultra 150cd
1h 20min
WiFi Websurfing
9h 11min
Big Buck Bunny H.264 1080p
8h 38min
Gaming
0h 00min
Belast (maximale helderheid)
1h 35min
Asus ROG Strix Scar 15 G533zm
i9-12900H, GeForce RTX 3060 Laptop GPU, 90 Wh
Asus ROG Strix Scar 15 G533ZW-LN106WS
i9-12900H, GeForce RTX 3070 Ti Laptop GPU, 90 Wh
Asus TUF Gaming F15 FX507ZM
i7-12700H, GeForce RTX 3060 Laptop GPU, 90 Wh
MSI Pulse GL66 12UEK
i9-12900H, GeForce RTX 3060 Laptop GPU, 53.5 Wh
Alienware m15 R5 Ryzen Edition
R7 5800H, GeForce RTX 3060 Laptop GPU, 86 Wh
Lenovo Legion 5 15ACH6A-82NW0010GE
R5 5600H, Radeon RX 6600M, 80 Wh
Gemiddelde van klas Gaming
 
Batterijduur
-17%
-40%
-16%
-16%
12%
-16%
H.264
518
510
-2%
237
-54%
525
1%
WiFi v1.3
551
501.4
-9%
285
-48%
306
-44%
552
0%
Witcher 3 ultra
80
70
-12%
96
20%
Load
95
52
-45%
66
-31%
116
22%
55
-42%
118
24%
Reader / Idle
947
881
770

Pro

+ geweldige bouwkwaliteit
+ aanpassingsmogelijkheden
+ samenhangend gaming-ontwerp
+ 2x USB-C poorten (1x Thunderbolt 4, PD)
+ touchpad met numpad
+ QHD-beeldscherm met indrukwekkende kleurdekking
+ blijft relatief koel
+ snelle Wi-Fi 6E
+ DDR5 RAM
+ goede batterijduur

Contra

- geen webcam
- linker touchpad knop blijft soms hangen
- twee Asus apps
- vrij hoge latentiewaarden

Verdict - Indrukwekkende gaminglaptop voor €1.999

De Asus ROG Strix Scar 15 G533zm is vriendelijk beschikbaar gesteld door Cyberport

Met een RTX 3060 is het G533zm-model van de Asus ROG Strix Scar 15 eveneens een zeer competente en geweldige gaminglaptop met een uitstekende bouwkwaliteit. Hij biedt moderne I/O's, een fantastische type-ervaring, krachtige hardware en aanpassingsopties. Verder valt het beeldscherm op door zijn geweldige responstijd, uitstekende kleurdekking en solide contrast en helderheid. Vergeleken met het RTX 3070 Ti model (G533zw) en directe concurrenten, loopt de G533zm relatief koel.

We hebben geen echte klachten over de laptop. Het geluidsniveau zou wat optimalisatie kunnen gebruiken, maar is verder heel redelijk. Wat dat betreft kunt u zich afvragen of het nodig is om een RTX 3060 te koppelen aan de snelle maar hete i9-12900H, wanneer een i7-12700H waarschijnlijk prima zou werken. Op ons evaluatiemodel bleef de linker touchpad-knop af en toe een beetje hangen, hoewel het andere Scar-model dit probleem niet had.

Voor ongeveer € 2.000 (US$ 2.170) krijgen gamers een uitstekende laptop met geweldige prestaties, veel sterke punten en weinig nadelen.

Hoewel het misschien geen koopje is voor een RTX 3060 gaming laptop, is het prijskaartje van €2.000 (US$2.170) redelijk gezien de vele positieve aspecten en de bijna onbestaande nadelen. Wie minder geld wil investeren, kan ook de Asus TUF Gaming F15 overwegen. Deze laptop heeft minder functies, maar biedt uitstekende prestaties voor een prijs van ongeveer €400 (U

Prijs en beschikbaarheid

De reviewconfiguratie is momenteel verkrijgbaar bij Cyberport voor € 1.999 (US$ 2.166). U kunt ook een lager model met minder geheugen en een FHD-scherm vinden op Amazon voor ongeveer US$1,600.

Asus ROG Strix Scar 15 G533zm - 30-04-2024 v7 (old)
Christian Hintze

Behuizing
88 / 98 → 90%
Toetsenbord
94%
Aanwijsapparaat
84%
Aansluitmogelijkheden
68 / 80 → 84%
Gewicht
61 / 10-66 → 91%
Batterij
82 / 95 → 86%
Beeldscherm
89%
Gaming-performance
99%
Applicatie-performance
97%
Temperatuur
89 / 95 → 93%
Luidheid
70 / 90 → 77%
Audio
80%
Camera
28 / 85 → 33%
Gemiddelde
79%
89%
Gaming - Gewogen Gemiddelde

Price comparison

Please share our article, every link counts!
> Overzichten en testrapporten over laptops en mobieltjes > Testrapporten > Asus ROG Strix Scar 15 G533zm beoordeling: Moderne RTX 3060 gaming laptop met veel sterke punten
Christian Hintze, 2024-11- 2 (Update: 2024-11- 2)