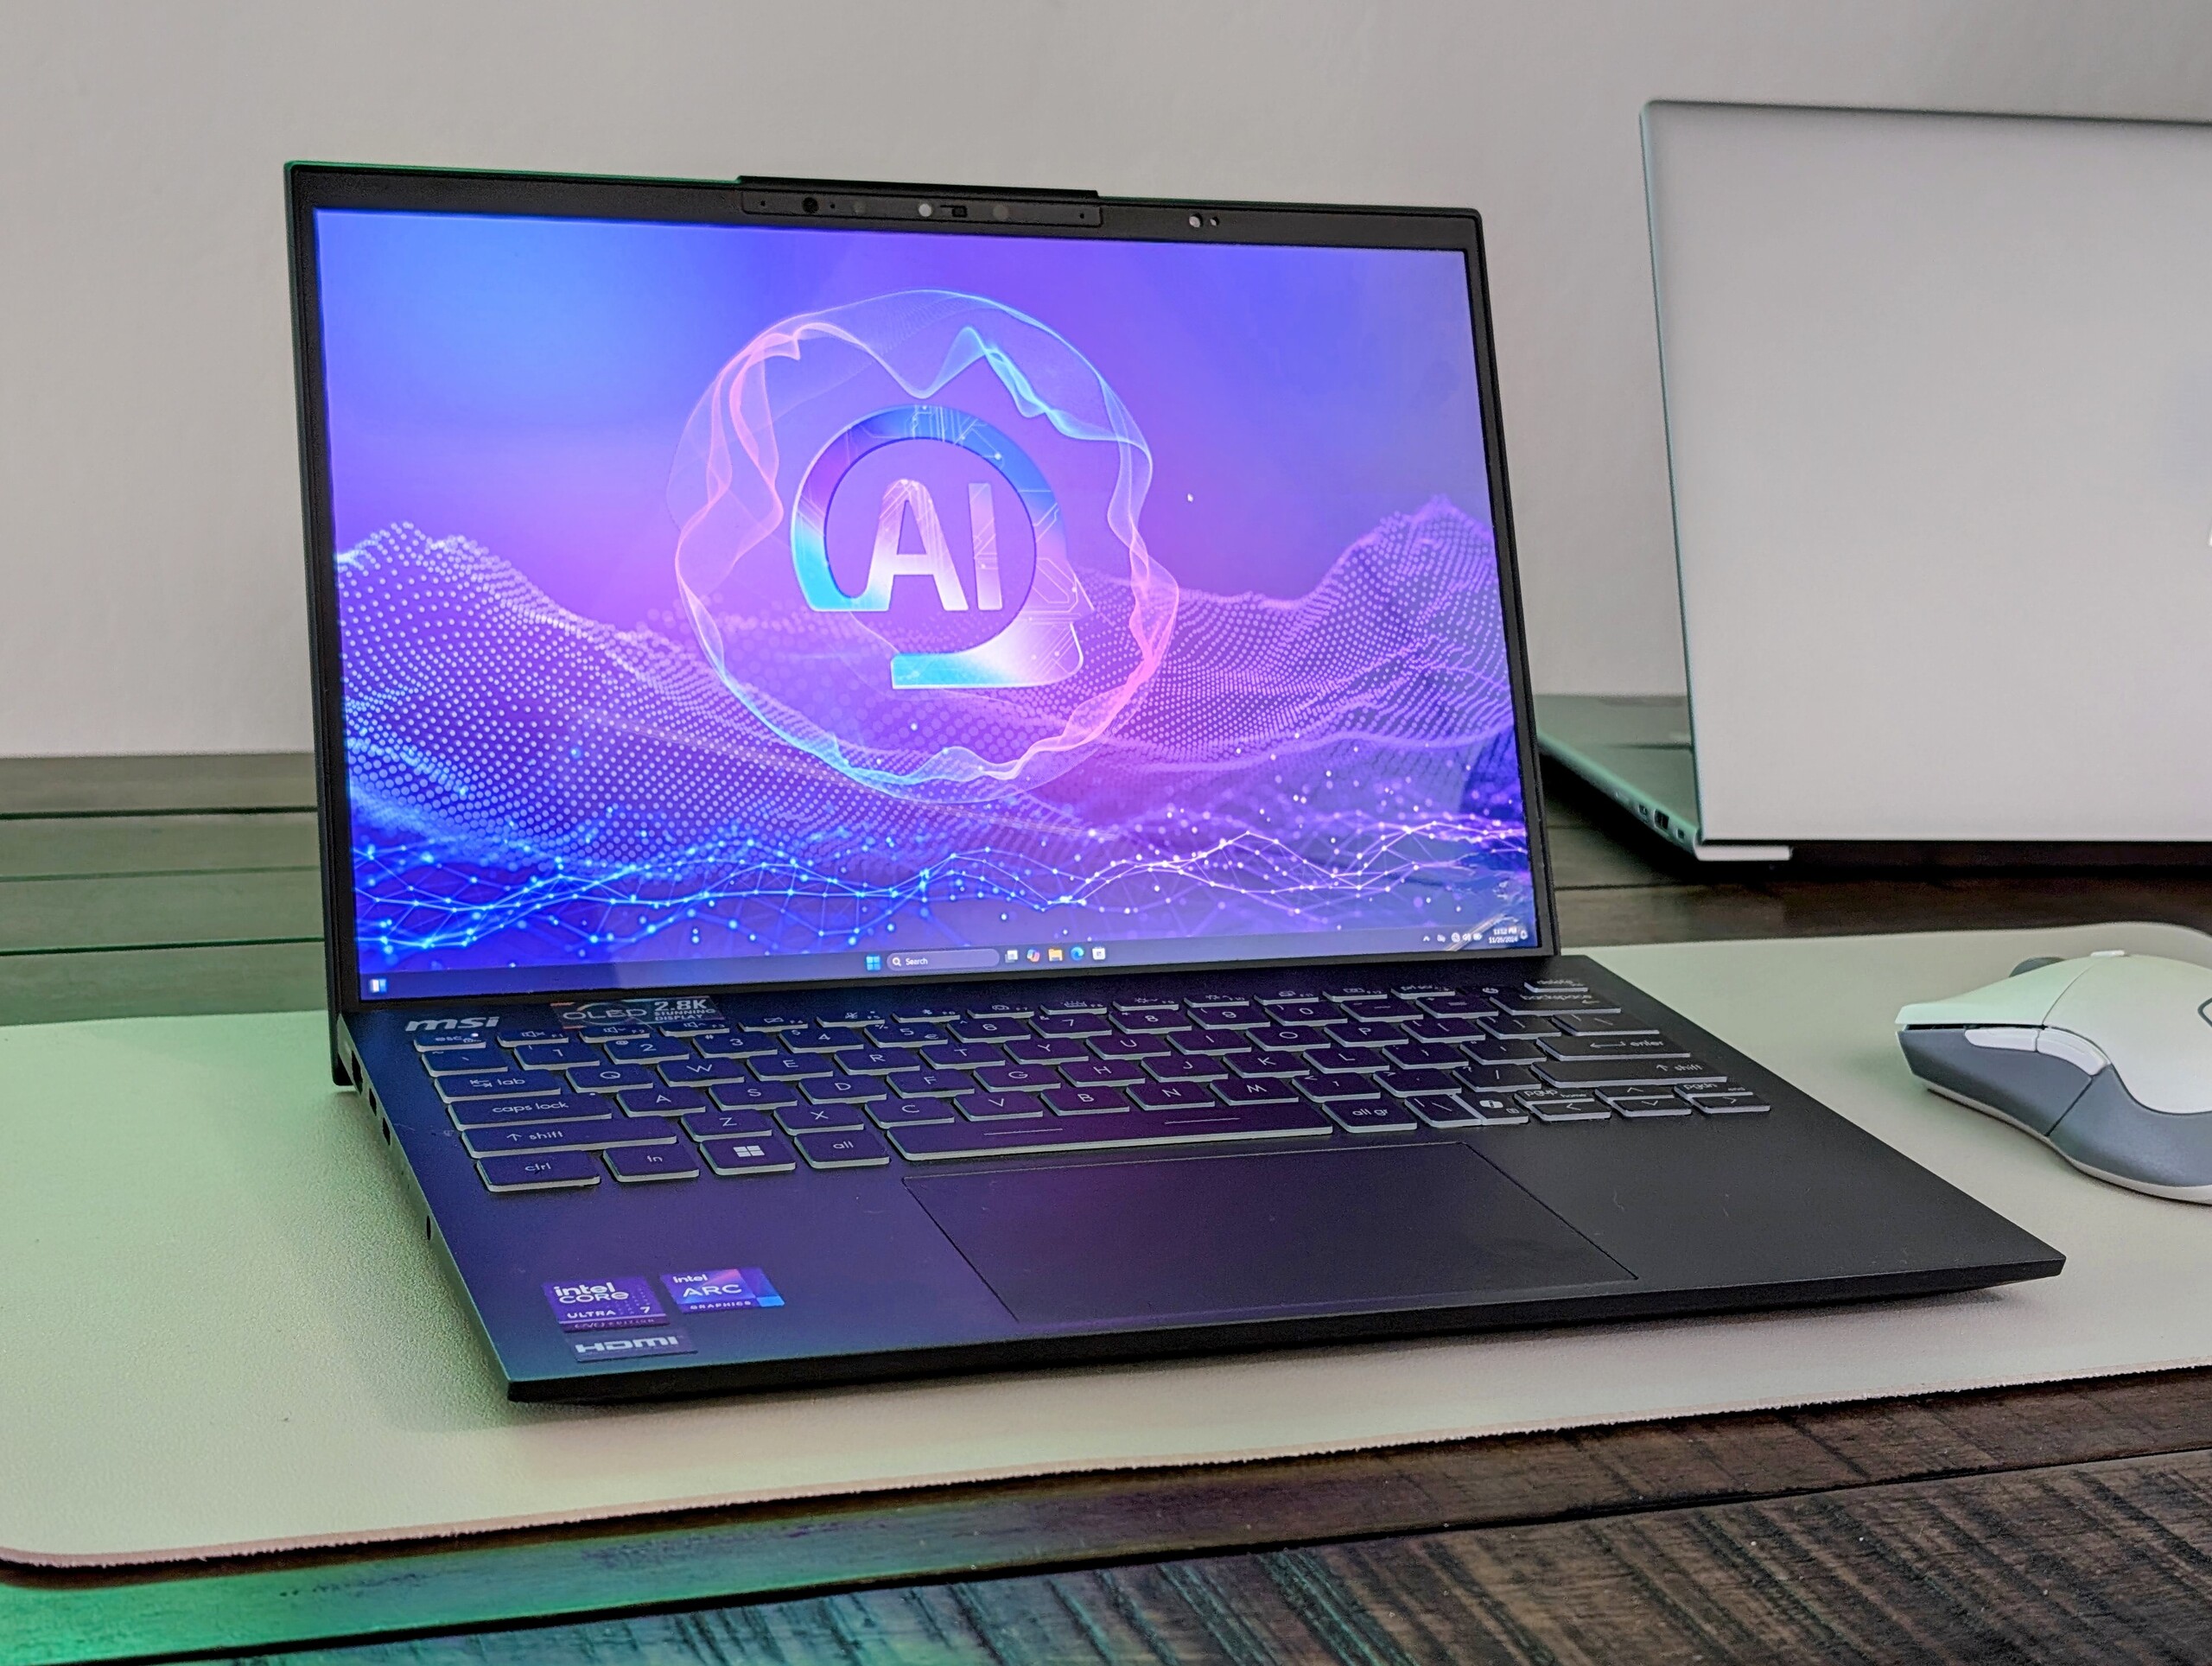
MSI Prestige 13 AI Plus Evo laptop test: Geweldige grafische prestaties voor minder dan 1 kg
Core Ultra 7 258V vs. Core Ultra 7 155H.
MSI heeft zijn lichtste 13-inch laptop opgefrist met Lunar Lake-processors ter vervanging van de oudere Meteor Lake-opties. De wijzigingen hebben zowel de levensduur van de batterij als het grafische potentieel verbeterd zonder het geluid van de ventilator of het gewicht te verhogen.Allen Ngo, 👁 Allen Ngo (vertaald door DeepL / Ninh Duy) Gepubliceerd 🇺🇸 🇫🇷 ...
Verdict - Indrukwekkende prestaties en poorten voor het gewicht
Een van onze belangrijkste klachten over de originele Prestige 13 AI Evo was de steiler dan verwachte processor throttling bij CPU-intensieve belastingen. De nieuwe Lunar Lake CPU pakt dit probleem aan door het maximale Turbo Boost-potentieel te verlagen en tegelijkertijd het minimale prestatieniveau bij dergelijke belastingen te verhogen. Dit zorgt na verloop van tijd voor stabielere en snellere prestaties, wat aantrekkelijk zou moeten zijn voor content creators of editors die grotere bestanden of video's moeten verwerken of coderen. Bovendien lijken deze voordelen geen merkbare invloed te hebben op de levensduur van de batterij, de temperatuur of het geluid van de ventilator tussen de Prestige 13 AI Evo en de nieuwere Prestige 13 AI Plus Evo.
De grafische prestaties zijn aanzienlijk verbeterd, met maar liefst 1,5x tot 2x, afhankelijk van de toepassing. Hoewel het verre van een gamingmachine is, is de Arc 140V toch indrukwekkend, gezien hoe licht de MSI-laptop is.
Hoewel de prestaties bijna overal omhoog zijn gegaan, zijn alle andere nadelen die we in onze Prestige 13 AI Evo review hebben genoemd onveranderd gebleven. Het 1800p OLED-scherm is weliswaar scherp en levendig, maar beperkt tot slechts 60 Hz zonder VRR- of aanraakschermopties. De kwaliteit van de webcam en de stevigheid van het chassis zijn ook een paar stappen lager in vergelijking met de zwaardere alternatieven van Dell of HP. Desondanks biedt de MSI veel prestaties en poorten gezien het lage gewicht.
Pro
Contra
Potentiële concurrenten in vergelijkings
Afbeelding | Model / recensie | prijs | Gewicht | Hoogte | Scherm |
|---|---|---|---|---|---|
| MSI Prestige 13 AI Plus Evo A2VMG Intel Core Ultra 7 258V ⎘ Intel Arc Graphics 140V ⎘ 32 GB Geheugen | Amazon: $1,349.99 Catalogusprijs: 1400 USD | 970 g | 16.9 mm | 13.30" 2880x1800 255 PPI OLED | |
| MSI Prestige 13 AI Evo Intel Core Ultra 7 155H ⎘ Intel Arc 8-Core iGPU ⎘ 32 GB Geheugen, 1024 GB SSD | Amazon: $1,349.99 Catalogusprijs: 1599€ | 967 g | 16.9 mm | 13.30" 2880x1800 OLED | |
| Dell XPS 13 9350 Intel Core Ultra 7 256V ⎘ Intel Arc Graphics 140V ⎘ 16 GB Geheugen, 512 GB SSD | Amazon: 1. $1,499.99 2025 Latest Dell XPS 13 9350... 2. $1,699.00 NewDell XPS 13 9350 Powerful... 3. $1,599.99 Dell XPS 13 9340 Business La... Catalogusprijs: 1400 USD | 1.2 kg | 15.3 mm | 13.40" 1920x1200 169 PPI IPS | |
| Framework Laptop 13.5 Core Ultra 7 155H Intel Core Ultra 7 155H ⎘ Intel Arc 8-Core iGPU ⎘ 32 GB Geheugen | Catalogusprijs: 1500 USD | 1.4 kg | 15.85 mm | 13.50" 2880x1920 256 PPI IPS | |
| Lenovo Yoga Book 9 13IMU9 Intel Core Ultra 7 155U ⎘ Intel Graphics 4-Core iGPU (Arc) ⎘ 16 GB Geheugen | Amazon: $1,699.00 Catalogusprijs: 2000 USD | 1.4 kg | 15.95 mm | 13.30" 2880x1800 255 PPI OLED | |
| HP Dragonfly G4 Intel Core i7-1365U ⎘ Intel Iris Xe Graphics G7 96EUs ⎘ 16 GB Geheugen, 512 GB SSD | Amazon: $1,286.99 Catalogusprijs: 1700 USD | 1.1 kg | 16.3 mm | 13.50" 1920x1280 171 PPI IPS |
Het is nog maar zes maanden geleden dat de originele Prestige 13 AI Evo werd gelanceerd en MSI heeft het model al opgefrist met nieuwere Intel-processors. De nieuwste versie, die de Prestige 13 AI Plus Evo wordt genoemd, wordt geleverd met Lunar Lake CPU's in plaats van Meteor Lake.
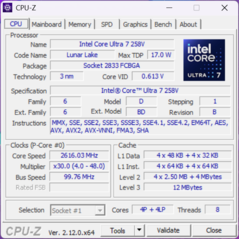
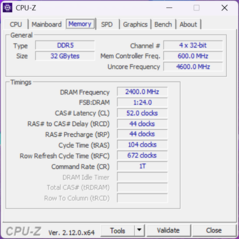
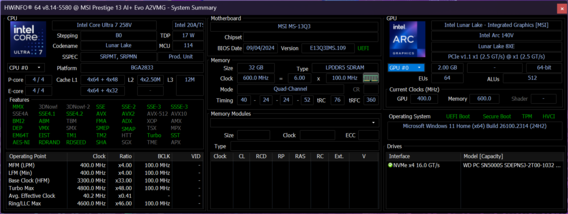
Ons testmodel is een middelste configuratie met de Core Ultra 7 258V, 32 GB LPDDR5x-8533 RAM en een 1800p OLED-scherm voor ongeveer 1400 dollar. Andere SKU's kunnen geleverd worden met een Core Ultra 9 288V of Core Ultra 7 256V met de helft van het RAM-geheugen.
Concurrenten zijn andere high-end subnotebooks zoals de Dell XPS 13 9350, Kader Laptop 13.5of de HP Dragonfly 14.
Meer MSI beoordelingen:
Top 10 Testrapporten
» Top 10 Multimedia Notebooks
» Top 10 Gaming-Notebooks
» Top 10 Budget Gaming Laptops
» Top 10 Lichtgewicht Gaming-Notebooks
» Top 10 Premium Office/Business-Notebooks
» Top 10 Budget Office/Business-Notebooks
» Top 10 Workstation-Laptops
» Top 10 Subnotebooks
» Top 10 Ultrabooks
» Top 10 Notebooks tot €300
» Top 10 Notebooks tot €500
» Top 10 Notebooks tot € 1.000De beste notebookbeeldschermen zoals getest door Notebookcheck
» De beste notebookbeeldschermen
» Top Windows Alternatieven voor de MacBook Pro 13
» Top Windows Alternatieven voor de MacBook Pro 15
» Top Windows alternatieven voor de MacBook 12 en Air
» Top 10 best verkopende notebooks op Amazon
» Top 10 Convertible Notebooks
» Top 10 Tablets
» Top 10 Tablets tot € 250
» Top 10 Smartphones
» Top 10 Phablets (>90cm²)
» Top 10 Camera Smartphones
» Top 10 Smartphones tot €500
» Top 10 best verkopende smartphones op Amazon
Specificaties
Zaak
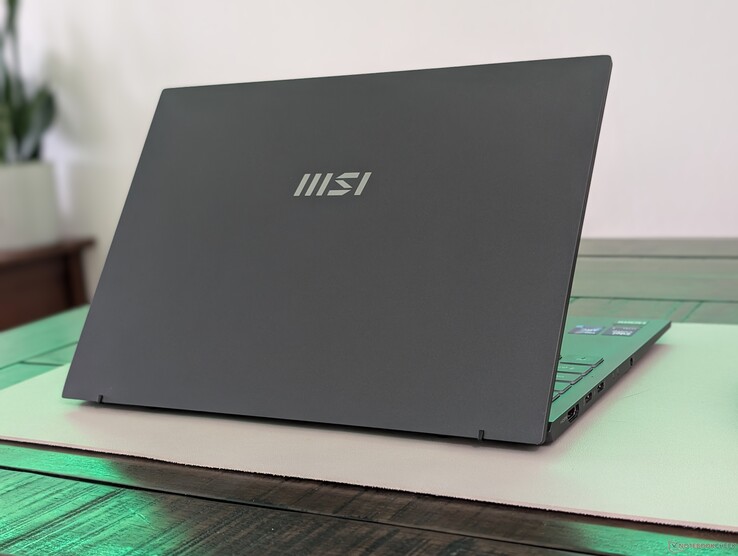
Wij raden u aan om onze recensie van de Prestige 13 AI Evo te bekijken, aangezien er geen uiterlijke verschillen zijn met onze Prestige 13 AI Plus Evo. Het systeem is met minder dan 1 kg een van de lichtste 13-inch subnotebooks op de markt, maar het chassis heeft de neiging om sneller te buigen en te kraken in vergelijking met zwaardere modellen zoals de XPS 13.
Connectiviteit
De Prestige 13 AI is een van de weinige overgebleven subnotebooks met zowel geïntegreerde HDMI- als USB-A-poorten. We waarderen het dat het systeem niet volledig vertrouwt op alleen USB-C poorten.
SD-kaartlezer
| SD Card Reader | |
| average JPG Copy Test (av. of 3 runs) | |
| Framework Laptop 13.5 Core Ultra 7 155H (Toshiba Exceria Pro SDXC 64 GB UHS-II) | |
| MSI Prestige 13 AI Evo (Angelbird AV Pro V60) | |
| MSI Prestige 13 AI Plus Evo A2VMG (Angelbird AV Pro V60) | |
| maximum AS SSD Seq Read Test (1GB) | |
| Framework Laptop 13.5 Core Ultra 7 155H (Toshiba Exceria Pro SDXC 64 GB UHS-II) | |
| MSI Prestige 13 AI Evo (Angelbird AV Pro V60) | |
| MSI Prestige 13 AI Plus Evo A2VMG (Angelbird AV Pro V60) | |
Communicatie
Interessant is dat ons apparaat geleverd wordt met de Intel Killer AX1775s in plaats van de BE1750W zoals die te vinden is op de Core Ultra 7 155H configuratie. De AX1775s biedt geen ondersteuning voor Wi-Fi 7, in tegenstelling tot de BE1750W.
Webcam
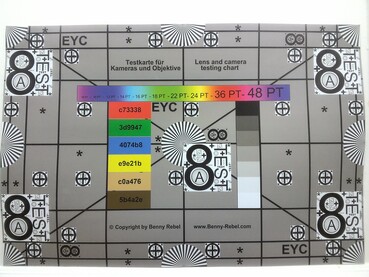
De kwaliteit van de webcam is verbeterd van 2 MP op het oorspronkelijke model naar 5 MP voor scherpere beelden.
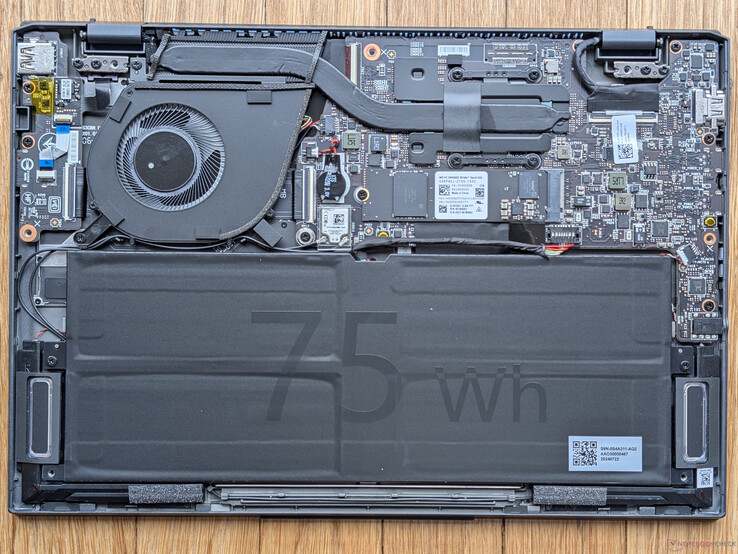
Onderhoud
Duurzaamheid
Het model volgt de EPEAT Silver richtlijnen voor duurzaamheid, terwijl de verpakking voornamelijk uit karton en papier bestaat met wat plastic om de laptop en de AC-adapter.
Weergave
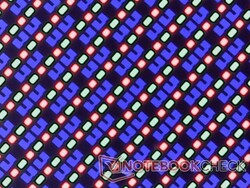
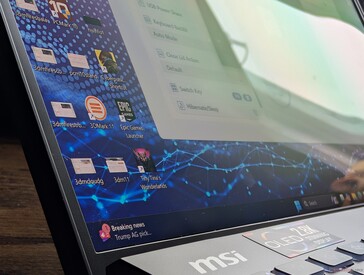
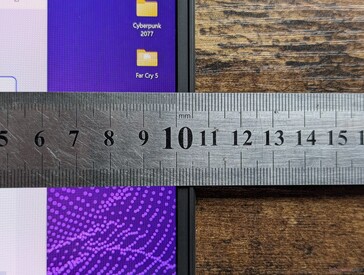
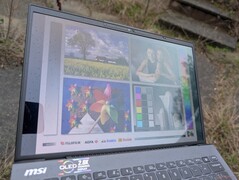
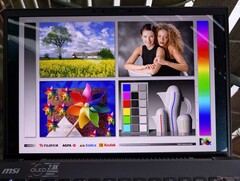
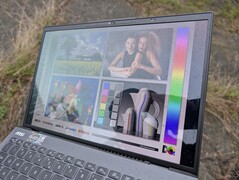
Het 1800p OLED-scherm van Samsung blijft hetzelfde als voorheen. Hoewel de beeldkwaliteit uitstekend is en er geen korreligheidsproblemen zijn, hadden we liever een upgrade van de vernieuwingsfrequentie gezien naar 90 Hz of 120 Hz, omdat 60 Hz verouderd begint te lijken voor een high-end subnotebook.
De maximale helderheid kan oplopen tot 598 nits in HDR-modus. In andere gevallen piekt de helderheid bij 382 nits in de SDR-modus.
| |||||||||||||||||||||||||
Helderheidsverdeling: 99 %
Helderheid in Batterij-modus: 382.4 cd/m²
Contrast: ∞:1 (Zwart: 0 cd/m²)
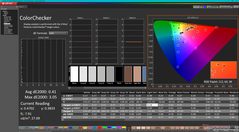
ΔE Color 3.84 | 0.5-29.43 Ø4.86, calibrated: 0.41
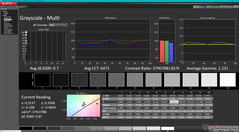
ΔE Greyscale 0.7 | 0.5-98 Ø5.1
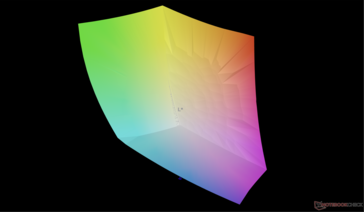
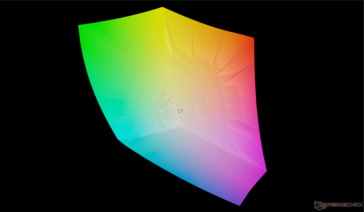
95.8% AdobeRGB 1998 (Argyll 2.2.0 3D)
100% sRGB (Argyll 2.2.0 3D)
99.9% Display P3 (Argyll 2.2.0 3D)
Gamma: 2.23
| MSI Prestige 13 AI Plus Evo A2VMG ATNA33AA07-0, OLED, 2880x1800, 13.3", 60 Hz | MSI Prestige 13 AI Evo ATNA33AA07-0, OLED, 2880x1800, 13.3", 60 Hz | Dell XPS 13 9350 LG Philips 134WU2, IPS, 1920x1200, 13.4", 120 Hz | Framework Laptop 13.5 Core Ultra 7 155H BOE NE135A1M-NY1, IPS, 2880x1920, 13.5", 120 Hz | Lenovo Yoga Book 9 13IMU9 SDC ATNA33AA02-0, OLED, 2880x1800, 13.3", 60 Hz | HP Dragonfly G4 Chi Mei CMN13C0, IPS, 1920x1280, 13.5", 60 Hz | |
|---|---|---|---|---|---|---|
| Display | 1% | -21% | -17% | 0% | -20% | |
| Display P3 Coverage | 99.9 | 99.9 0% | 67.3 -33% | 72.8 -27% | 99.7 0% | 68.4 -32% |
| sRGB Coverage | 100 | 100 0% | 99 -1% | 98.6 -1% | 100 0% | 98.3 -2% |
| AdobeRGB 1998 Coverage | 95.8 | 97.8 2% | 68.6 -28% | 72.9 -24% | 97 1% | 70.4 -27% |
| Response Times | 117% | -1503% | -1567% | -0% | -1933% | |
| Response Time Grey 50% / Grey 80% * | 1.94 ? | 1.54 ? 21% | 37.3 ? -1823% | 41.9 ? -2060% | 1.88 ? 3% | 48.8 ? -2415% |
| Response Time Black / White * | 2.02 ? | 1.44 ? 29% | 25.9 ? -1182% | 23.7 ? -1073% | 2.1 ? -4% | 31.3 ? -1450% |
| PWM Frequency | 60 ? | 240 ? 300% | 60 ? 0% | |||
| Screen | 3% | 17% | -108% | -50% | -27% | |
| Brightness middle | 382.4 | 404 6% | 462.8 21% | 498.5 30% | 362.6 -5% | 408.8 7% |
| Brightness | 383 | 407 6% | 435 14% | 464 21% | 368 -4% | 399 4% |
| Brightness Distribution | 99 | 98 -1% | 87 -12% | 86 -13% | 97 -2% | 90 -9% |
| Black Level * | 0.19 | 0.36 | 0.32 | |||
| Colorchecker dE 2000 * | 3.84 | 2.1 45% | 1.92 50% | 4.27 -11% | 4.66 -21% | 2.02 47% |
| Colorchecker dE 2000 max. * | 6.66 | 4.3 35% | 3.45 48% | 7.08 -6% | 7.25 -9% | 3.84 42% |
| Colorchecker dE 2000 calibrated * | 0.41 | 0.48 -17% | 1.26 -207% | 0.56 -37% | 0.61 -49% | |
| Greyscale dE 2000 * | 0.7 | 1.2 -71% | 0.6 14% | 4.7 -571% | 2.6 -271% | 2.3 -229% |
| Gamma | 2.23 99% | 2.16 102% | 2.19 100% | 2.09 105% | 2.2 100% | 2.2 100% |
| CCT | 6475 100% | 6465 101% | 6539 99% | 7417 88% | 6055 107% | 6203 105% |
| Contrast | 2436 | 1385 | 1278 | |||
| Totaal Gemiddelde (Programma / Instellingen) | 40% /
31% | -502% /
-246% | -564% /
-329% | -17% /
-27% | -660% /
-343% |
* ... kleiner is beter
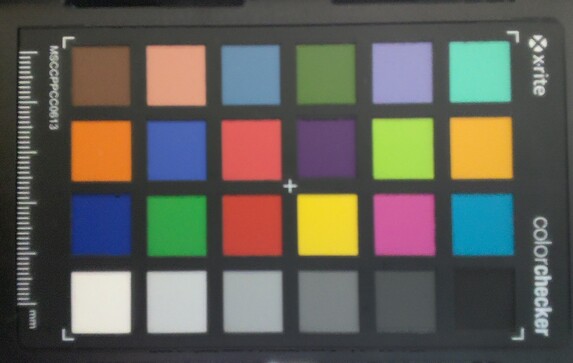
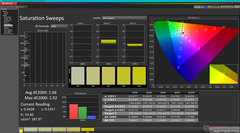
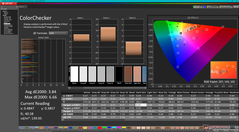
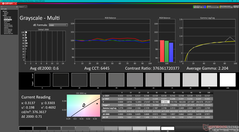
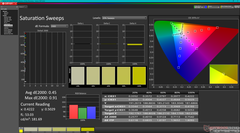
Het beeldscherm komt goed gekalibreerd uit de doos tegen de P3 standaard met gemiddelde grijswaarden en ColorChecker deltaE waarden van respectievelijk slechts 0,7 en 3,84.
Responstijd Scherm
| ↔ Responstijd Zwart naar Wit | ||
|---|---|---|
| 2.02 ms ... stijging ↗ en daling ↘ gecombineerd | ↗ 0.92 ms stijging | |
| ↘ 1.1 ms daling | ||
| Het scherm vertoonde erg snelle responstijden in onze tests en zou zeer geschikt moeten zijn voor snelle games. Ter vergelijking: alle testtoestellen variëren van 0.1 (minimum) tot 240 (maximum) ms. » 9 % van alle toestellen zijn beter. Dit betekent dat de gemeten responstijd beter is dan het gemiddelde (20.7 ms) van alle geteste toestellen. | ||
| ↔ Responstijd 50% Grijs naar 80% Grijs | ||
| 1.94 ms ... stijging ↗ en daling ↘ gecombineerd | ↗ 1 ms stijging | |
| ↘ 0.94 ms daling | ||
| Het scherm vertoonde erg snelle responstijden in onze tests en zou zeer geschikt moeten zijn voor snelle games. Ter vergelijking: alle testtoestellen variëren van 0.165 (minimum) tot 636 (maximum) ms. » 7 % van alle toestellen zijn beter. Dit betekent dat de gemeten responstijd beter is dan het gemiddelde (32.4 ms) van alle geteste toestellen. | ||
Screen Flickering / PWM (Pulse-Width Modulation)
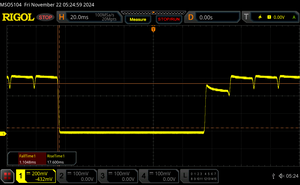
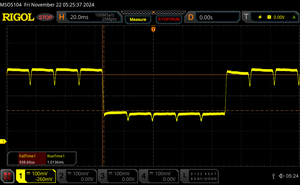
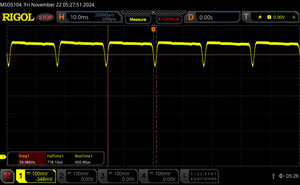
| Screen flickering / PWM waargenomen | 60 Hz Amplitude: 21.9 % | ≤ 100 % helderheid instelling | |
De achtergrondverlichting van het scherm flikkert op 60 Hz (in het slechtste geval, bijvoorbeeld bij gebruik van PWM) aan een helderheid van 100 % en lager. Boven deze helderheid zou er geen flickering / PWM mogen optreden. De frequentie van 60 Hz is erg laag en kan dus aanleiding geven tot geïrriteerde ogen en hoofdpijn bij langer gebruik. Ter vergelijking: 53 % van alle geteste toestellen maakten geen gebruik van PWM om de schermhelderheid te verlagen. Als het wel werd gebruikt, werd een gemiddelde van 8460 (minimum: 5 - maximum: 343500) Hz waargenomen. | |||
Prestaties
Testomstandigheden
We hebben zowel Windows als MSI Center ingesteld op de modus Prestaties voordat we de onderstaande benchmarks uitvoerden. De Cooler Boost-modus (ook wel de maximale ventilatormodus genoemd) is ook beschikbaar, maar deze heeft geen significante invloed op de prestaties, zoals onze onderstaande benchmarks zullen laten zien.
Processor
In vergelijking met de Core Ultra 7 155H heeft onze Core Ultra 7 258V een langzamer Turbo Boost-potentieel, maar stabielere en snellere prestaties over langere perioden. Dit is duidelijk te zien bij het uitvoeren van CineBench R15 xT in een loop, zoals te zien is in de grafiek hieronder, waar de Core Ultra 7 155H configuratie alleen tijdens het begin van de test beter presteert dan onze Core Ultra 7 258V configuratie, voordat deze uiteindelijk zwaarder throttled na slechts de eerste loop.
Cinebench R15 Multi Loop
Cinebench R23: Multi Core | Single Core
Cinebench R20: CPU (Multi Core) | CPU (Single Core)
Cinebench R15: CPU Multi 64Bit | CPU Single 64Bit
Blender: v2.79 BMW27 CPU
7-Zip 18.03: 7z b 4 | 7z b 4 -mmt1
Geekbench 6.4: Multi-Core | Single-Core
Geekbench 5.5: Multi-Core | Single-Core
HWBOT x265 Benchmark v2.2: 4k Preset
LibreOffice : 20 Documents To PDF
R Benchmark 2.5: Overall mean
* ... kleiner is beter
AIDA64: FP32 Ray-Trace | FPU Julia | CPU SHA3 | CPU Queen | FPU SinJulia | FPU Mandel | CPU AES | CPU ZLib | FP64 Ray-Trace | CPU PhotoWorxx
| Performance Rating | |
| Framework Laptop 13.5 Core Ultra 7 155H | |
| MSI Prestige 13 AI Plus Evo A2VMG | |
| Dell XPS 13 9350 | |
| Gemiddeld Intel Core Ultra 7 258V | |
| Lenovo Yoga Book 9 13IMU9 | |
| MSI Prestige 13 AI Evo | |
| HP Dragonfly G4 | |
| AIDA64 / FP32 Ray-Trace | |
| MSI Prestige 13 AI Plus Evo A2VMG | |
| Dell XPS 13 9350 | |
| Gemiddeld Intel Core Ultra 7 258V (9215 - 12781, n=14) | |
| Framework Laptop 13.5 Core Ultra 7 155H | |
| Lenovo Yoga Book 9 13IMU9 | |
| HP Dragonfly G4 | |
| MSI Prestige 13 AI Evo | |
| AIDA64 / FPU Julia | |
| MSI Prestige 13 AI Plus Evo A2VMG | |
| Dell XPS 13 9350 | |
| Framework Laptop 13.5 Core Ultra 7 155H | |
| Gemiddeld Intel Core Ultra 7 258V (48758 - 63401, n=14) | |
| MSI Prestige 13 AI Evo | |
| Lenovo Yoga Book 9 13IMU9 | |
| HP Dragonfly G4 | |
| AIDA64 / CPU SHA3 | |
| MSI Prestige 13 AI Plus Evo A2VMG | |
| Framework Laptop 13.5 Core Ultra 7 155H | |
| Dell XPS 13 9350 | |
| Gemiddeld Intel Core Ultra 7 258V (2271 - 2817, n=14) | |
| Lenovo Yoga Book 9 13IMU9 | |
| MSI Prestige 13 AI Evo | |
| HP Dragonfly G4 | |
| AIDA64 / CPU Queen | |
| Framework Laptop 13.5 Core Ultra 7 155H | |
| HP Dragonfly G4 | |
| MSI Prestige 13 AI Evo | |
| MSI Prestige 13 AI Plus Evo A2VMG | |
| Gemiddeld Intel Core Ultra 7 258V (49510 - 49818, n=14) | |
| Dell XPS 13 9350 | |
| Lenovo Yoga Book 9 13IMU9 | |
| AIDA64 / FPU SinJulia | |
| Framework Laptop 13.5 Core Ultra 7 155H | |
| MSI Prestige 13 AI Evo | |
| Lenovo Yoga Book 9 13IMU9 | |
| HP Dragonfly G4 | |
| Dell XPS 13 9350 | |
| MSI Prestige 13 AI Plus Evo A2VMG | |
| Gemiddeld Intel Core Ultra 7 258V (4103 - 4440, n=14) | |
| AIDA64 / FPU Mandel | |
| MSI Prestige 13 AI Plus Evo A2VMG | |
| Dell XPS 13 9350 | |
| Gemiddeld Intel Core Ultra 7 258V (25361 - 33565, n=14) | |
| Framework Laptop 13.5 Core Ultra 7 155H | |
| MSI Prestige 13 AI Evo | |
| Lenovo Yoga Book 9 13IMU9 | |
| HP Dragonfly G4 | |
| AIDA64 / CPU AES | |
| Framework Laptop 13.5 Core Ultra 7 155H | |
| MSI Prestige 13 AI Evo | |
| Lenovo Yoga Book 9 13IMU9 | |
| Dell XPS 13 9350 | |
| MSI Prestige 13 AI Plus Evo A2VMG | |
| Gemiddeld Intel Core Ultra 7 258V (37728 - 40753, n=14) | |
| HP Dragonfly G4 | |
| AIDA64 / CPU ZLib | |
| Framework Laptop 13.5 Core Ultra 7 155H | |
| Lenovo Yoga Book 9 13IMU9 | |
| MSI Prestige 13 AI Plus Evo A2VMG | |
| Gemiddeld Intel Core Ultra 7 258V (499 - 632, n=14) | |
| MSI Prestige 13 AI Evo | |
| Dell XPS 13 9350 | |
| HP Dragonfly G4 | |
| AIDA64 / FP64 Ray-Trace | |
| MSI Prestige 13 AI Plus Evo A2VMG | |
| Dell XPS 13 9350 | |
| Gemiddeld Intel Core Ultra 7 258V (4891 - 6930, n=14) | |
| Framework Laptop 13.5 Core Ultra 7 155H | |
| Lenovo Yoga Book 9 13IMU9 | |
| MSI Prestige 13 AI Evo | |
| HP Dragonfly G4 | |
| AIDA64 / CPU PhotoWorxx | |
| MSI Prestige 13 AI Plus Evo A2VMG | |
| Gemiddeld Intel Core Ultra 7 258V (51323 - 54971, n=14) | |
| Dell XPS 13 9350 | |
| Framework Laptop 13.5 Core Ultra 7 155H | |
| Lenovo Yoga Book 9 13IMU9 | |
| MSI Prestige 13 AI Evo | |
| HP Dragonfly G4 | |
Systeemprestaties
CrossMark: Overall | Productivity | Creativity | Responsiveness
WebXPRT 3: Overall
WebXPRT 4: Overall
Mozilla Kraken 1.1: Total
| PCMark 10 / Score | |
| Dell XPS 13 9350 | |
| Gemiddeld Intel Core Ultra 7 258V, Intel Arc Graphics 140V (6265 - 7314, n=14) | |
| Framework Laptop 13.5 Core Ultra 7 155H | |
| MSI Prestige 13 AI Plus Evo A2VMG | |
| Lenovo Yoga Book 9 13IMU9 | |
| MSI Prestige 13 AI Evo | |
| HP Dragonfly G4 | |
| PCMark 10 / Essentials | |
| Lenovo Yoga Book 9 13IMU9 | |
| HP Dragonfly G4 | |
| Framework Laptop 13.5 Core Ultra 7 155H | |
| Gemiddeld Intel Core Ultra 7 258V, Intel Arc Graphics 140V (9295 - 11467, n=14) | |
| MSI Prestige 13 AI Plus Evo A2VMG | |
| Dell XPS 13 9350 | |
| MSI Prestige 13 AI Evo | |
| PCMark 10 / Productivity | |
| Dell XPS 13 9350 | |
| Gemiddeld Intel Core Ultra 7 258V, Intel Arc Graphics 140V (7357 - 9619, n=14) | |
| MSI Prestige 13 AI Evo | |
| Framework Laptop 13.5 Core Ultra 7 155H | |
| MSI Prestige 13 AI Plus Evo A2VMG | |
| Lenovo Yoga Book 9 13IMU9 | |
| HP Dragonfly G4 | |
| PCMark 10 / Digital Content Creation | |
| MSI Prestige 13 AI Plus Evo A2VMG | |
| Dell XPS 13 9350 | |
| Gemiddeld Intel Core Ultra 7 258V, Intel Arc Graphics 140V (9333 - 10048, n=14) | |
| Framework Laptop 13.5 Core Ultra 7 155H | |
| Lenovo Yoga Book 9 13IMU9 | |
| MSI Prestige 13 AI Evo | |
| HP Dragonfly G4 | |
| CrossMark / Overall | |
| Dell XPS 13 9350 | |
| MSI Prestige 13 AI Plus Evo A2VMG | |
| Gemiddeld Intel Core Ultra 7 258V, Intel Arc Graphics 140V (1590 - 1742, n=13) | |
| Framework Laptop 13.5 Core Ultra 7 155H | |
| HP Dragonfly G4 | |
| Lenovo Yoga Book 9 13IMU9 | |
| MSI Prestige 13 AI Evo | |
| CrossMark / Productivity | |
| Dell XPS 13 9350 | |
| MSI Prestige 13 AI Plus Evo A2VMG | |
| Gemiddeld Intel Core Ultra 7 258V, Intel Arc Graphics 140V (1558 - 1684, n=13) | |
| HP Dragonfly G4 | |
| Framework Laptop 13.5 Core Ultra 7 155H | |
| MSI Prestige 13 AI Evo | |
| Lenovo Yoga Book 9 13IMU9 | |
| CrossMark / Creativity | |
| MSI Prestige 13 AI Plus Evo A2VMG | |
| Dell XPS 13 9350 | |
| Gemiddeld Intel Core Ultra 7 258V, Intel Arc Graphics 140V (1727 - 1977, n=13) | |
| Framework Laptop 13.5 Core Ultra 7 155H | |
| HP Dragonfly G4 | |
| Lenovo Yoga Book 9 13IMU9 | |
| MSI Prestige 13 AI Evo | |
| CrossMark / Responsiveness | |
| HP Dragonfly G4 | |
| Framework Laptop 13.5 Core Ultra 7 155H | |
| Dell XPS 13 9350 | |
| MSI Prestige 13 AI Plus Evo A2VMG | |
| Gemiddeld Intel Core Ultra 7 258V, Intel Arc Graphics 140V (1251 - 1411, n=13) | |
| MSI Prestige 13 AI Evo | |
| Lenovo Yoga Book 9 13IMU9 | |
| WebXPRT 3 / Overall | |
| Dell XPS 13 9350 | |
| HP Dragonfly G4 | |
| MSI Prestige 13 AI Plus Evo A2VMG | |
| Framework Laptop 13.5 Core Ultra 7 155H | |
| Gemiddeld Intel Core Ultra 7 258V, Intel Arc Graphics 140V (219 - 314, n=12) | |
| Lenovo Yoga Book 9 13IMU9 | |
| MSI Prestige 13 AI Evo | |
| WebXPRT 4 / Overall | |
| MSI Prestige 13 AI Plus Evo A2VMG | |
| Dell XPS 13 9350 | |
| Gemiddeld Intel Core Ultra 7 258V, Intel Arc Graphics 140V (199.5 - 291, n=14) | |
| HP Dragonfly G4 | |
| Framework Laptop 13.5 Core Ultra 7 155H | |
| Lenovo Yoga Book 9 13IMU9 | |
| MSI Prestige 13 AI Evo | |
| Mozilla Kraken 1.1 / Total | |
| Lenovo Yoga Book 9 13IMU9 | |
| MSI Prestige 13 AI Evo | |
| Framework Laptop 13.5 Core Ultra 7 155H | |
| HP Dragonfly G4 | |
| Gemiddeld Intel Core Ultra 7 258V, Intel Arc Graphics 140V (468 - 559, n=14) | |
| MSI Prestige 13 AI Plus Evo A2VMG | |
| Dell XPS 13 9350 | |
* ... kleiner is beter
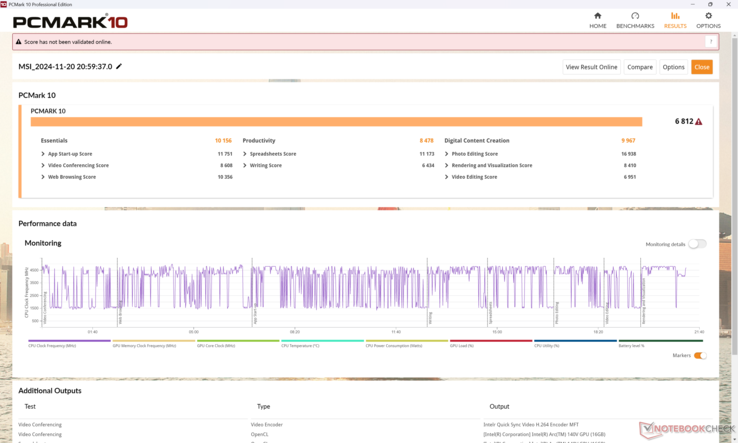
| PCMark 10 Score | 6812 punten | |
Help | ||
| AIDA64 / Memory Copy | |
| Gemiddeld Intel Core Ultra 7 258V (107682 - 114336, n=14) | |
| MSI Prestige 13 AI Plus Evo A2VMG | |
| Dell XPS 13 9350 | |
| MSI Prestige 13 AI Evo | |
| Lenovo Yoga Book 9 13IMU9 | |
| Framework Laptop 13.5 Core Ultra 7 155H | |
| HP Dragonfly G4 | |
| AIDA64 / Memory Read | |
| Dell XPS 13 9350 | |
| Gemiddeld Intel Core Ultra 7 258V (82846 - 89417, n=14) | |
| MSI Prestige 13 AI Plus Evo A2VMG | |
| Framework Laptop 13.5 Core Ultra 7 155H | |
| MSI Prestige 13 AI Evo | |
| Lenovo Yoga Book 9 13IMU9 | |
| HP Dragonfly G4 | |
| AIDA64 / Memory Write | |
| MSI Prestige 13 AI Plus Evo A2VMG | |
| Gemiddeld Intel Core Ultra 7 258V (109734 - 117935, n=14) | |
| Dell XPS 13 9350 | |
| MSI Prestige 13 AI Evo | |
| Framework Laptop 13.5 Core Ultra 7 155H | |
| HP Dragonfly G4 | |
| Lenovo Yoga Book 9 13IMU9 | |
| AIDA64 / Memory Latency | |
| MSI Prestige 13 AI Evo | |
| Lenovo Yoga Book 9 13IMU9 | |
| Framework Laptop 13.5 Core Ultra 7 155H | |
| MSI Prestige 13 AI Plus Evo A2VMG | |
| Dell XPS 13 9350 | |
| Gemiddeld Intel Core Ultra 7 258V (95 - 101.1, n=14) | |
| HP Dragonfly G4 | |
* ... kleiner is beter
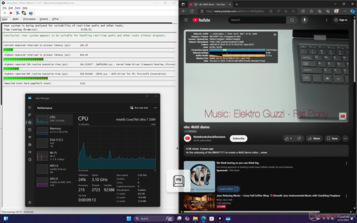
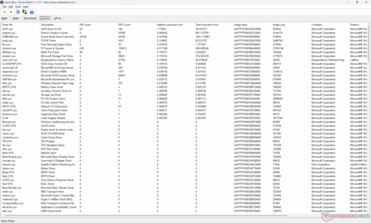
DPC latentie
| DPC Latencies / LatencyMon - interrupt to process latency (max), Web, Youtube, Prime95 | |
| MSI Prestige 13 AI Evo | |
| Lenovo Yoga Book 9 13IMU9 | |
| HP Dragonfly G4 | |
| MSI Prestige 13 AI Plus Evo A2VMG | |
| Framework Laptop 13.5 Core Ultra 7 155H | |
* ... kleiner is beter
Opslagapparaten
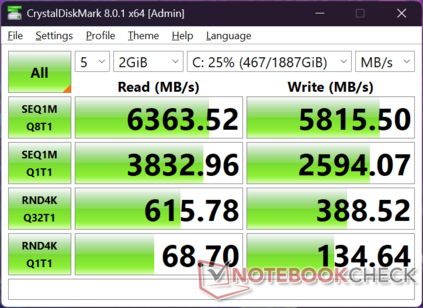
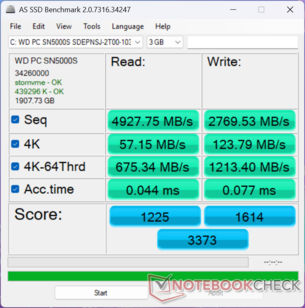
Onze eenheid wordt geleverd met de WD SN5000S in plaats van de Samsung PM9A1 zoals op onze Core Ultra 7 155H configuratie. De schijf vertoont geen van de throttling-problemen die we ondervonden op de originele Prestige 13 AI.
| Drive Performance Rating - Percent | |
| MSI Prestige 13 AI Evo | |
| Framework Laptop 13.5 Core Ultra 7 155H | |
| HP Dragonfly G4 | |
| MSI Prestige 13 AI Plus Evo A2VMG | |
| Lenovo Yoga Book 9 13IMU9 | |
| Dell XPS 13 9350 | |
* ... kleiner is beter
Disk Throttling: DiskSpd Read Loop, Queue Depth 8
GPU-prestaties
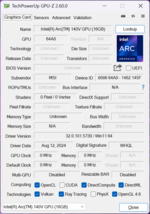
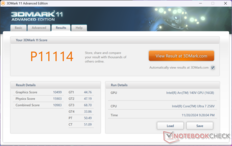
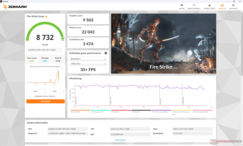
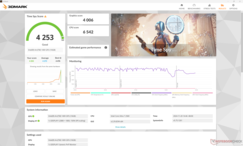
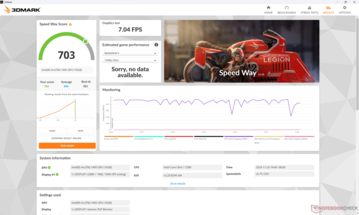
De nieuwe geïntegreerde Arc 140V GPU is waarschijnlijk een van de grootste upgrades ten opzichte van de Arc 8 in de Core Ultra 7 155H configuratie. 3DMark resultaten zijn 1,5x tot 2x sneller en dit vertaalt zich vrij goed naar gaming scenario's zoals GTA V of zelfs Cyberpunk 2077 waar de Core Ultra 7 155H configuratie de neiging heeft om ondermaats te presteren.
| Vermogen Profiel | Grafische Score | Fysica Score | Gecombineerde Score |
| Prestatiemodus (Cooler Boost aan) | 9513 | 21842 | 3426 |
| Prestatiemodus (Koeler Boost uit) | 9503 | 22043 | 3474 |
| Gebalanceerde modus | 9376 | 21037 | 3019 |
| Batterijvoeding | 9471 | 21837 | 3440 |
Als u het systeem laat draaien met Cooler Boost ingeschakeld of in de gebalanceerde modus of zelfs alleen op batterijvoeding, heeft dit geen significante invloed op de prestaties, zoals onze bovenstaande tabel met Fire Strike resultaten laat zien.
| 3DMark 11 Performance | 11114 punten | |
| 3DMark Cloud Gate Standard Score | 33012 punten | |
| 3DMark Fire Strike Score | 8732 punten | |
| 3DMark Time Spy Score | 4253 punten | |
| 3DMark Steel Nomad Score | 681 punten | |
Help | ||
* ... kleiner is beter
| Performance Rating - Percent | |
| MSI Prestige 13 AI Plus Evo A2VMG | |
| Dell XPS 13 9350 | |
| Framework Laptop 13.5 Core Ultra 7 155H | |
| MSI Prestige 13 AI Evo -2! | |
| Lenovo Yoga Book 9 13IMU9 -2! | |
| HP Dragonfly G4 -2! | |
| Cyberpunk 2077 2.2 Phantom Liberty - 1920x1080 Ultra Preset (FSR off) | |
| MSI Prestige 13 AI Plus Evo A2VMG | |
| Framework Laptop 13.5 Core Ultra 7 155H | |
| Dell XPS 13 9350 | |
| Lenovo Yoga Book 9 13IMU9 | |
| Baldur's Gate 3 - 1920x1080 Ultra Preset | |
| MSI Prestige 13 AI Plus Evo A2VMG | |
| Framework Laptop 13.5 Core Ultra 7 155H | |
| Dell XPS 13 9350 | |
| GTA V - 1920x1080 Highest Settings possible AA:4xMSAA + FX AF:16x | |
| MSI Prestige 13 AI Plus Evo A2VMG | |
| Dell XPS 13 9350 | |
| Framework Laptop 13.5 Core Ultra 7 155H | |
| HP Dragonfly G4 | |
| MSI Prestige 13 AI Evo | |
| Final Fantasy XV Benchmark - 1920x1080 High Quality | |
| MSI Prestige 13 AI Plus Evo A2VMG | |
| Dell XPS 13 9350 | |
| Framework Laptop 13.5 Core Ultra 7 155H | |
| MSI Prestige 13 AI Evo | |
| HP Dragonfly G4 | |
| Lenovo Yoga Book 9 13IMU9 | |
| Strange Brigade - 1920x1080 ultra AA:ultra AF:16 | |
| Dell XPS 13 9350 | |
| MSI Prestige 13 AI Plus Evo A2VMG | |
| Framework Laptop 13.5 Core Ultra 7 155H | |
| MSI Prestige 13 AI Evo | |
| Lenovo Yoga Book 9 13IMU9 | |
| HP Dragonfly G4 | |
| Dota 2 Reborn - 1920x1080 ultra (3/3) best looking | |
| MSI Prestige 13 AI Plus Evo A2VMG | |
| Dell XPS 13 9350 | |
| Framework Laptop 13.5 Core Ultra 7 155H | |
| Lenovo Yoga Book 9 13IMU9 | |
| HP Dragonfly G4 | |
| MSI Prestige 13 AI Evo | |
| X-Plane 11.11 - 1920x1080 high (fps_test=3) | |
| MSI Prestige 13 AI Plus Evo A2VMG | |
| Framework Laptop 13.5 Core Ultra 7 155H | |
| MSI Prestige 13 AI Evo | |
| Dell XPS 13 9350 | |
| HP Dragonfly G4 | |
| Lenovo Yoga Book 9 13IMU9 | |
Cyberpunk 2077 ultra FPS Chart
| lage | gem. | hoge | ultra | |
|---|---|---|---|---|
| GTA V (2015) | 161.6 | 155.6 | 67.4 | 26.7 |
| Dota 2 Reborn (2015) | 97.2 | 87.8 | 72.1 | 83 |
| Final Fantasy XV Benchmark (2018) | 84 | 46.2 | 31.7 | |
| X-Plane 11.11 (2018) | 56.6 | 42.6 | 36.9 | |
| Far Cry 5 (2018) | 92 | 57 | 49 | 45 |
| Strange Brigade (2018) | 216 | 74.6 | 63 | 55.4 |
| Tiny Tina's Wonderlands (2022) | 72.1 | 53.3 | 36 | 28 |
| F1 22 (2022) | 96.2 | 88.5 | 63.9 | 19.9 |
| Baldur's Gate 3 (2023) | 39.6 | 33.5 | 29.8 | 29.1 |
| Cyberpunk 2077 2.2 Phantom Liberty (2023) | 46.6 | 37.4 | 32.5 | 28.5 |
Uitstoot
Systeemgeluid
Het geluid van de ventilator is over het algemeen luider dan voorheen wanneer er zwaardere belastingen zoals games worden uitgevoerd. Als Cyberpunk 2077 in de modus Prestaties wordt uitgevoerd, is het geluidsniveau van de ventilator 45 dB(A), vergeleken met bijna 51 dB(A) in de modus Cooler Boost.
Geluidsniveau
| Onbelast |
| 24.8 / 24.8 / 26.7 dB (A) |
| Belasting |
| 36.8 / 50.8 dB (A) |
 | ||
30 dB stil 40 dB(A) hoorbaar 50 dB(A) luid |
||
min: | ||
| MSI Prestige 13 AI Plus Evo A2VMG Arc 140V, Core Ultra 7 258V | MSI Prestige 13 AI Evo Arc 8-Core, Ultra 7 155H, Samsung PM9A1 MZVL21T0HCLR | Dell XPS 13 9350 Arc 140V, Core Ultra 7 256V, Micron 2550 512GB | Framework Laptop 13.5 Core Ultra 7 155H Arc 8-Core, Ultra 7 155H | Lenovo Yoga Book 9 13IMU9 Graphics 4-Core, Ultra 7 155U | HP Dragonfly G4 Iris Xe G7 96EUs, i7-1365U, Micron 3400 MTFDKBA512TFH 512GB | |
|---|---|---|---|---|---|---|
| Noise | 6% | 11% | 1% | 16% | 12% | |
| uit / omgeving * | 24.1 | 23.4 3% | 24.1 -0% | 24 -0% | 23.3 3% | 23.3 3% |
| Idle Minimum * | 24.8 | 23.4 6% | 24.4 2% | 24.1 3% | 23.3 6% | 23.5 5% |
| Idle Average * | 24.8 | 26.9 -8% | 24.4 2% | 25.1 -1% | 23.3 6% | 23.5 5% |
| Idle Maximum * | 26.7 | 26.9 -1% | 24.4 9% | 27 -1% | 24.6 8% | 26.8 -0% |
| Load Average * | 36.8 | 32 13% | 26.2 29% | 38.4 -4% | 26.2 29% | 27.2 26% |
| Cyberpunk 2077 ultra * | 44.5 | 34.2 23% | 43.7 2% | |||
| Load Maximum * | 50.8 | 40.3 21% | 45.2 11% | 45.8 10% | 27.3 46% | 35 31% |
| Witcher 3 ultra * | 32 | 27.3 | 32.7 |
* ... kleiner is beter
Temperatuur
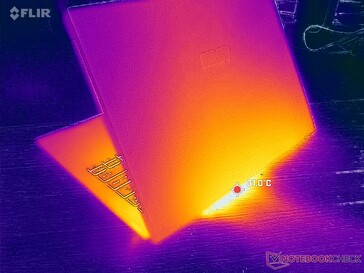
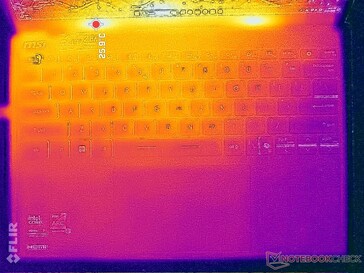
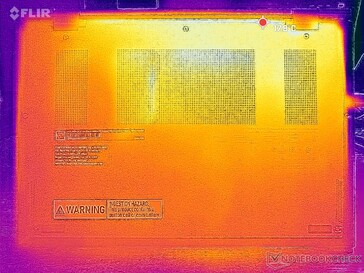
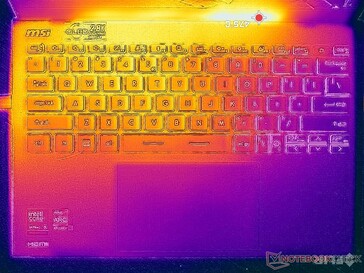
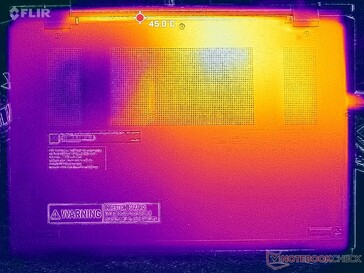
(±) De maximumtemperatuur aan de bovenzijde bedraagt 43.4 °C / 110 F, vergeleken met het gemiddelde van 35.9 °C / 97 F, variërend van 21.4 tot 59 °C voor de klasse Subnotebook.
(±) De bodem warmt op tot een maximum van 42.4 °C / 108 F, vergeleken met een gemiddelde van 39.3 °C / 103 F
(+) Bij onbelast gebruik bedraagt de gemiddelde temperatuur voor de bovenzijde 23.4 °C / 74 F, vergeleken met het apparaatgemiddelde van 30.8 °C / 87 F.
(+) De palmsteunen en het touchpad zijn met een maximum van ###max## °C / 85.6 F koeler dan de huidtemperatuur en voelen daarom koel aan.
(±) De gemiddelde temperatuur van de handpalmsteun van soortgelijke toestellen bedroeg 28.2 °C / 82.8 F (-1.6 °C / -2.8 F).
| MSI Prestige 13 AI Plus Evo A2VMG Intel Core Ultra 7 258V, Intel Arc Graphics 140V | MSI Prestige 13 AI Evo Intel Core Ultra 7 155H, Intel Arc 8-Core iGPU | Dell XPS 13 9350 Intel Core Ultra 7 256V, Intel Arc Graphics 140V | Framework Laptop 13.5 Core Ultra 7 155H Intel Core Ultra 7 155H, Intel Arc 8-Core iGPU | Lenovo Yoga Book 9 13IMU9 Intel Core Ultra 7 155U, Intel Graphics 4-Core iGPU (Arc) | HP Dragonfly G4 Intel Core i7-1365U, Intel Iris Xe Graphics G7 96EUs | |
|---|---|---|---|---|---|---|
| Heat | 3% | 8% | -6% | -9% | -2% | |
| Maximum Upper Side * | 43.4 | 40.9 6% | 34.8 20% | 42.8 1% | 39.2 10% | 38.6 11% |
| Maximum Bottom * | 42.4 | 40.4 5% | 37.4 12% | 45.2 -7% | 41 3% | 40.4 5% |
| Idle Upper Side * | 25.4 | 25 2% | 25.4 -0% | 27.2 -7% | 32.2 -27% | 28.2 -11% |
| Idle Bottom * | 25.6 | 25.5 -0% | 26.2 -2% | 28.6 -12% | 31.6 -23% | 29 -13% |
* ... kleiner is beter
Stresstest
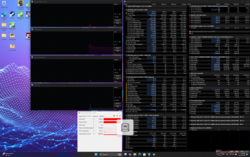
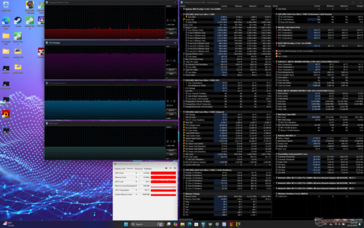
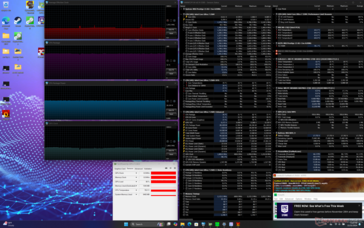
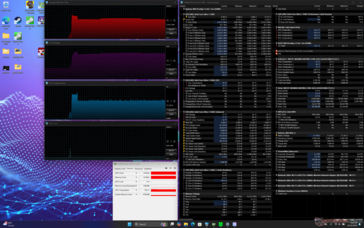
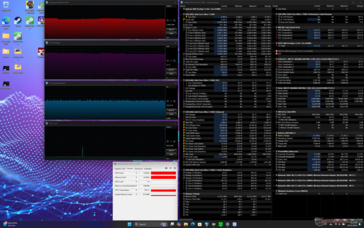
Tijdens het uitvoeren van Prime95 stress, zou de CPU ongeveer 30 seconden lang opvoeren naar 3,6 GHz, 40 W en 82 C. Daarna zou hij snel weer dalen en stabiliseren op 2,9 GHz en 27 W om een koelere kerntemperatuur van 77 C te handhaven. Daarna daalt hij snel en stabiliseert zich op 2,9 GHz en 27 W om een koelere kerntemperatuur van 77 C te handhaven. Als Cooler Boost is ingeschakeld, daalt de kerntemperatuur iets terwijl de kloksnelheden bijna gelijk blijven.
Bij gamen zou de kerntemperatuur stabiliseren op 75 C, vergeleken met 71 C op de Dell XPS 13 met een vergelijkbare Lunar Lake CPU.
| Gemiddelde CPU-klok (GHz) | GPU-klok (MHz) | Gemiddelde CPU-temperatuur (°C) | |
| Inactief systeem | -- | 400 | 32 |
| Prime95 Stress (Cooler Boost uit) | 2.9 | -- | 77 |
| Prime95 Stress (Cooler Boost aan) | 3.0 | -- | 75 |
| Prime95 + FurMark Stress | 1.6 | 1800 | 76 |
| Cyberpunk 2077 Stress | 1.5 | 1950 | 75 |
MSI Prestige 13 AI Plus Evo A2VMG audioanalyse
(+) | luidsprekers kunnen relatief luid spelen (84.5 dB)
Bas 100 - 315 Hz
(-) | bijna geen lage tonen - gemiddeld 19.4% lager dan de mediaan
(±) | lineariteit van de lage tonen is gemiddeld (9.6% delta ten opzichte van de vorige frequentie)
Midden 400 - 2000 Hz
(±) | hogere middens - gemiddeld 6.4% hoger dan de mediaan
(+) | de middentonen zijn lineair (5.1% delta ten opzichte van de vorige frequentie)
Hoog 2 - 16 kHz
(±) | higher highs - on average 6.1% higher than median
(+) | de hoge tonen zijn lineair (4.6% delta naar de vorige frequentie)
Algemeen 100 - 16.000 Hz
(±) | lineariteit van het totale geluid is gemiddeld (18.2% verschil met de mediaan)
Vergeleken met dezelfde klasse
» 51% van alle geteste apparaten in deze klasse waren beter, 7% vergelijkbaar, 43% slechter
» De beste had een delta van 5%, het gemiddelde was 19%, de slechtste was 53%
Vergeleken met alle geteste toestellen
» 36% van alle geteste apparaten waren beter, 8% gelijk, 56% slechter
» De beste had een delta van 4%, het gemiddelde was 24%, de slechtste was 134%
Apple MacBook Pro 16 2021 M1 Pro audioanalyse
(+) | luidsprekers kunnen relatief luid spelen (84.7 dB)
Bas 100 - 315 Hz
(+) | goede baars - slechts 3.8% verwijderd van de mediaan
(+) | de lage tonen zijn lineair (5.2% delta naar de vorige frequentie)
Midden 400 - 2000 Hz
(+) | evenwichtige middens - slechts 1.3% verwijderd van de mediaan
(+) | de middentonen zijn lineair (2.1% delta ten opzichte van de vorige frequentie)
Hoog 2 - 16 kHz
(+) | evenwichtige hoogtepunten - slechts 1.9% verwijderd van de mediaan
(+) | de hoge tonen zijn lineair (2.7% delta naar de vorige frequentie)
Algemeen 100 - 16.000 Hz
(+) | het totale geluid is lineair (4.6% verschil met de mediaan)
Vergeleken met dezelfde klasse
» 0% van alle geteste apparaten in deze klasse waren beter, 0% vergelijkbaar, 100% slechter
» De beste had een delta van 5%, het gemiddelde was 18%, de slechtste was 45%
Vergeleken met alle geteste toestellen
» 0% van alle geteste apparaten waren beter, 0% gelijk, 100% slechter
» De beste had een delta van 4%, het gemiddelde was 24%, de slechtste was 134%
Energiebeheer
Stroomverbruik
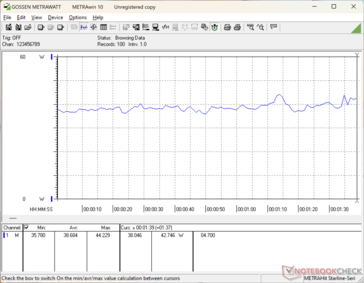
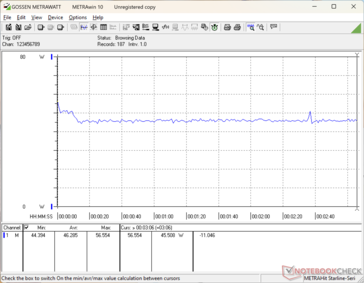
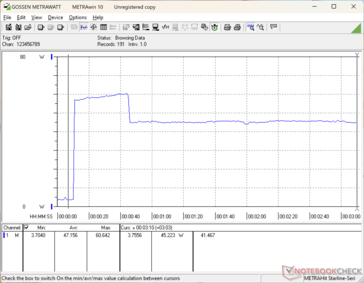
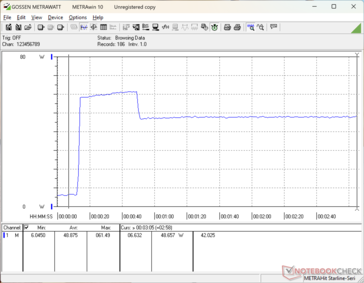
Het systeem wordt veeleisender dan de Core Ultra 7 155H configuratie wanneer zware CPU-taken over langere perioden worden uitgevoerd, omdat het niet zo zwaar throttled. Het verbruik is ook ongeveer 50% hoger tijdens het gamen, wat overeenkomt met de veel snellere grafische prestaties.
| Uit / Standby | |
| Inactief | |
| Belasting |
|
Key:
min: | |
| MSI Prestige 13 AI Plus Evo A2VMG Core Ultra 7 258V, Arc 140V, , OLED, 2880x1800, 13.3" | MSI Prestige 13 AI Evo Ultra 7 155H, Arc 8-Core, Samsung PM9A1 MZVL21T0HCLR, OLED, 2880x1800, 13.3" | Dell XPS 13 9350 Core Ultra 7 256V, Arc 140V, Micron 2550 512GB, IPS, 1920x1200, 13.4" | Framework Laptop 13.5 Core Ultra 7 155H Ultra 7 155H, Arc 8-Core, , IPS, 2880x1920, 13.5" | Lenovo Yoga Book 9 13IMU9 Ultra 7 155U, Graphics 4-Core, , OLED, 2880x1800, 13.3" | HP Dragonfly G4 i7-1365U, Iris Xe G7 96EUs, Micron 3400 MTFDKBA512TFH 512GB, IPS, 1920x1280, 13.5" | |
|---|---|---|---|---|---|---|
| Power Consumption | -10% | 27% | 4% | -56% | -5% | |
| Idle Minimum * | 3.5 | 4.5 -29% | 1.3 63% | 2.5 29% | 7.1 -103% | 4.1 -17% |
| Idle Average * | 5.9 | 8 -36% | 2.5 58% | 5.2 12% | 9.1 -54% | 7.5 -27% |
| Idle Maximum * | 10 | 8.7 13% | 4.1 59% | 5.8 42% | 18.4 -84% | 8.2 18% |
| Load Average * | 38.7 | 36.1 7% | 40.1 -4% | 47.5 -23% | 51.3 -33% | 35.5 8% |
| Cyberpunk 2077 ultra external monitor * | 45.6 | 43.1 5% | 52.4 -15% | |||
| Cyberpunk 2077 ultra * | 46.3 | 46.1 -0% | 54.5 -18% | |||
| Load Maximum * | 61.5 | 65 -6% | 57.3 7% | 61.5 -0% | 65.5 -7% | 66.5 -8% |
| Witcher 3 ultra * | 29.7 | 41.5 | 37.5 |
* ... kleiner is beter
Power Consumption Cyberpunk / Stress Test
Power Consumption external Monitor
Levensduur batterij
Dankzij de efficiëntere Lunar Lake processor zijn de looptijden bijna twee uur langer dan bij de Core Ultra 7 155H configuratie.
| MSI Prestige 13 AI Plus Evo A2VMG Core Ultra 7 258V, Arc 140V, 75 Wh | MSI Prestige 13 AI Evo Ultra 7 155H, Arc 8-Core, 75 Wh | Dell XPS 13 9350 Core Ultra 7 256V, Arc 140V, 55 Wh | Framework Laptop 13.5 Core Ultra 7 155H Ultra 7 155H, Arc 8-Core, 61 Wh | Lenovo Yoga Book 9 13IMU9 Ultra 7 155U, Graphics 4-Core, 80 Wh | HP Dragonfly G4 i7-1365U, Iris Xe G7 96EUs, 68 Wh | |
|---|---|---|---|---|---|---|
| Batterijduur | -14% | 54% | -22% | -24% | 19% | |
| WiFi v1.3 | 804 | 694 -14% | 1236 54% | 630 -22% | 608 -24% | 954 19% |
| H.264 | 1002 | |||||
| Load | 169 | 142 | 90 | 192 | ||
| Reader / Idle | 3407 | 2296 | 2550 |
Notebookcheck Beoordeling
MSI Prestige 13 AI Plus Evo A2VMG
- 26-11-2024 v8
Allen Ngo
Transparantie
De selectie van te beoordelen apparaten wordt gemaakt door onze redactie. Het testexemplaar werd ten behoeve van deze beoordeling door de fabrikant of detailhandelaar in bruikleen aan de auteur verstrekt. De kredietverstrekker had geen invloed op deze recensie, noch ontving de fabrikant vóór publicatie een exemplaar van deze recensie. Er bestond geen verplichting om deze recensie te publiceren. Wij accepteren nooit een compensatie of betaling in ruil voor onze beoordelingen. Als onafhankelijk mediabedrijf is Notebookcheck niet onderworpen aan het gezag van fabrikanten, detailhandelaren of uitgevers.
[transparency_disclaimer]Dit is hoe Notebookcheck test
Elk jaar beoordeelt Notebookcheck onafhankelijk honderden laptops en smartphones met behulp van gestandaardiseerde procedures om ervoor te zorgen dat alle resultaten vergelijkbaar zijn. We hebben onze testmethoden al zo'n 20 jaar voortdurend ontwikkeld en daarbij de industriestandaard bepaald. In onze testlaboratoria wordt gebruik gemaakt van hoogwaardige meetapparatuur door ervaren technici en redacteuren. Deze tests omvatten een validatieproces in meerdere fasen. Ons complexe beoordelingssysteem is gebaseerd op honderden goed onderbouwde metingen en benchmarks, waardoor de objectiviteit behouden blijft. Meer informatie over onze testmethoden kunt u hier vinden.














 Total Sustainability Score:


