

Geekom XT13 Pro beoordeling: NUC mini-PC doet het zonder Meteor Lake en krijgt alleen een Intel Core i9-13900H
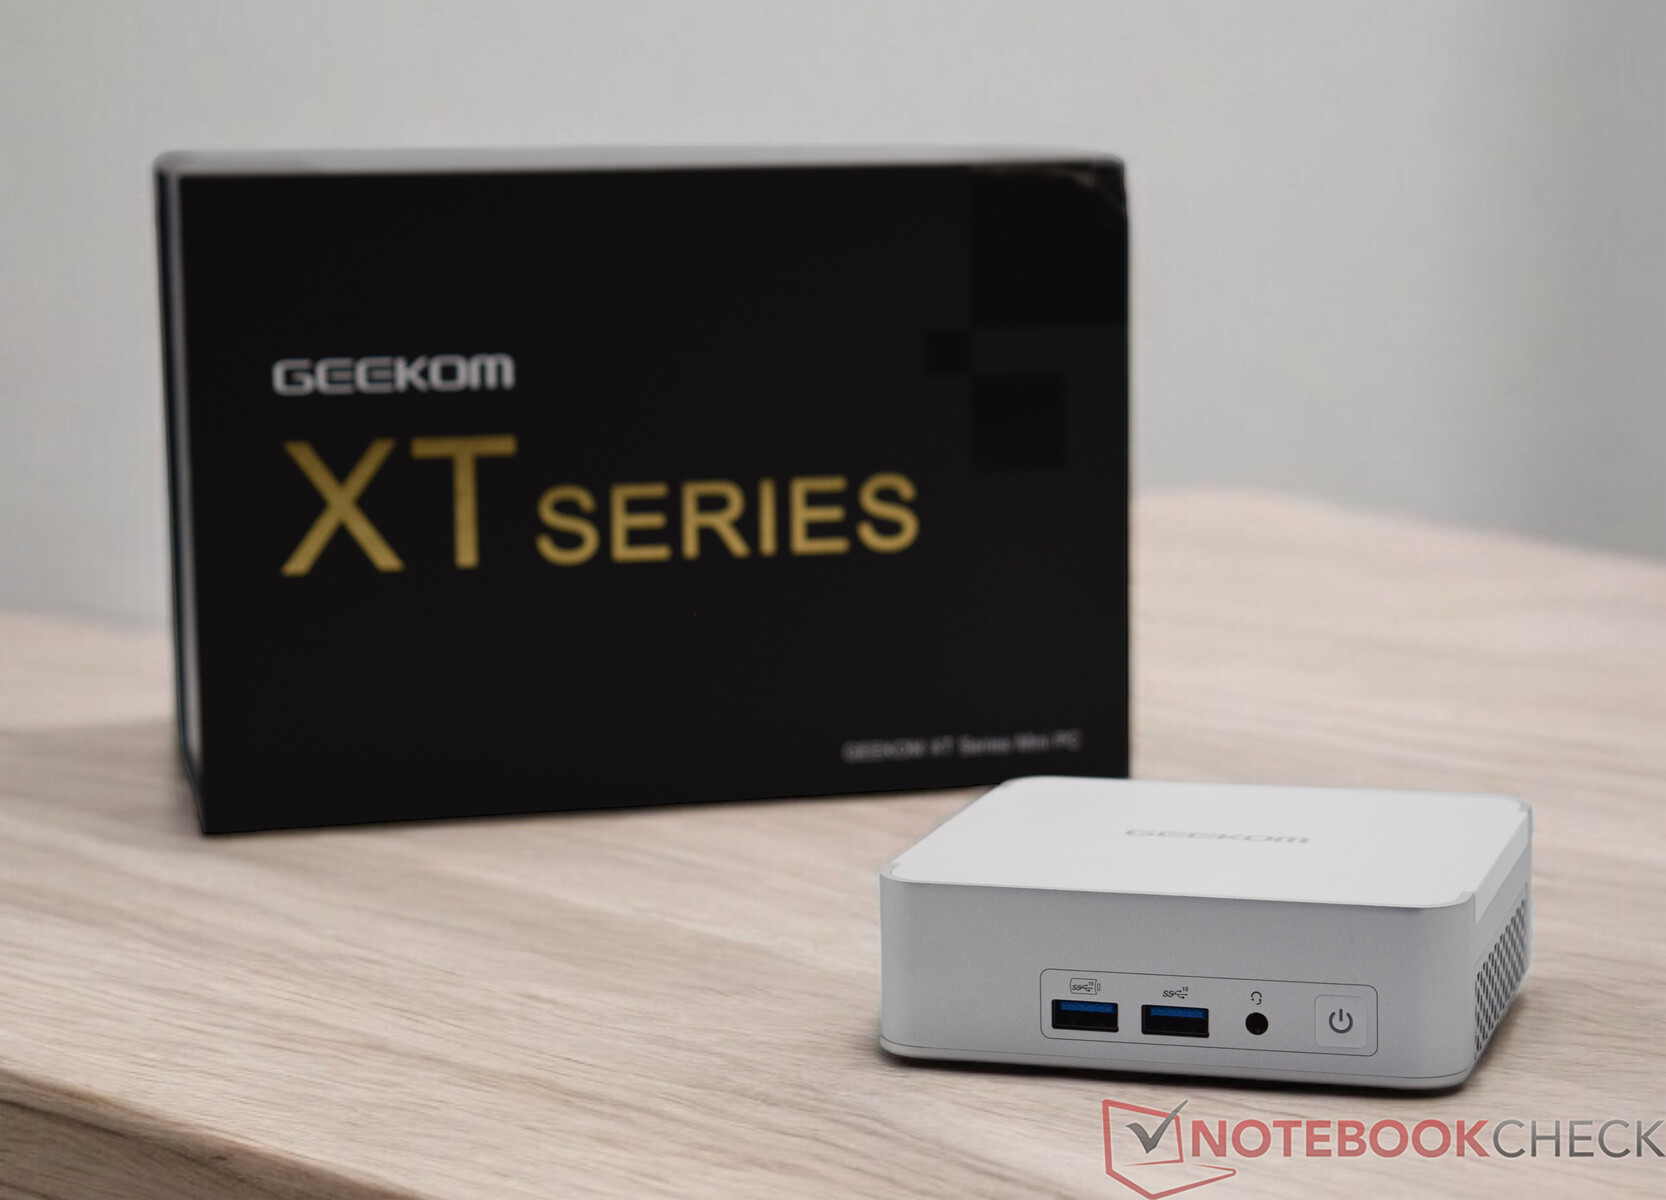
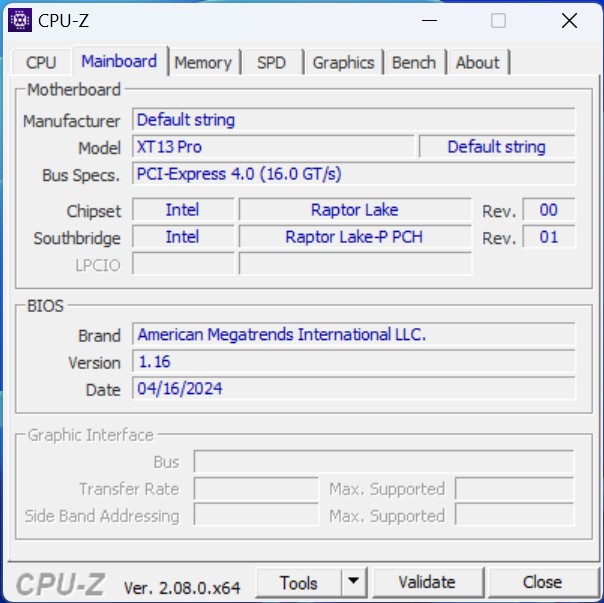
De Geekom XT13 Pro erft de Geekom XT12 Pro en wordt geleverd in de topconfiguratie met een Intel Core i9-13900H uitgerust. Er is ook 32 GB DDR4 RAM en een 2 TB SSD, hoewel hier een prijskaartje aan hangt. De prijs is 999 euro, dus het is echt geen koopje. Voor 769 euro is de Geekom XT13 Pro verkrijgbaar met een Intel Core i7-13620H en een SSD van 1 TB. Geekom heeft besloten om de nieuwere Meteor Lake processoren niet te gebruiken en houdt het bij de oudere Raptor Lake processoren. Deze test zal uitwijzen of dit de juiste manier is om de concurrentie het hoofd te bieden.
De vraag rijst ook of deze prijsstelling gerechtvaardigd is. Ook dit belangrijke punt zullen we specifiek na de prestatieanalyse behandelen. In ieder geval legt de fabrikant zelf de lat erg hoog.
Potentiële concurrenten in vergelijkings
Evaluatie | Versie | Datum | Model | Geheugen | Gewicht | Hoogte |
|---|---|---|---|---|---|---|
| 72.4 % | v8 | 08-2024 | Geekom XT13 Pro i9-13900H, Iris Xe G7 96EUs | 32768 MB | 555 g | 37 mm |
| 80.8 % | v8 | 06-2024 | Aoostar GEM12 R7 8845HS, Radeon 780M | 32768 MB | 653 g | 60 mm |
| 87.5 % v7 (old) | v7 (old) | 05-2024 | Minisforum AtomMan X7 Ti Ultra 9 185H, Arc 8-Core | 32768 MB | 863 g | 48.6 mm |
| 83.4 % v7 (old) | v7 (old) | 04-2024 | Acemagic F2A Ultra 7 155H, Arc 8-Core | 32768 MB | 768 g | 57 mm |
| 84.1 % | v8 | 04-2024 | Geekom XT12 Pro i9-12900H, Iris Xe G7 96EUs | 32768 MB | 545 g | 37 mm |
| 82.6 % v7 (old) | v7 (old) | 03-2024 | Geekom A7 R9 7940HS, Radeon 780M | 32768 MB | 417 g | 38 mm |
Opmerking: We hebben ons beoordelingssysteem bijgewerkt en de resultaten van versie 8 zijn niet vergelijkbaar met de resultaten van versie 7 die u hier.
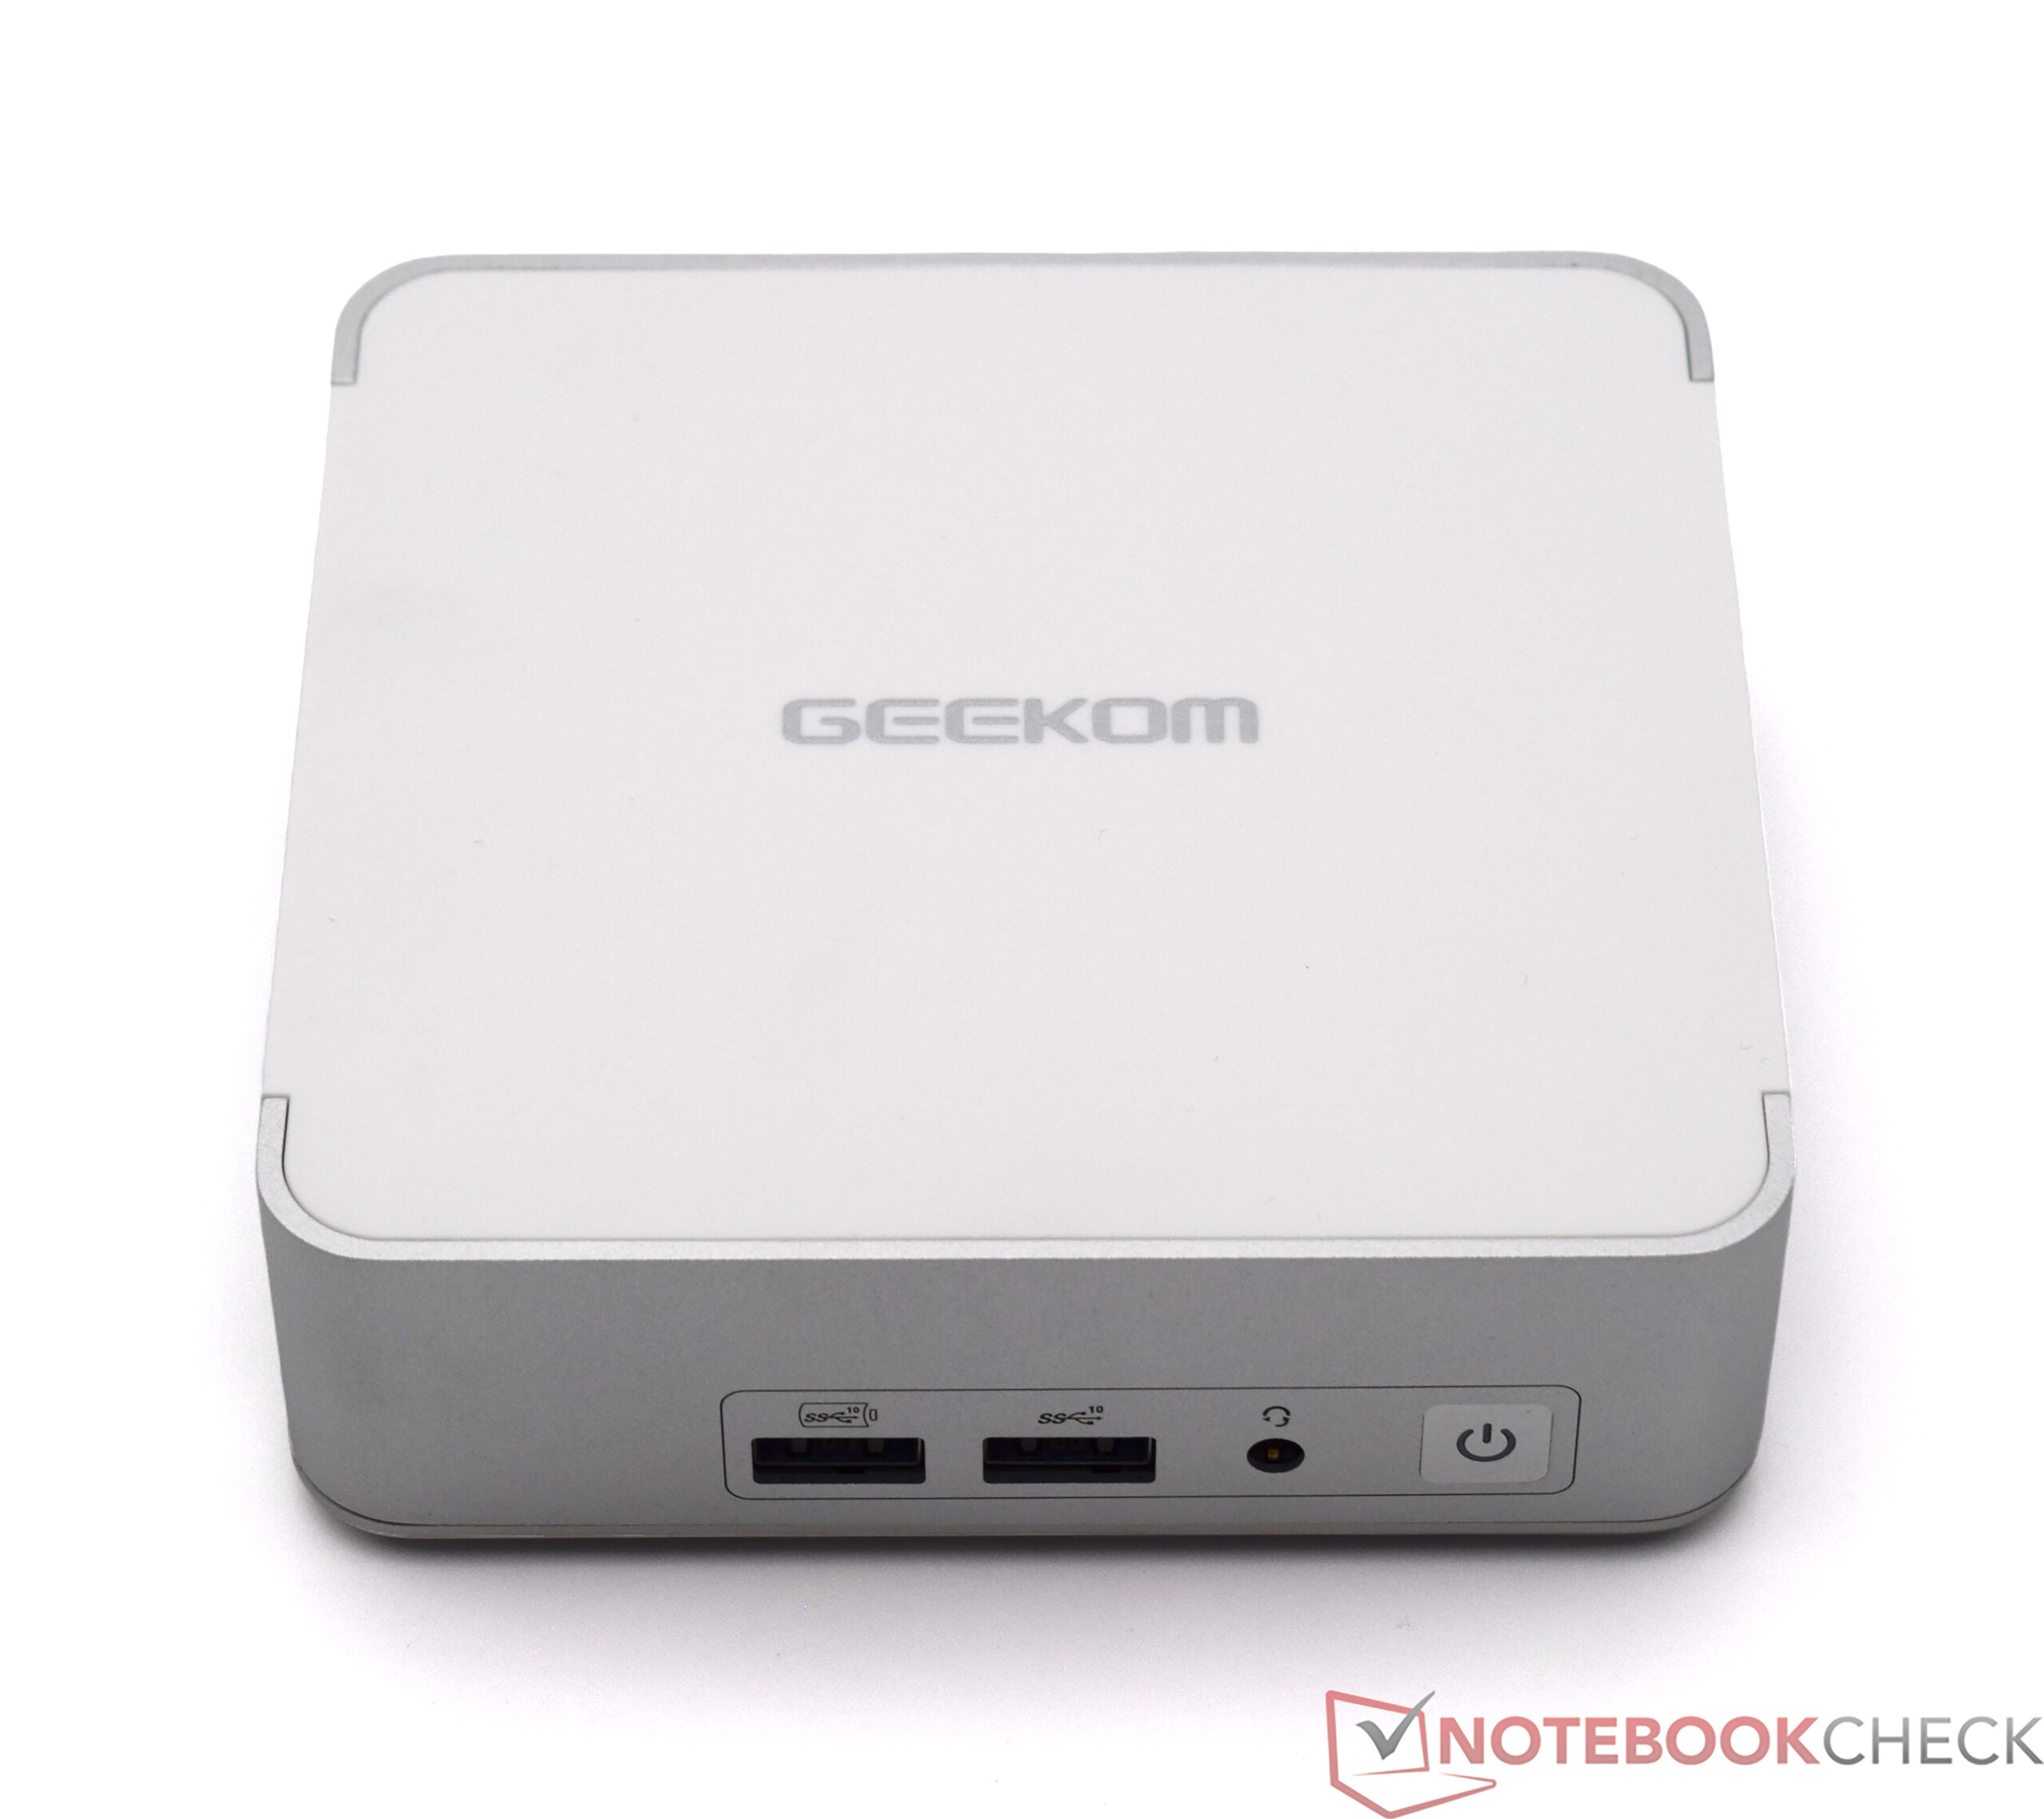
Geval - Perfecte verwerking van metaal en kunststof
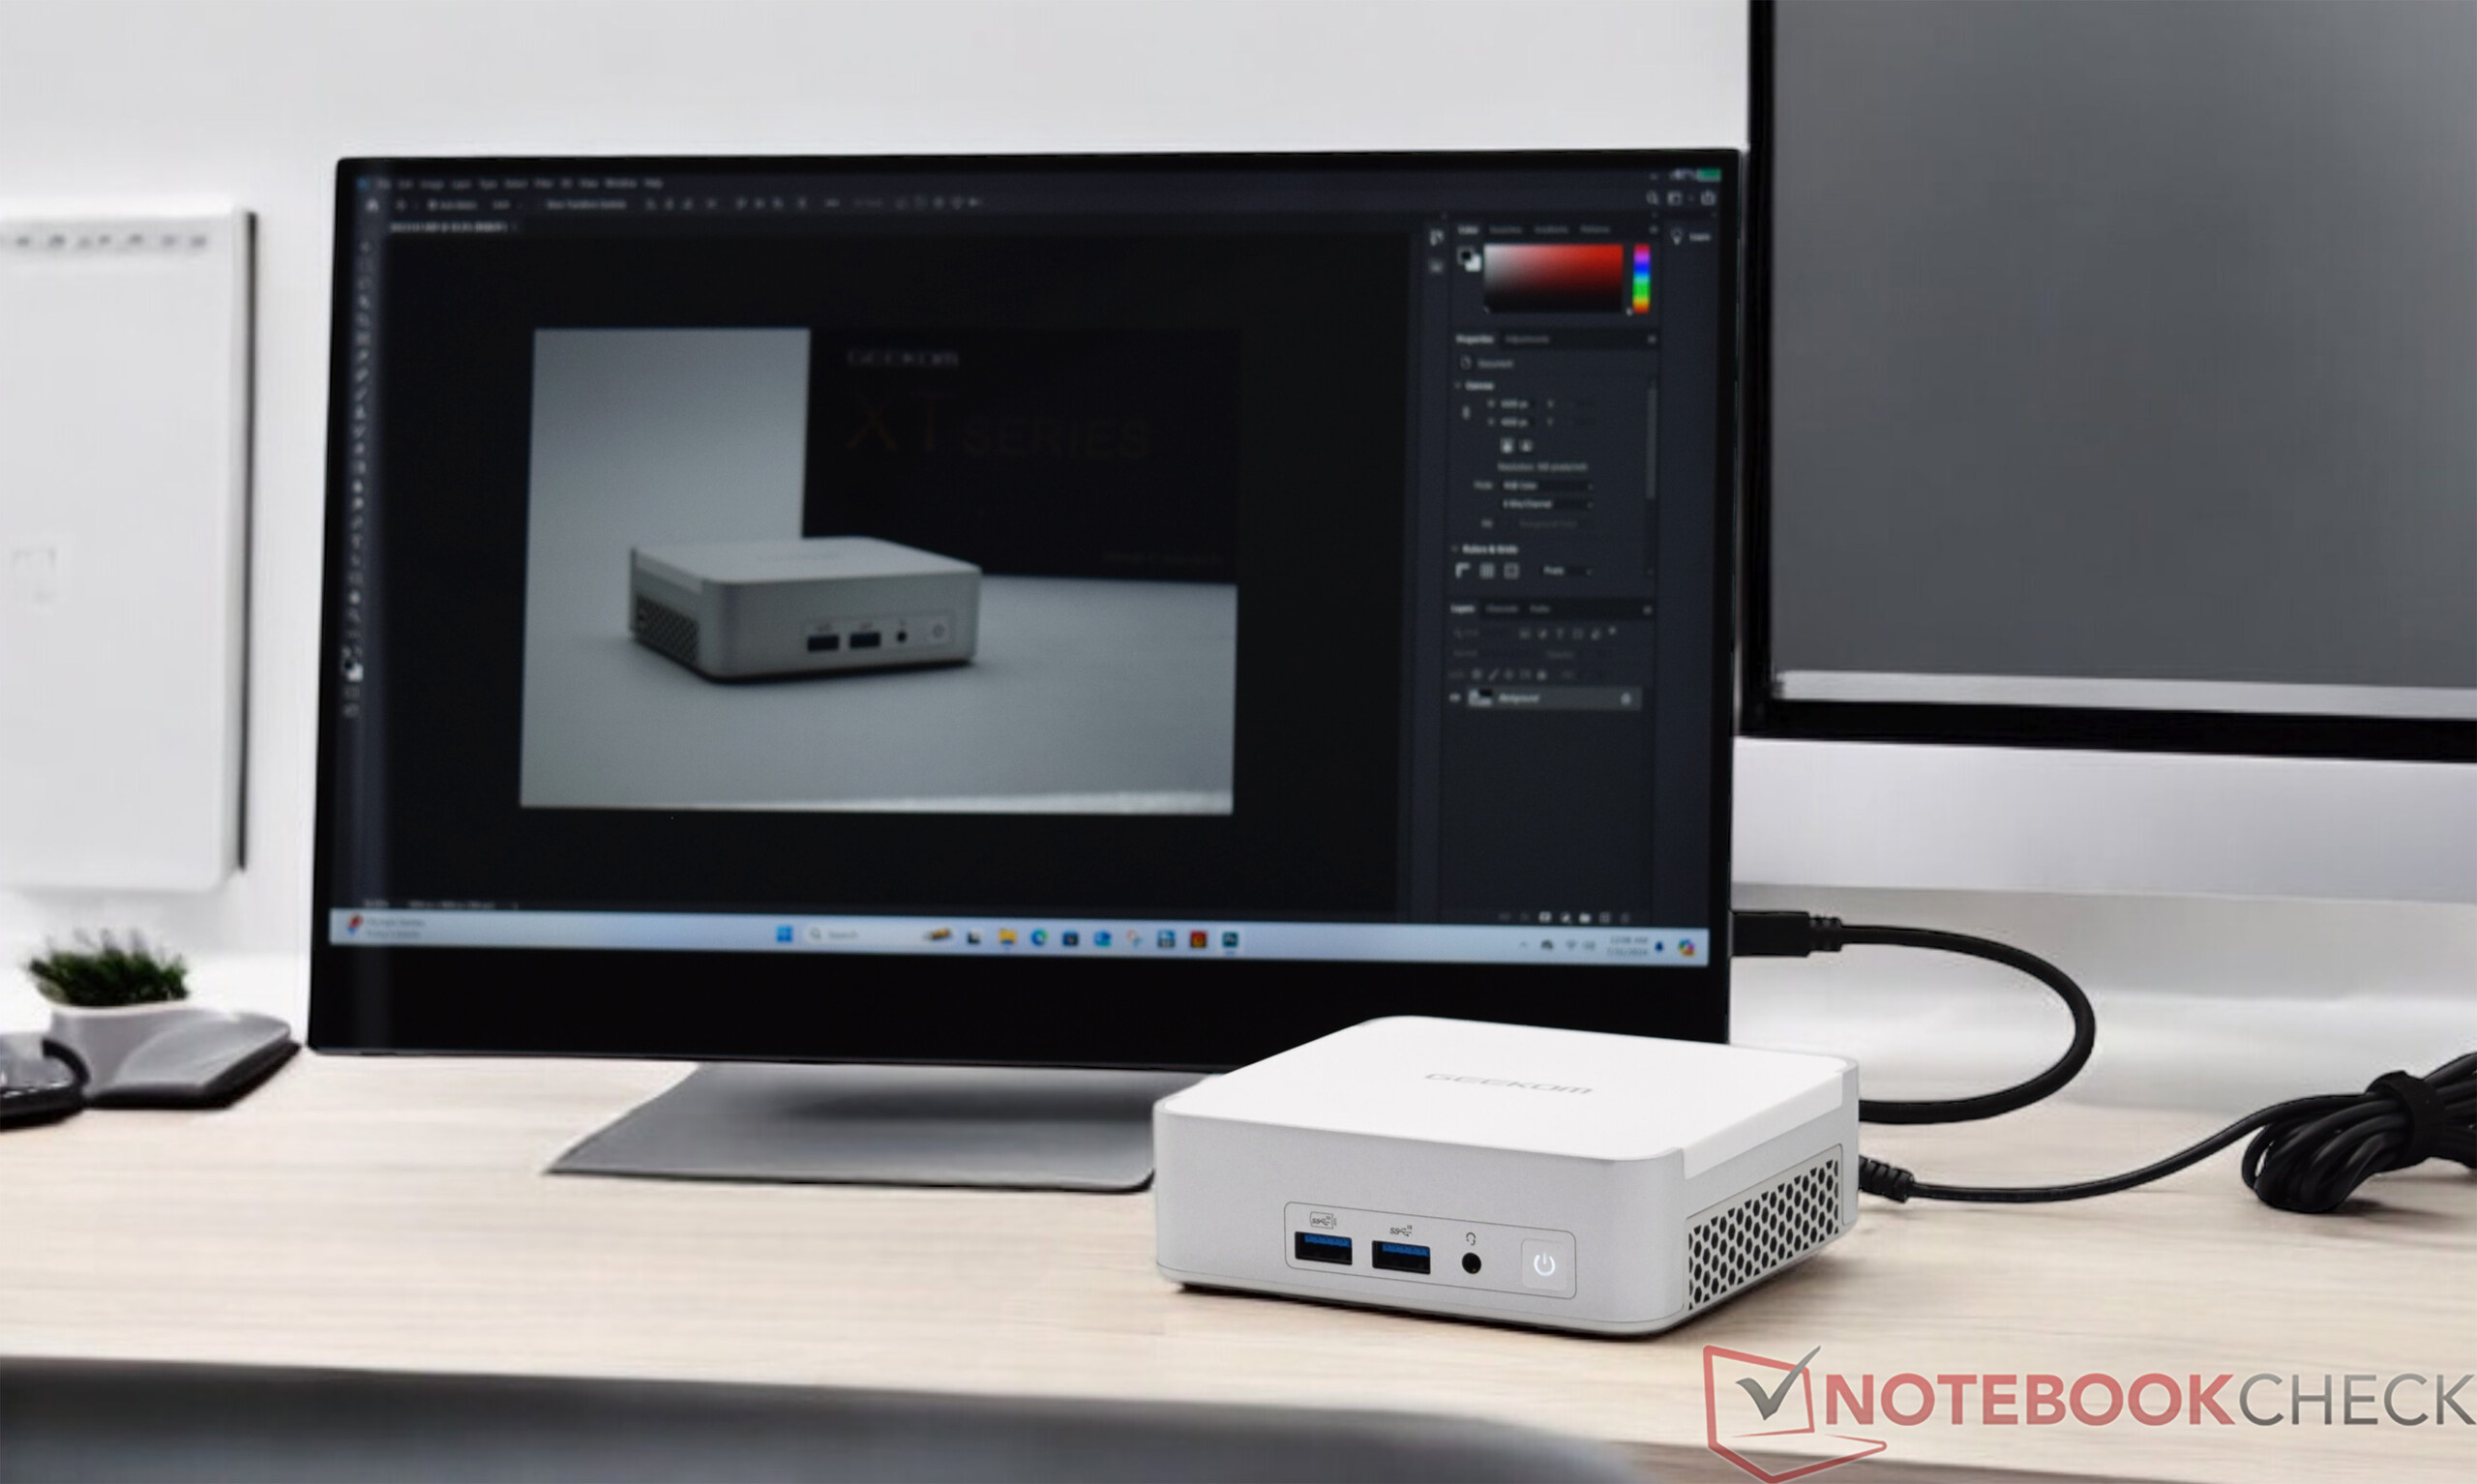
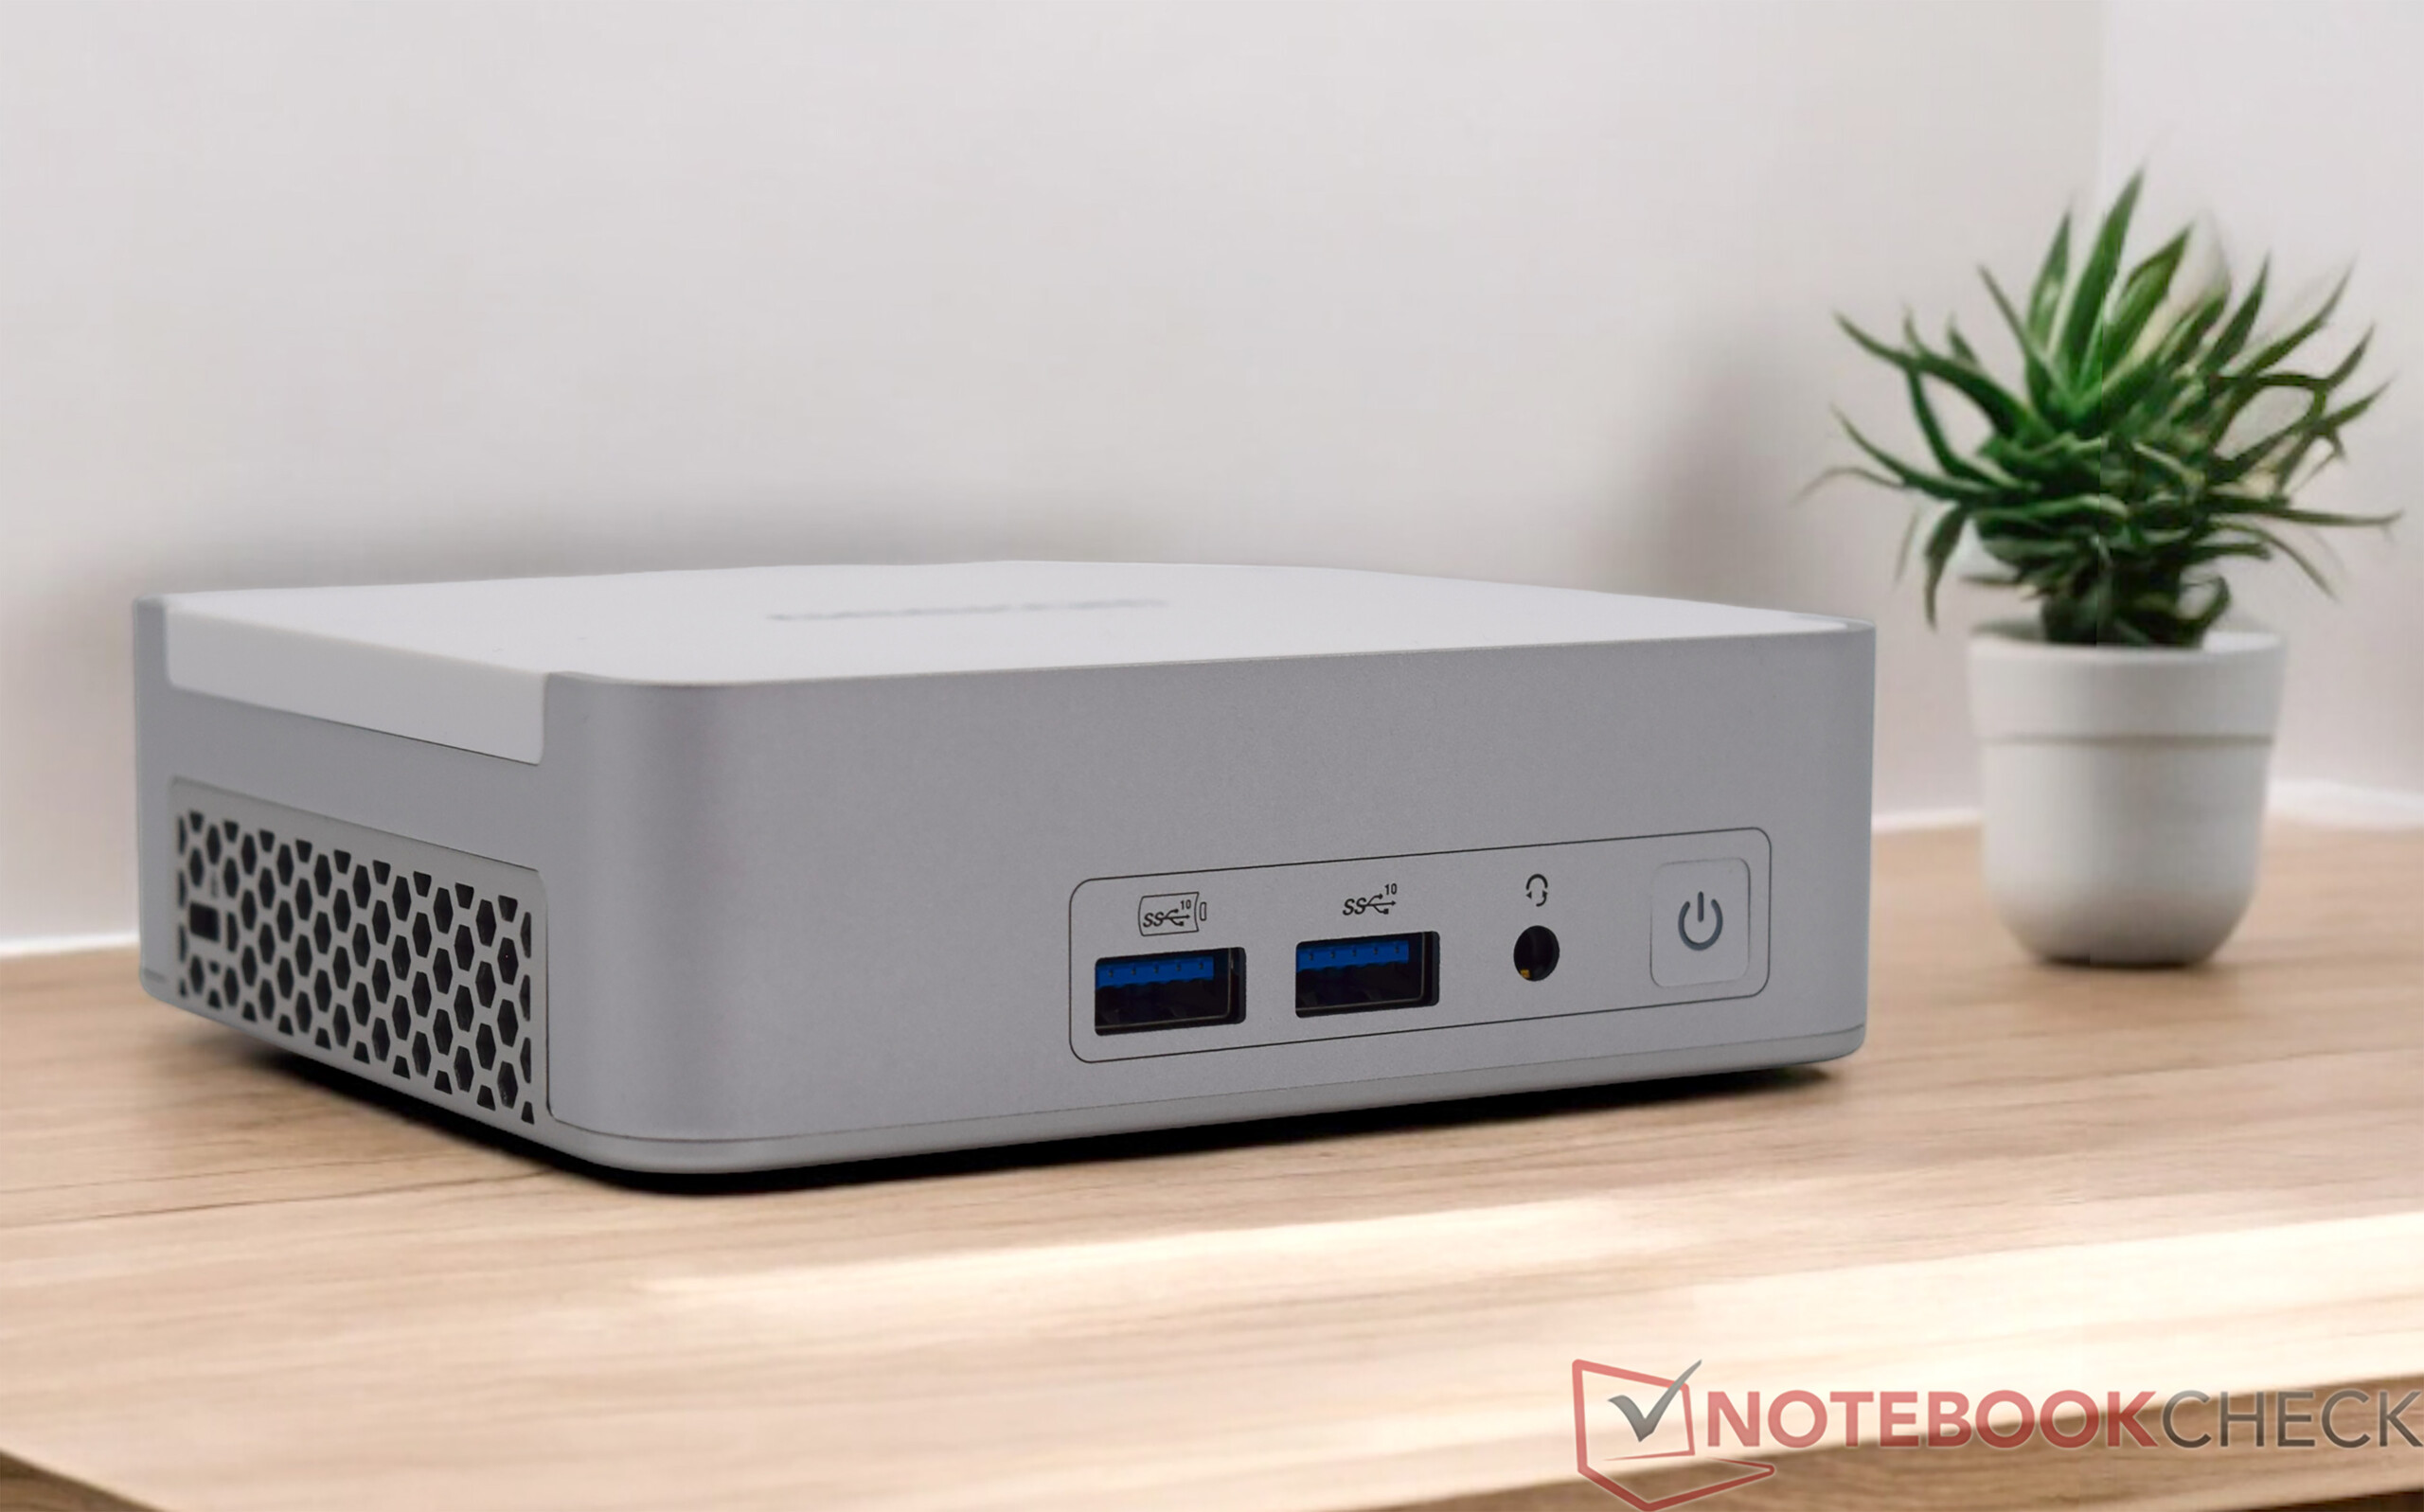
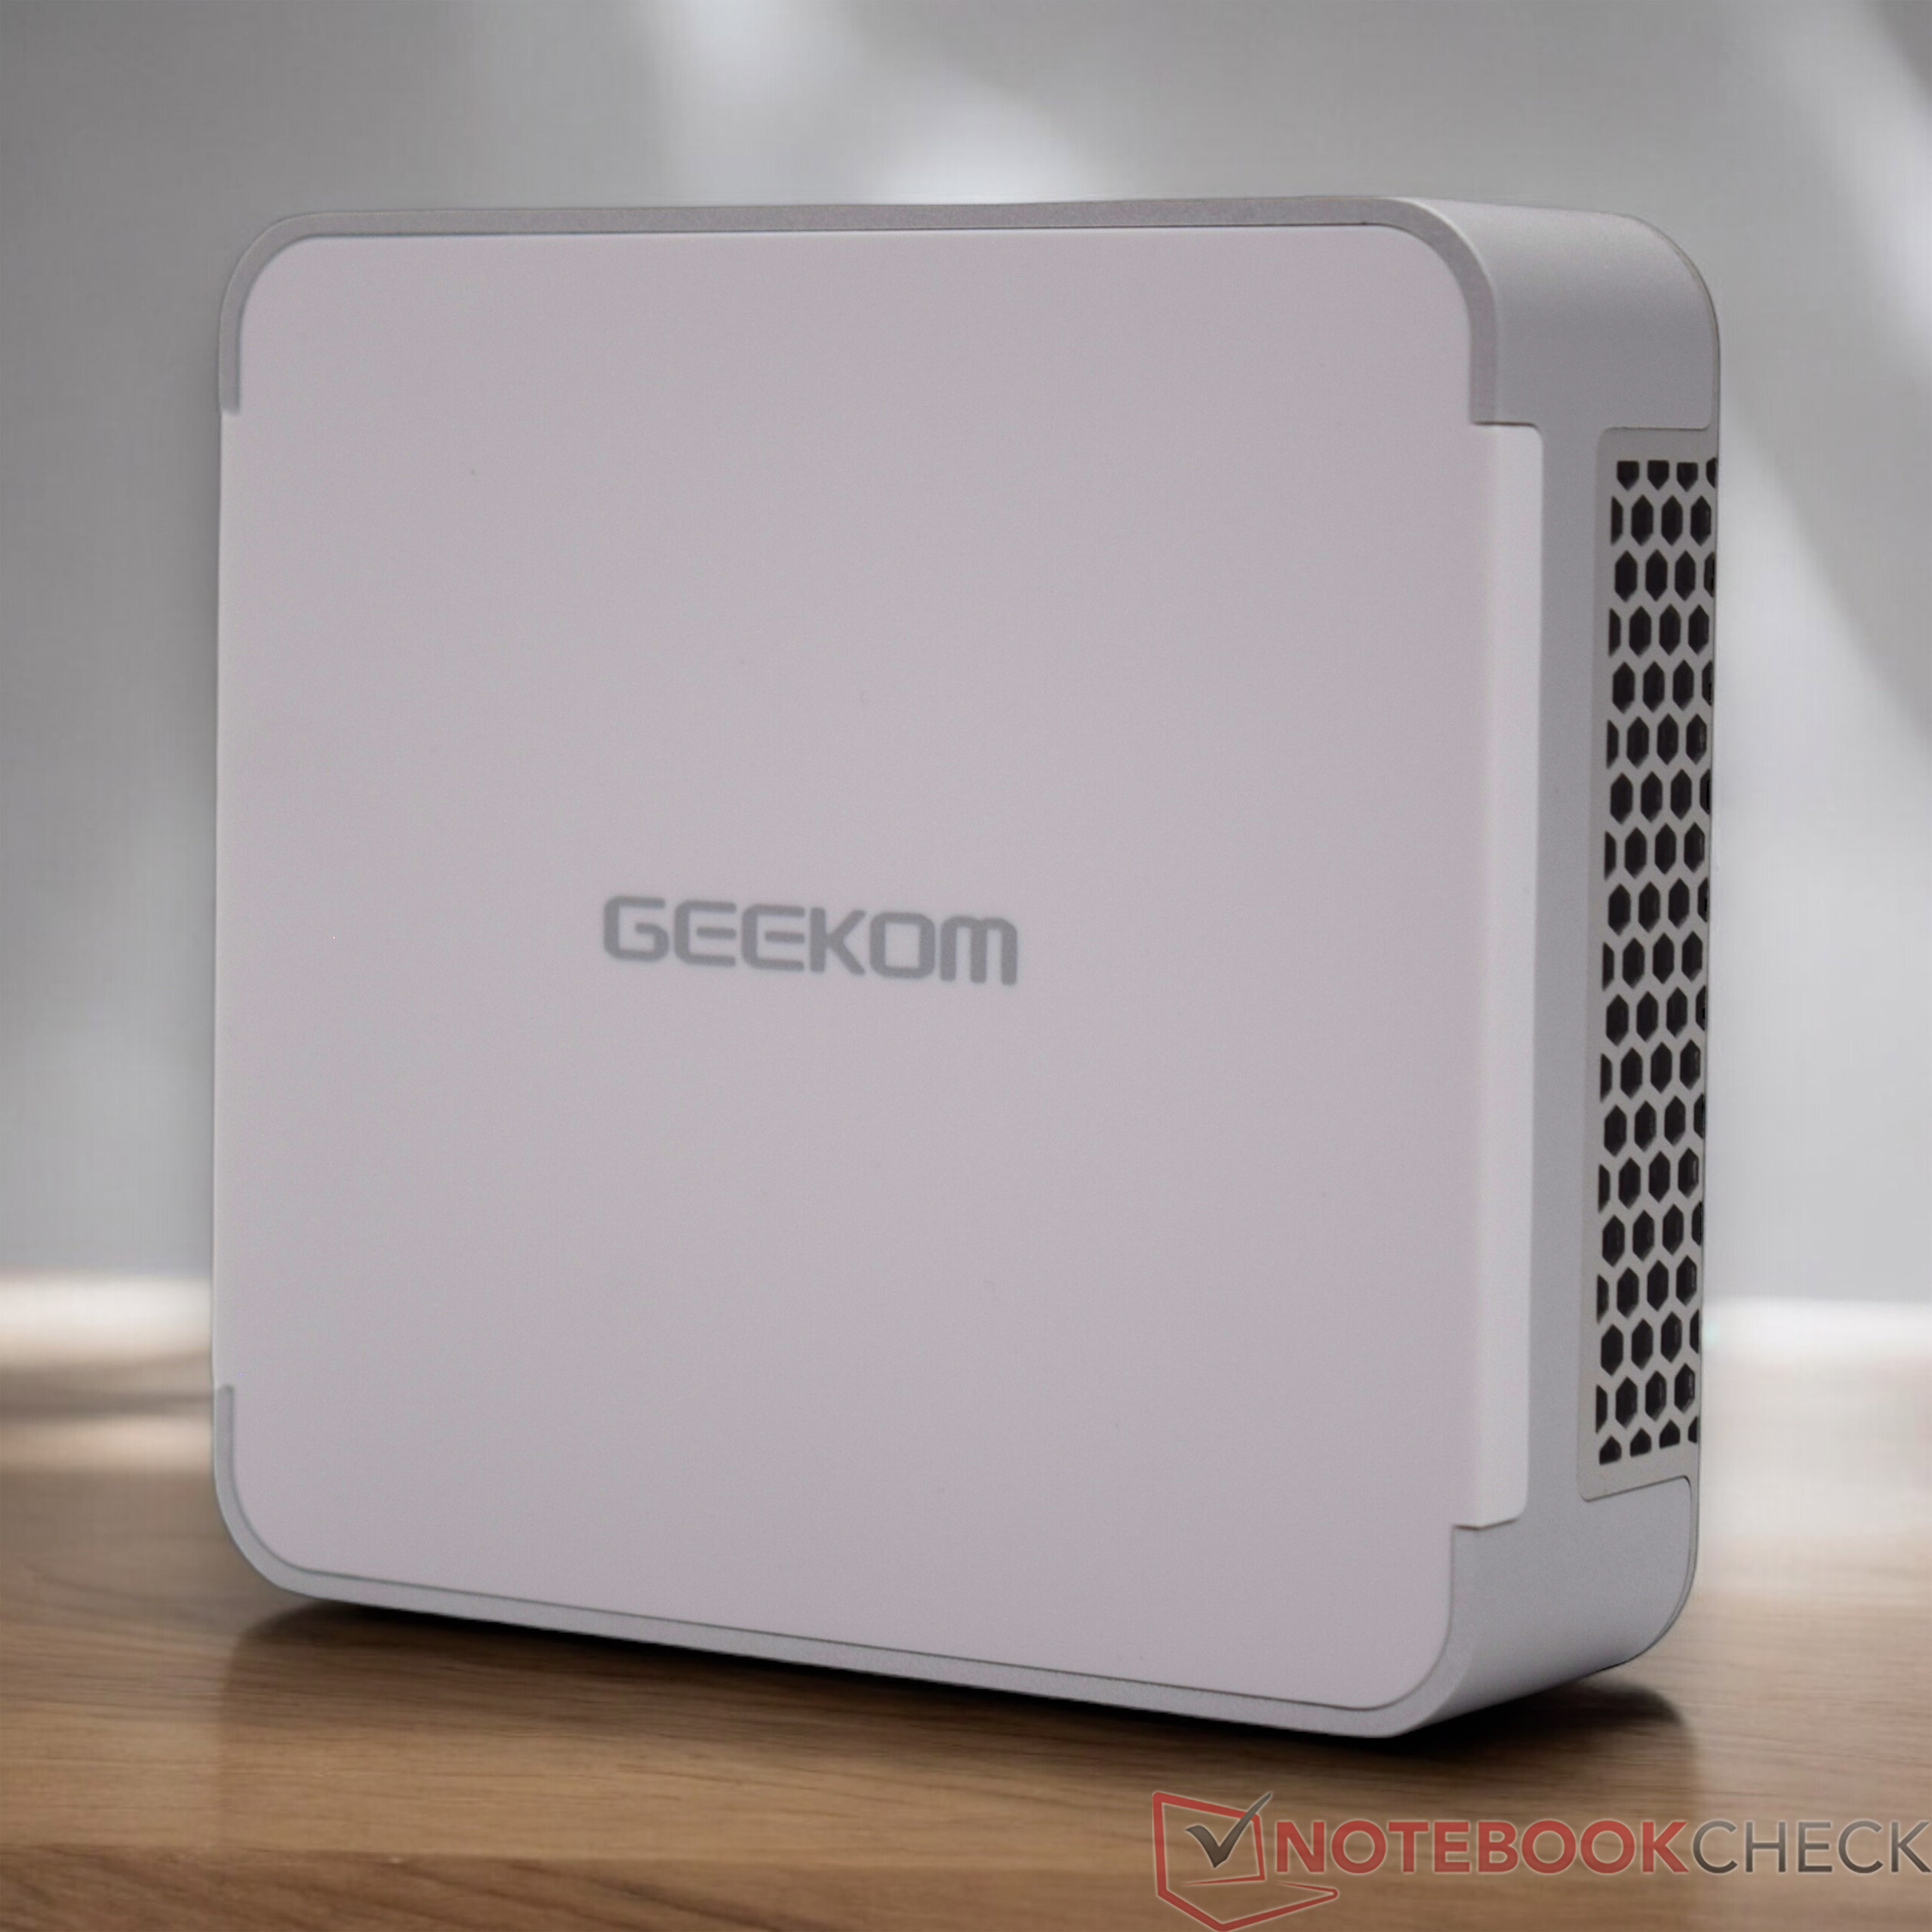
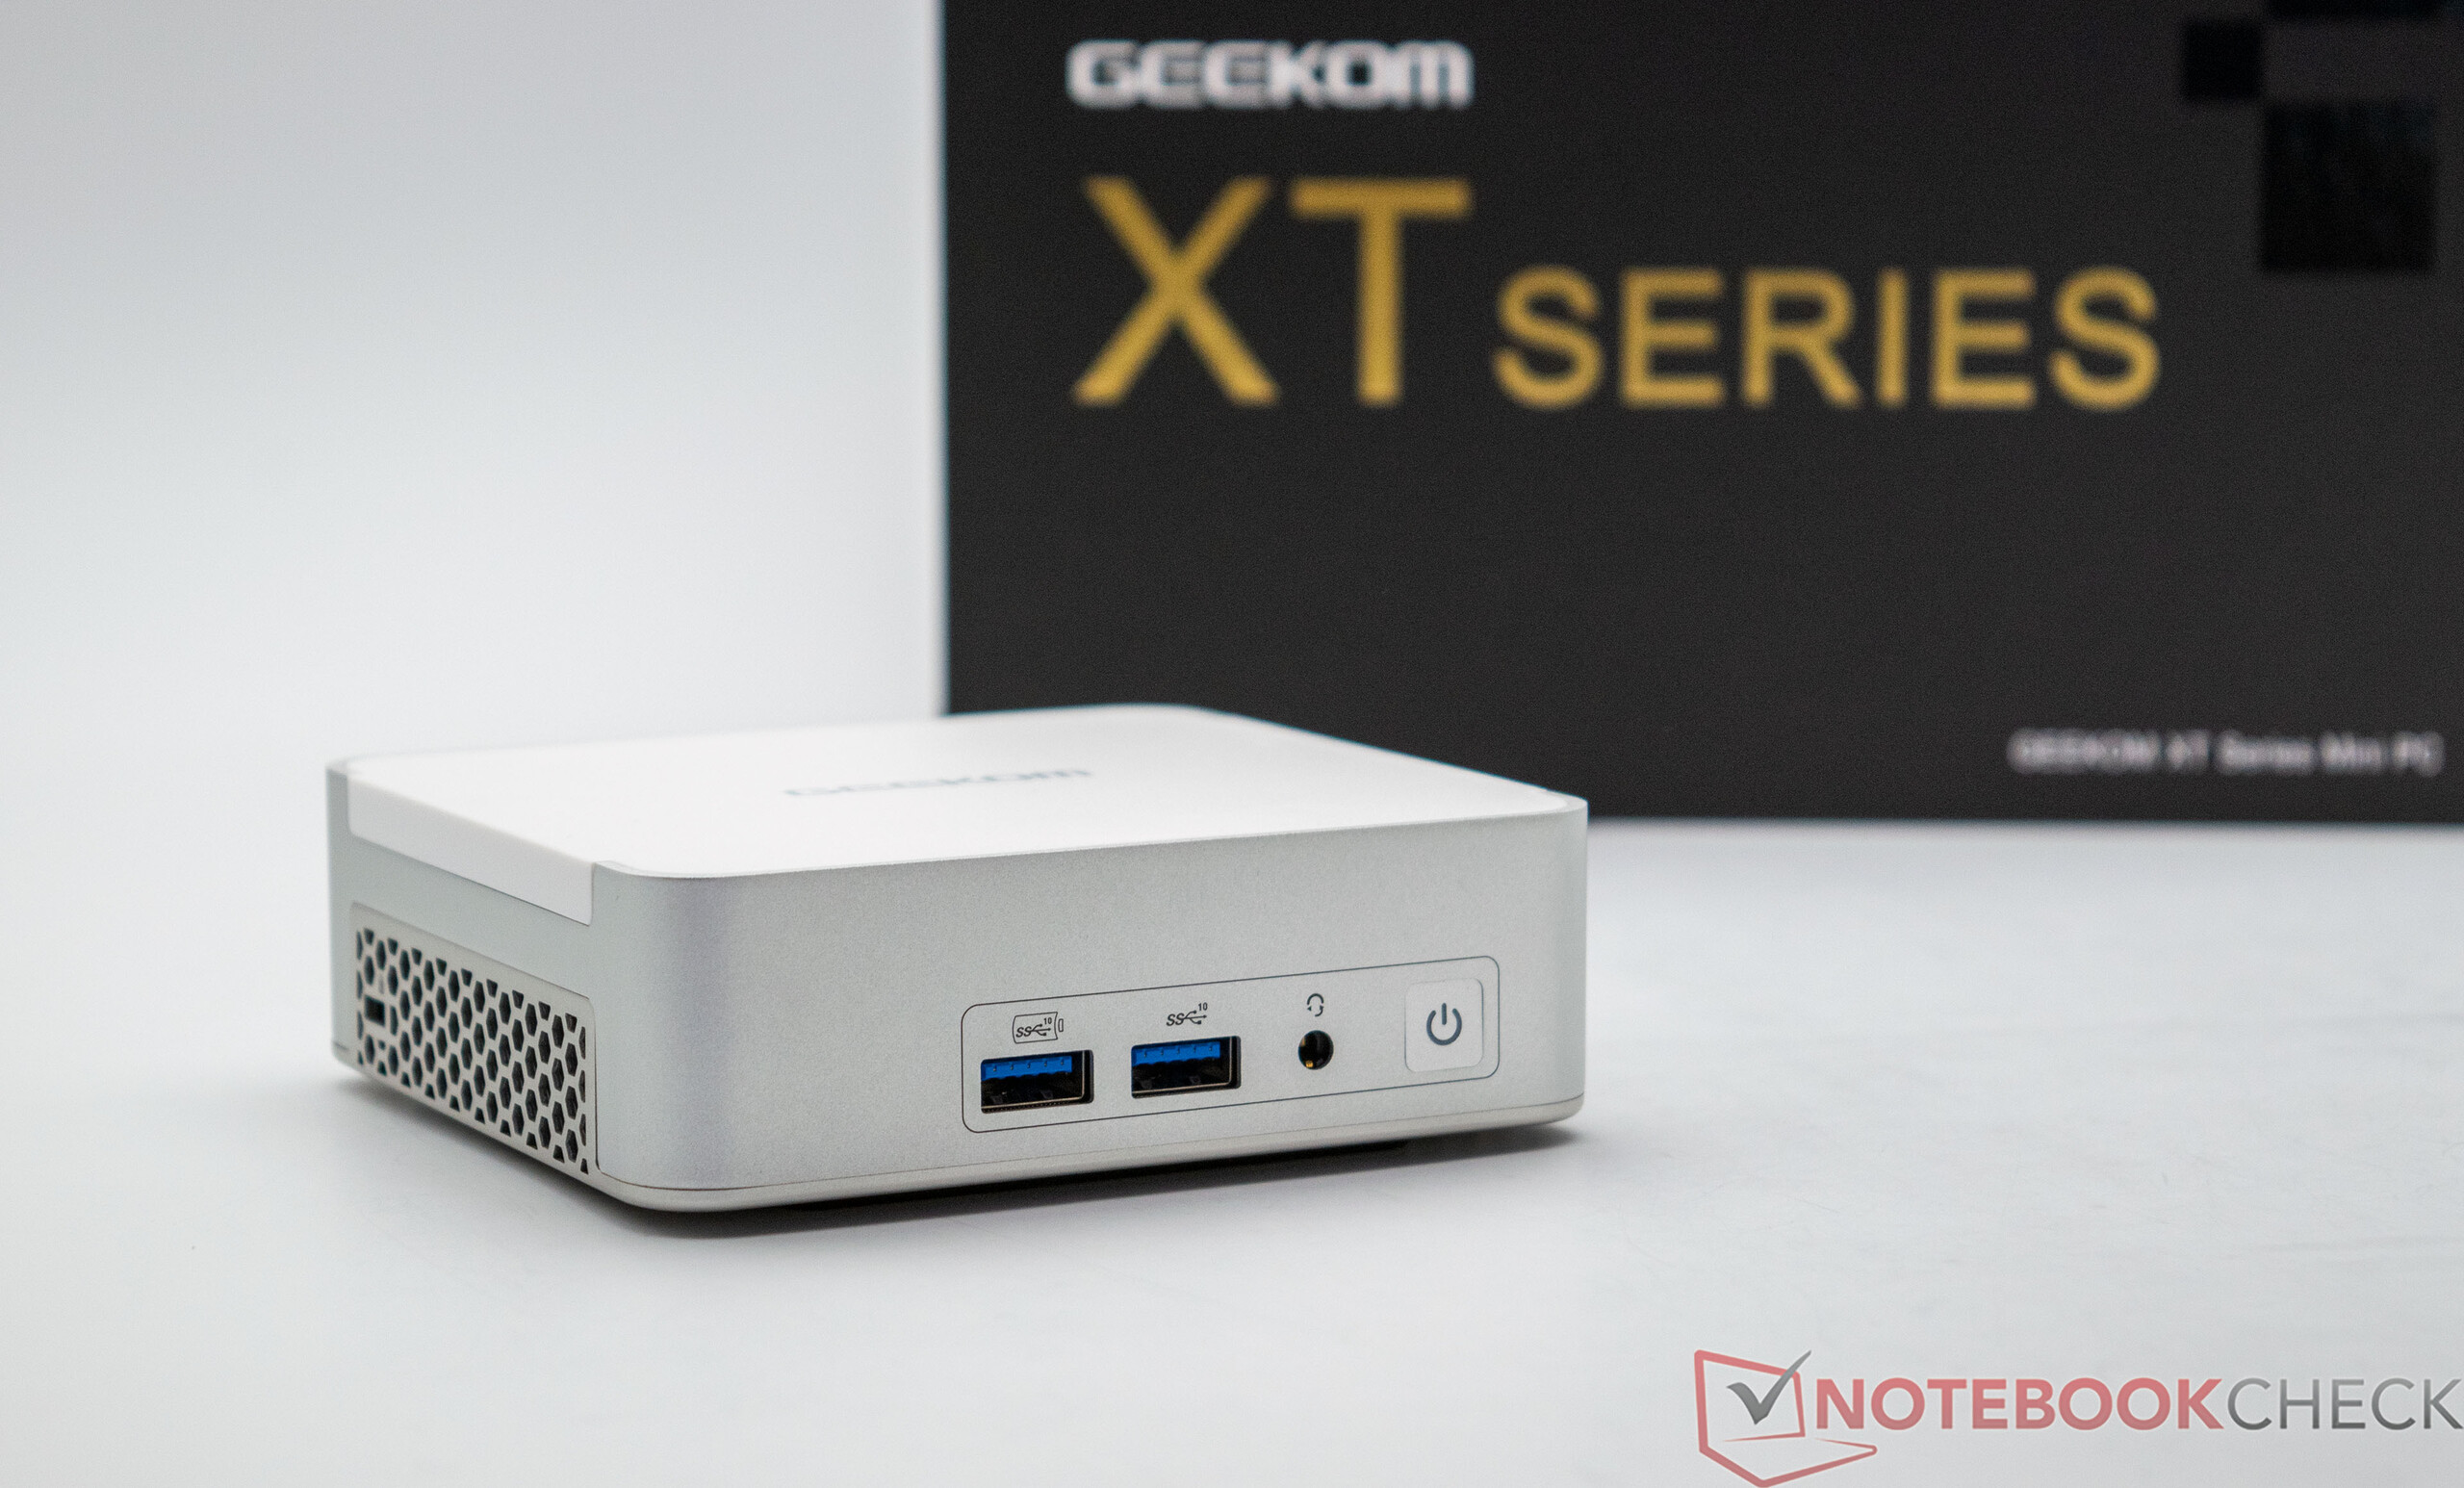
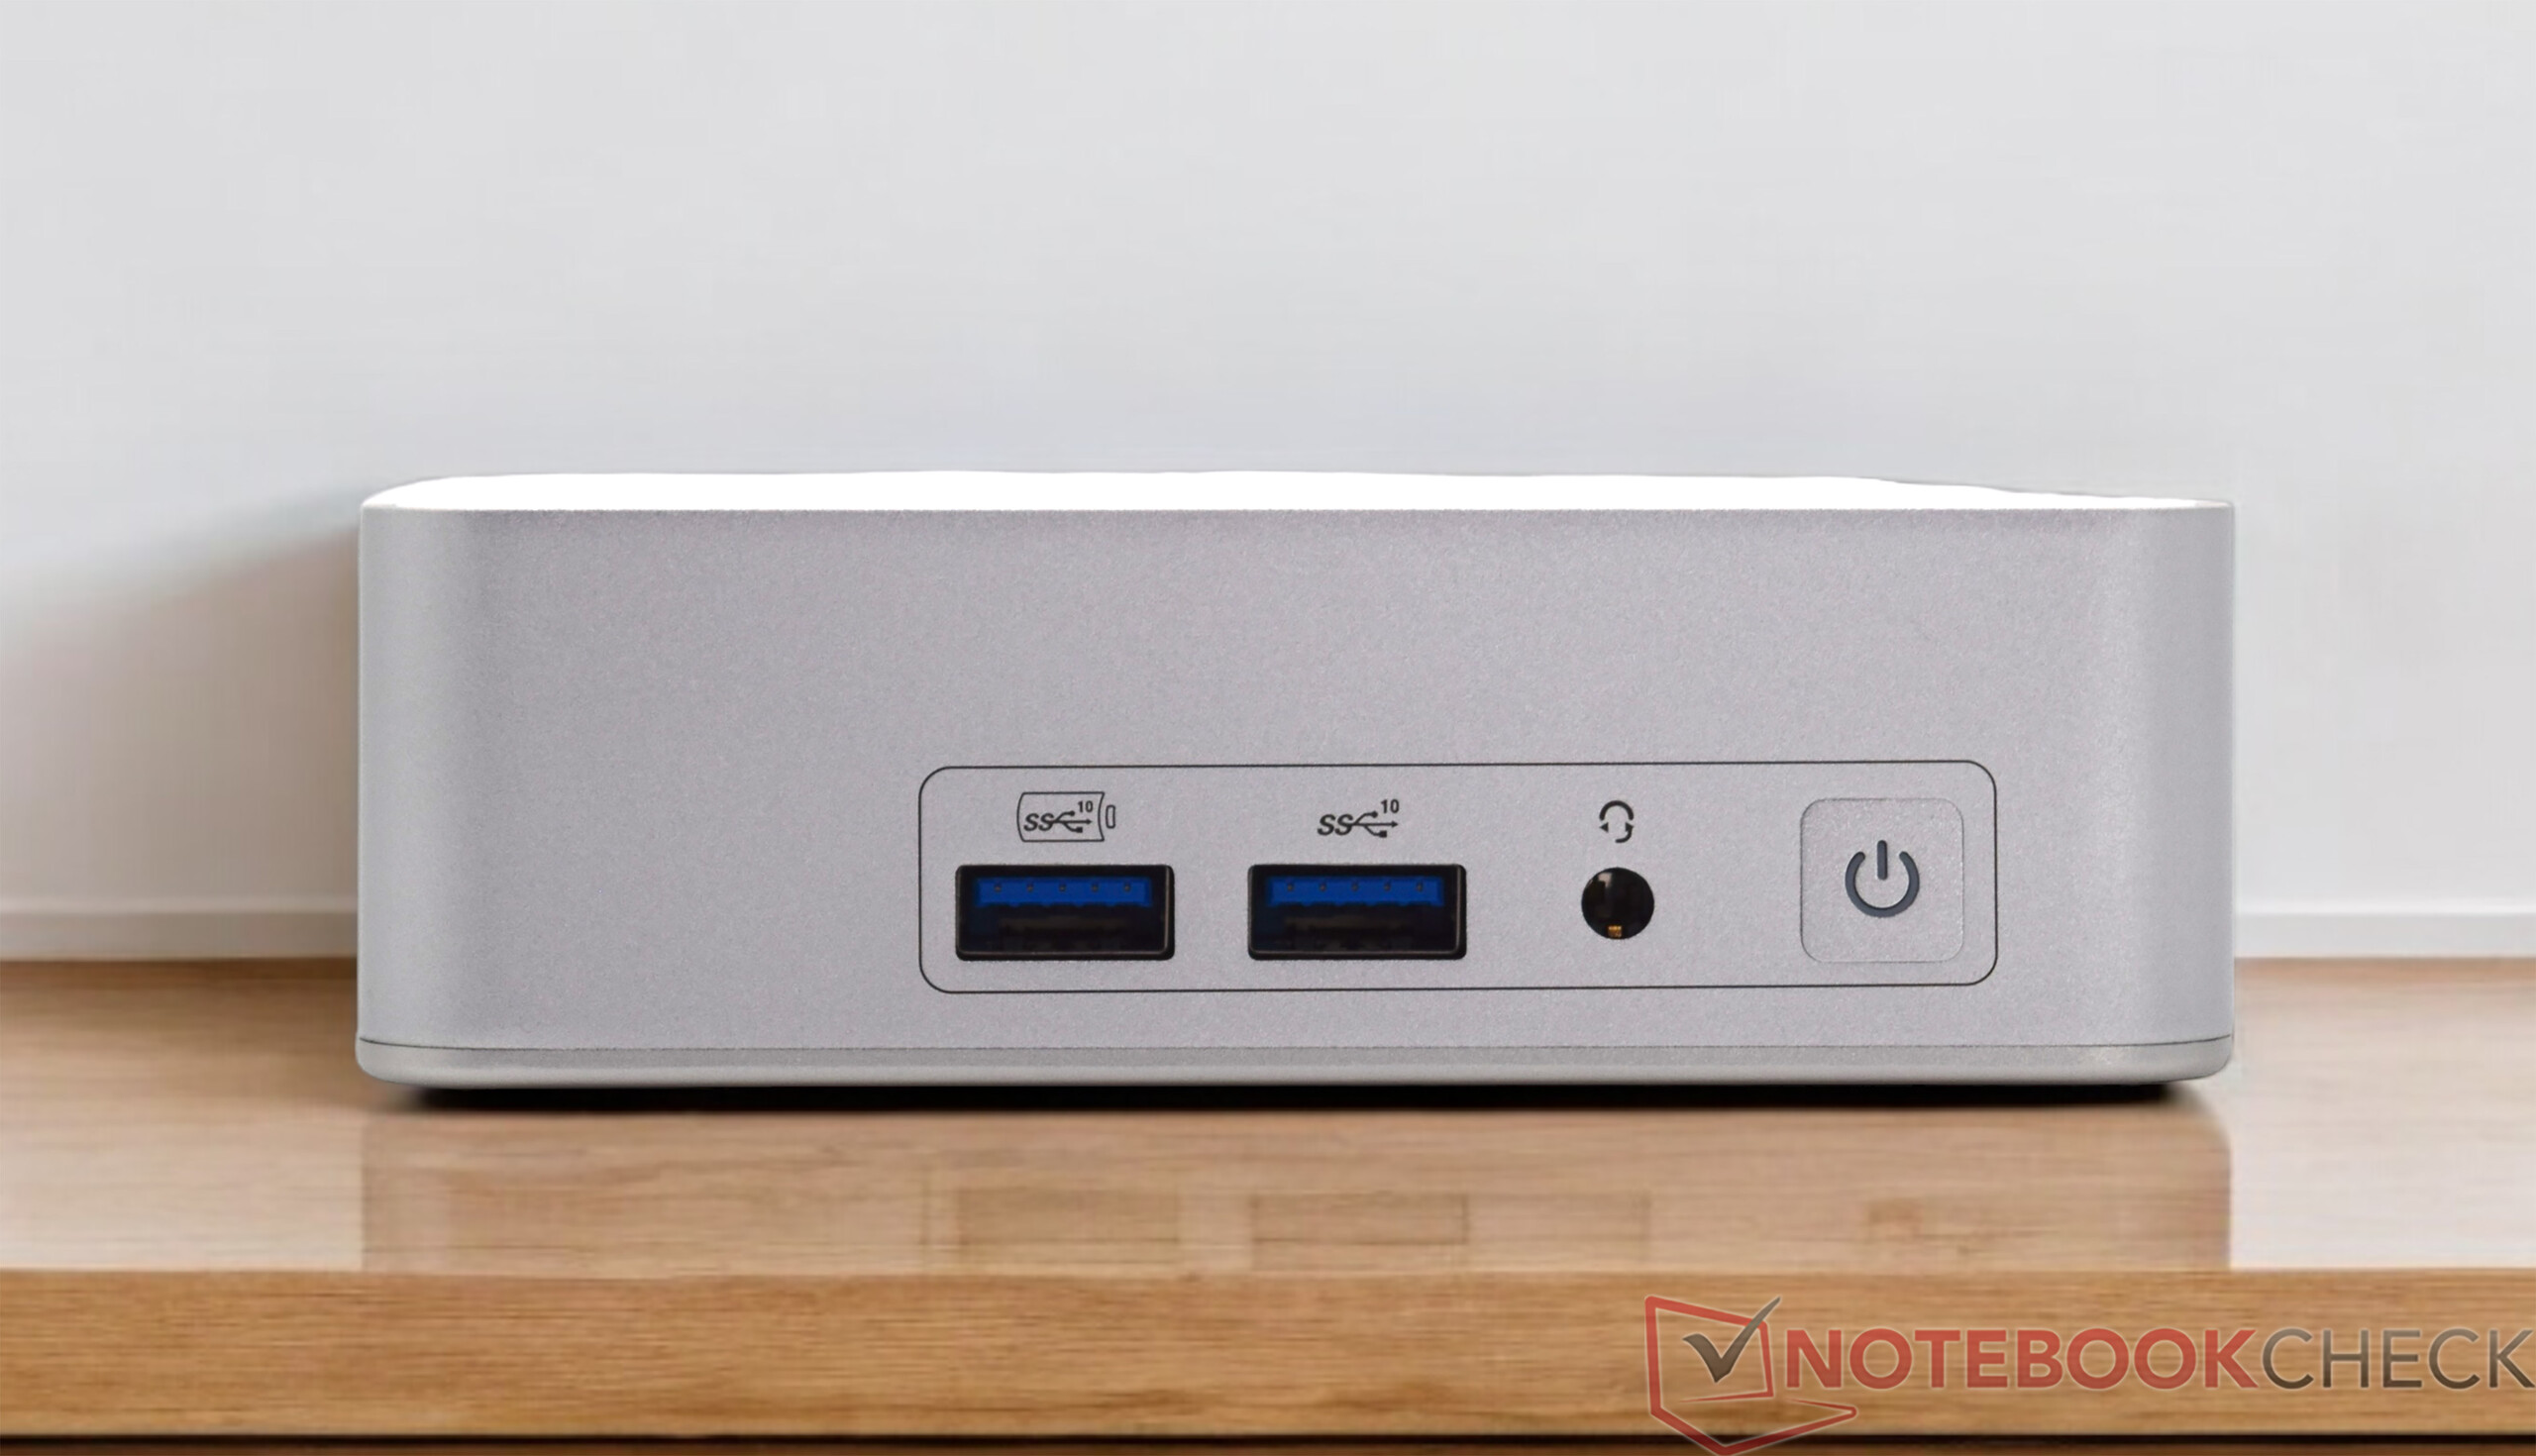
De behuizing van de Geekom XT13 Pro is bekend, deze werd namelijk ook gebruikt voor de Geekom XT12 Pro. Een gelijkenis met de Intel NUC 13 Pro Desk Edition Kit kan ook niet ontkend worden. In principe is er niets mis met het uiterlijk. Ons testexemplaar is wederom perfect afgewerkt en alles past wonderwel bij elkaar. Toch hadden we graag een nieuwe behuizing gezien om hem iets te onderscheiden van de interne concurrentie. De mini-pc neemt slechts 11,7 x 11,2 centimeter in beslag op het bureau, waardoor het een van de compactere apparaten is. De Geekom XT13 Pro kan ook direct op een monitor worden bevestigd met behulp van de meegeleverde VESA-bevestiging.
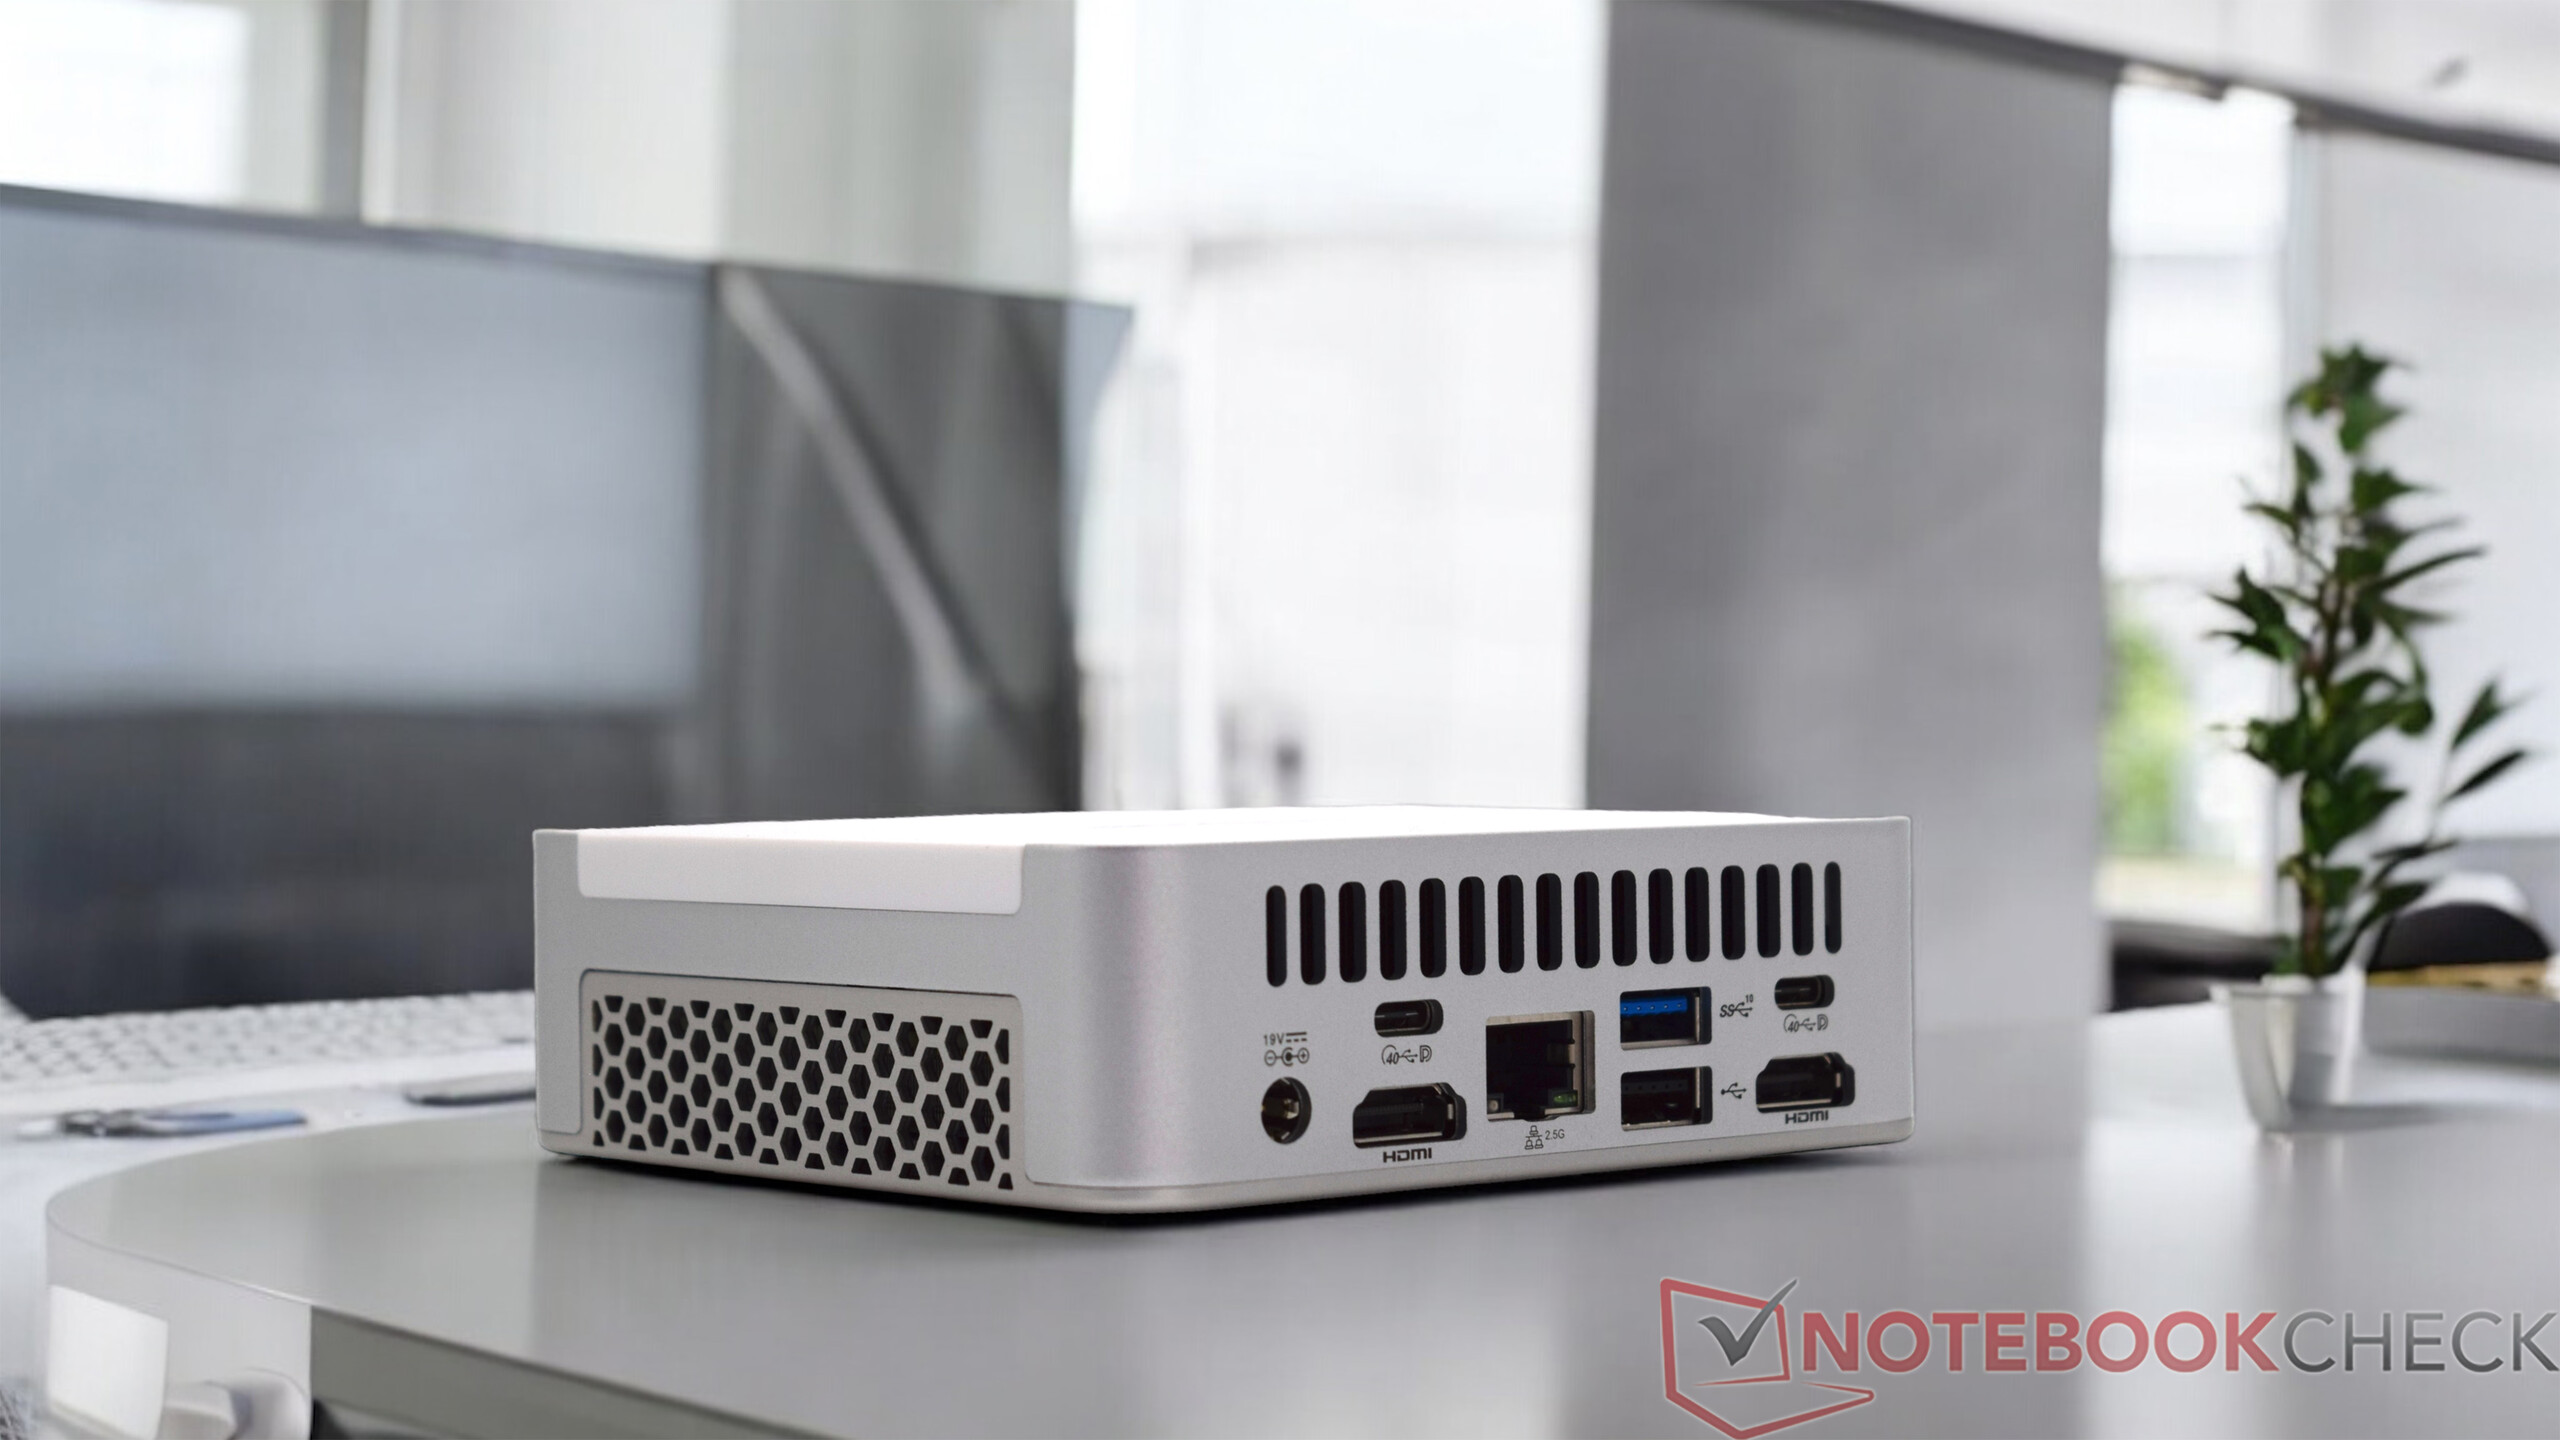
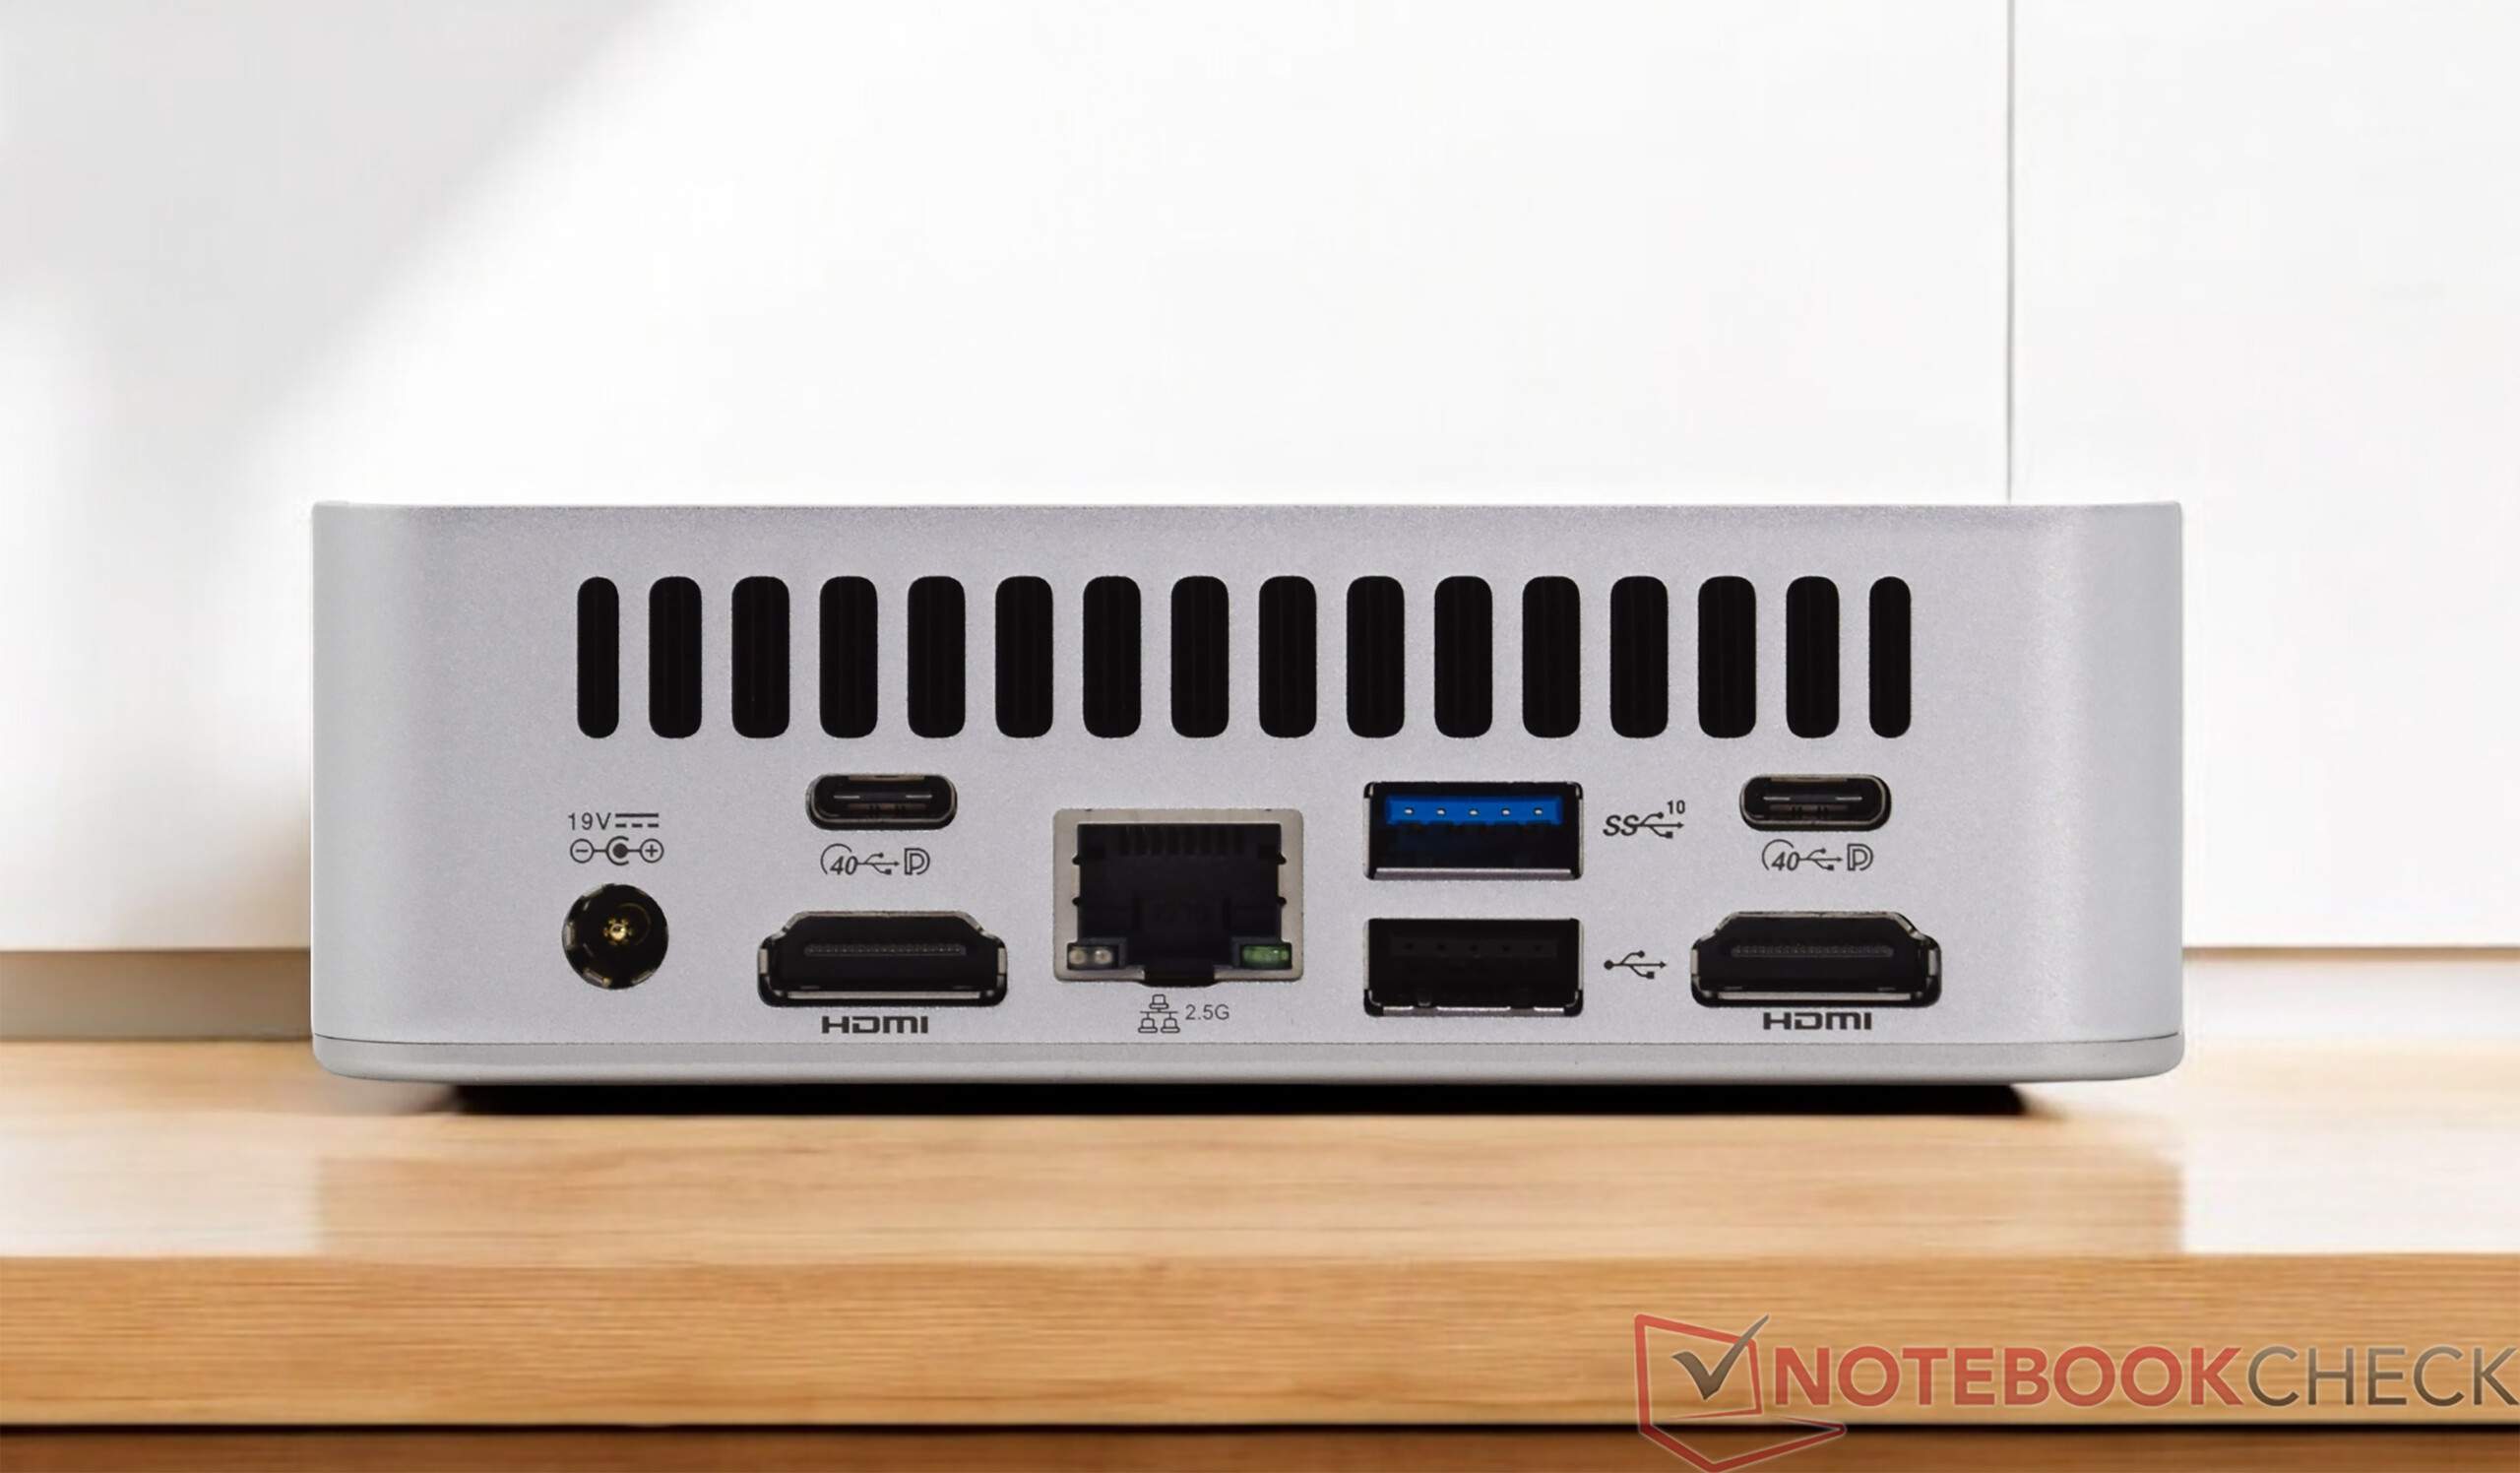
Uitrusting - Goede selectie en 2x USB4
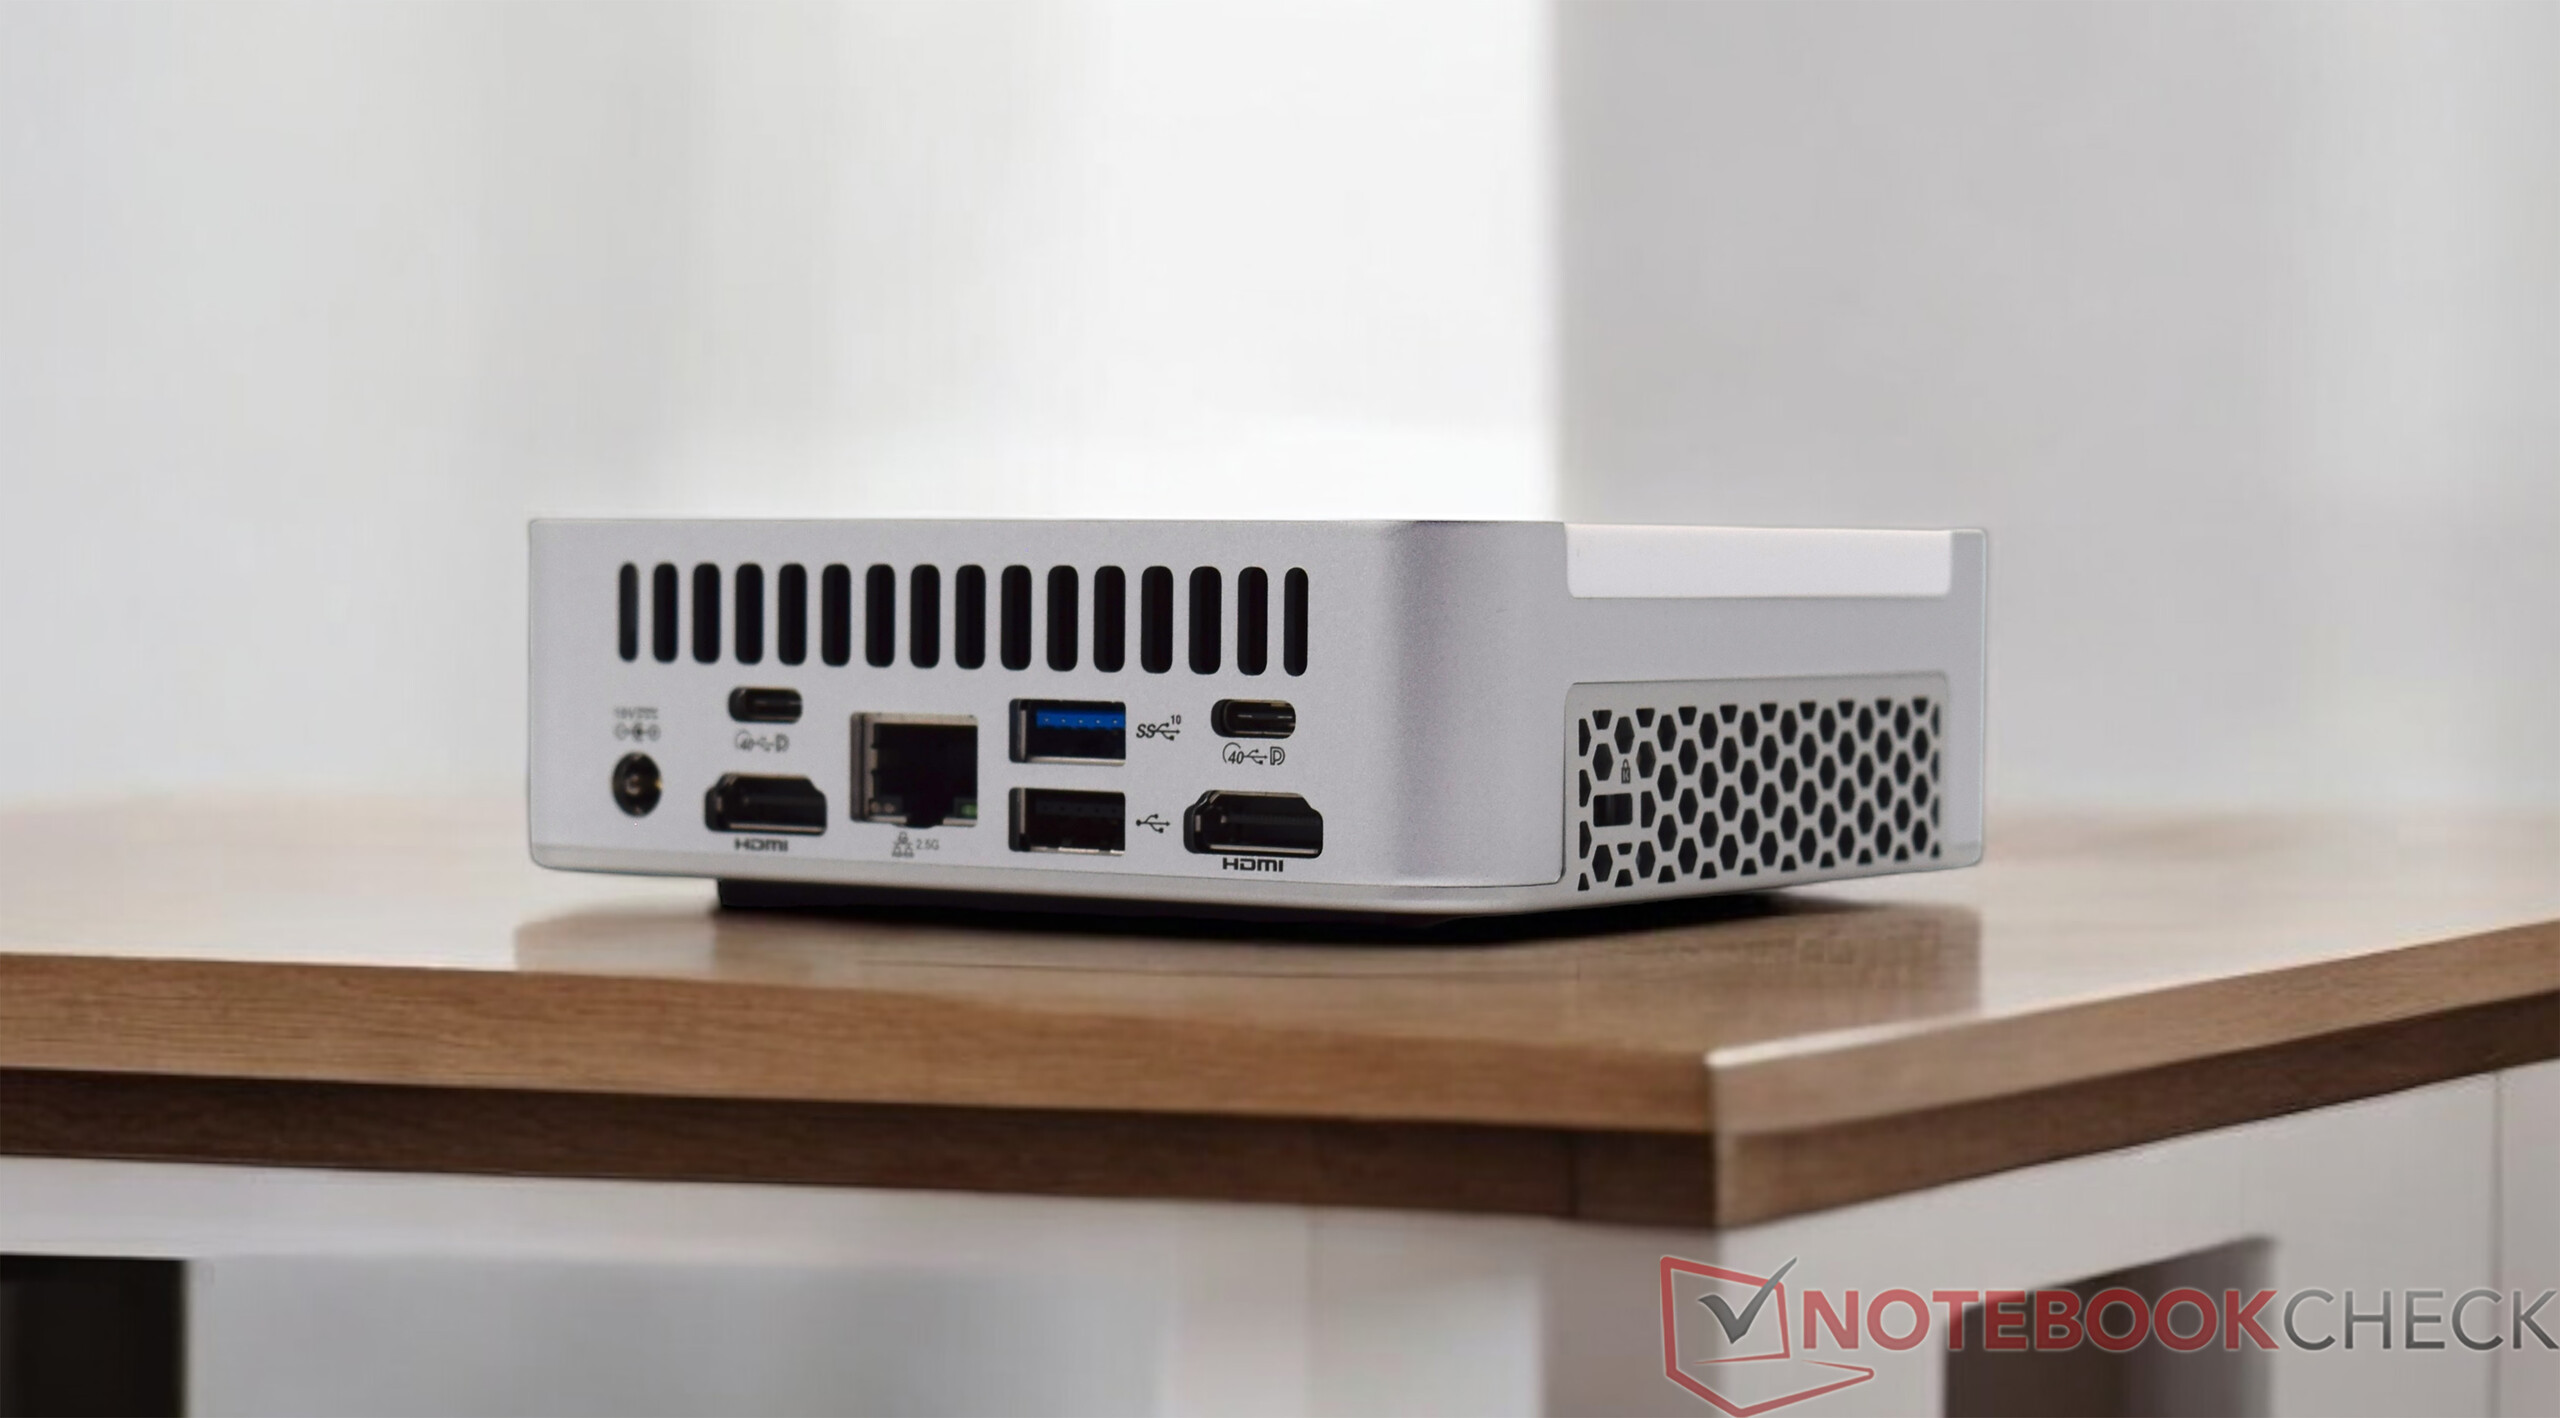
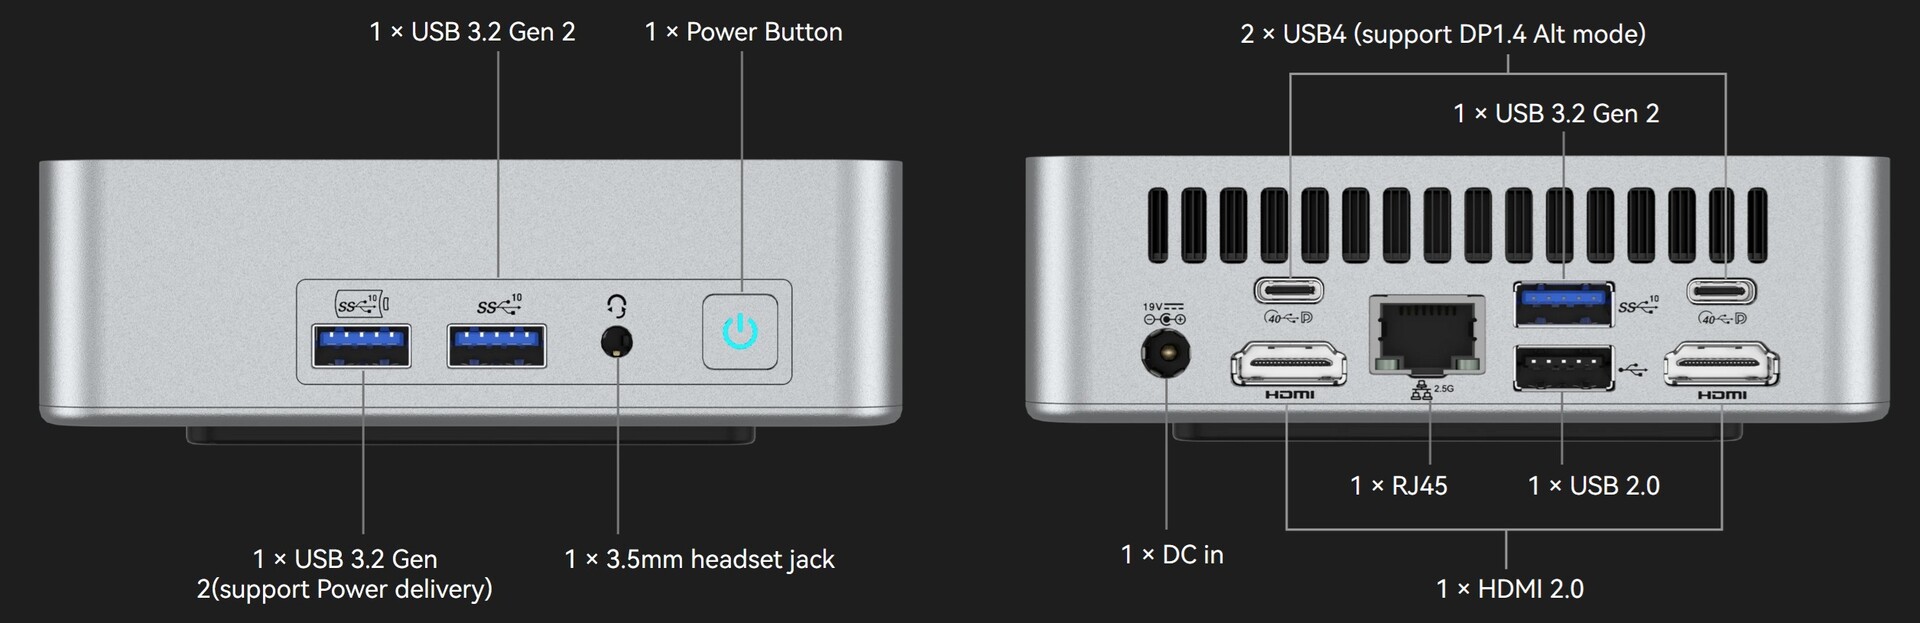
Wat betreft externe interfaces heeft de Geekom XT13 Pro dezelfde opties als de Geekom XT12 Pro. Hoewel het apparaat erg compact is, zijn er veel verschillende aansluitingen. De twee USB-C aansluitingen aan de achterkant zijn moderne USB4 poorten, waardoor het aantal toepassingen met de juiste accessoires enorm wordt uitgebreid. Er kunnen in totaal vier schermen tegelijk worden bediend en er is ook een LAN-aansluiting.
Communicatie
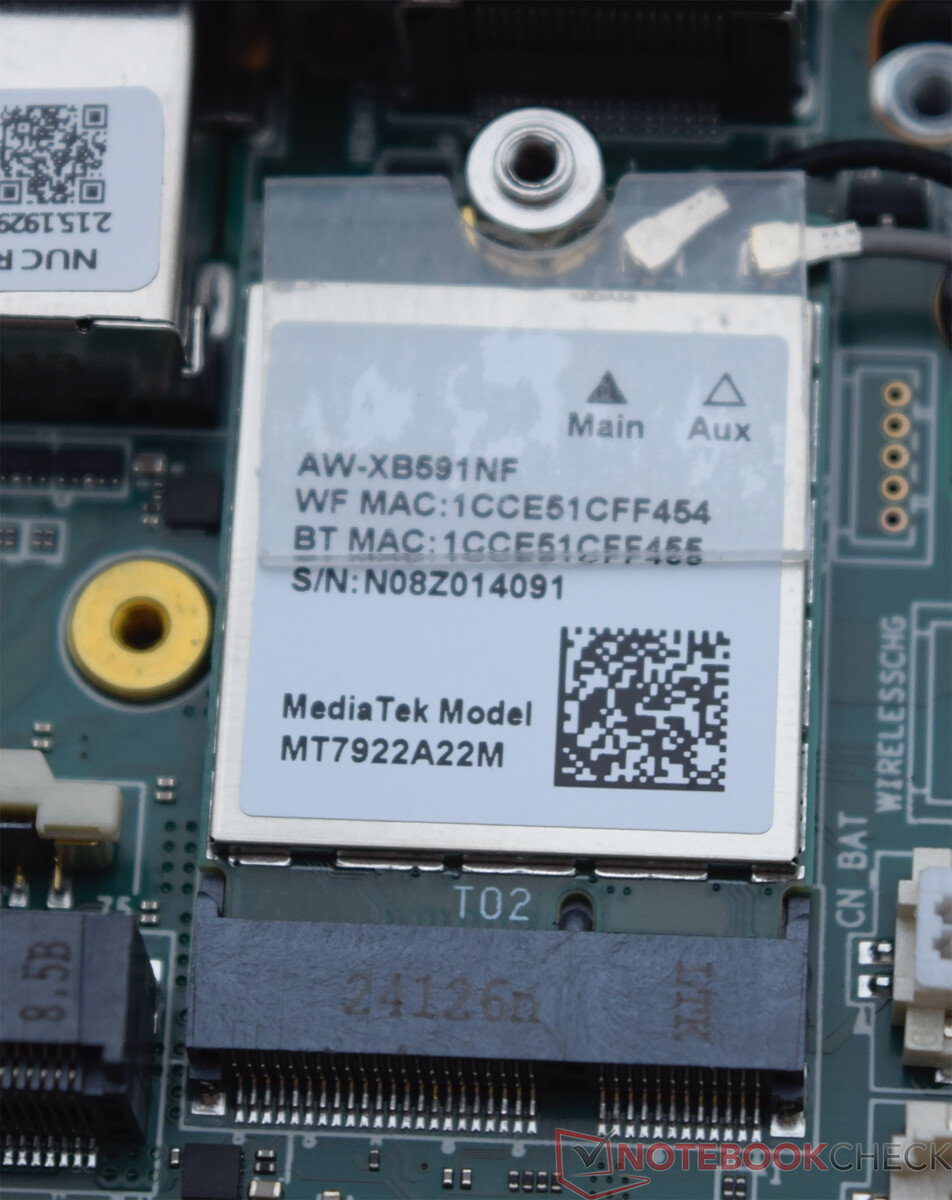
De Geekom XT13 Pro maakt gebruik van een bekende draadloze module die Geekom in veel van zijn apparaten installeert. De MediaTek Wi-Fi 6E MT7922 WLAN-module levert voldoende prestaties in ons testapparaat. Indien mogelijk moet echter voornamelijk het 6 GHz frequentiebereik worden gebruikt. Als alternatief kan ook de kabelverbinding worden gebruikt. Gegevenssnelheden tot 2,5 GBit/s zijn dan zelfs mogelijk.
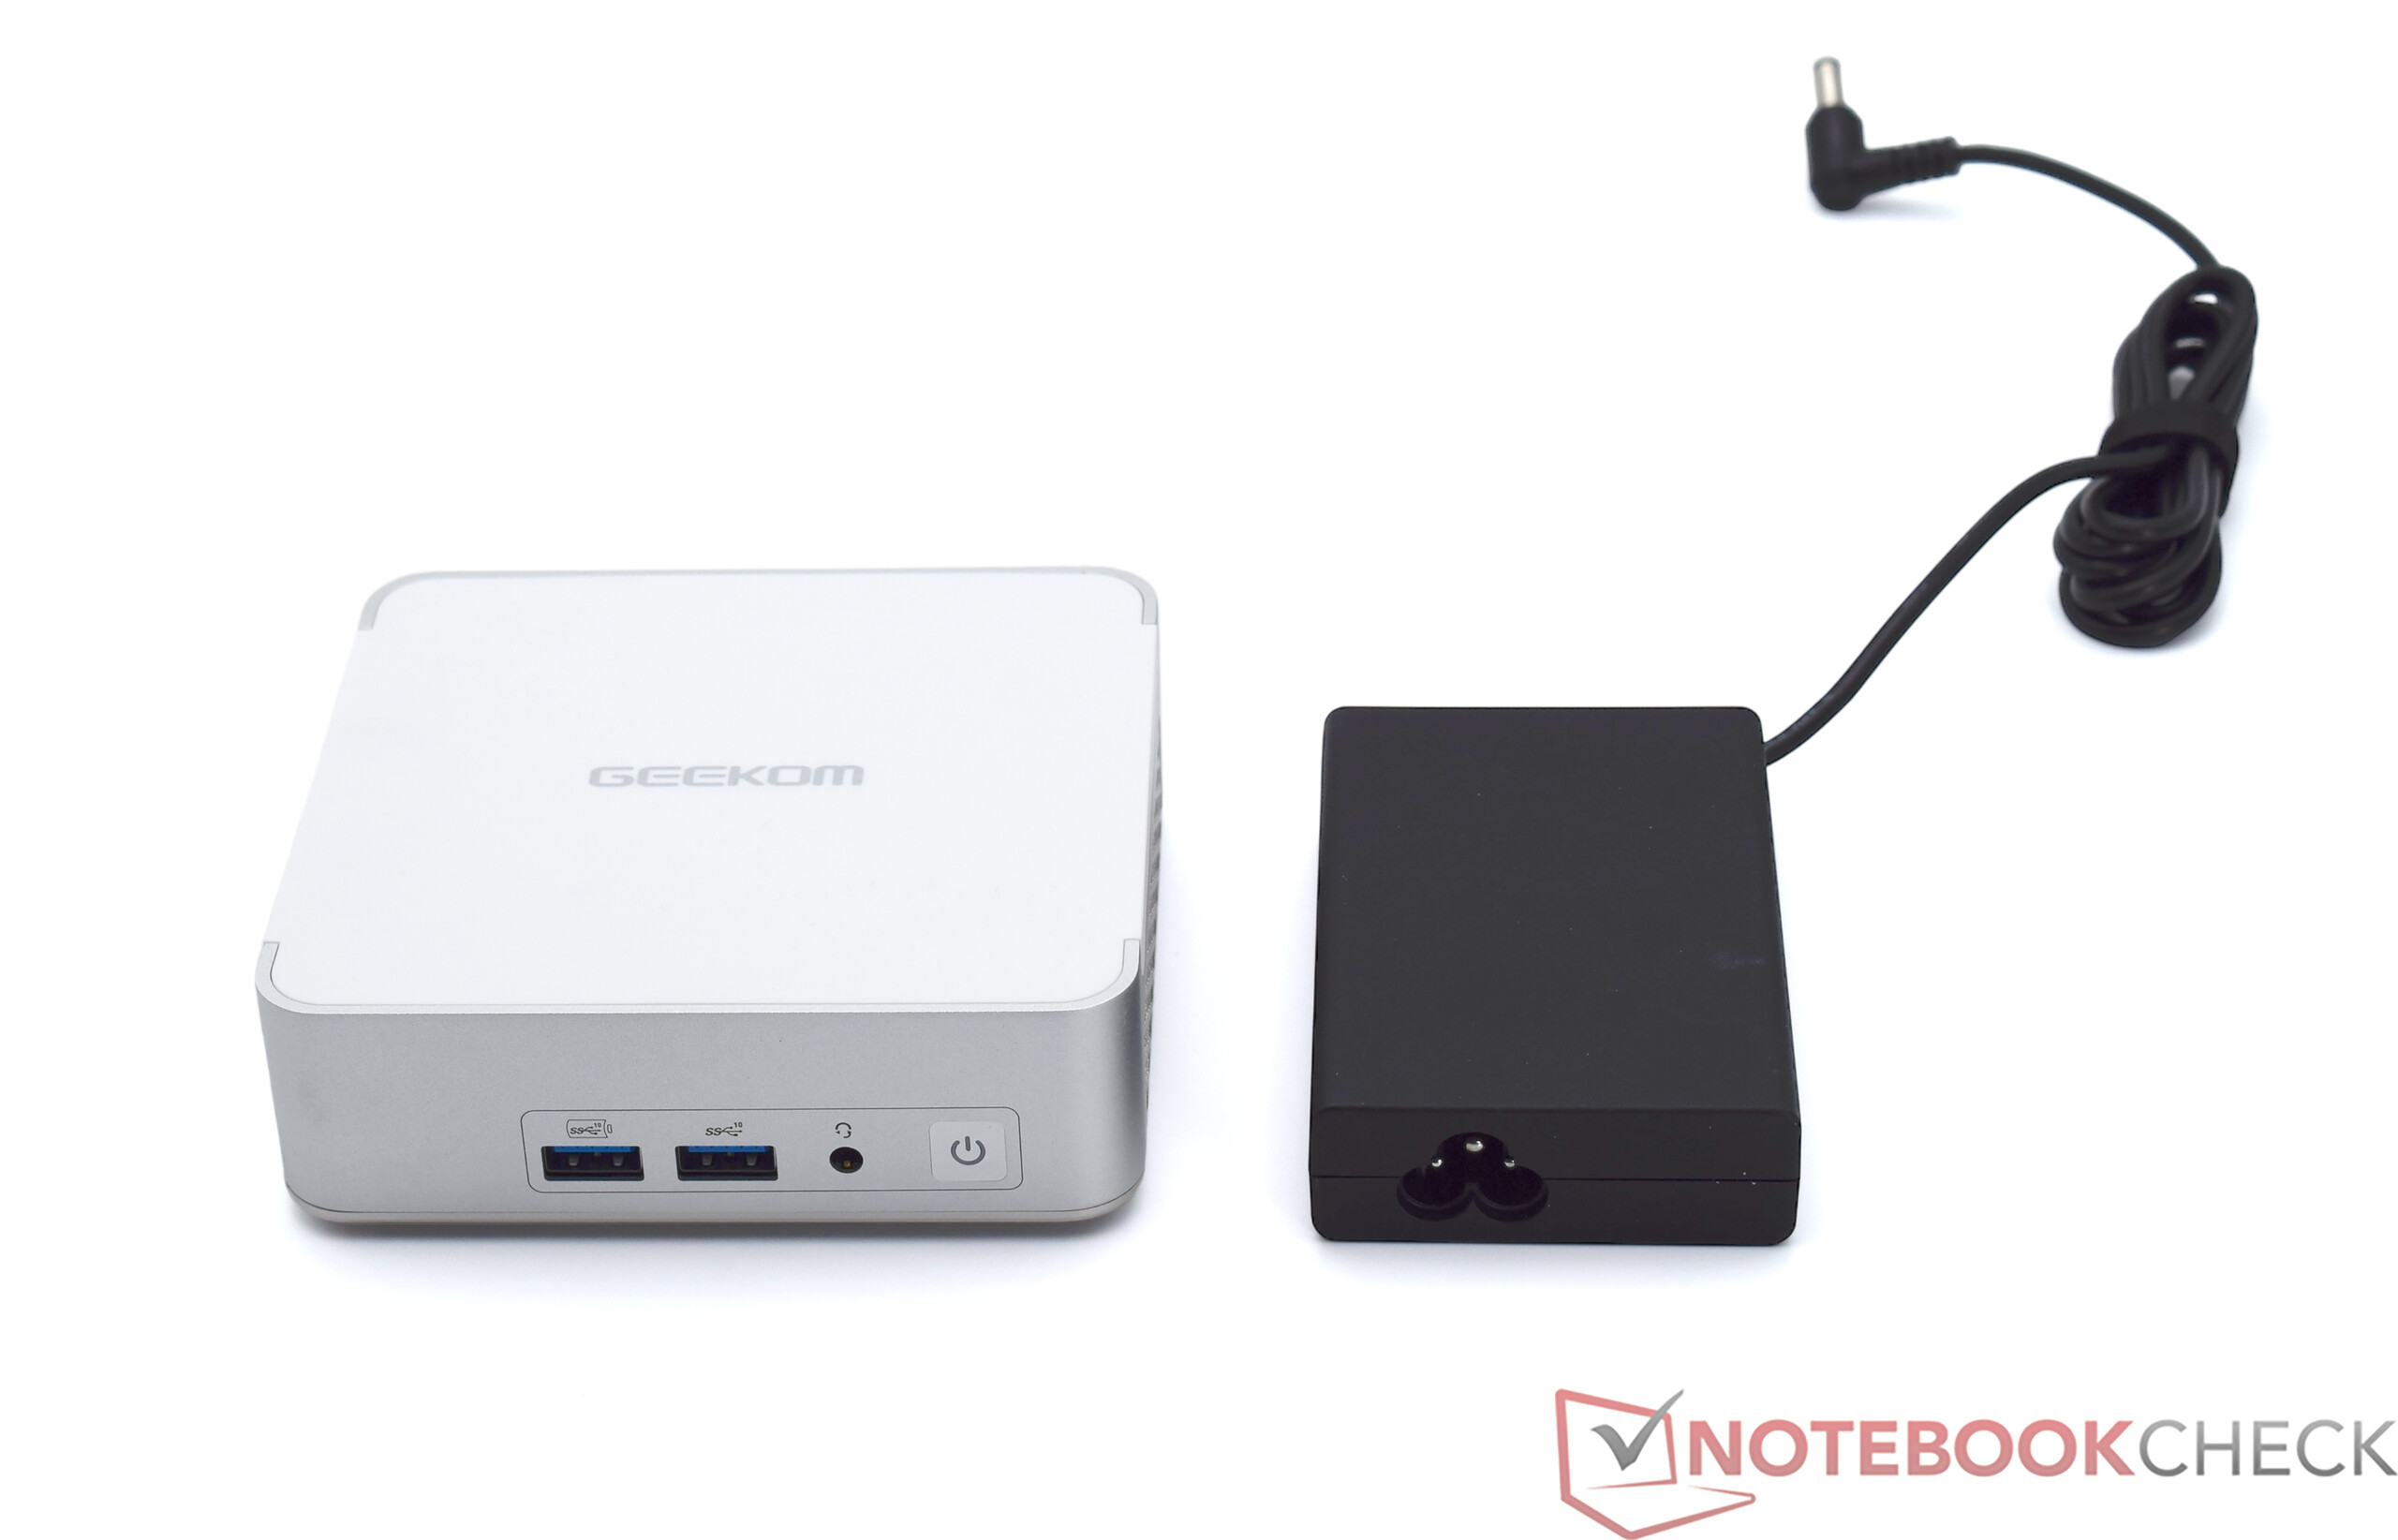
Accessoires
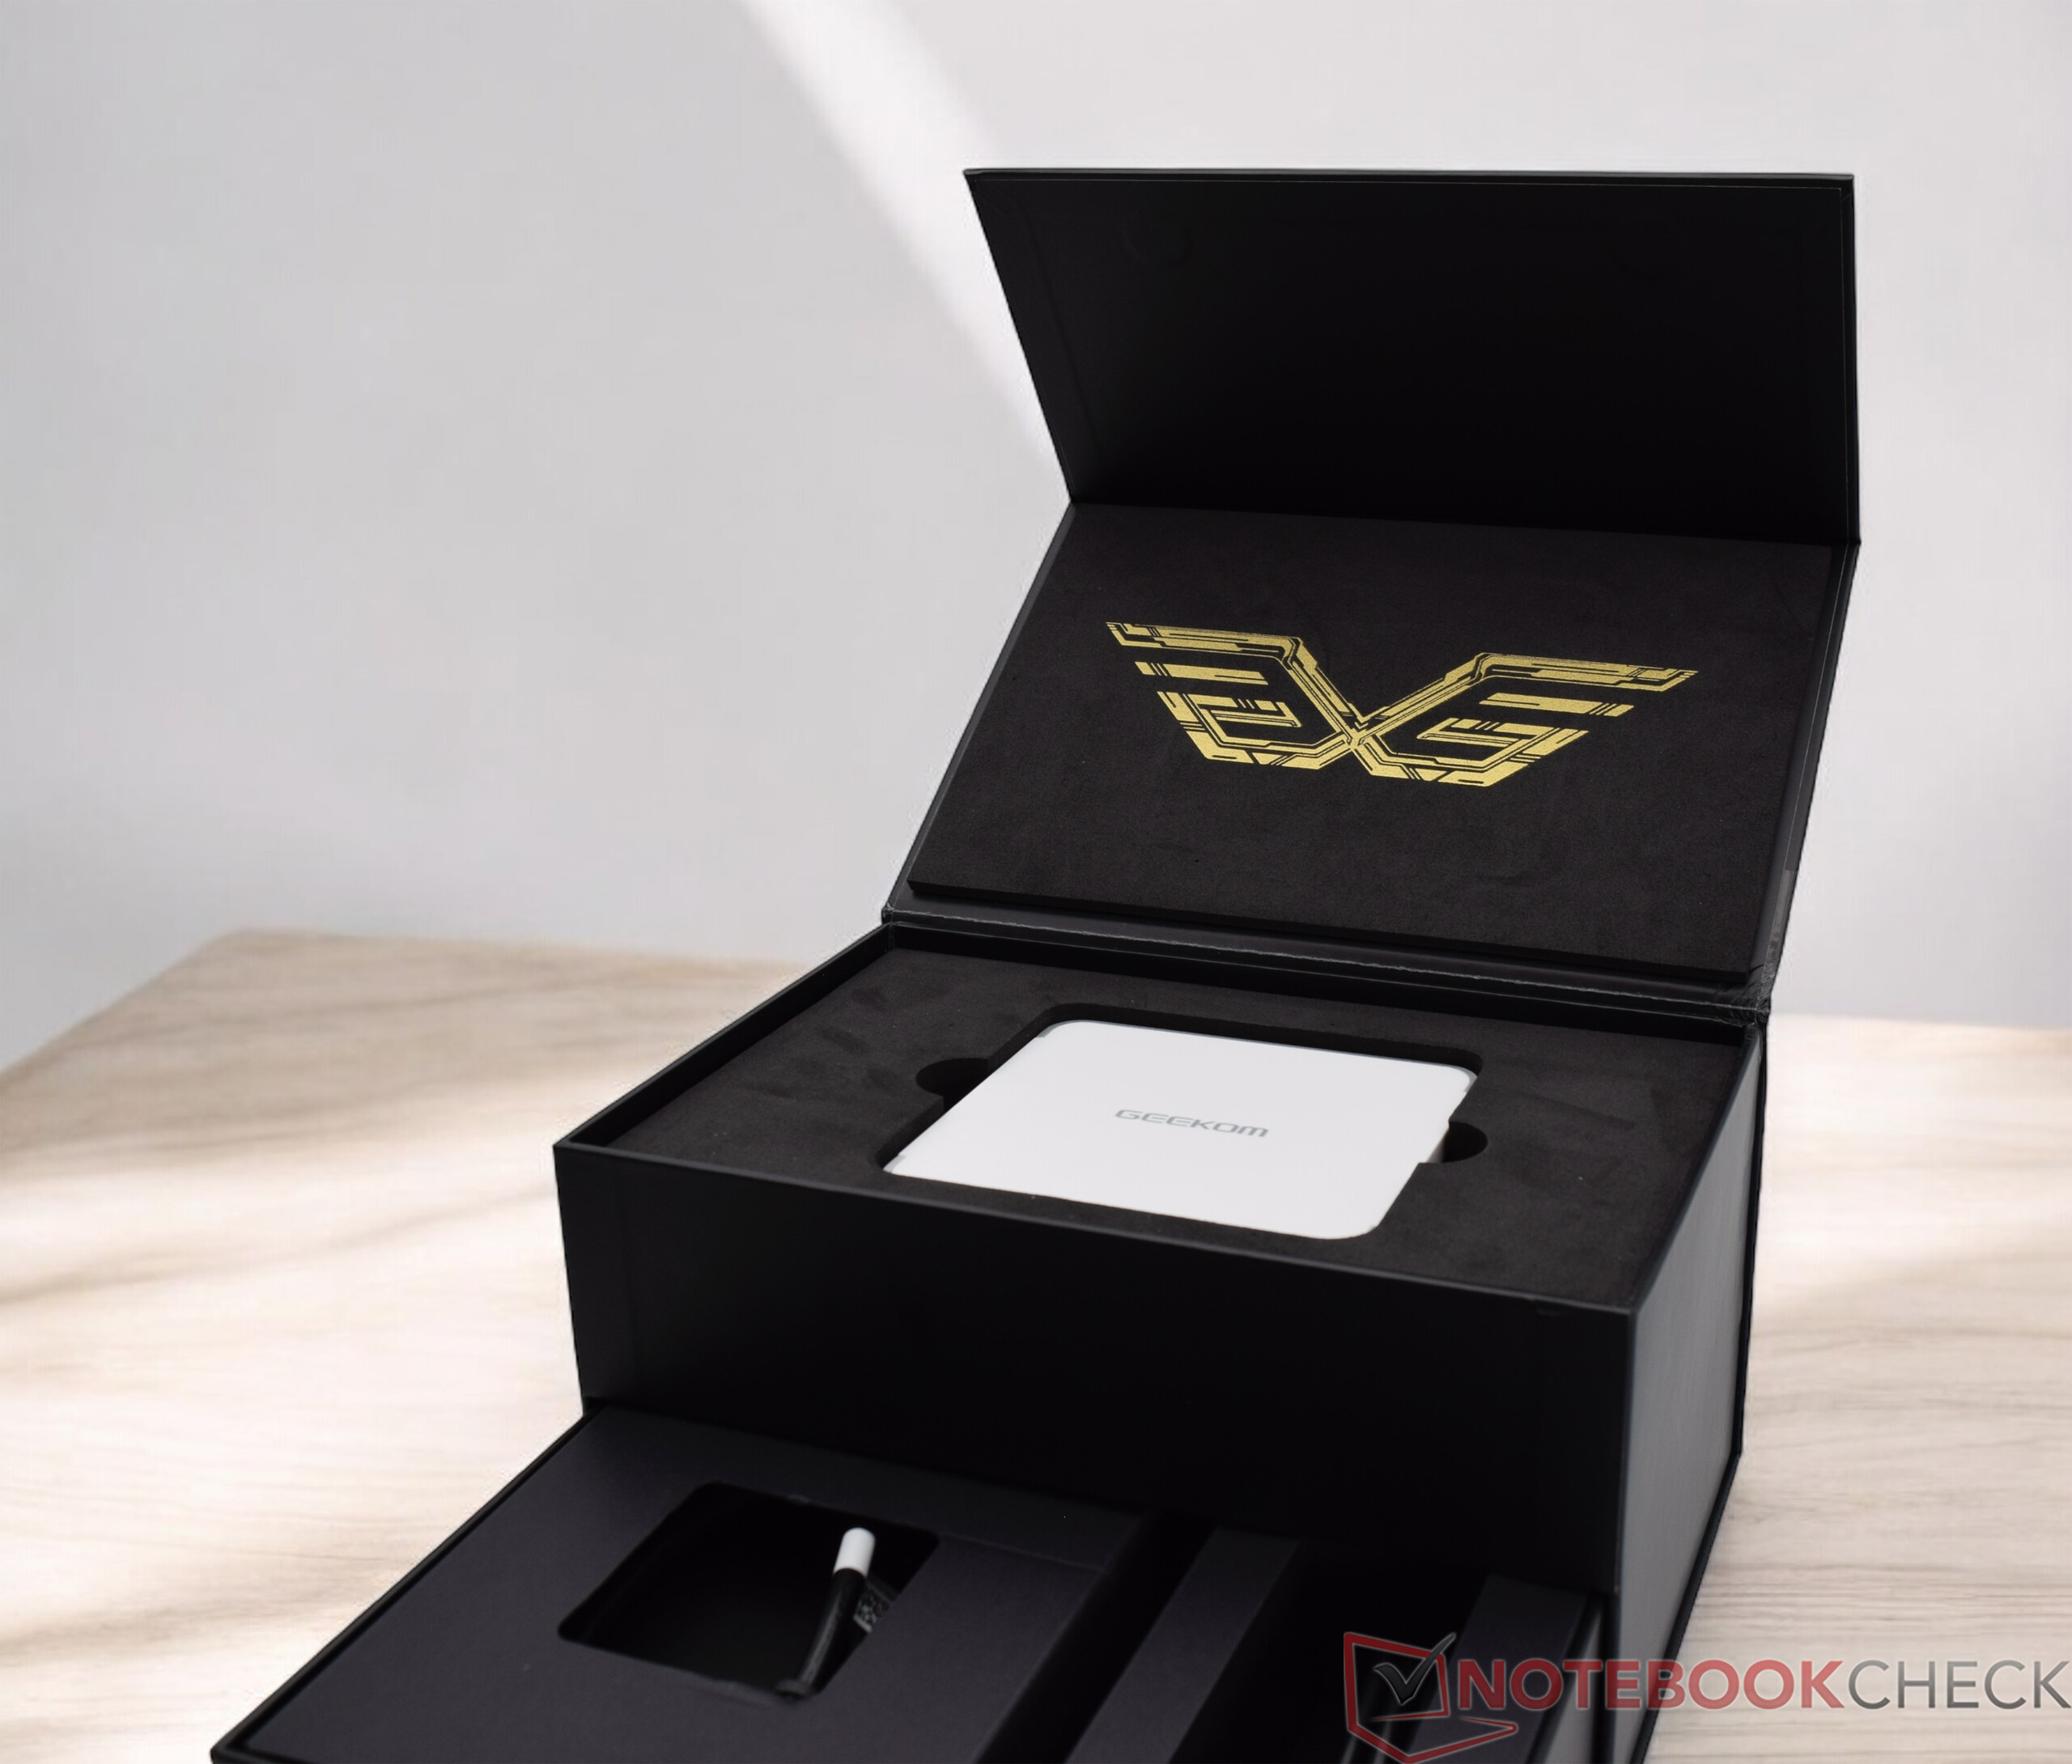
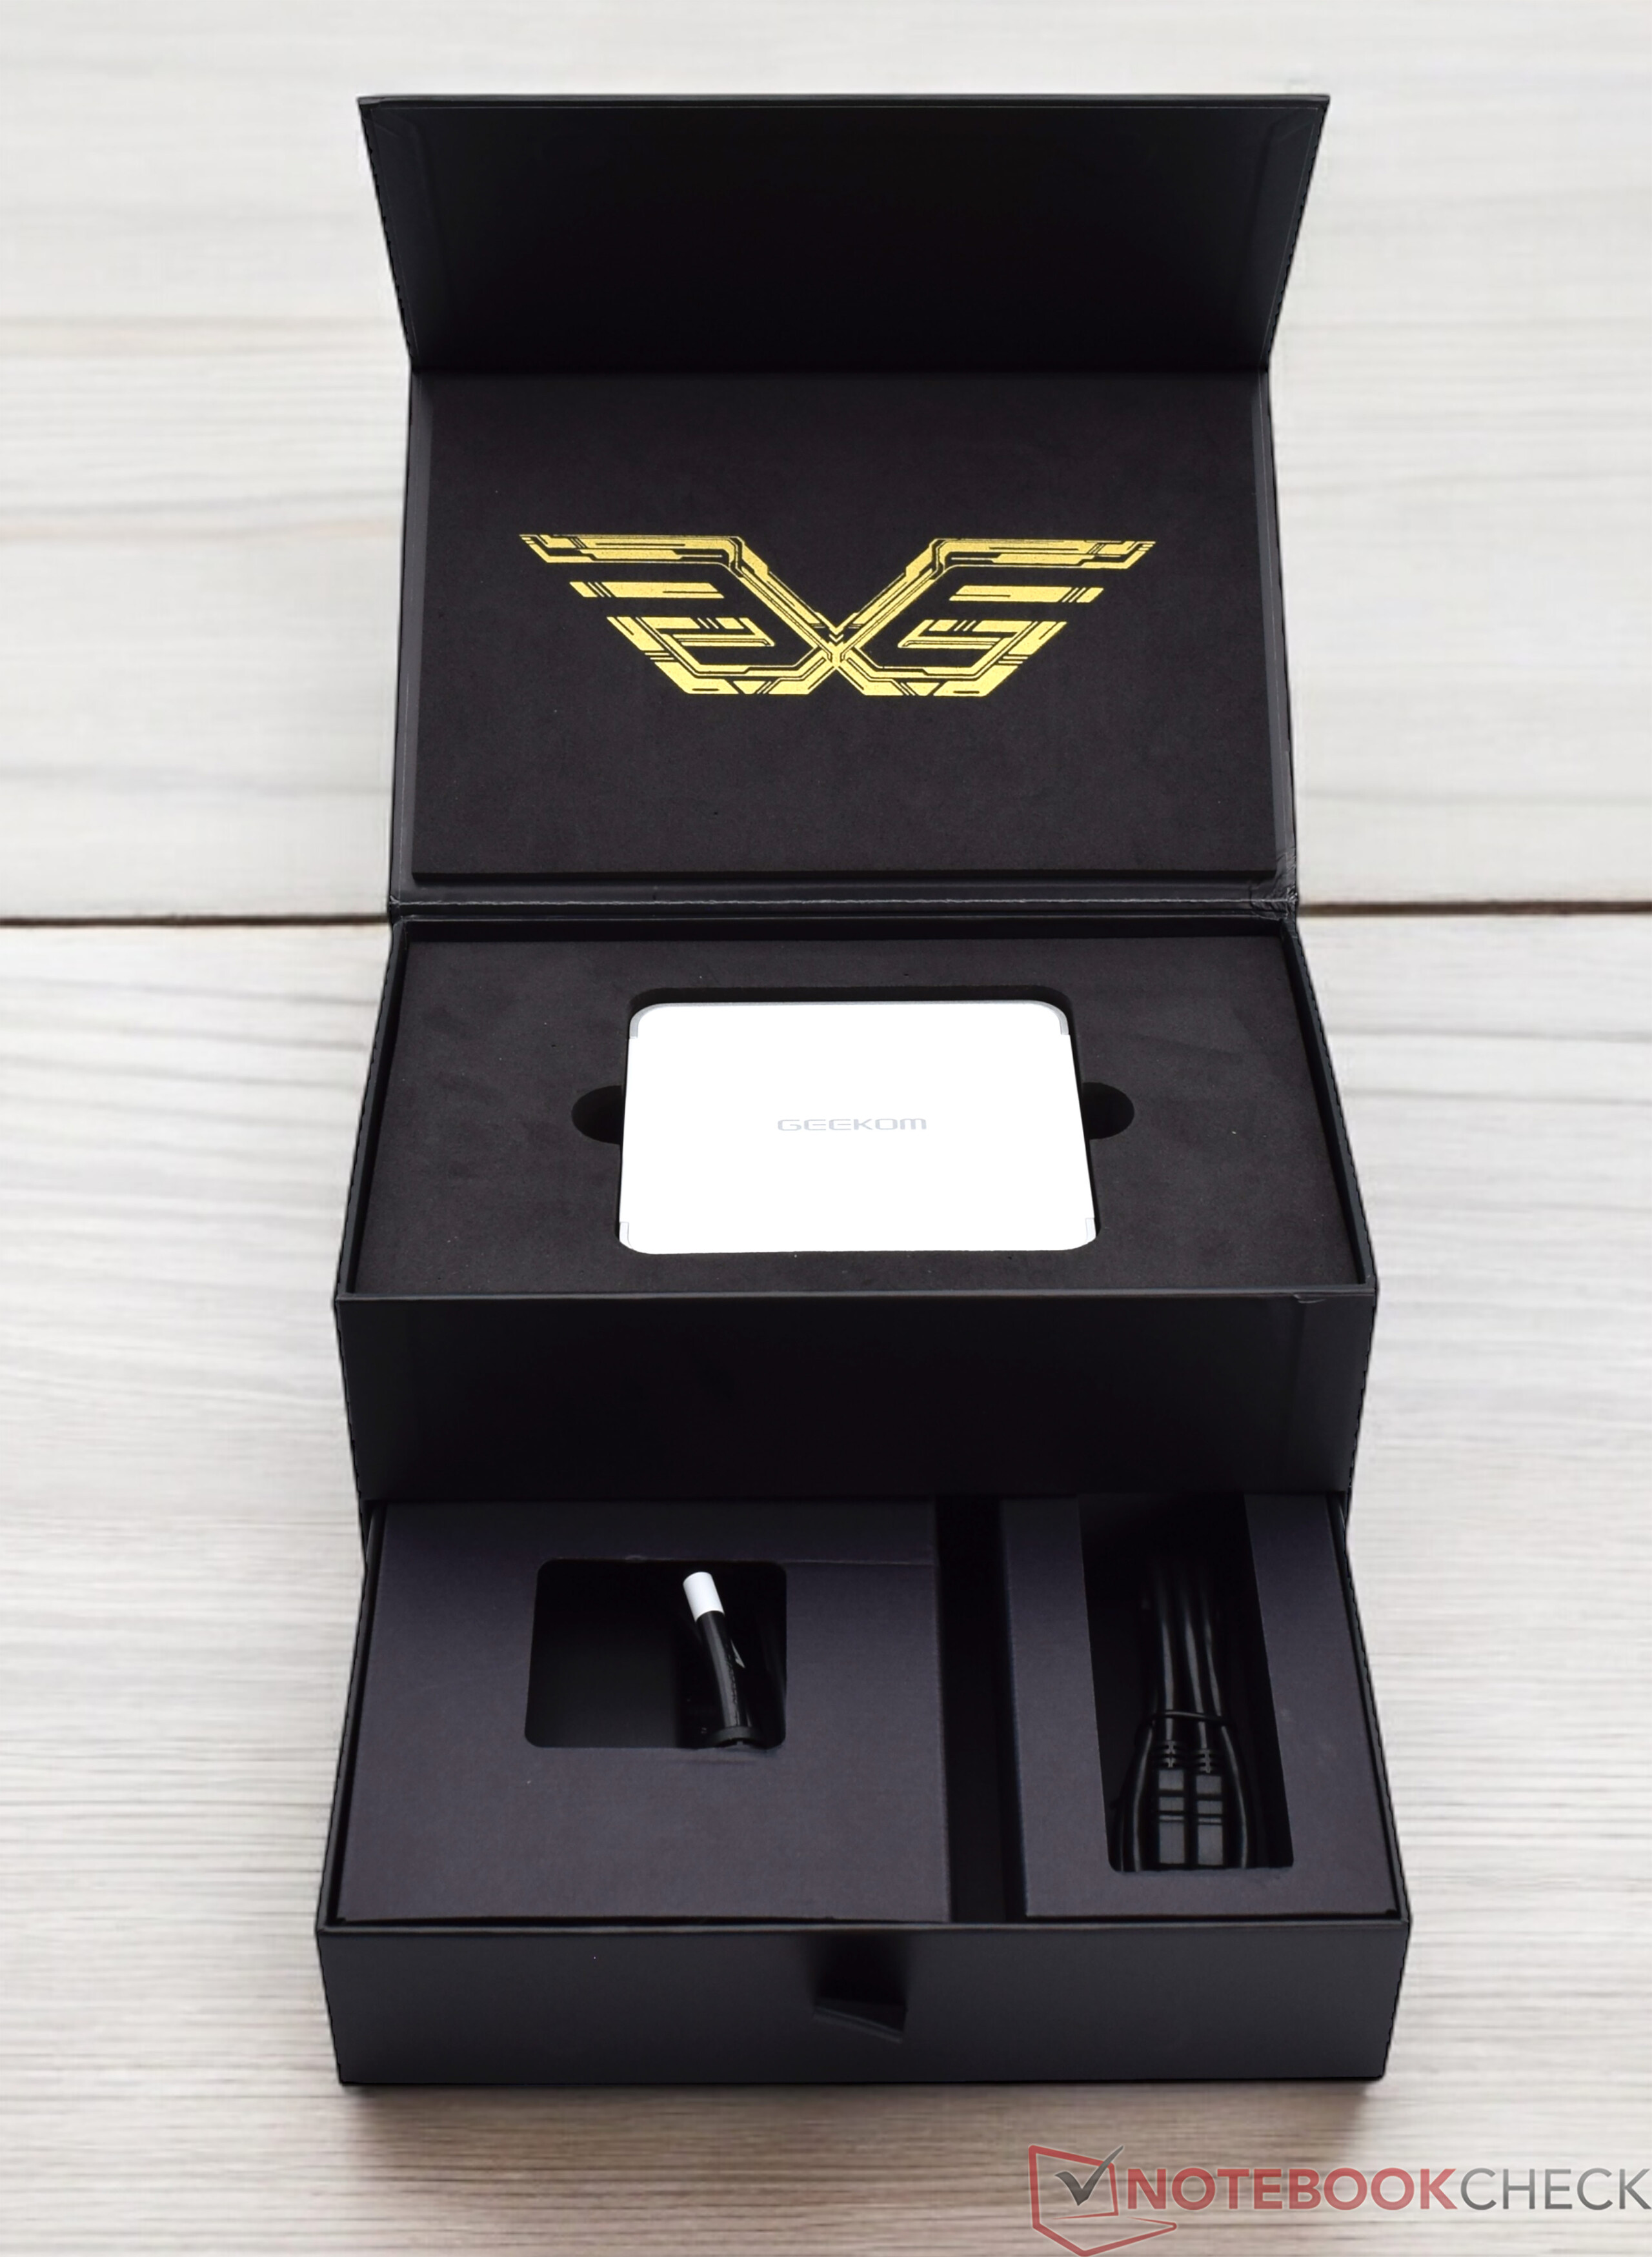
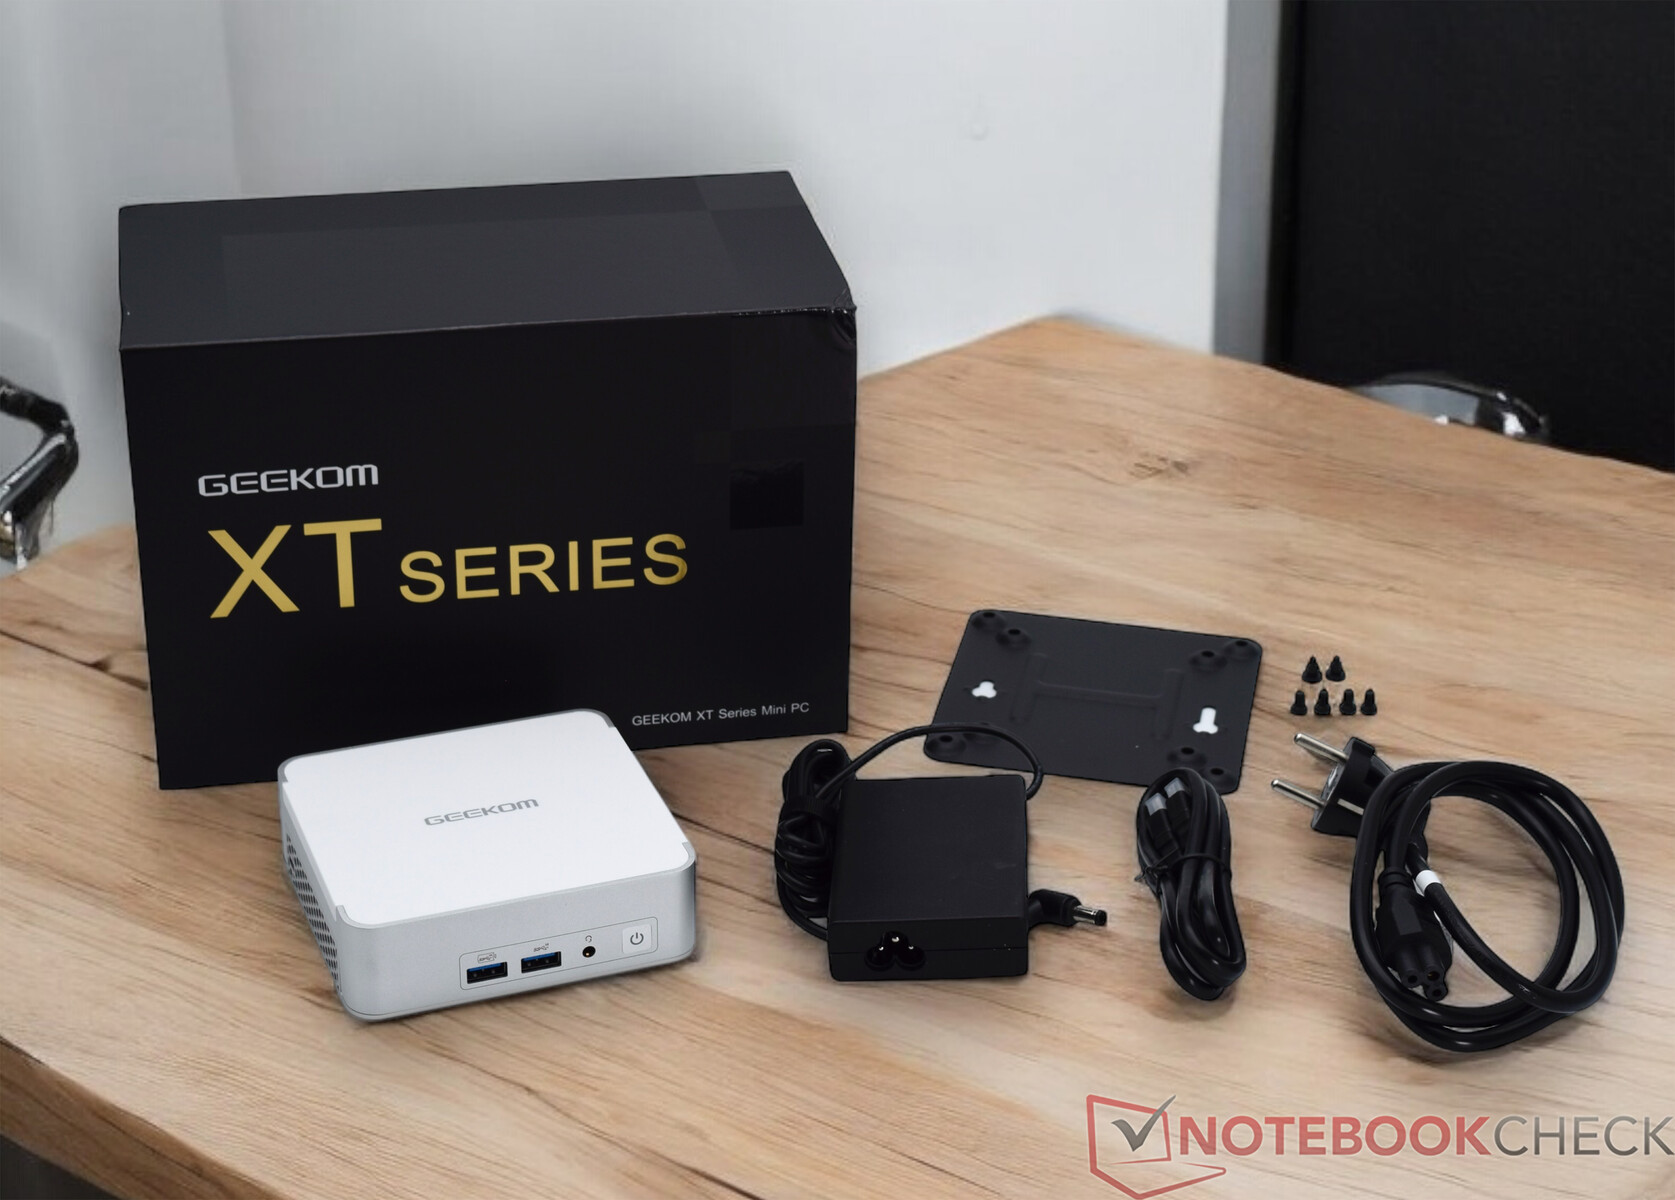
De leveringsomvang van de Geekom XT13 Pro is zoals gebruikelijk. Naast het apparaat zelf, bevat de doos ook de 120-watt voedingseenheid en een VESA-beugel met bevestigingsmateriaal. Een HDMI-kabel en het verplichte bedankkaartje van Geekom zijn ook inbegrepen.
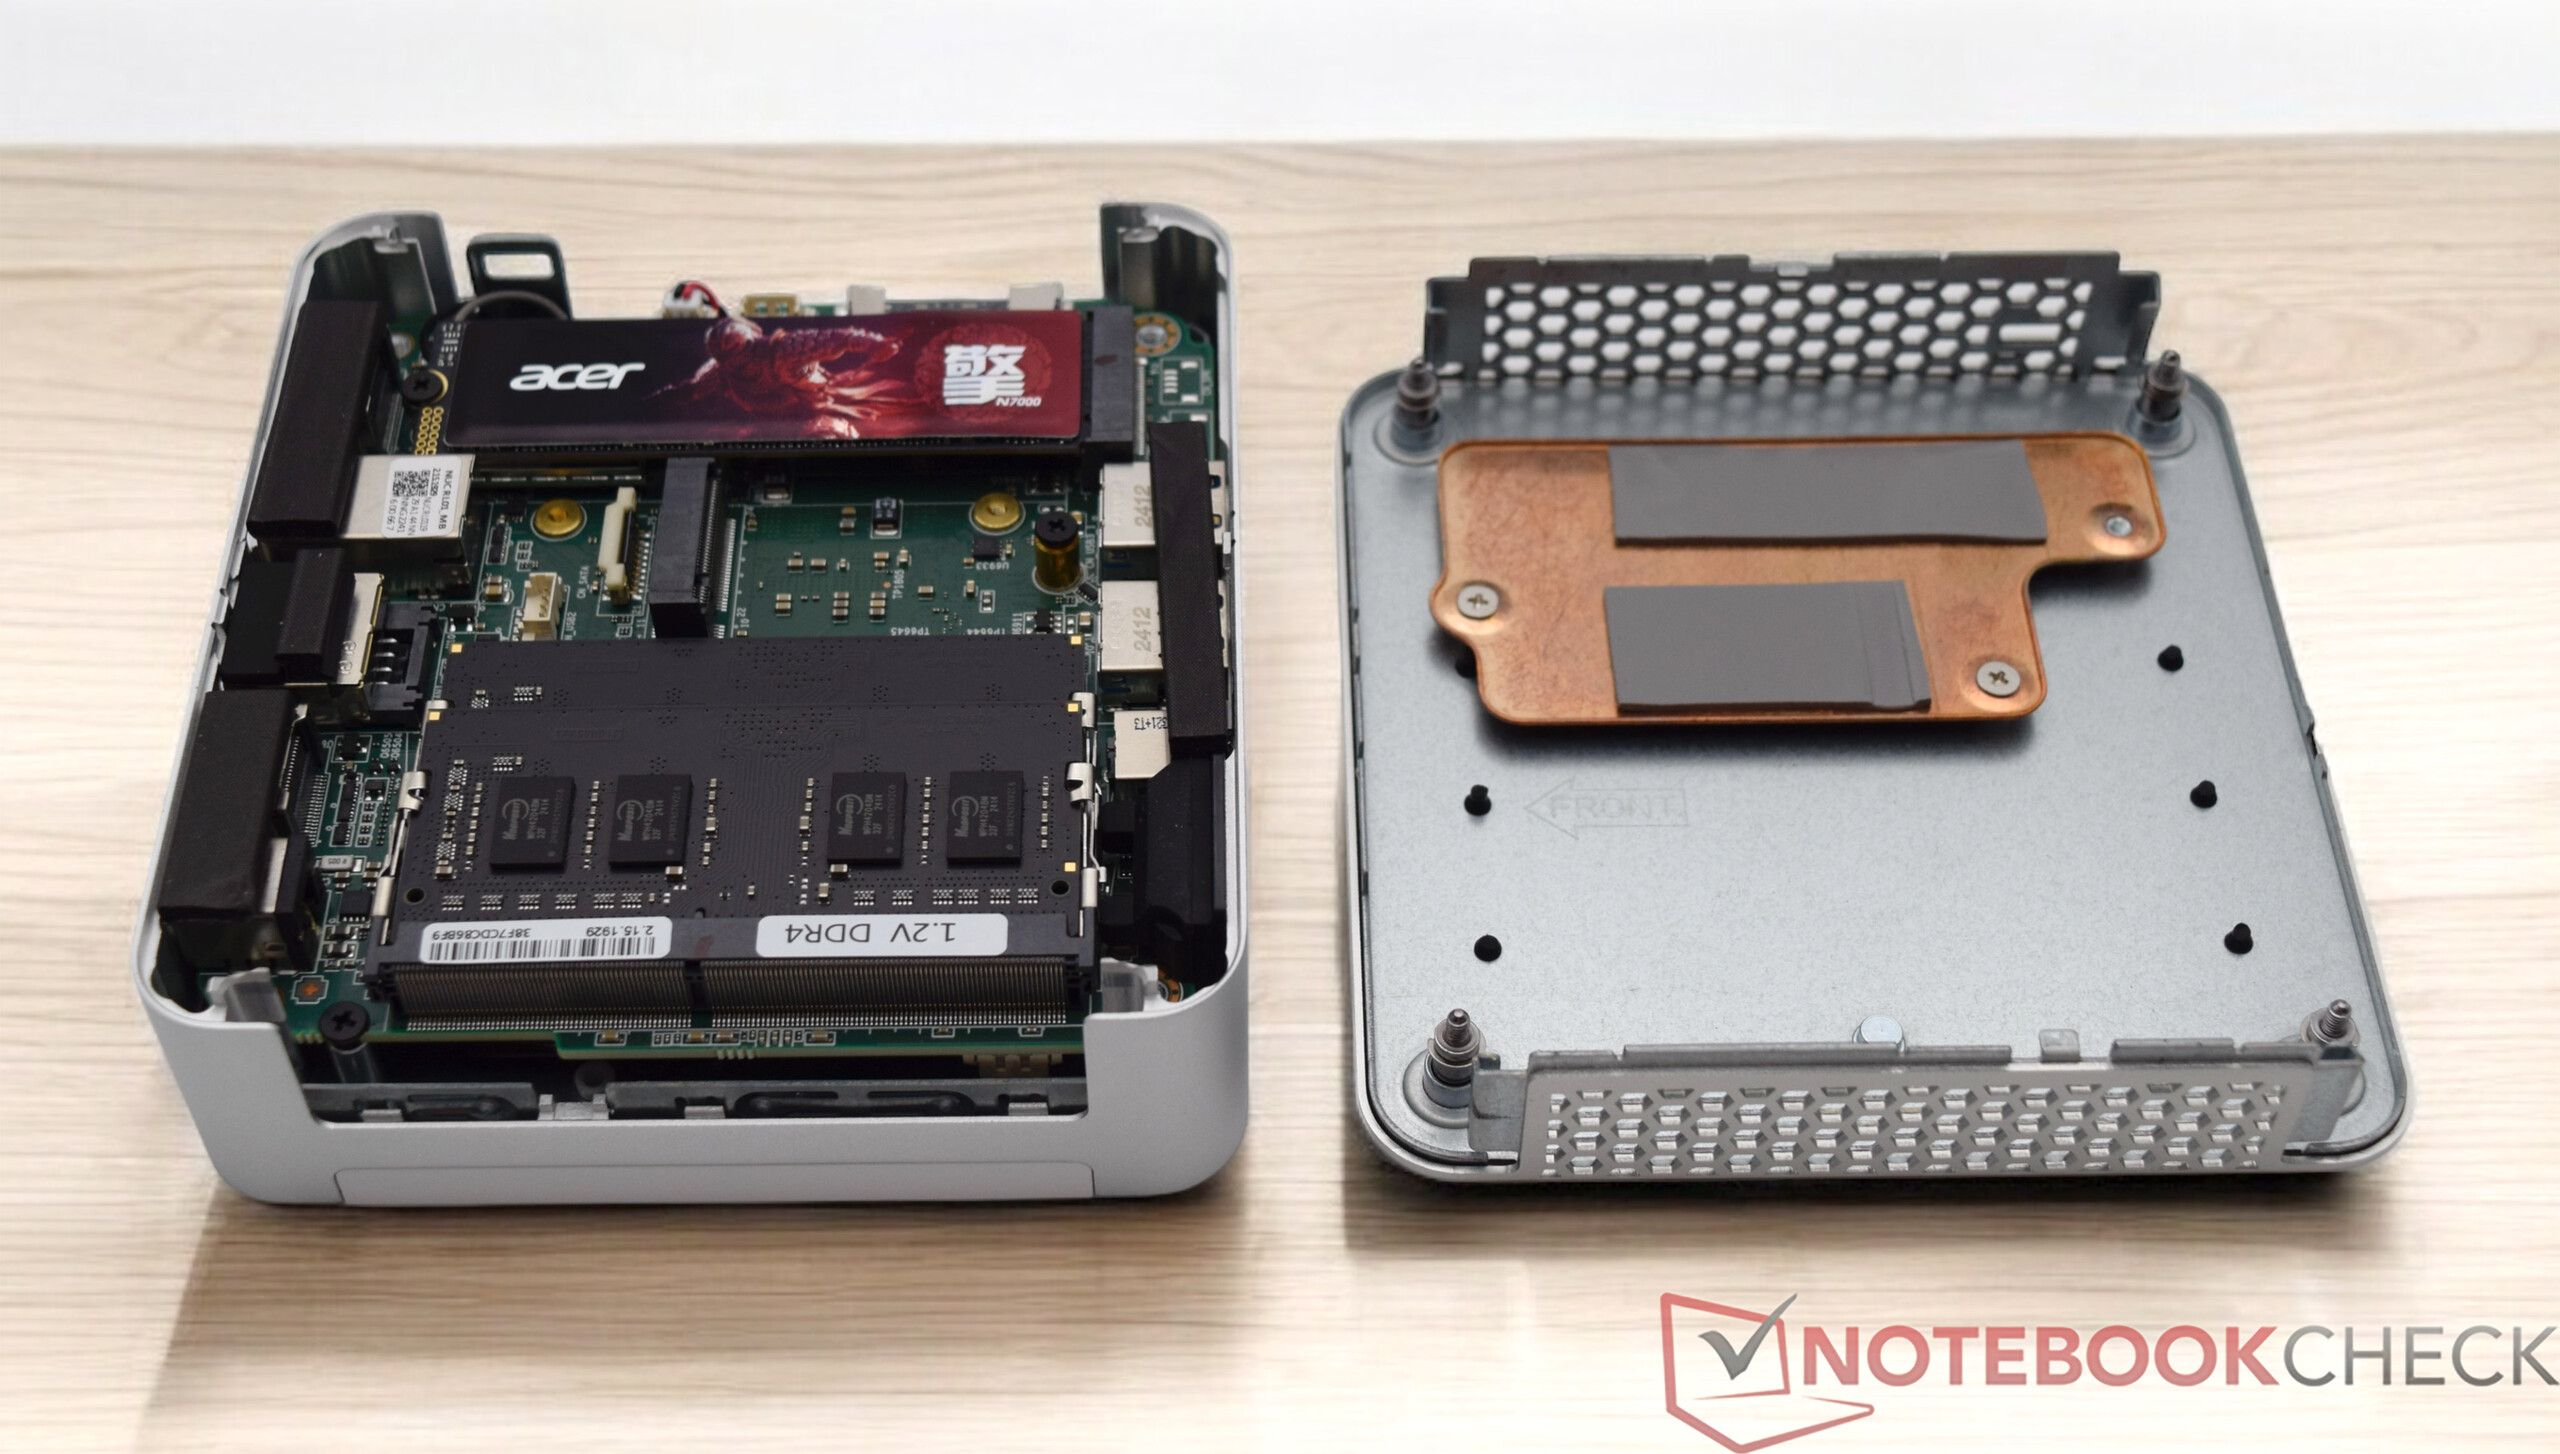
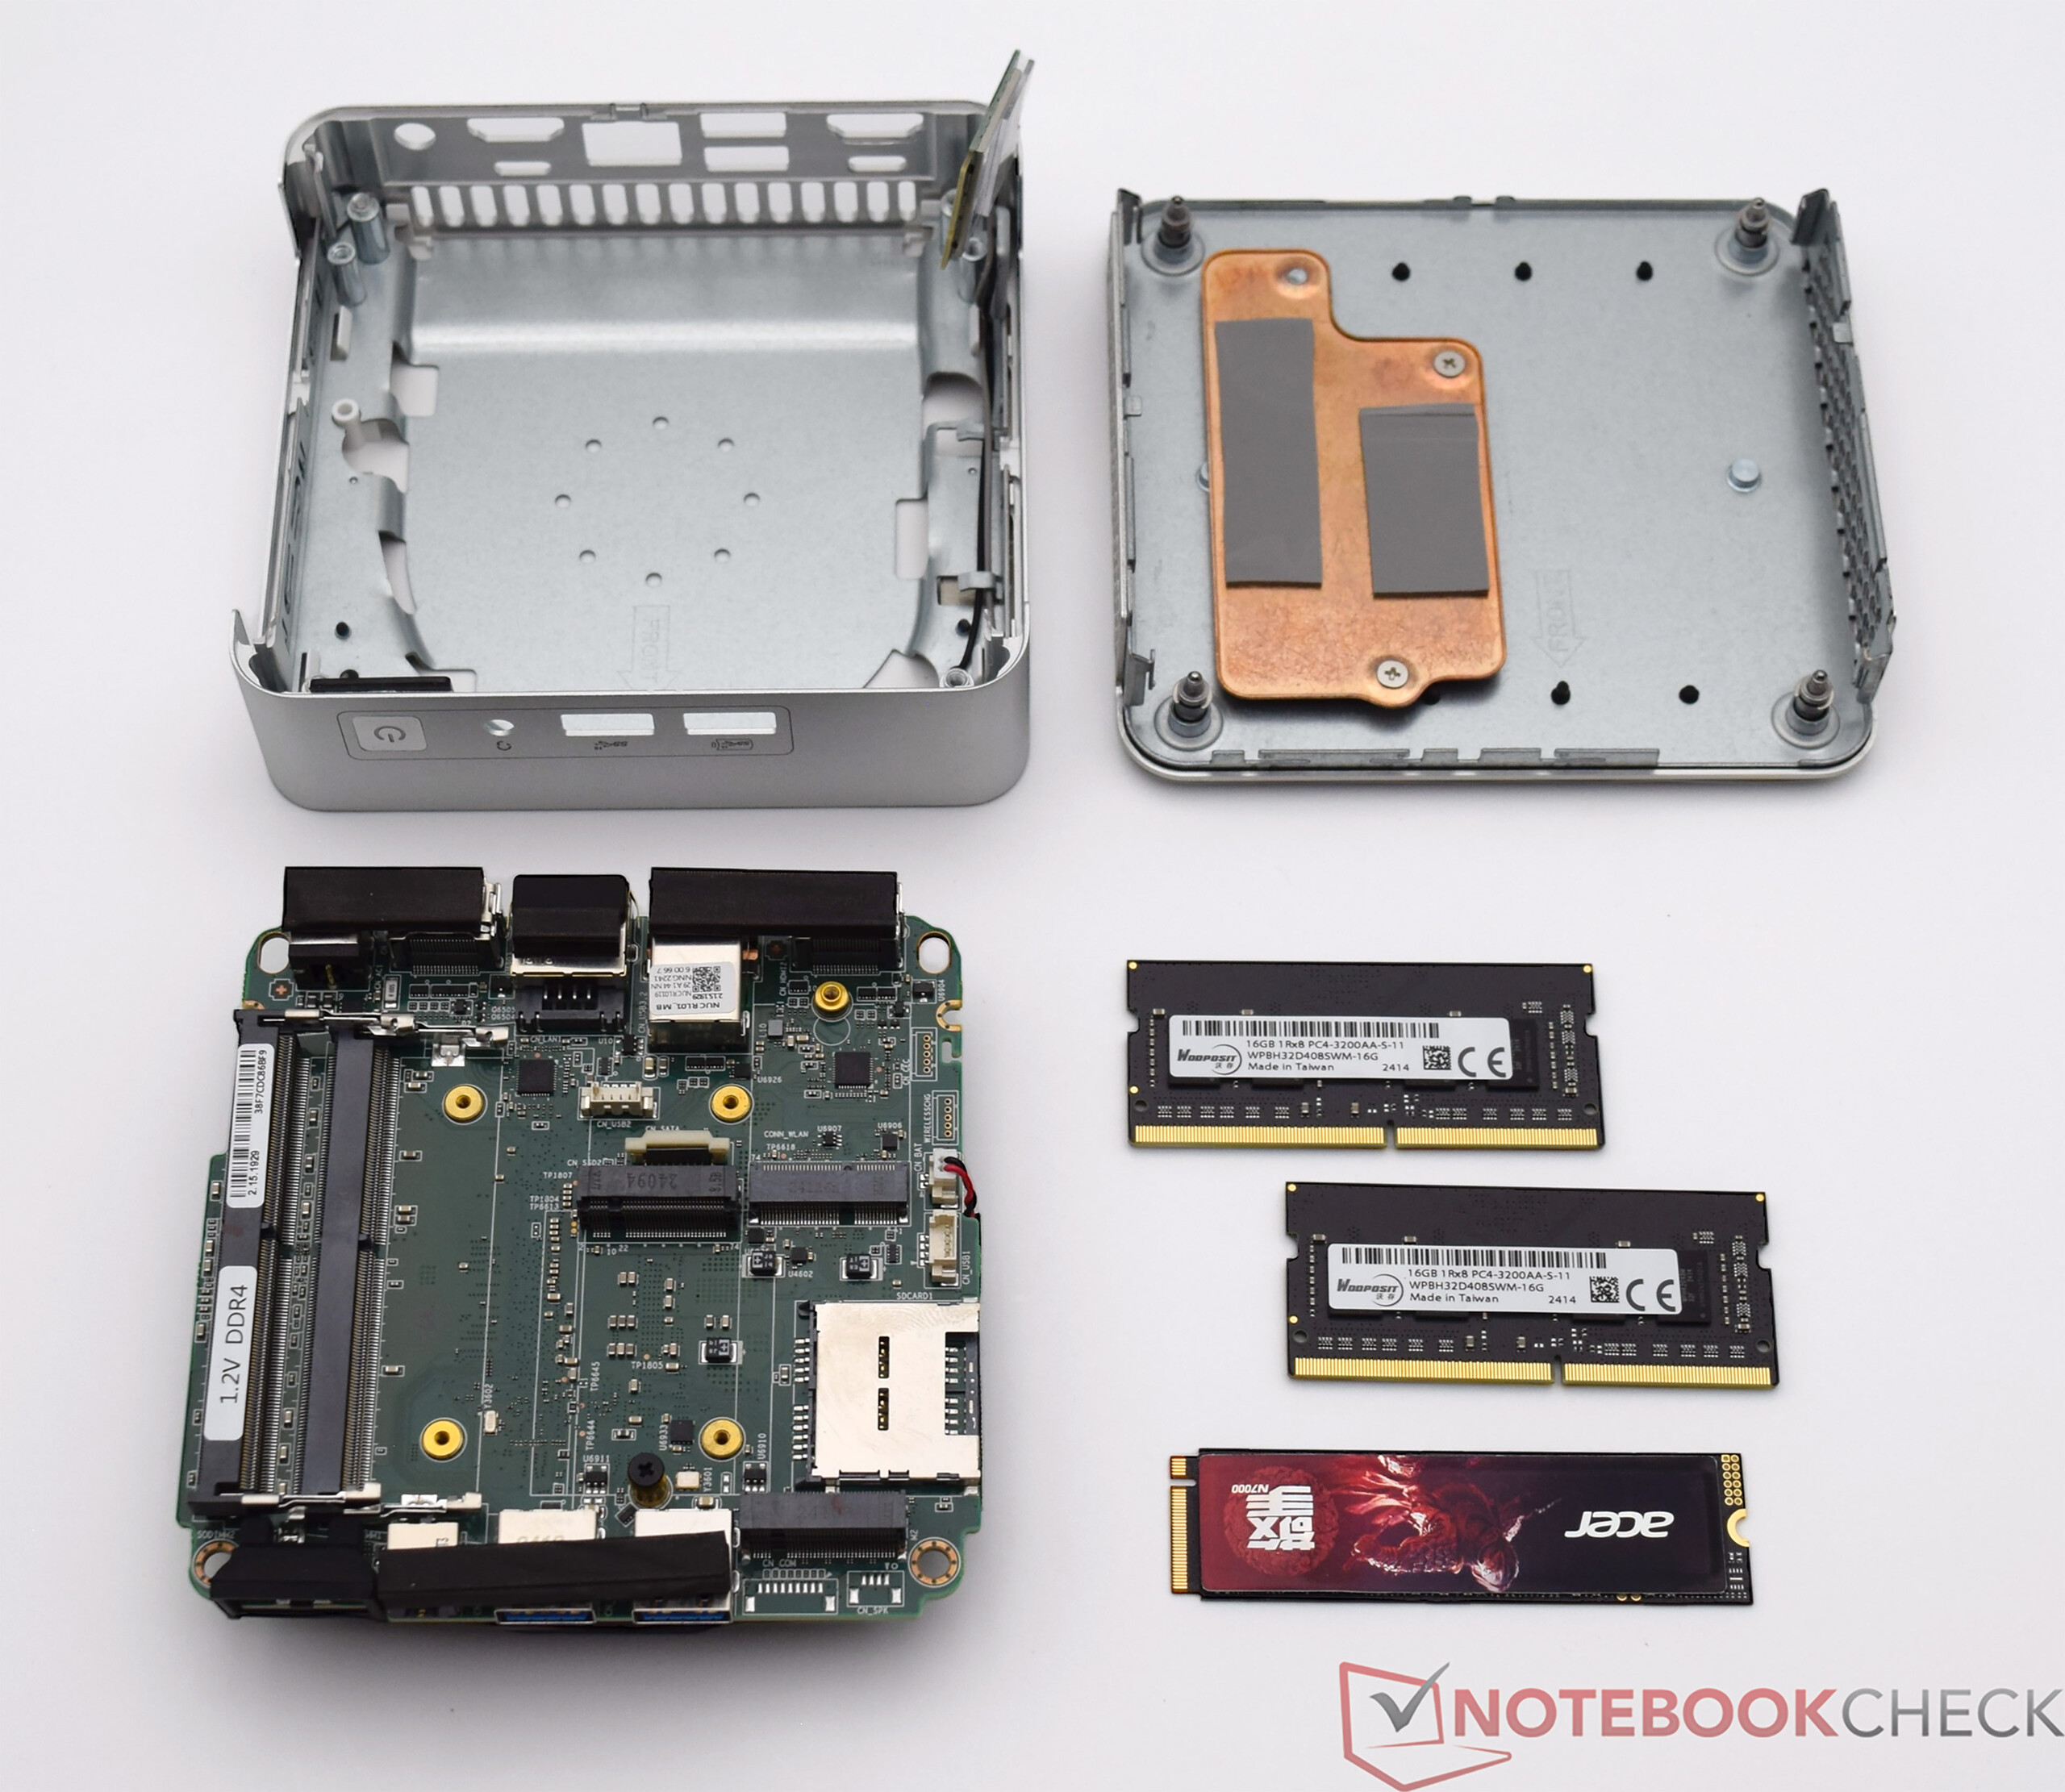
Onderhoud
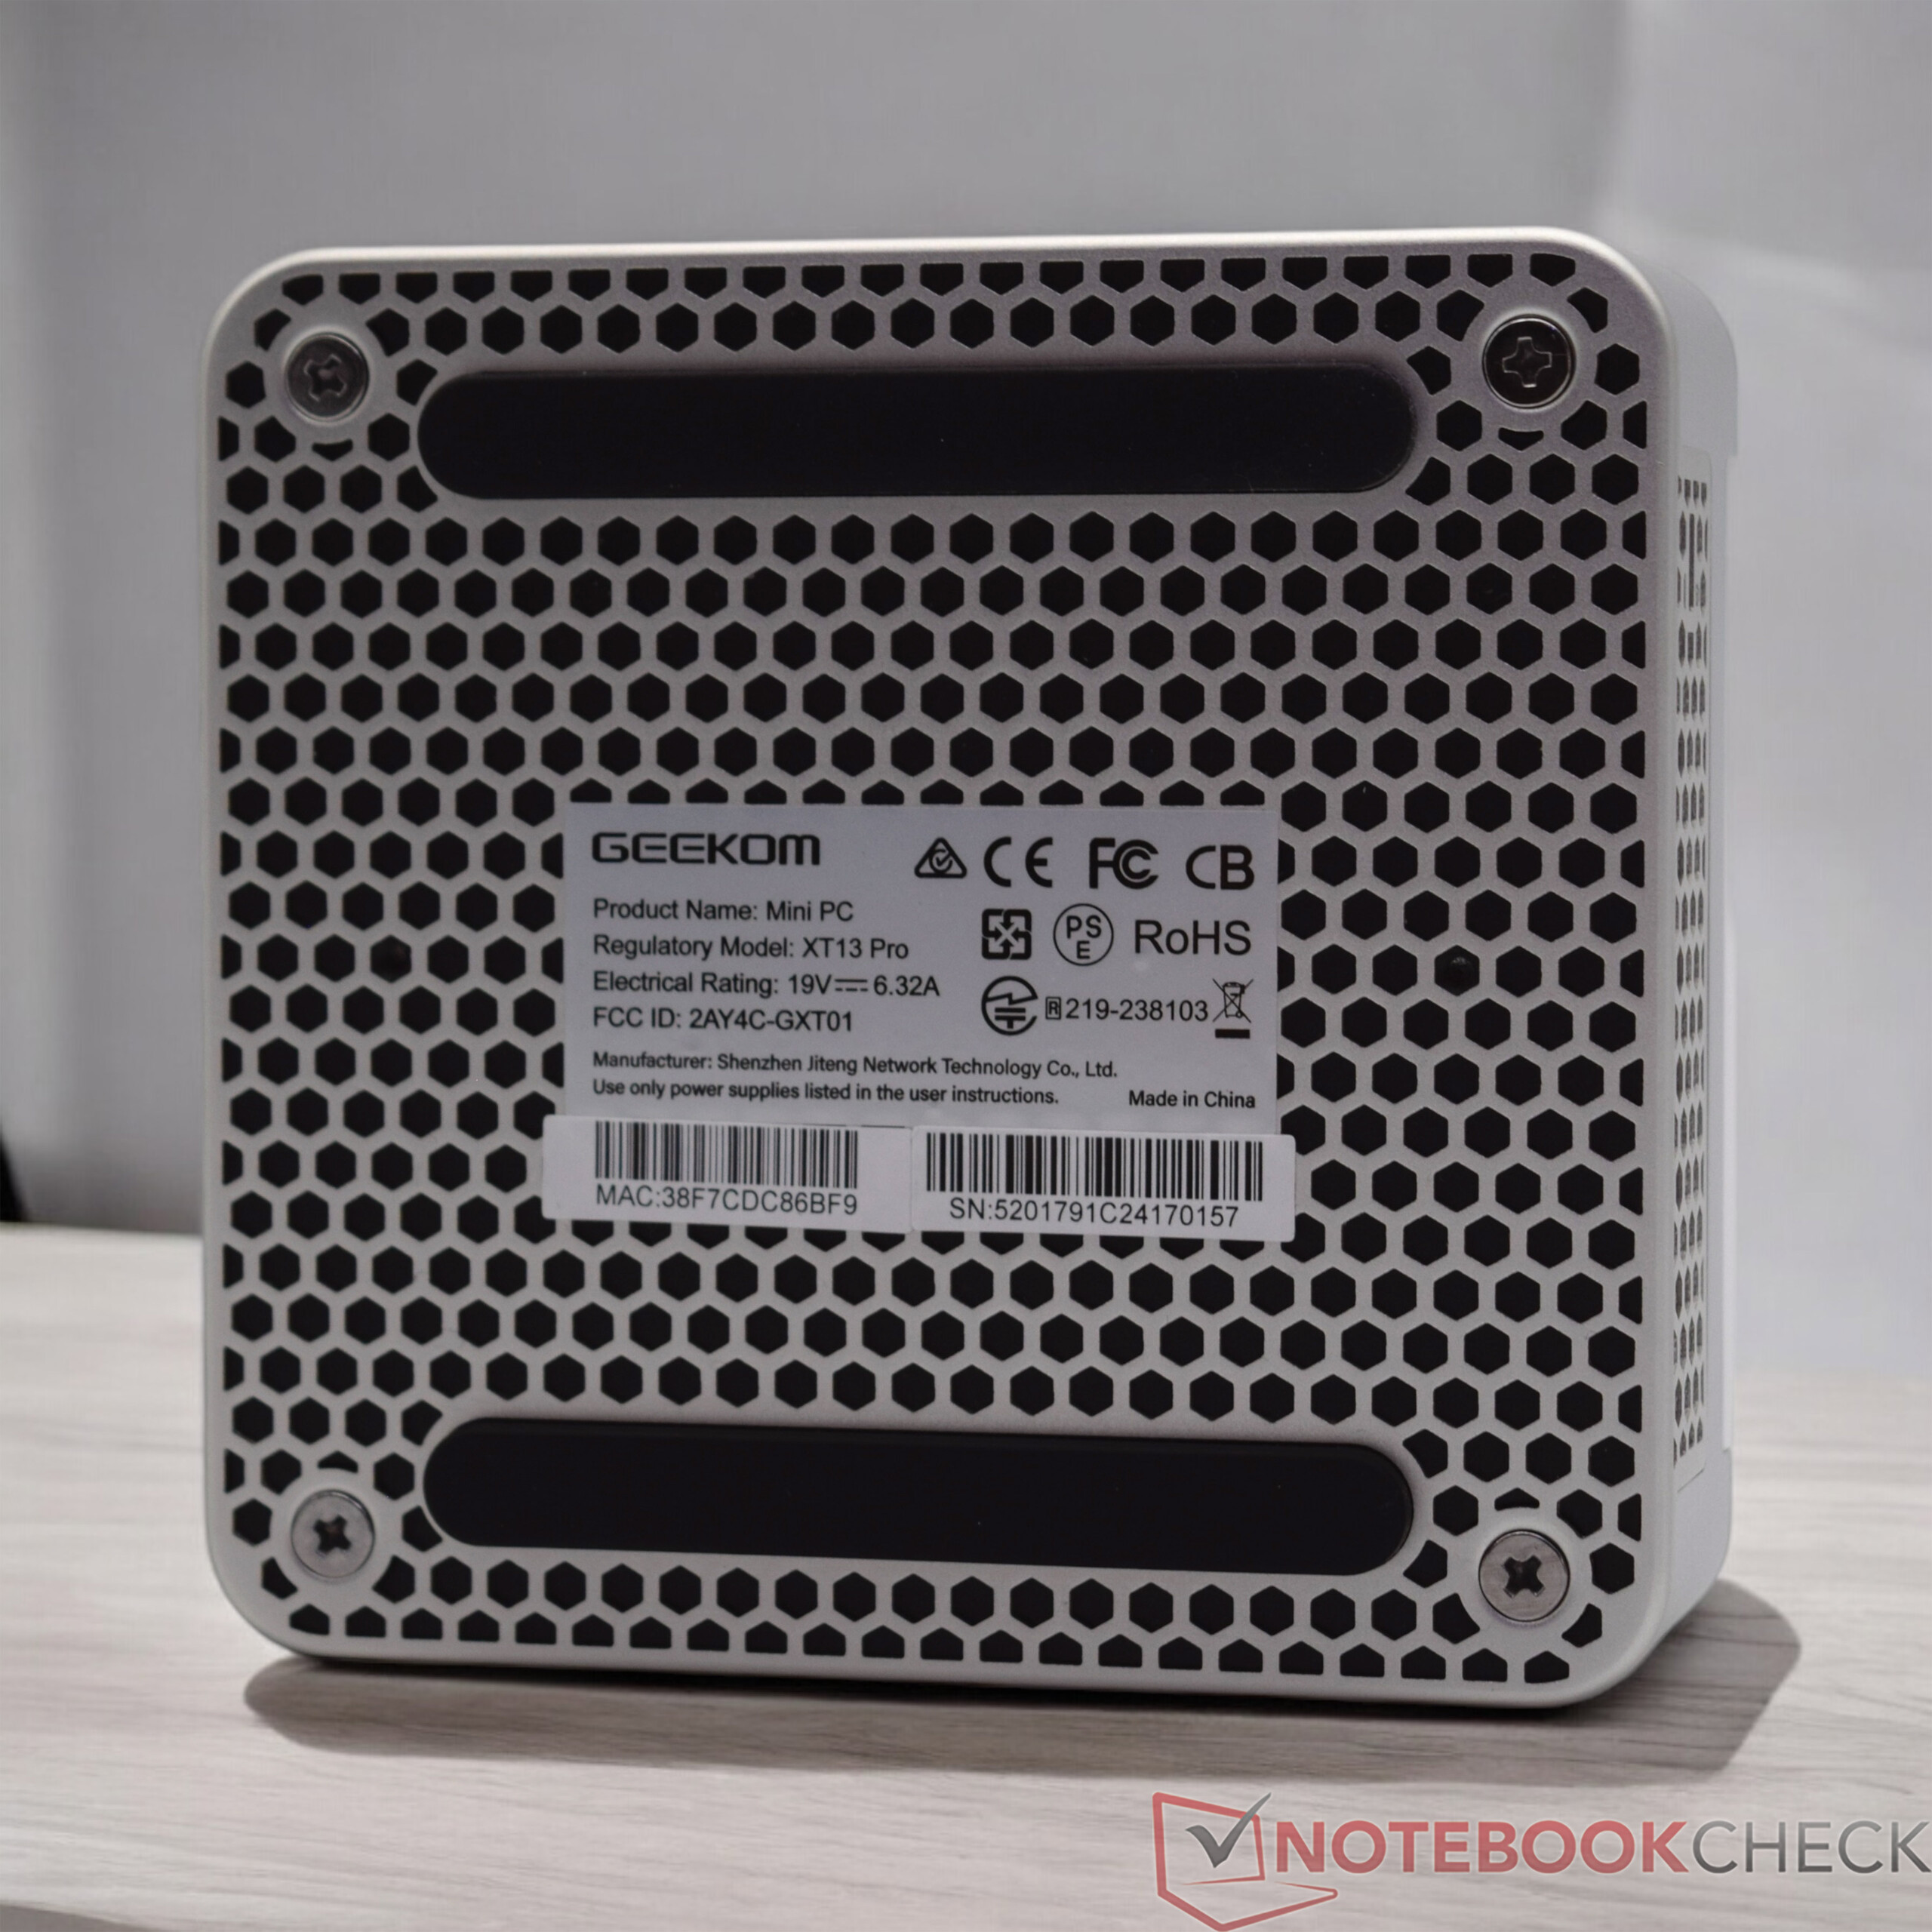
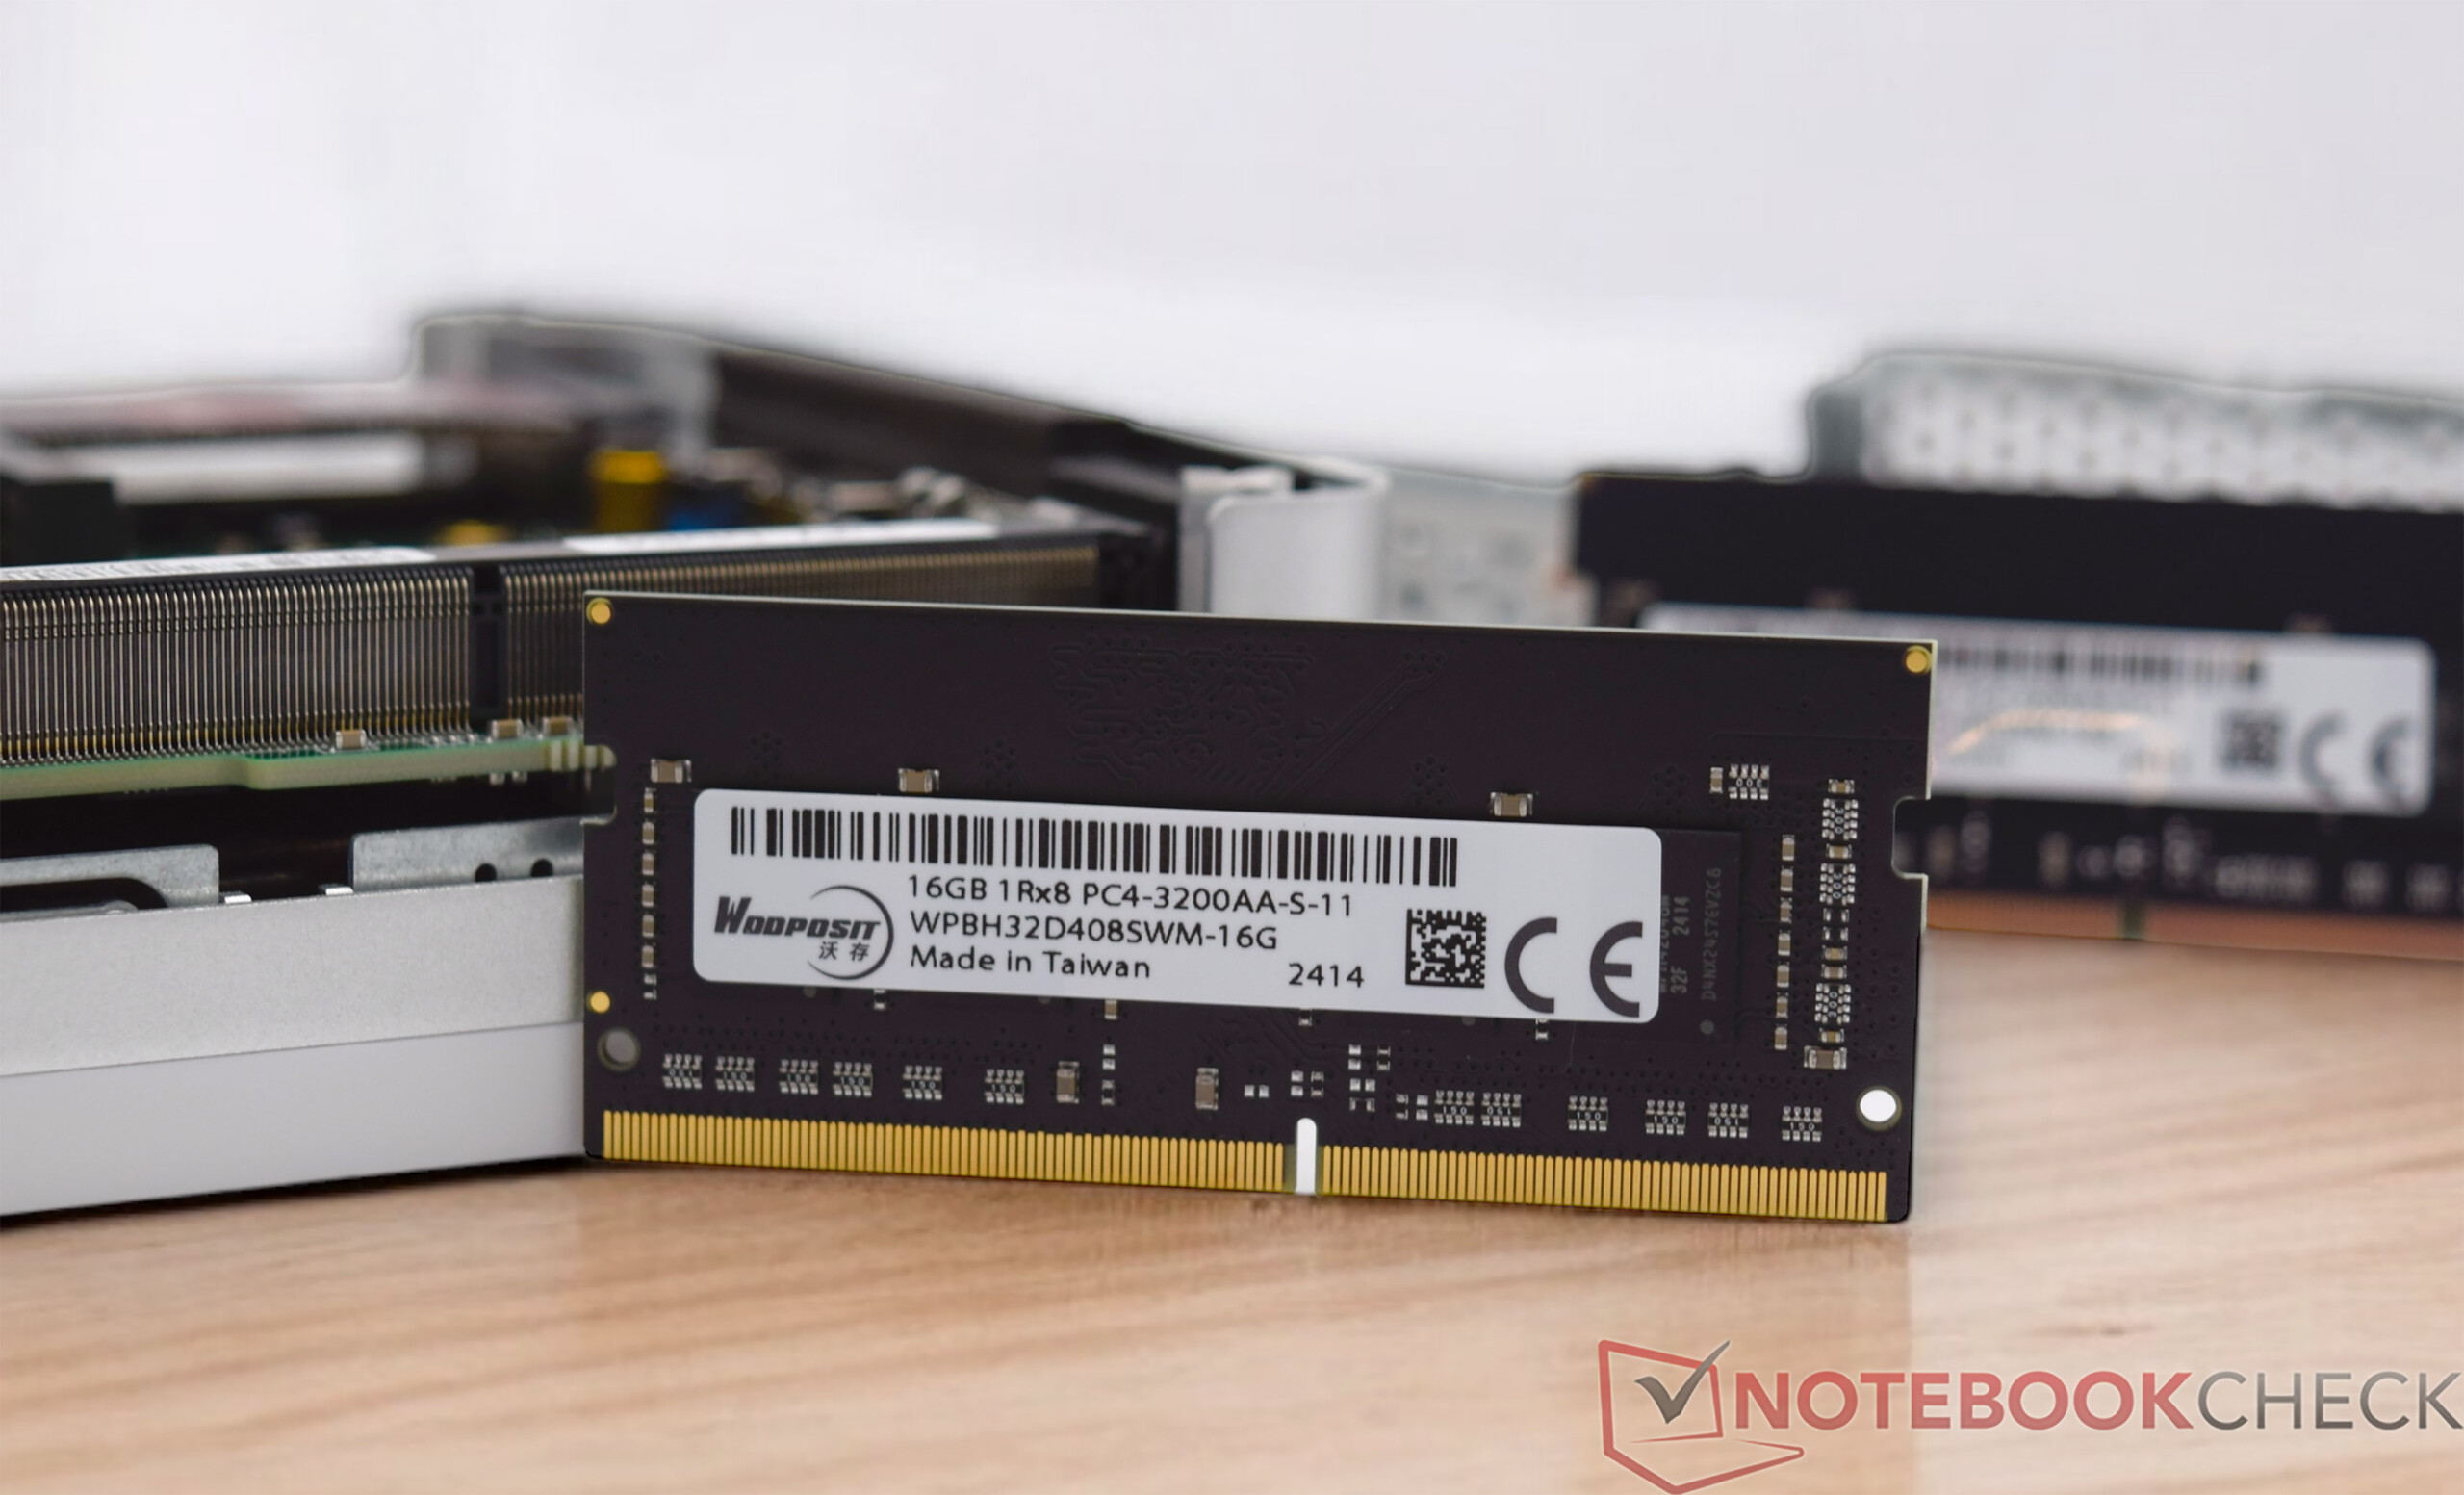
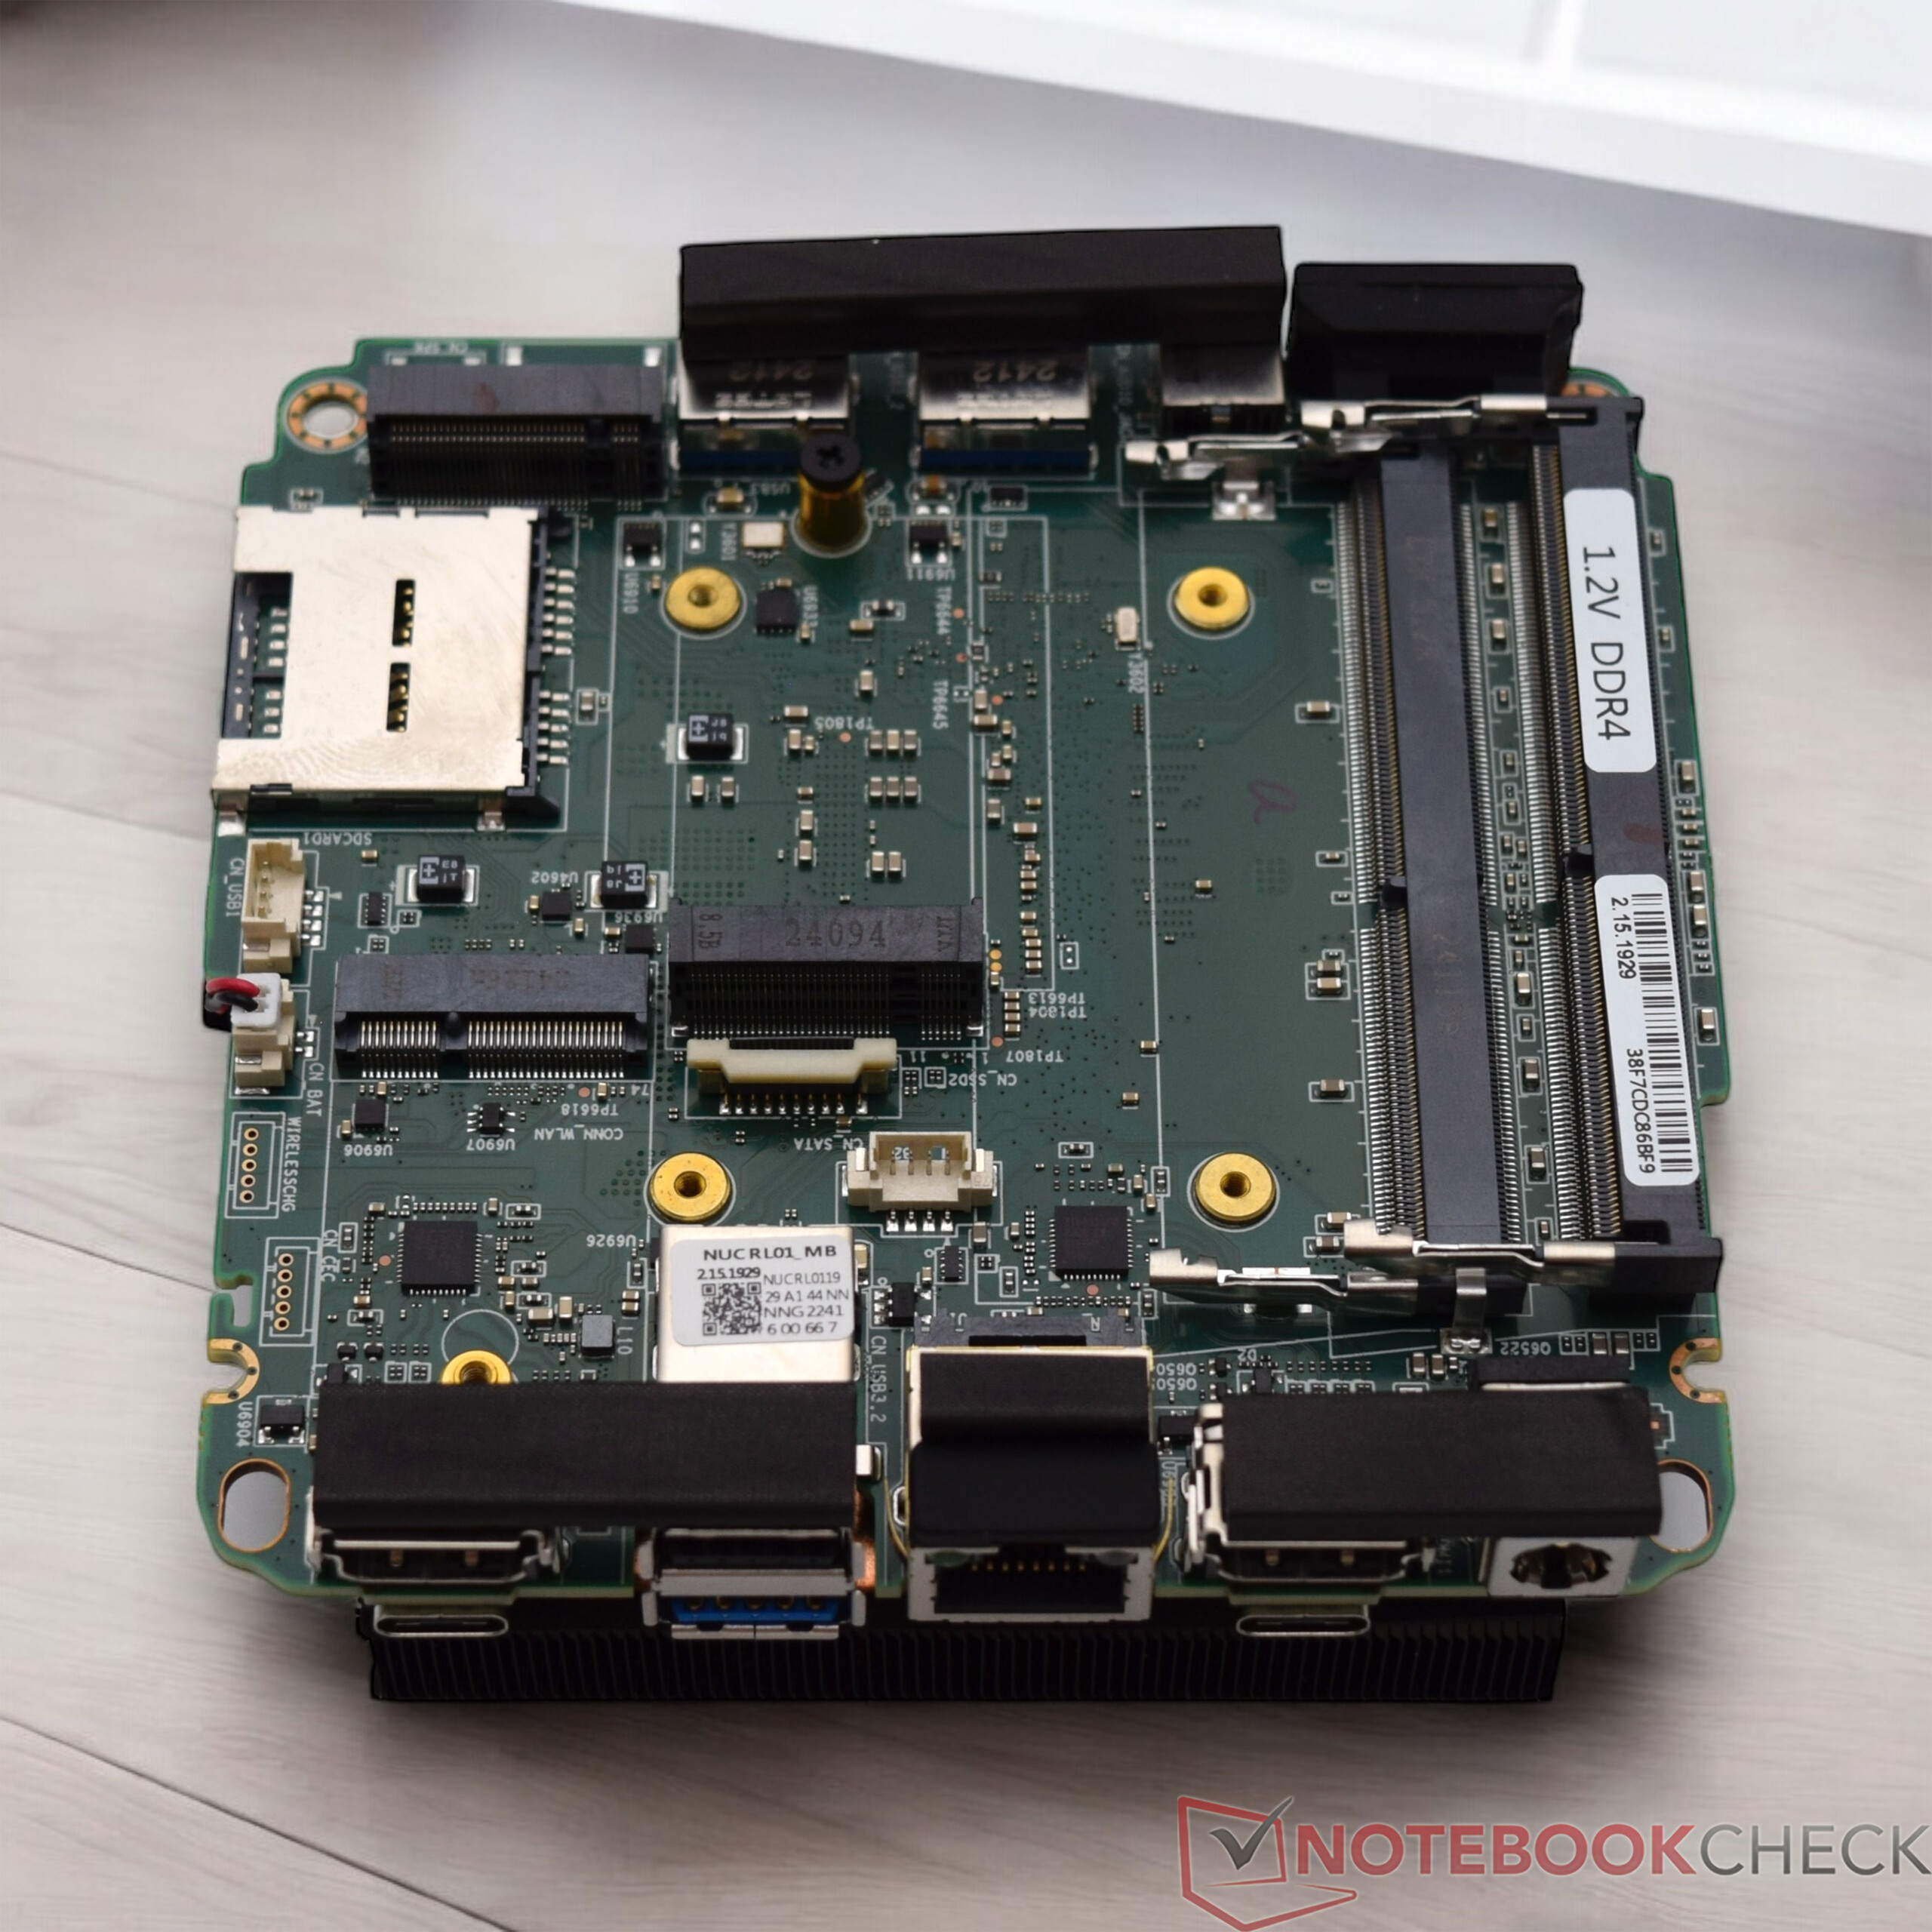
De Geekom XT13 Pro is gemakkelijk te openen. Er hoeven maar vier kleine schroeven aan de onderkant losgedraaid te worden, waarmee de bodemplaat aan de rest van de kast bevestigd wordt. Er zit een SSD-koeler op de bodemplaat zelf, daarom moet u op dit punt wat voorzichtiger zijn. Het RAM-geheugen en de massaopslag zijn dan gemakkelijk toegankelijk. In ons geval kan er een extra SSD worden geïnstalleerd. Hierbij moet wel de juiste standaard in acht worden genomen, want alleen SATA SSD's met een lengte van 42 millimeter zijn compatibel.
Duurzaamheid
De Geekom XT13 Pro wordt geleverd in een relatief grote doos met veel "lucht". Dat hebben we Geekom wel eens anders zien doen. Verder zijn de standaard meegeleverde accessoires verpakt in aparte plastic zakjes, wat qua duurzaamheid beter zou kunnen. Het apparaat zelf is voornamelijk gemaakt van metaal en plastic. We weten echter niet of er gerecycled materiaal is gebruikt bij de productie. Positief is dat de fabrikant een garantie van 36 maanden biedt.
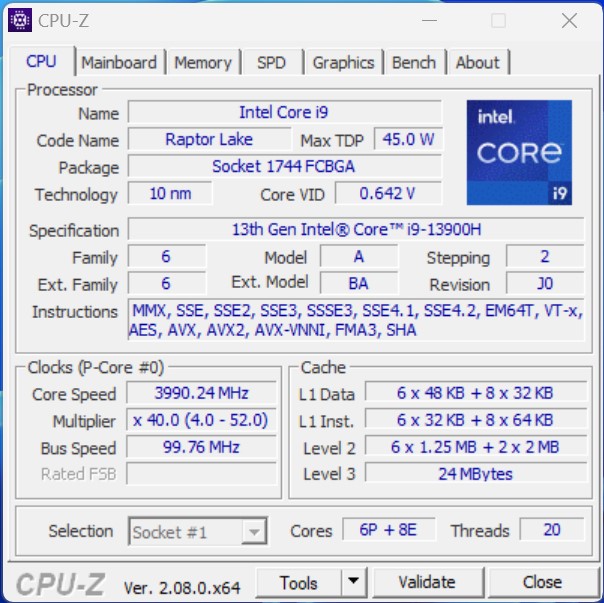
Prestaties - Intel Core i9-13900H met 14 kernen en 20 threads
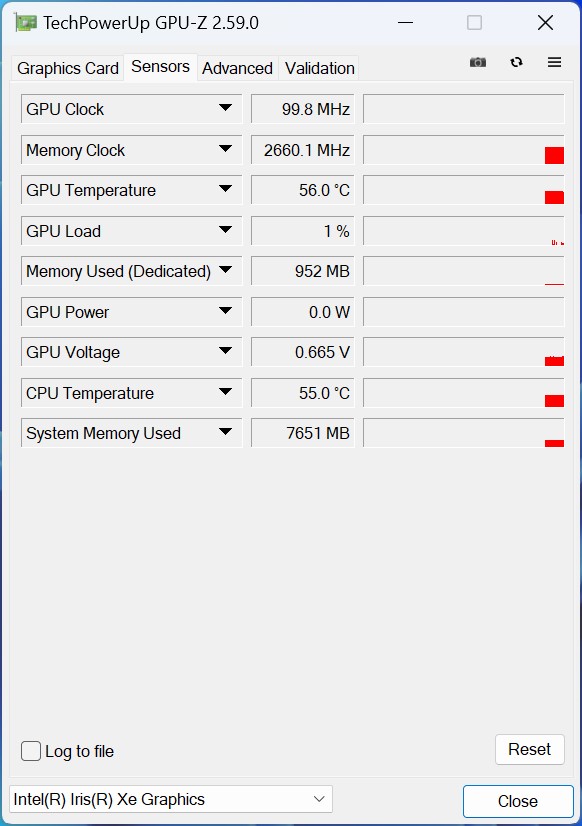
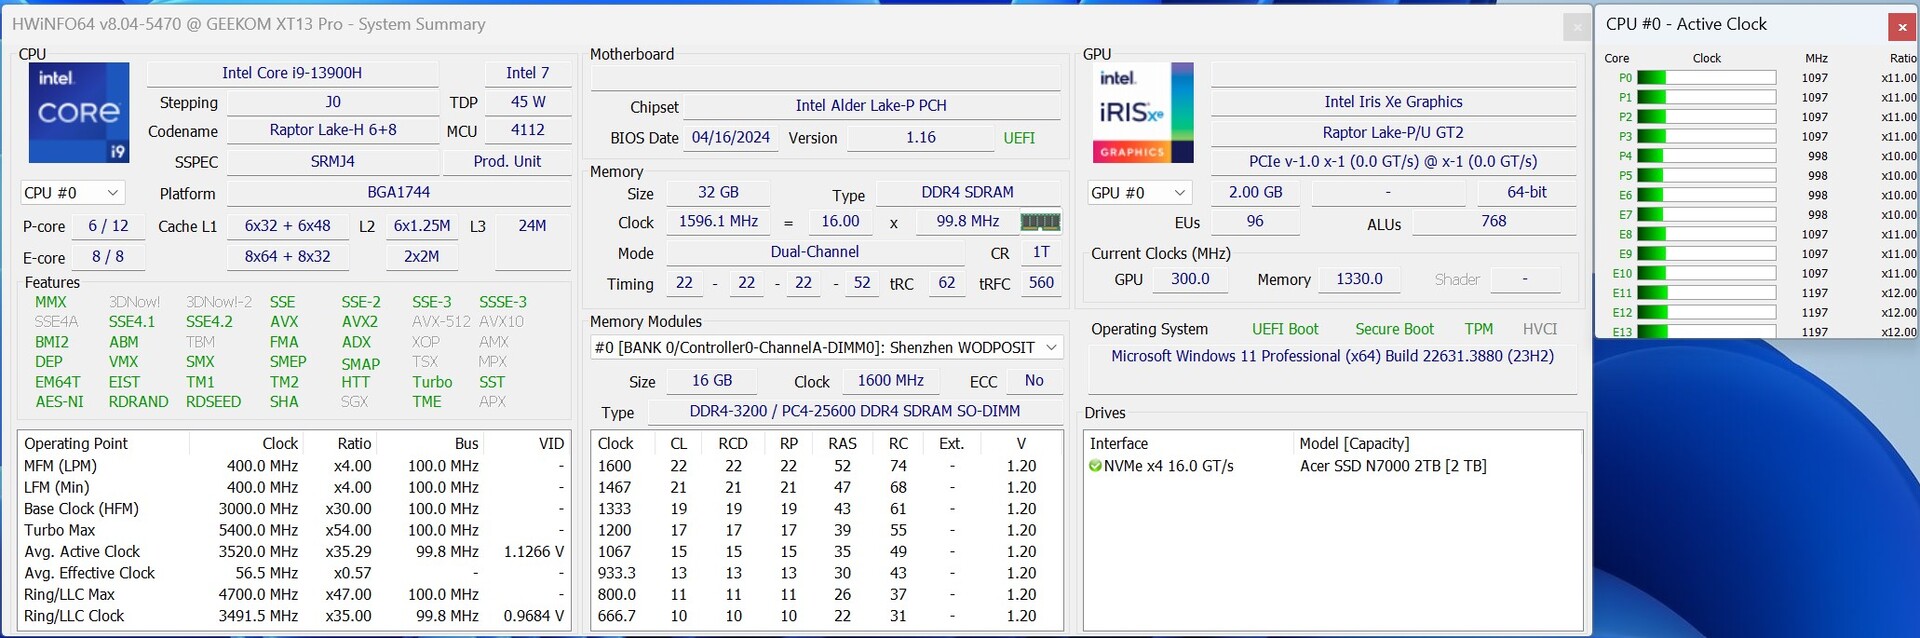
De Geekom XT13 Pro wordt geleverd in de topconfiguratie met de Intel Core i9-13900H in de bovenste configuratie. Als alternatief kan de NUC PC ook worden uitgerust met een iets zwakkere Intel Core i7-13620H die ook is uitgerust met 6P-kernen en qua prestaties slechts een klein nadeel zou moeten hebben ten opzichte van het topmodel. 32 GB DDR4 RAM is altijd inbegrepen, hoewel de snelle NVMe SSD voor een solide basisconfiguratie zorgt. De Geekom XT13 Pro is ook geen onoverkomelijke taak voor prestatievretende toepassingen. Toch zijn de 3D prestaties van de iGPU het grootste zwakke punt, maar dit kan merkbaar verbeterd worden met een eGPU.
Testomstandigheden
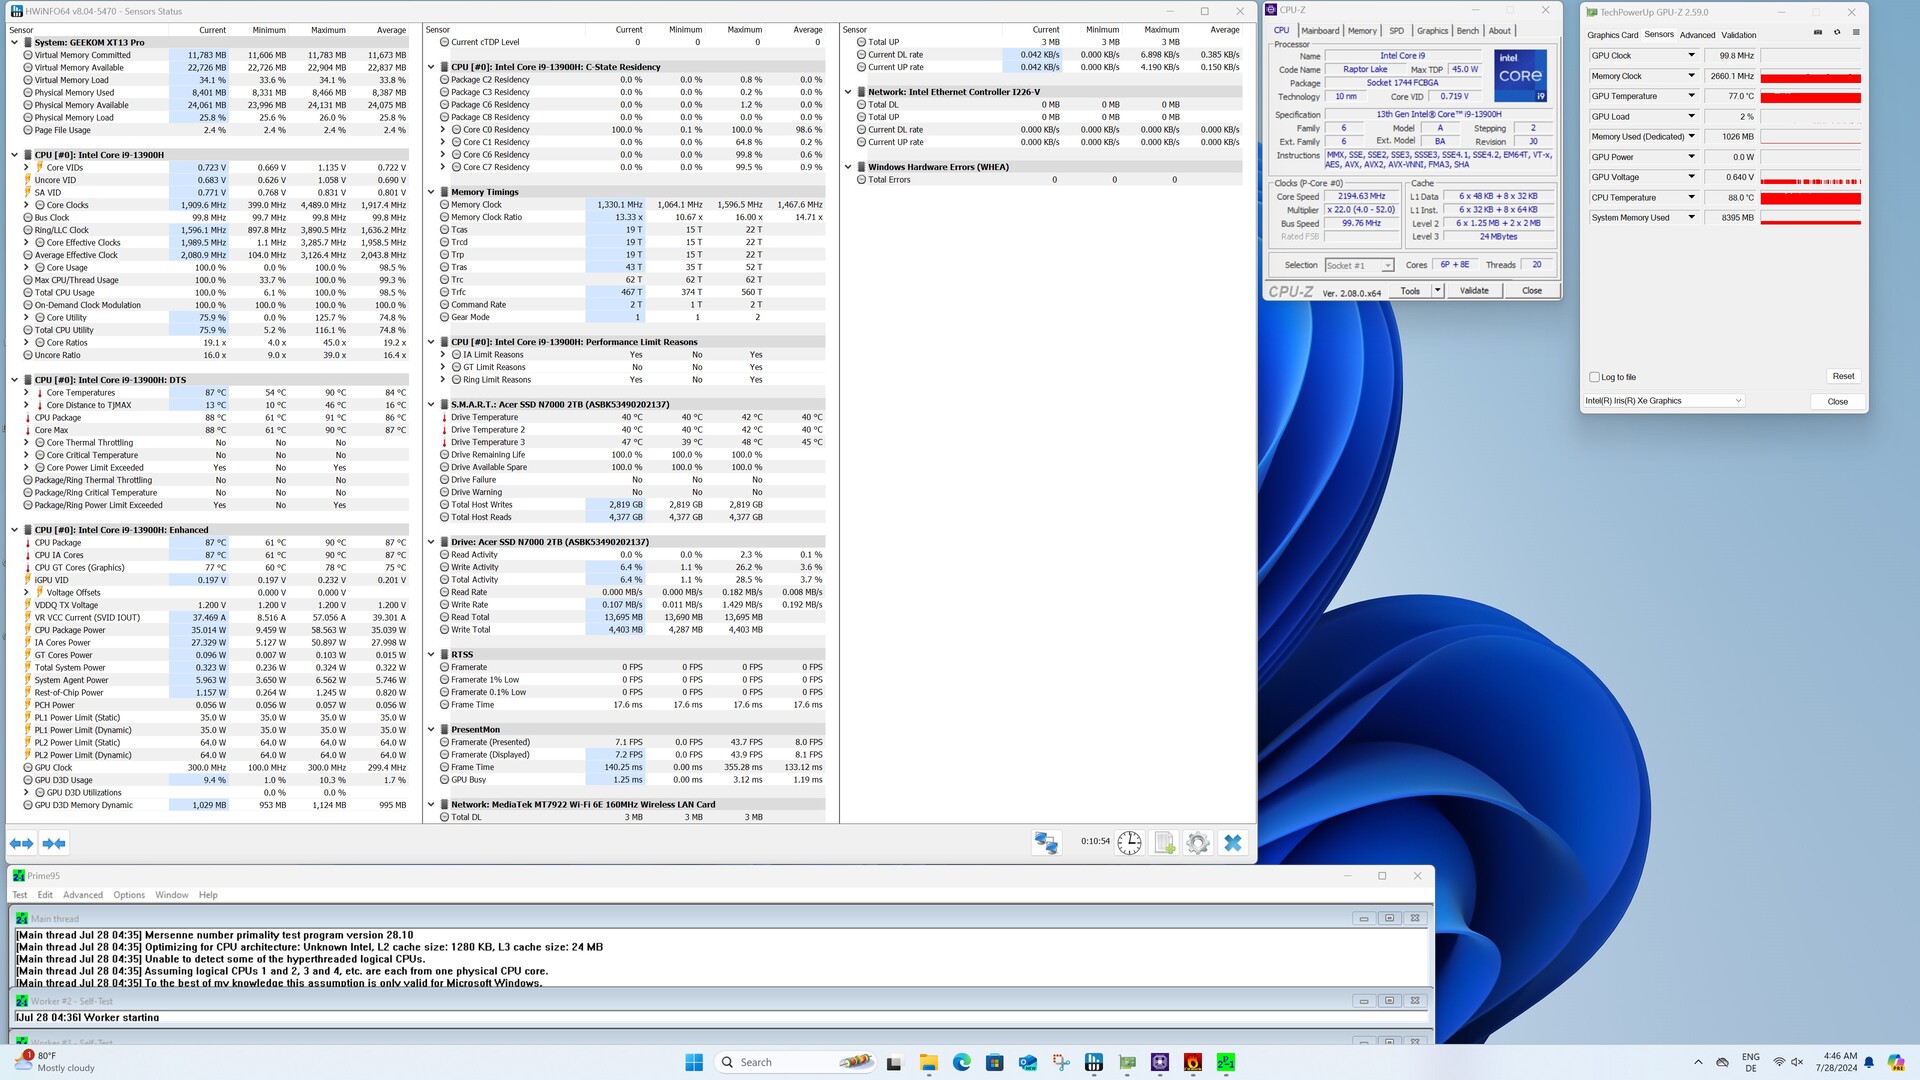
Voor alle prestatietests met de Geekom XT13 Pro gebruiken we het energieprofiel "High performance". Er waren alleen afwijkingen hiervan in het stroomverbruik en de geluidsmetingen volgens onze Testcriteria. In overeenstemming met de specificaties van de fabrikant laat Geekom de SoC met het laagste stroomverbruik werken. In cijfers betekent dit een vermogenslimiet van 35 watt bij continue belasting, hoewel voor korte perioden tot 64 watt is toegestaan.
Processor

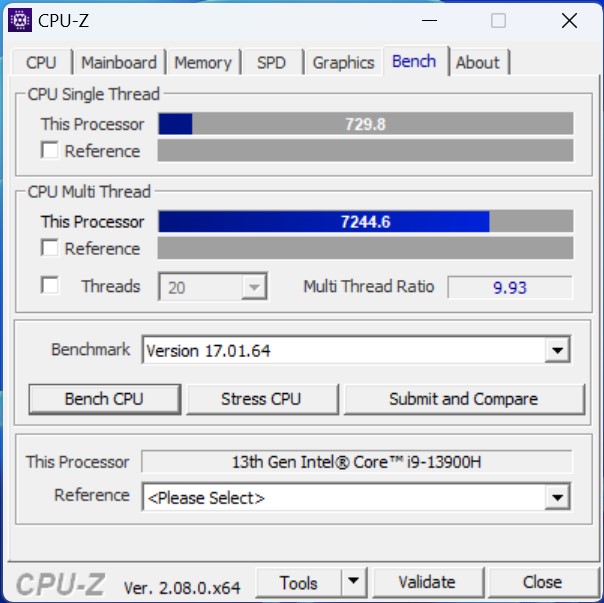
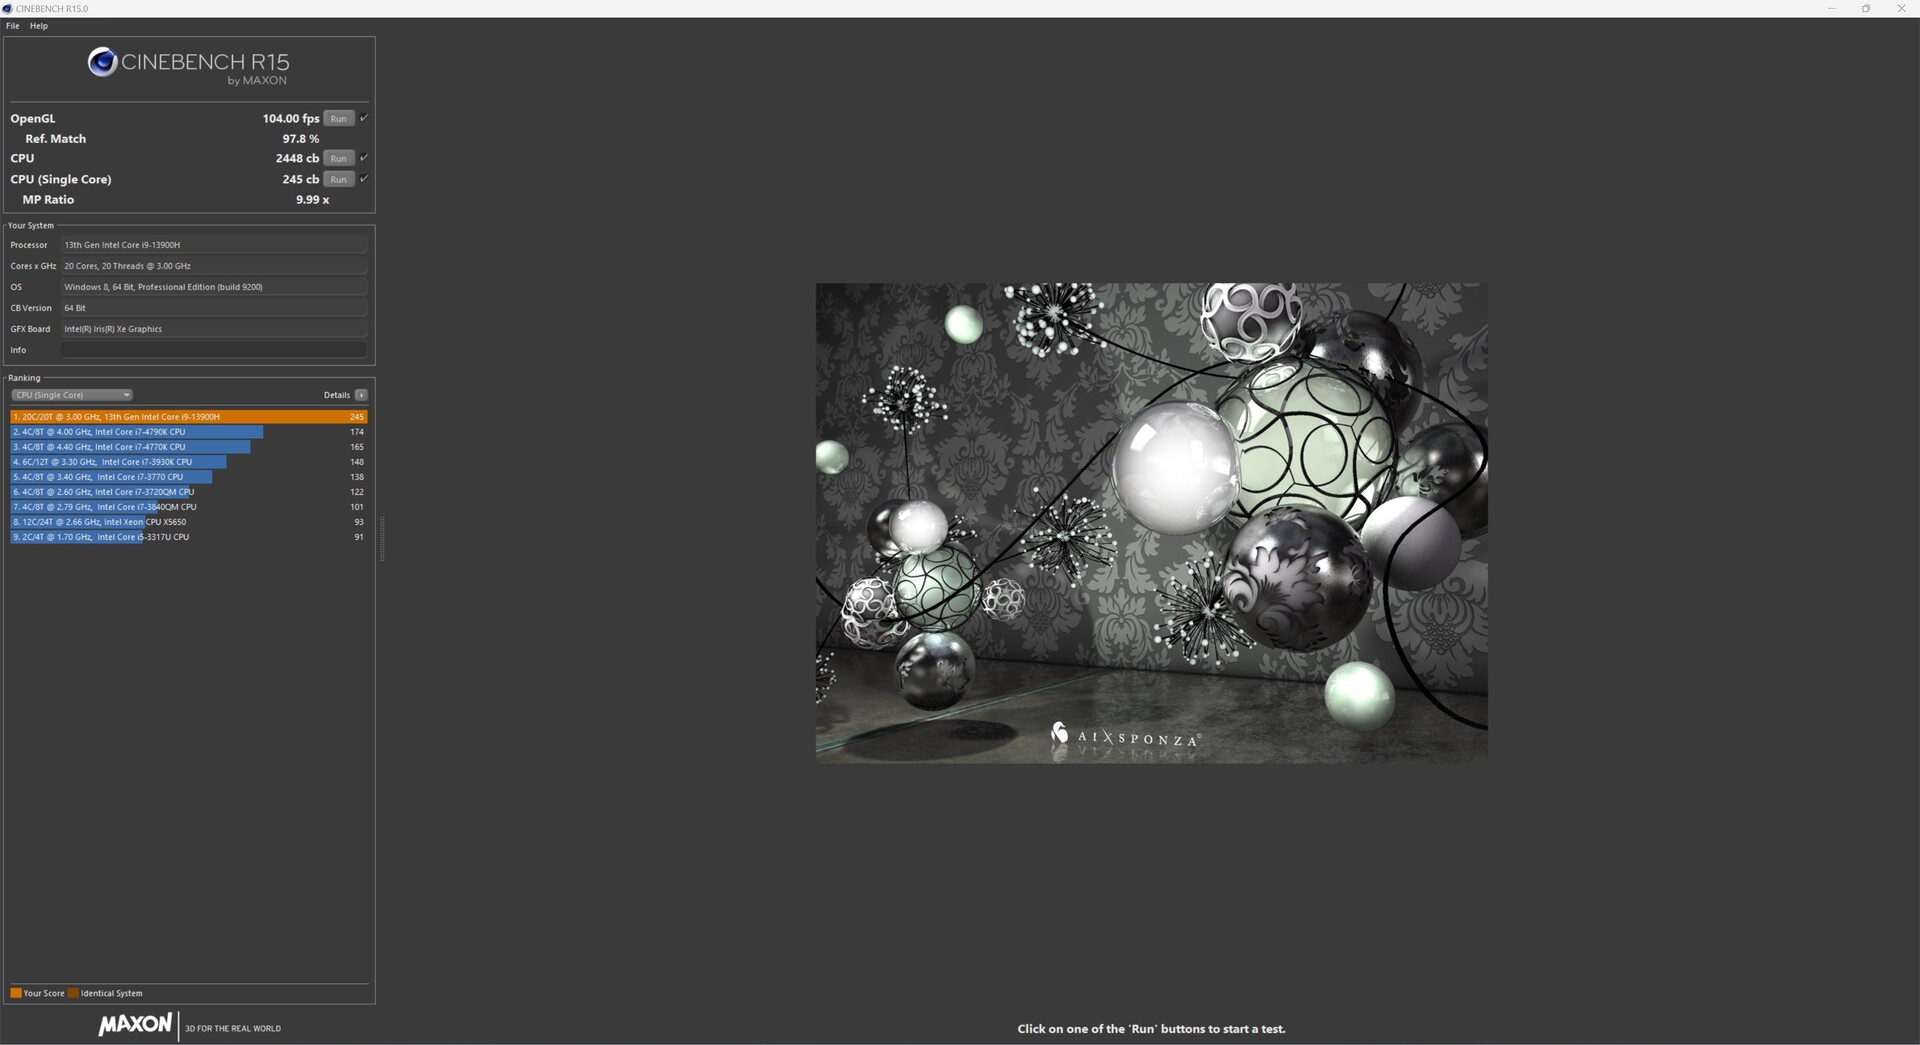
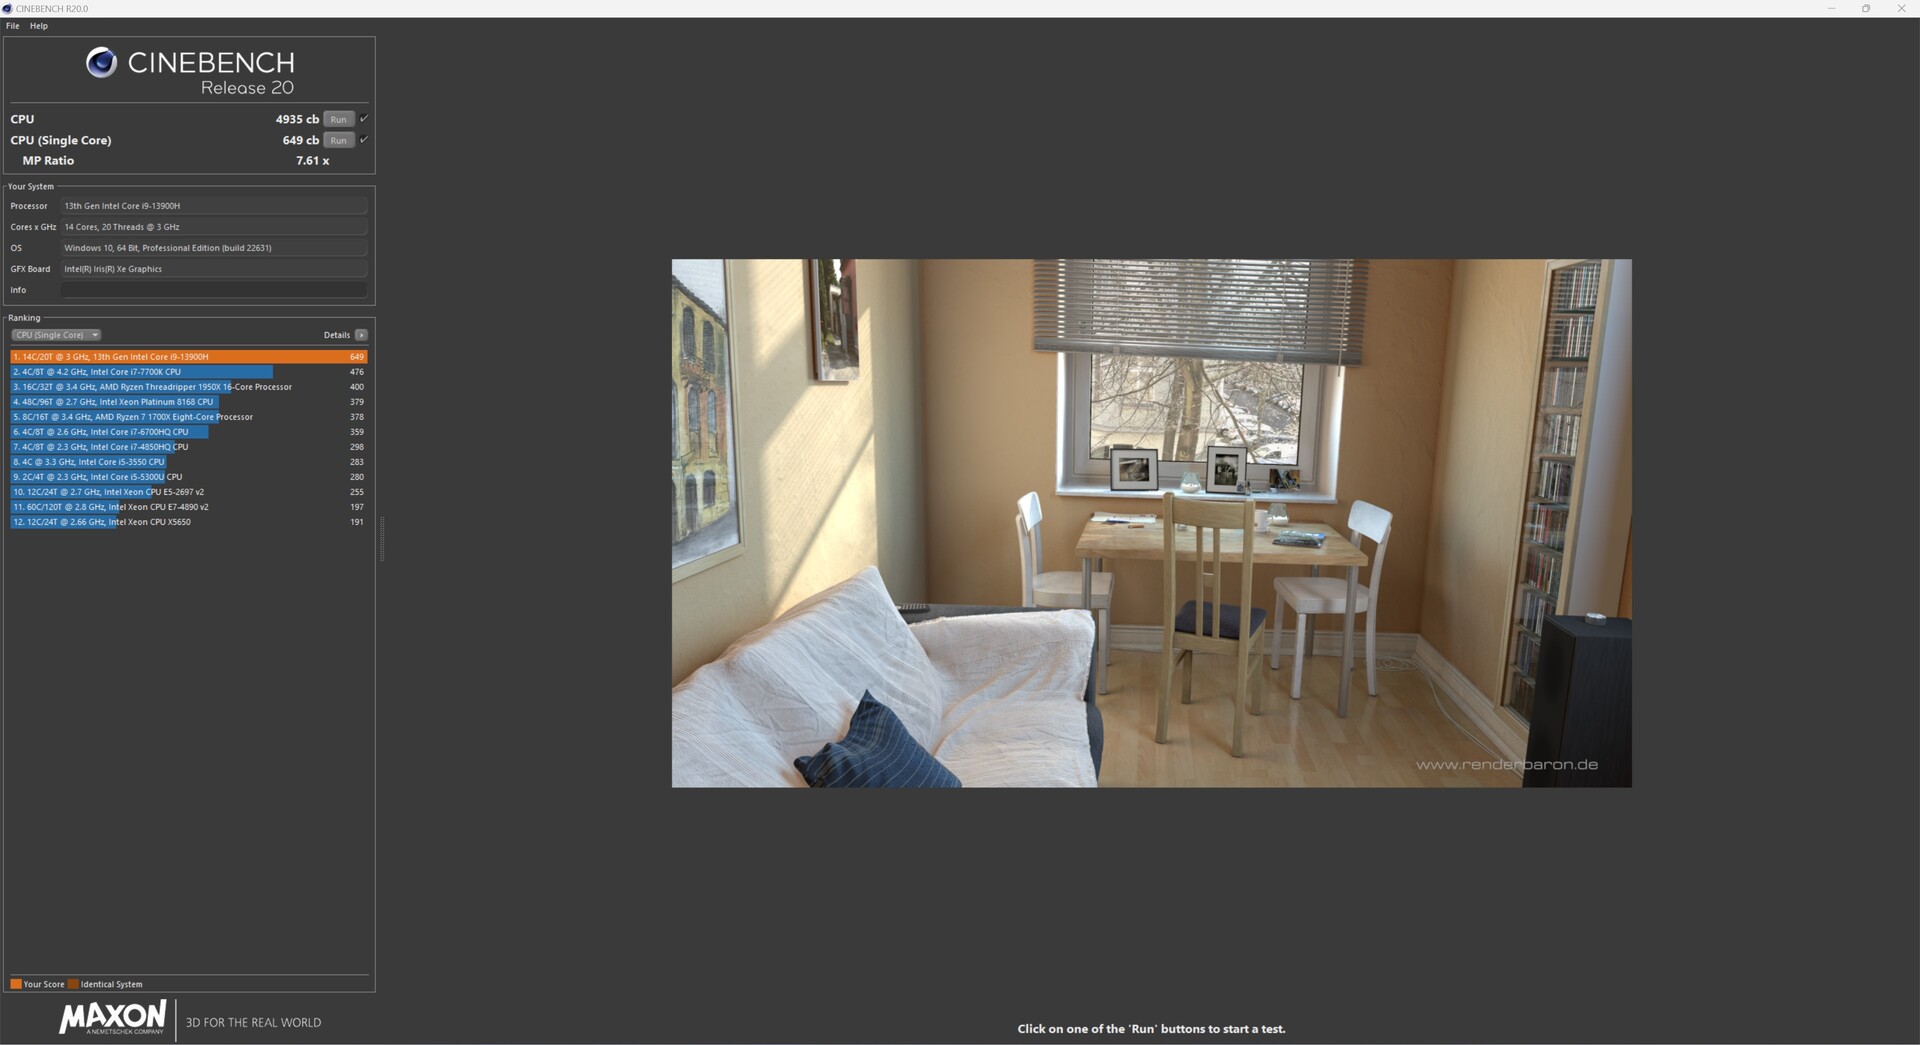
De Intel Core i9-13900H is gebaseerd op de Raptor Lake architectuur en combineert 6P en 8E kernen. Technisch gezien zijn er Intel Core i9-12900H zoals we kunnen zien in onze benchmarkresultaten in de prestatiebeoordeling vergeleken met de Geekom XT12 Pro. In detail zien we echter een licht voordeel in het voordeel van de Intel Core i9-13900H, die de aandacht op zich kan vestigen met iets betere multi-core prestaties. Een AMD Ryzen 9 7940HS of Intels nieuwere modellen uit de Meteor Lake serie. Het verschil met de iets snellere modellen van de concurrenten is echter niet erg groot. Er is geen sprake van een merkbaar verschil in prestaties bij dagelijks gebruik door de kleine verschillen.
U kunt meer benchmarks voor de processoren vinden hier.
| Performance Rating - Percent | |
| Geekom A7 | |
| Aoostar GEM12 | |
| Minisforum AtomMan X7 Ti | |
| Acemagic F2A | |
| Geekom XT13 Pro | |
| Geekom XT12 Pro | |
| Cinebench 2024 | |
| CPU Multi Core | |
| Minisforum AtomMan X7 Ti | |
| Acemagic F2A | |
| Aoostar GEM12 | |
| Geekom A7 | |
| Geekom XT13 Pro | |
| Geekom XT12 Pro | |
| CPU Single Core | |
| Minisforum AtomMan X7 Ti | |
| Geekom A7 | |
| Geekom XT12 Pro | |
| Aoostar GEM12 | |
| Acemagic F2A | |
| Geekom XT13 Pro | |
| Cinebench R15 | |
| CPU Single 64Bit | |
| Aoostar GEM12 | |
| Geekom A7 | |
| Minisforum AtomMan X7 Ti | |
| Acemagic F2A | |
| Geekom XT12 Pro | |
| Geekom XT13 Pro | |
| CPU Multi 64Bit | |
| Minisforum AtomMan X7 Ti | |
| Acemagic F2A | |
| Aoostar GEM12 | |
| Geekom A7 | |
| Geekom XT13 Pro | |
| Geekom XT12 Pro | |
| Cinebench R20 | |
| CPU (Single Core) | |
| Minisforum AtomMan X7 Ti | |
| Geekom XT12 Pro | |
| Geekom A7 | |
| Aoostar GEM12 | |
| Acemagic F2A | |
| Geekom XT13 Pro | |
| CPU (Multi Core) | |
| Minisforum AtomMan X7 Ti | |
| Acemagic F2A | |
| Aoostar GEM12 | |
| Geekom A7 | |
| Geekom XT13 Pro | |
| Geekom XT12 Pro | |
| Cinebench R11.5 | |
| CPU Single 64Bit | |
| Geekom A7 | |
| Aoostar GEM12 | |
| Minisforum AtomMan X7 Ti | |
| Acemagic F2A | |
| Geekom XT12 Pro | |
| Geekom XT13 Pro | |
| CPU Multi 64Bit | |
| Minisforum AtomMan X7 Ti | |
| Acemagic F2A | |
| Geekom A7 | |
| Aoostar GEM12 | |
| Geekom XT13 Pro | |
| Geekom XT12 Pro | |
| Cinebench R10 | |
| Rendering Single CPUs 64Bit | |
| Minisforum AtomMan X7 Ti | |
| Geekom A7 | |
| Aoostar GEM12 | |
| Acemagic F2A | |
| Geekom XT13 Pro | |
| Geekom XT12 Pro | |
| Rendering Multiple CPUs 64Bit | |
| Acemagic F2A | |
| Minisforum AtomMan X7 Ti | |
| Aoostar GEM12 | |
| Geekom A7 | |
| Geekom XT13 Pro | |
| Geekom XT12 Pro | |
| Blender - v2.79 BMW27 CPU | |
| Geekom XT12 Pro | |
| Geekom XT13 Pro | |
| Geekom A7 | |
| Aoostar GEM12 | |
| Acemagic F2A | |
| Minisforum AtomMan X7 Ti | |
| wPrime 2.10 | |
| 32m | |
| Geekom XT12 Pro | |
| Acemagic F2A | |
| Geekom XT13 Pro | |
| Minisforum AtomMan X7 Ti | |
| Aoostar GEM12 | |
| Geekom A7 | |
| 1024m | |
| Minisforum AtomMan X7 Ti | |
| Geekom XT13 Pro | |
| Geekom XT12 Pro | |
| Acemagic F2A | |
| Aoostar GEM12 | |
| Geekom A7 | |
| WinRAR - Result | |
| Geekom XT12 Pro | |
| Minisforum AtomMan X7 Ti | |
| Acemagic F2A | |
| Geekom A7 | |
| Aoostar GEM12 | |
| Geekom XT13 Pro | |
| Geekbench 5.0 | |
| 5.0 Multi-Core | |
| Minisforum AtomMan X7 Ti | |
| Acemagic F2A | |
| Geekom A7 | |
| Aoostar GEM12 | |
| Geekom XT13 Pro | |
| Geekom XT12 Pro | |
| 5.0 Single-Core | |
| Geekom A7 | |
| Aoostar GEM12 | |
| Minisforum AtomMan X7 Ti | |
| Geekom XT12 Pro | |
| Acemagic F2A | |
| Geekom XT13 Pro | |
| Geekbench 4.4 | |
| 64 Bit Single-Core Score | |
| Geekom A7 | |
| Aoostar GEM12 | |
| Geekom XT12 Pro | |
| Minisforum AtomMan X7 Ti | |
| Geekom XT13 Pro | |
| Acemagic F2A | |
| 64 Bit Multi-Core Score | |
| Geekom A7 | |
| Minisforum AtomMan X7 Ti | |
| Aoostar GEM12 | |
| Acemagic F2A | |
| Geekom XT13 Pro | |
| Geekom XT12 Pro | |
| 3DMark 11 - 1280x720 Performance Physics | |
| Geekom A7 | |
| Minisforum AtomMan X7 Ti | |
| Aoostar GEM12 | |
| Acemagic F2A | |
| Geekom XT13 Pro | |
| Geekom XT12 Pro | |
| HWBOT x265 Benchmark v2.2 - 4k Preset | |
| Minisforum AtomMan X7 Ti | |
| Geekom A7 | |
| Aoostar GEM12 | |
| Acemagic F2A | |
| Geekom XT13 Pro | |
| Geekom XT12 Pro | |
| R Benchmark 2.5 - Overall mean | |
| Geekom XT13 Pro | |
| Acemagic F2A | |
| Geekom XT12 Pro | |
| Minisforum AtomMan X7 Ti | |
| Aoostar GEM12 | |
| Geekom A7 | |
| LibreOffice - 20 Documents To PDF | |
| Geekom A7 | |
| Minisforum AtomMan X7 Ti | |
| Aoostar GEM12 | |
| Geekom XT13 Pro | |
| Acemagic F2A | |
| Geekom XT12 Pro | |
| WebXPRT 3 - Overall | |
| Geekom A7 | |
| Aoostar GEM12 | |
| Geekom XT12 Pro | |
| Acemagic F2A | |
| Geekom XT13 Pro | |
| Minisforum AtomMan X7 Ti | |
| Mozilla Kraken 1.1 - Total | |
| Geekom XT13 Pro | |
| Acemagic F2A | |
| Minisforum AtomMan X7 Ti | |
| Aoostar GEM12 | |
| Geekom XT12 Pro | |
| Geekom A7 | |
| 3DMark | |
| 1920x1080 Fire Strike Physics | |
| Aoostar GEM12 | |
| Minisforum AtomMan X7 Ti | |
| Geekom A7 | |
| Acemagic F2A | |
| Geekom XT13 Pro | |
| Geekom XT12 Pro | |
| 2560x1440 Time Spy CPU | |
| Minisforum AtomMan X7 Ti | |
| Aoostar GEM12 | |
| Geekom A7 | |
| Acemagic F2A | |
| Geekom XT13 Pro | |
| Geekom XT12 Pro | |
| Super Pi mod 1.5 XS 1M - 1M | |
| Geekom XT13 Pro | |
| Geekom XT12 Pro | |
| Geekom A7 | |
| Aoostar GEM12 | |
| Acemagic F2A | |
| Minisforum AtomMan X7 Ti | |
| Super Pi mod 1.5 XS 2M - 2M | |
| Geekom A7 | |
| Aoostar GEM12 | |
| Geekom XT13 Pro | |
| Geekom XT12 Pro | |
| Acemagic F2A | |
| Minisforum AtomMan X7 Ti | |
| Super Pi Mod 1.5 XS 32M - 32M | |
| Aoostar GEM12 | |
| Geekom A7 | |
| Geekom XT13 Pro | |
| Geekom XT12 Pro | |
| Acemagic F2A | |
| Minisforum AtomMan X7 Ti | |
* ... kleiner is beter
AIDA64: FP32 Ray-Trace | FPU Julia | CPU SHA3 | CPU Queen | FPU SinJulia | FPU Mandel | CPU AES | CPU ZLib | FP64 Ray-Trace | CPU PhotoWorxx
| Performance Rating | |
| Geekom A7 | |
| Aoostar GEM12 | |
| Minisforum AtomMan X7 Ti | |
| Acemagic F2A | |
| Gemiddelde van klas Mini PC | |
| Geekom XT13 Pro | |
| Geekom XT12 Pro | |
| AIDA64 / FP32 Ray-Trace | |
| Aoostar GEM12 | |
| Geekom A7 | |
| Acemagic F2A | |
| Minisforum AtomMan X7 Ti | |
| Gemiddelde van klas Mini PC (764 - 51004, n=116, laatste 2 jaar) | |
| Geekom XT13 Pro | |
| Geekom XT12 Pro | |
| AIDA64 / FPU Julia | |
| Aoostar GEM12 | |
| Geekom A7 | |
| Minisforum AtomMan X7 Ti | |
| Acemagic F2A | |
| Gemiddelde van klas Mini PC (4140 - 214250, n=116, laatste 2 jaar) | |
| Geekom XT13 Pro | |
| Geekom XT12 Pro | |
| AIDA64 / CPU SHA3 | |
| Geekom A7 | |
| Aoostar GEM12 | |
| Minisforum AtomMan X7 Ti | |
| Acemagic F2A | |
| Gemiddelde van klas Mini PC (290 - 9399, n=116, laatste 2 jaar) | |
| Geekom XT13 Pro | |
| Geekom XT12 Pro | |
| AIDA64 / CPU Queen | |
| Geekom A7 | |
| Aoostar GEM12 | |
| Geekom XT13 Pro | |
| Acemagic F2A | |
| Minisforum AtomMan X7 Ti | |
| Geekom XT12 Pro | |
| Gemiddelde van klas Mini PC (8172 - 184747, n=116, laatste 2 jaar) | |
| AIDA64 / FPU SinJulia | |
| Aoostar GEM12 | |
| Geekom A7 | |
| Minisforum AtomMan X7 Ti | |
| Acemagic F2A | |
| Gemiddelde van klas Mini PC (408 - 29064, n=116, laatste 2 jaar) | |
| Geekom XT13 Pro | |
| Geekom XT12 Pro | |
| AIDA64 / FPU Mandel | |
| Aoostar GEM12 | |
| Geekom A7 | |
| Acemagic F2A | |
| Minisforum AtomMan X7 Ti | |
| Gemiddelde van klas Mini PC (2088 - 113499, n=116, laatste 2 jaar) | |
| Geekom XT13 Pro | |
| Geekom XT12 Pro | |
| AIDA64 / CPU AES | |
| Geekom A7 | |
| Minisforum AtomMan X7 Ti | |
| Acemagic F2A | |
| Geekom XT13 Pro | |
| Geekom XT12 Pro | |
| Gemiddelde van klas Mini PC (3691 - 325960, n=116, laatste 2 jaar) | |
| Aoostar GEM12 | |
| AIDA64 / CPU ZLib | |
| Minisforum AtomMan X7 Ti | |
| Acemagic F2A | |
| Aoostar GEM12 | |
| Geekom A7 | |
| Geekom XT13 Pro | |
| Gemiddelde van klas Mini PC (76.7 - 2039, n=116, laatste 2 jaar) | |
| Geekom XT12 Pro | |
| AIDA64 / FP64 Ray-Trace | |
| Aoostar GEM12 | |
| Geekom A7 | |
| Acemagic F2A | |
| Minisforum AtomMan X7 Ti | |
| Gemiddelde van klas Mini PC (432 - 26952, n=116, laatste 2 jaar) | |
| Geekom XT13 Pro | |
| Geekom XT12 Pro | |
| AIDA64 / CPU PhotoWorxx | |
| Minisforum AtomMan X7 Ti | |
| Geekom A7 | |
| Aoostar GEM12 | |
| Acemagic F2A | |
| Gemiddelde van klas Mini PC (5296 - 51727, n=116, laatste 2 jaar) | |
| Geekom XT13 Pro | |
| Geekom XT12 Pro | |
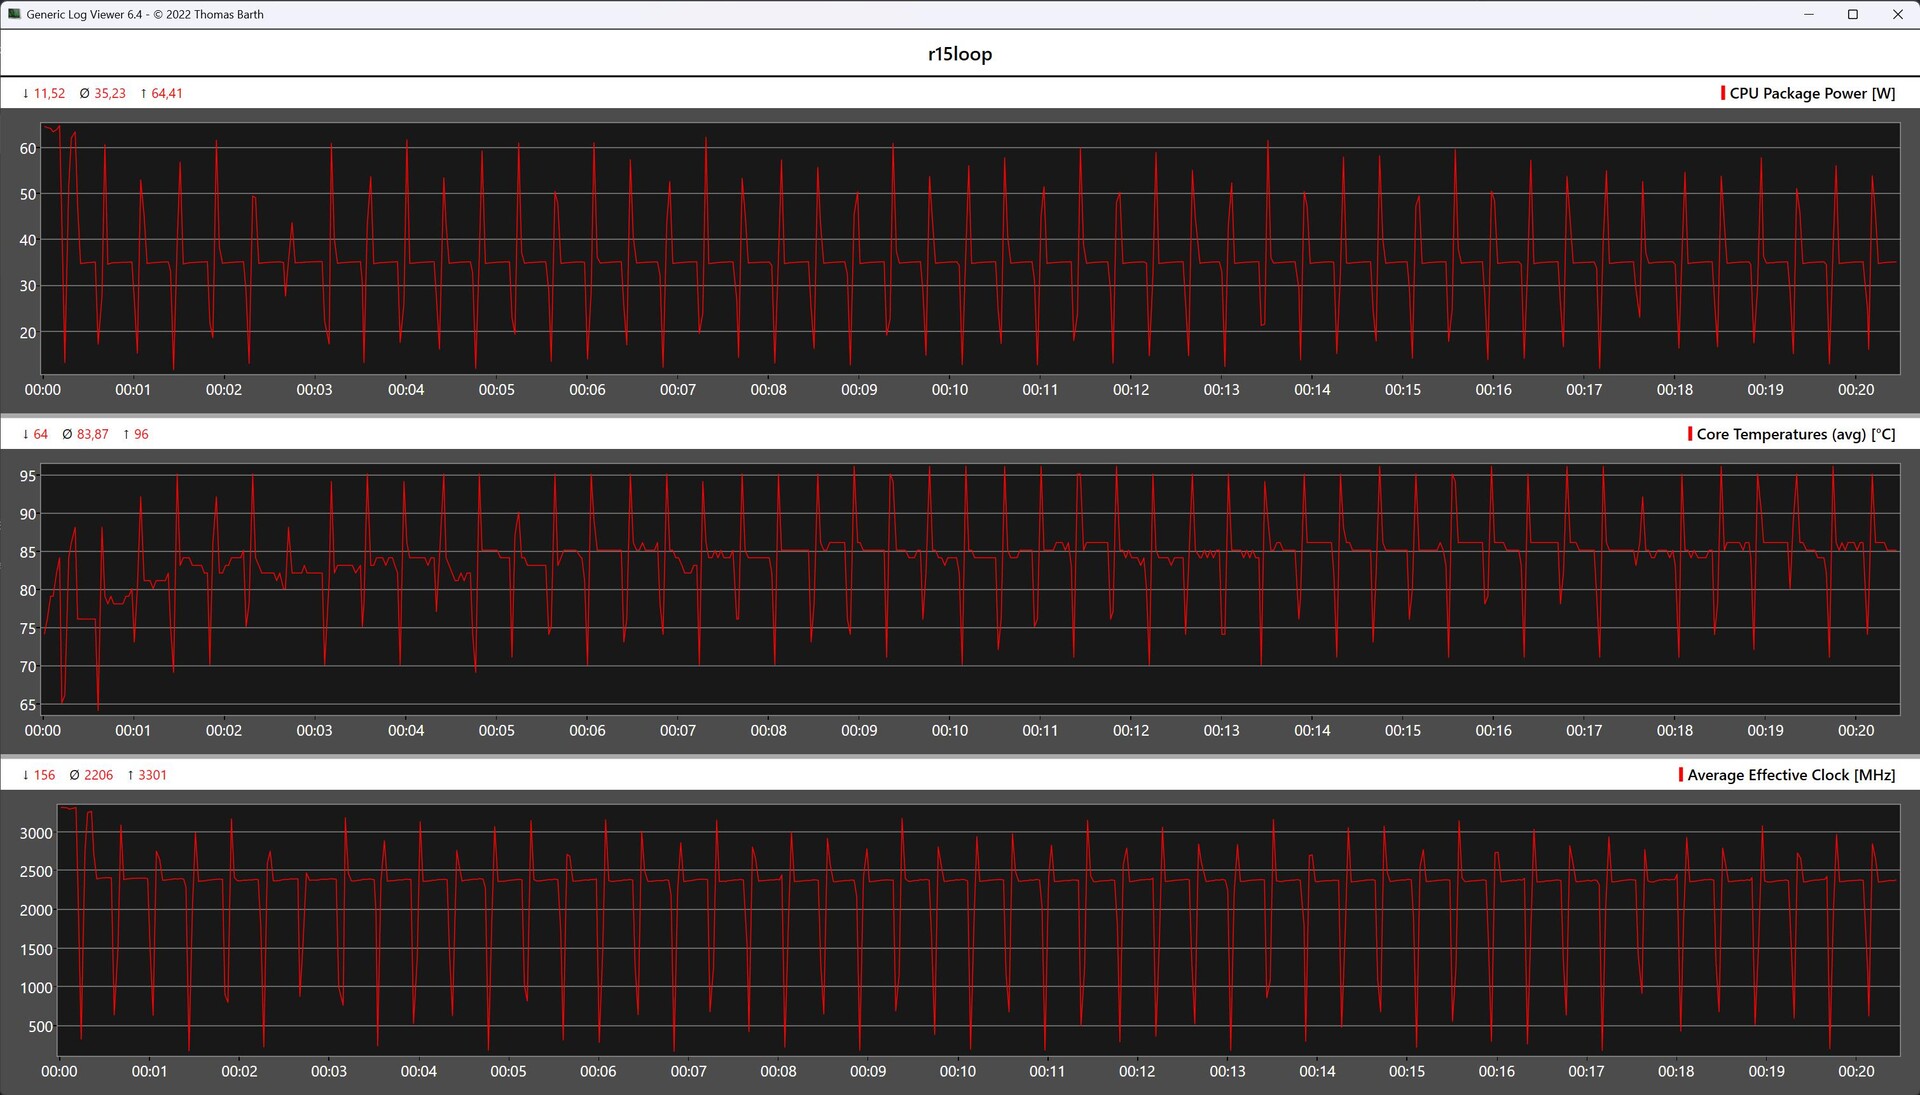
Cinebench R15 Multi loop
De Cinebench R15 continue loop van ons testexemplaar loopt bijna parallel aan die van de Geekom XT12 Pro. Uiteindelijk weet het nieuwere XT13 Pro-model echter met een duidelijke voorsprong aan het langste eind te trekken. Het is ook te zien dat het kleine koelsysteem er niet in slaagt om de Turbo van de SoC over een langere periode in stand te houden. De maximale vermogenslimiet van 64 watt wordt slechts korte tijd bereikt omdat het stroomverbruik moet worden afgeremd vanwege de hoge temperaturen.
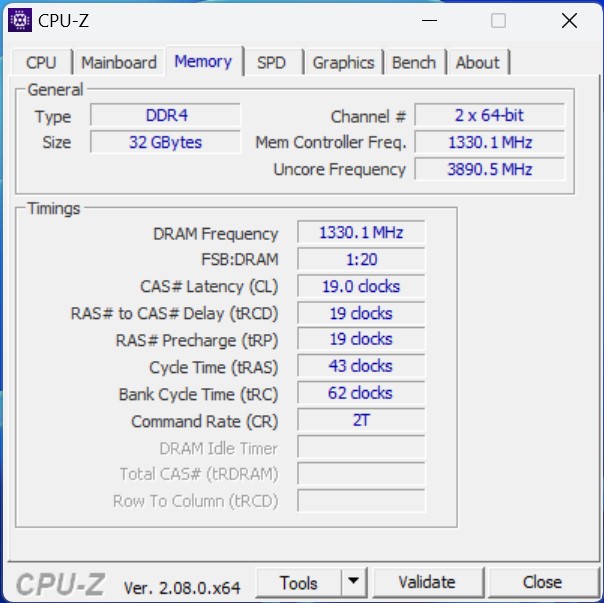
Systeemprestaties
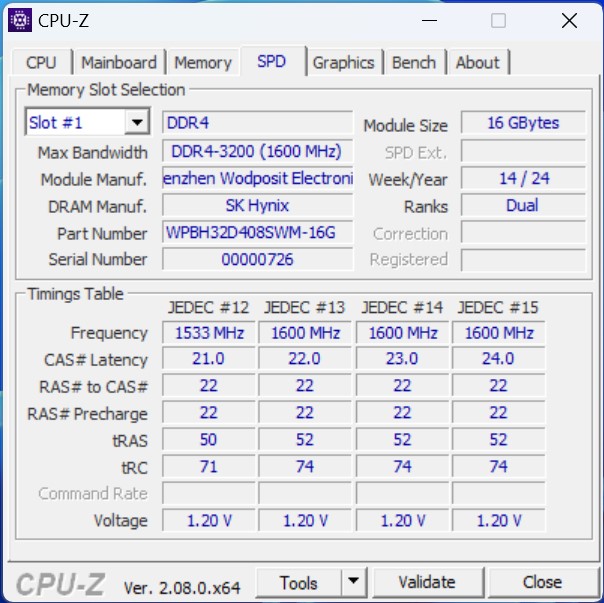
In de systeemprestatietests zijn de gedocumenteerde prestaties van de Geekom XT13 Pro slechts goed genoeg voor een plaats onderaan de ranglijst. Subjectief kunnen we echter zeggen dat de Geekom XT13 Pro behoorlijke prestaties levert. Tijdens de testfase konden we geen merkbare vertragingen waarnemen tijdens het werken met het apparaat. Als het gaat om de keuze van RAM, neemt de langzamere DDR4 standaard wraak, zoals te zien is in de AIDA64 benchmarks. Technisch gezien is de Intel Core i9-13900H gecombineerd worden met DDR5 (5.200 MT/s).
| AIDA64 / Memory Copy | |
| Minisforum AtomMan X7 Ti | |
| Aoostar GEM12 | |
| Geekom A7 | |
| Acemagic F2A | |
| Gemiddelde van klas Mini PC (8377 - 89287, n=116, laatste 2 jaar) | |
| Geekom XT13 Pro | |
| Geekom XT12 Pro | |
| AIDA64 / Memory Read | |
| Minisforum AtomMan X7 Ti | |
| Acemagic F2A | |
| Geekom A7 | |
| Aoostar GEM12 | |
| Gemiddelde van klas Mini PC (8974 - 100086, n=116, laatste 2 jaar) | |
| Geekom XT12 Pro | |
| Geekom XT13 Pro | |
| AIDA64 / Memory Write | |
| Geekom A7 | |
| Aoostar GEM12 | |
| Minisforum AtomMan X7 Ti | |
| Acemagic F2A | |
| Gemiddelde van klas Mini PC (8762 - 100538, n=116, laatste 2 jaar) | |
| Geekom XT13 Pro | |
| Geekom XT12 Pro | |
| AIDA64 / Memory Latency | |
| Acemagic F2A | |
| Minisforum AtomMan X7 Ti | |
| Gemiddelde van klas Mini PC (44.9 - 184.8, n=116, laatste 2 jaar) | |
| Geekom A7 | |
| Aoostar GEM12 | |
| Geekom XT13 Pro | |
| Geekom XT12 Pro | |
* ... kleiner is beter
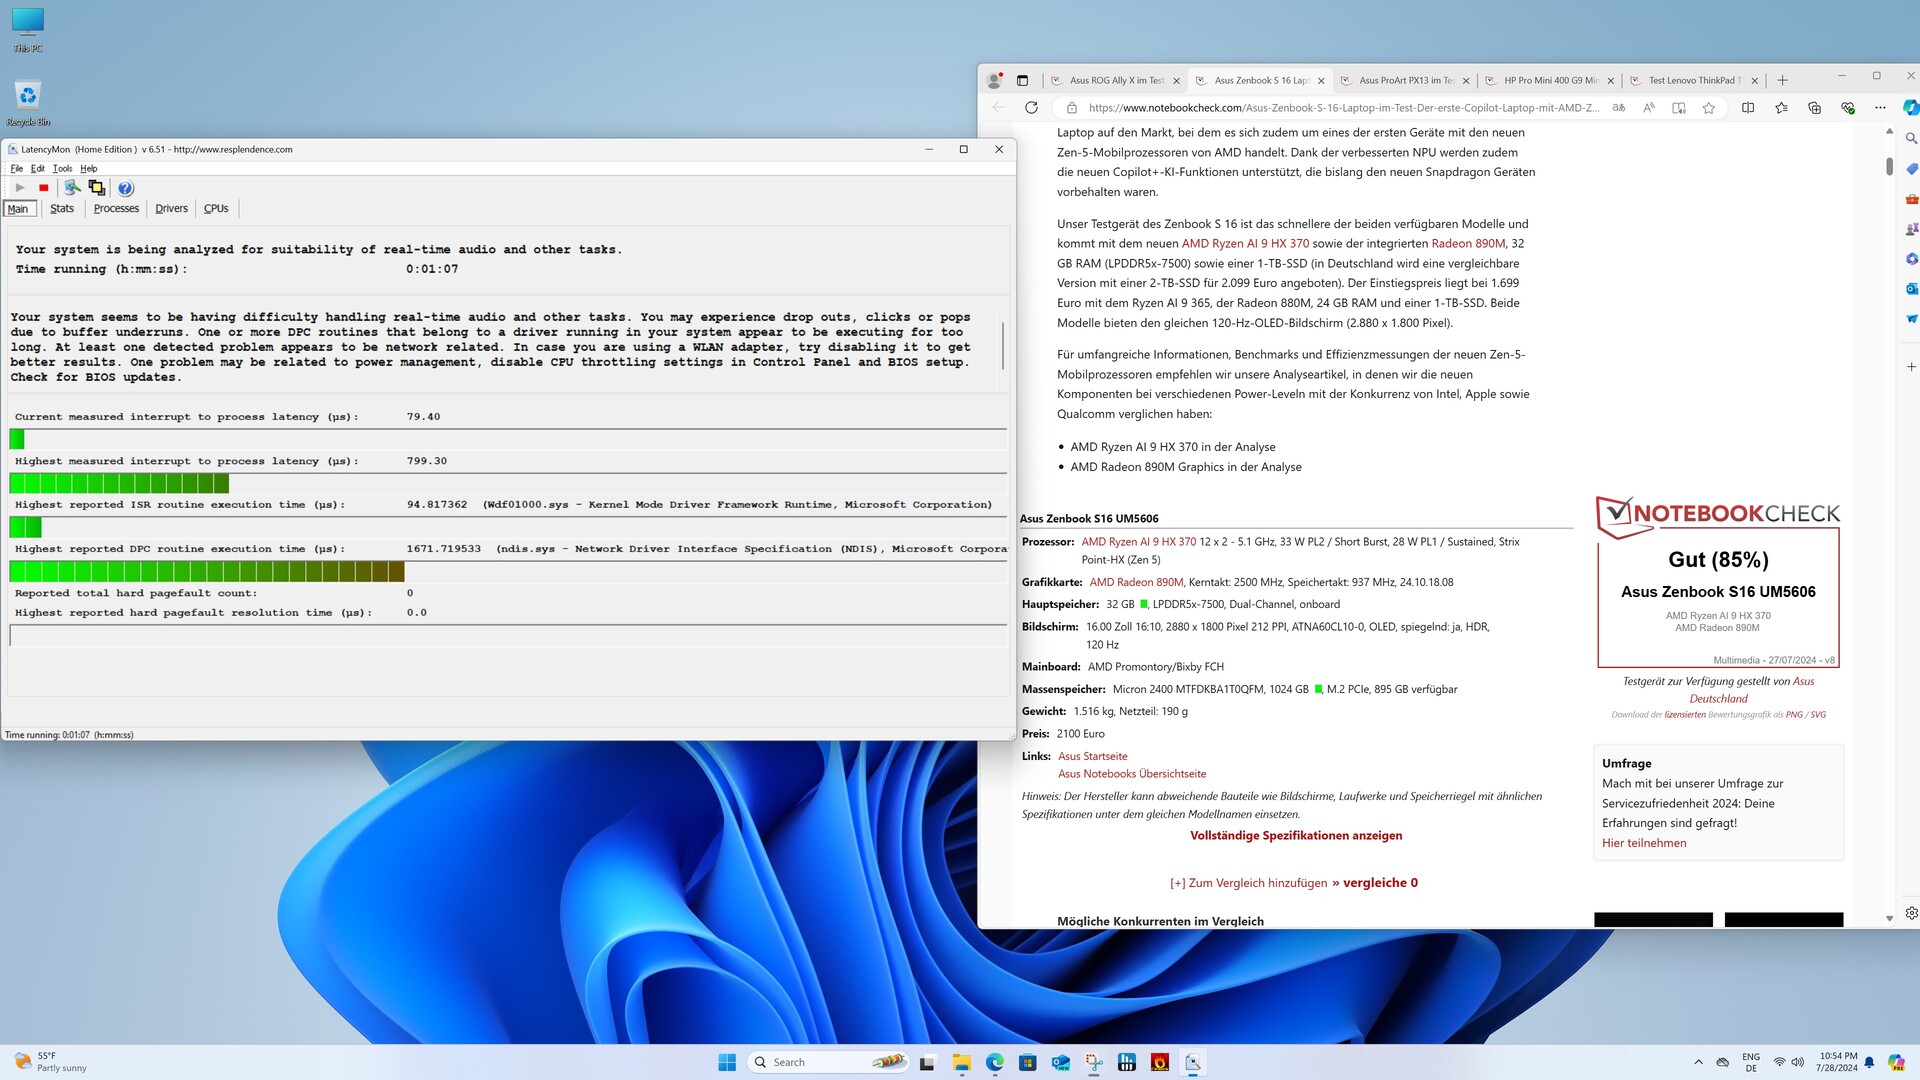
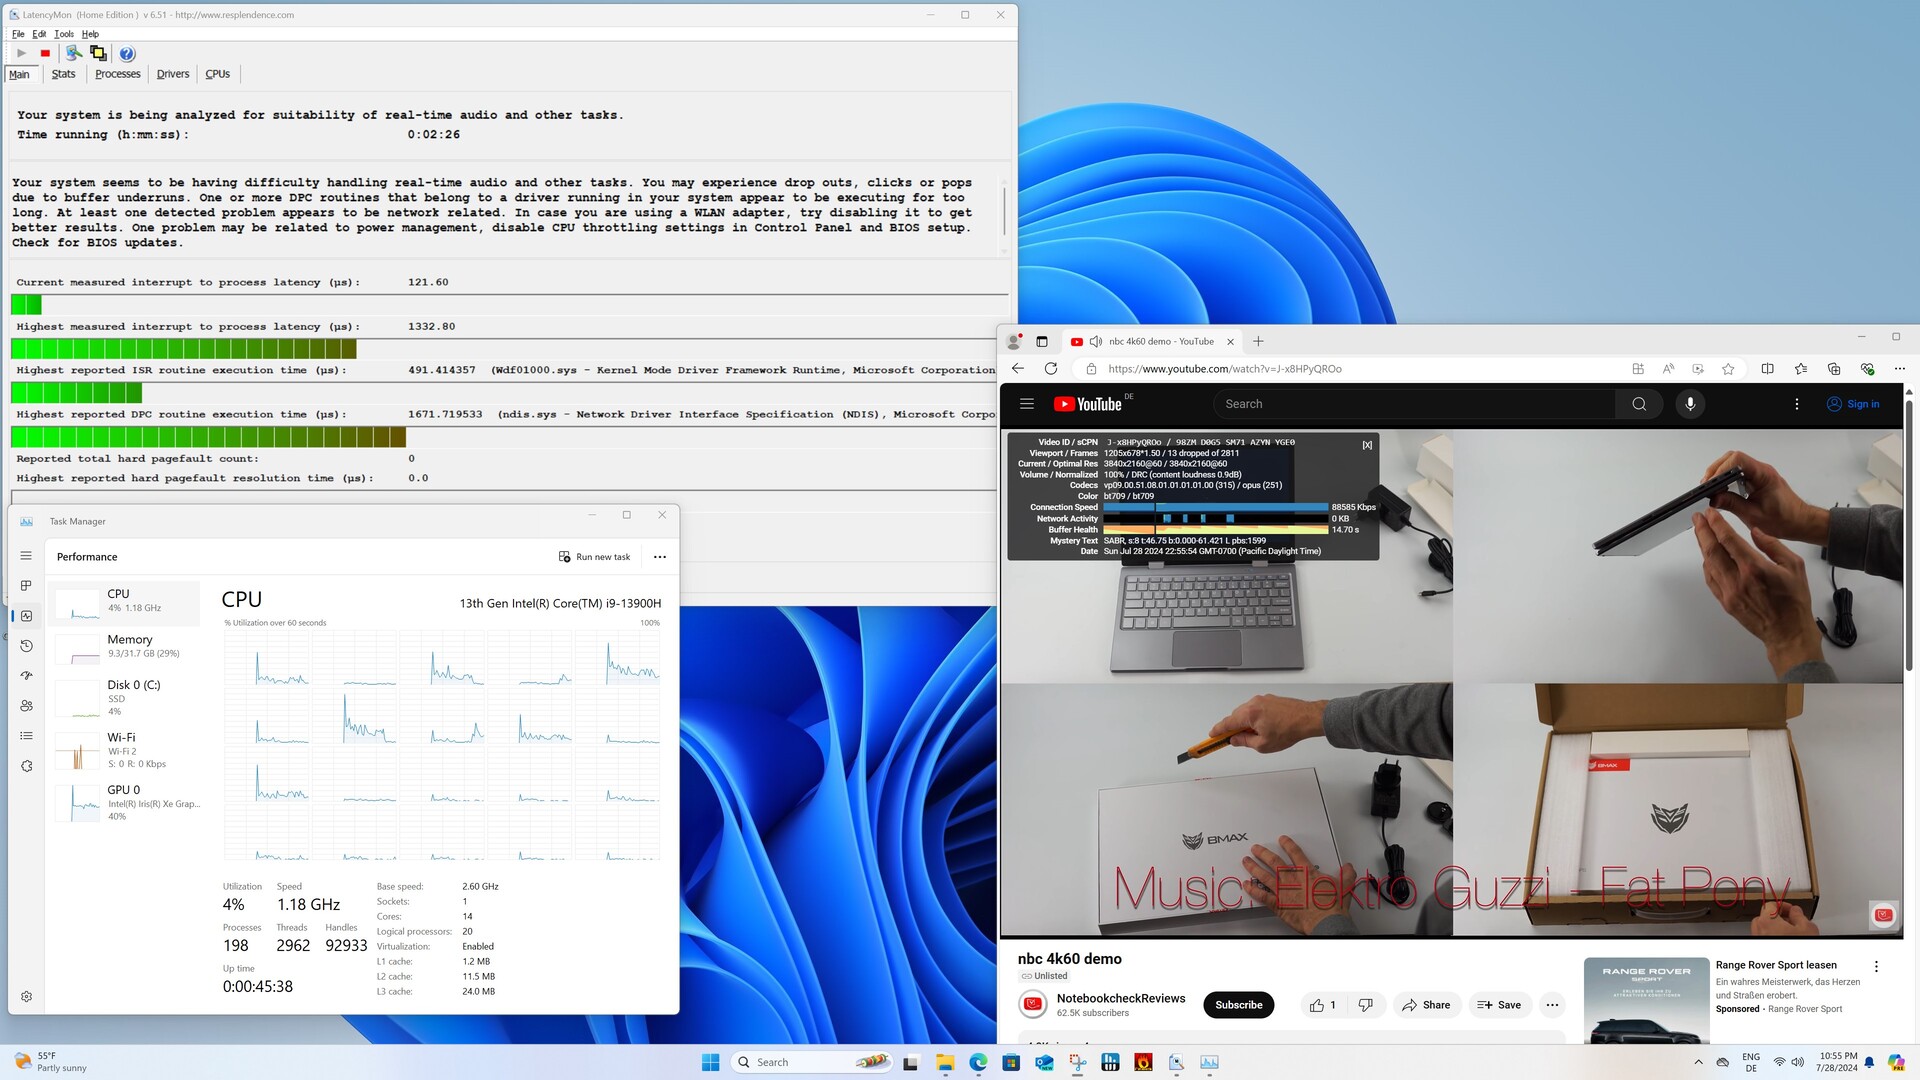
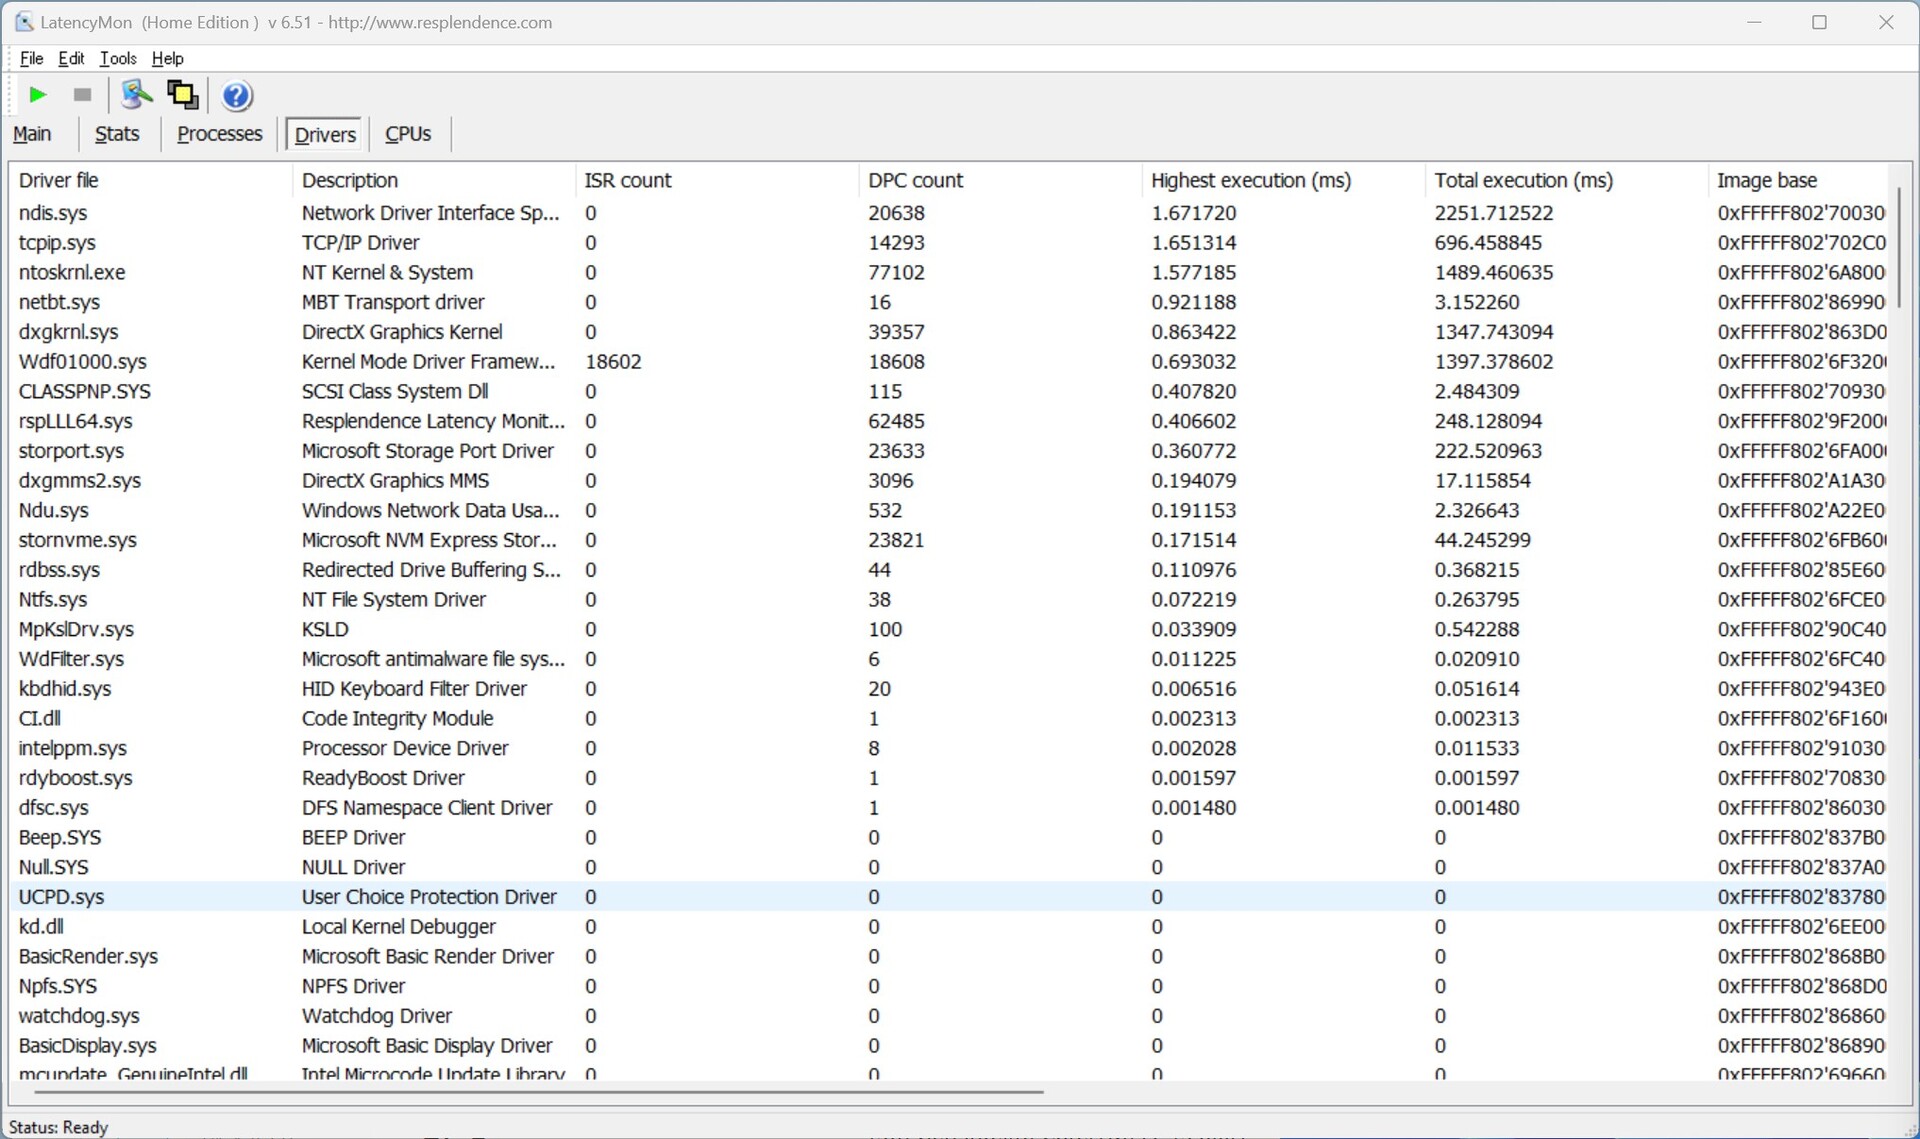
DPC latenties
We zien geen extreem hoge DPC-latenties met de Geekom XT13 Pro. Dit was wel het geval bij de Geekom XT12 Pro. Toch zijn de resultaten van ons testvoorbeeld verre van uitstekend. We bereikten de maximale waarde zelfs wanneer we gewoon met de Edge browser surften.

| DPC Latencies / LatencyMon - interrupt to process latency (max), Web, Youtube, Prime95 | |
| Acemagic F2A | |
| Geekom XT12 Pro | |
| Minisforum AtomMan X7 Ti | |
| Geekom XT13 Pro | |
| Geekom A7 | |
| Aoostar GEM12 | |
* ... kleiner is beter
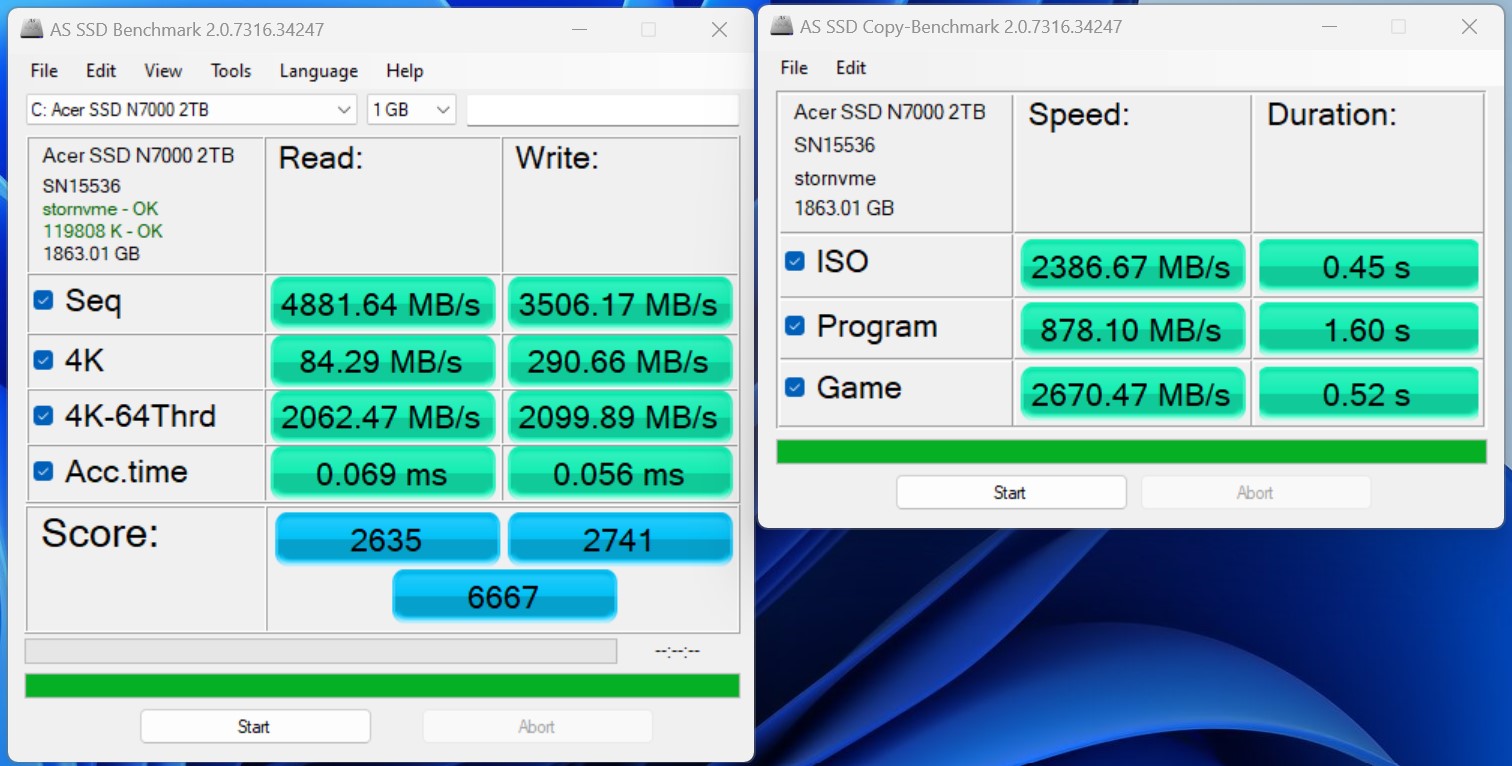
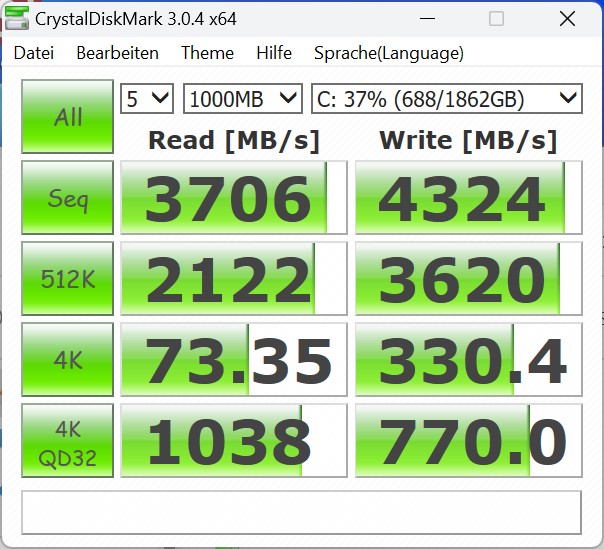
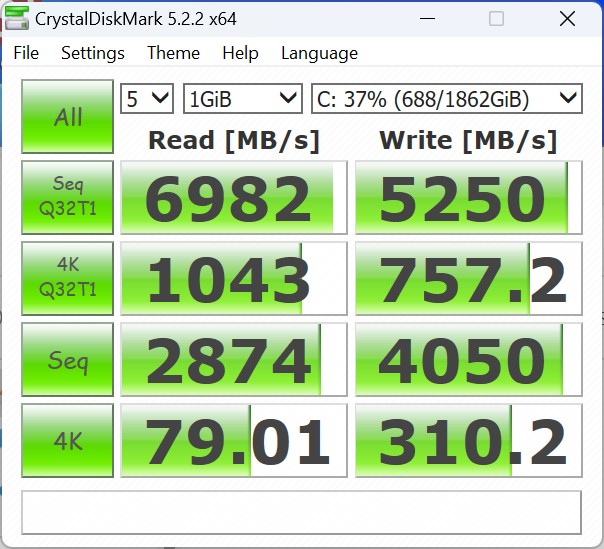
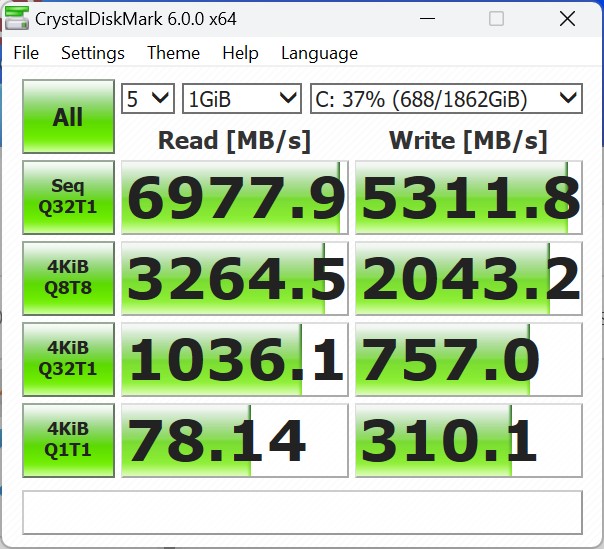
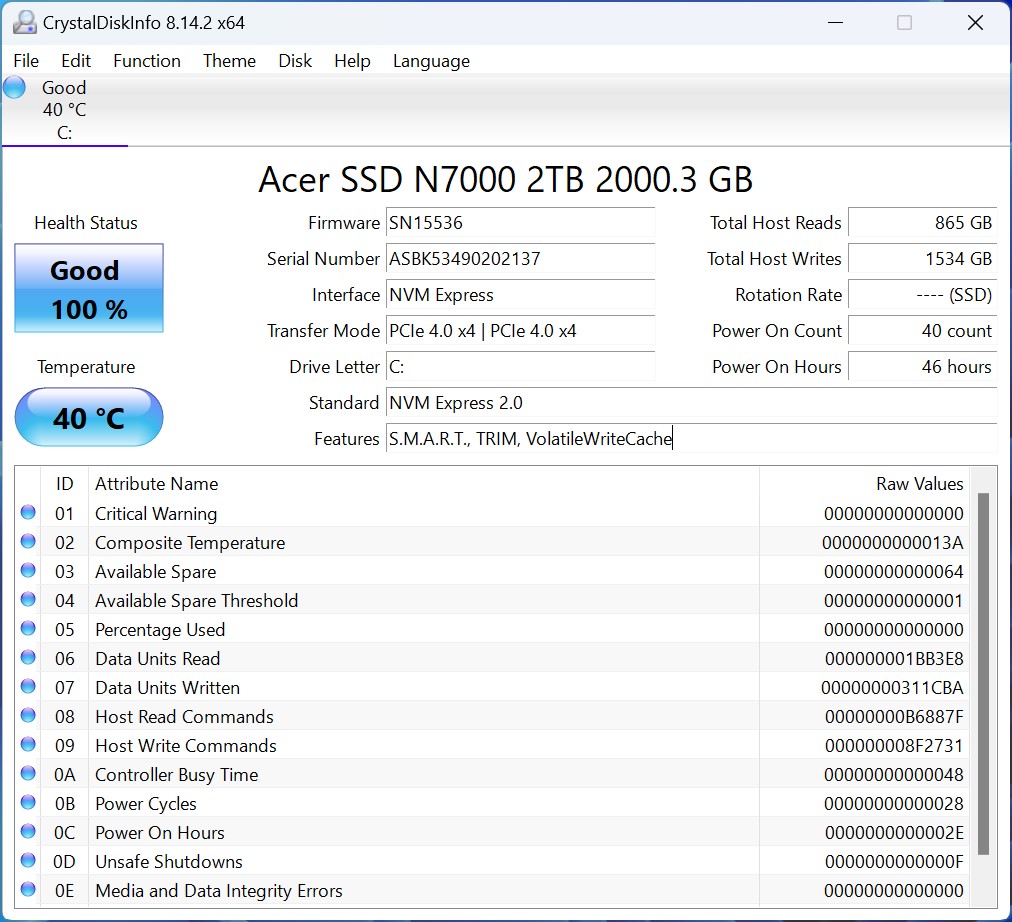
Massa-opslag
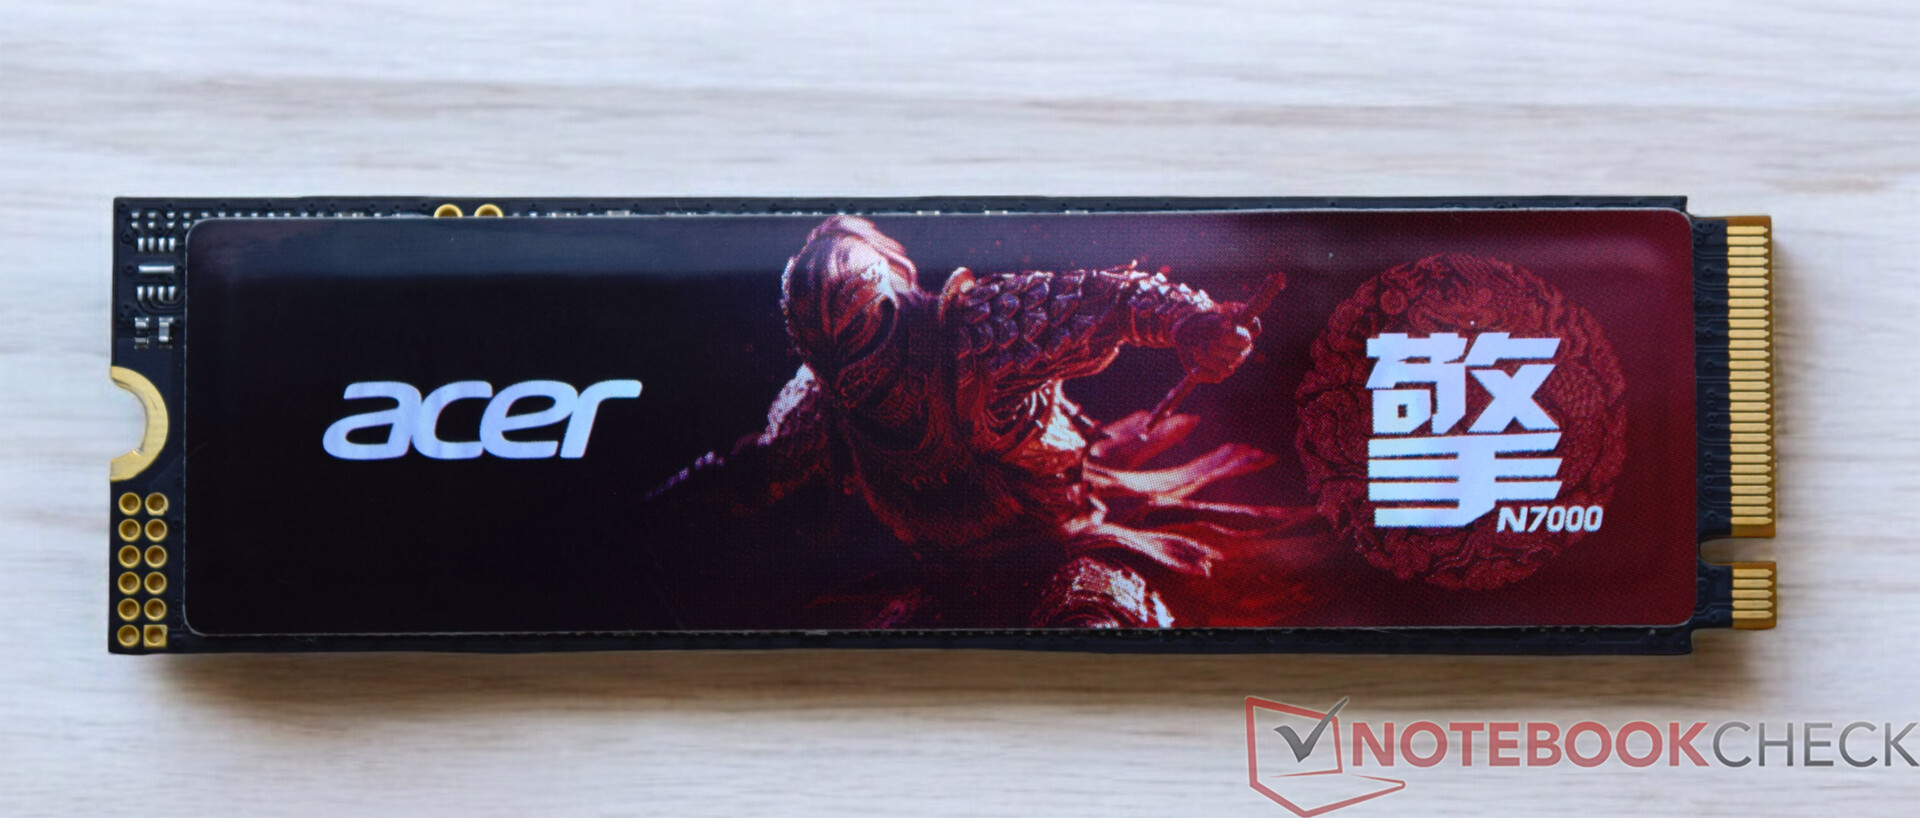
De Geekom XT13 Pro is uitgerust met een SSD met 2 TB opslagruimte van Acer. Hetzelfde model zat al in de Geekom GT13 en leverde in alle tests geweldige prestaties. De technische verbinding is optimaal en de resulterende overdrachtsnelheden zijn zeer hoog. Onder continue belasting heeft de Acer N7000 lichte problemen om de leesprestaties stabiel te houden. Gelukkig is er geen extreem nadeel. Zoals u in de grafiek kunt zien, kan de Acer N7000 nog steeds aanzienlijk beter presteren met verminderde leesprestaties dan de Geekom XT12 Pro of de Acemagic F2A. De test van de Geekom XT12 Pro bracht een probleem met de positie van de thermische pads aan het licht, wat bij de Geekom XT13 Pro niet het geval is. De thermische pads bevinden zich op de juiste positie. Zoals we al in de onderhoudssectie hebben vermeld, kan er een extra SSD in de Geekom XT13 Pro worden geïnstalleerd. Het tweede M.2 slot ondersteunt echter alleen SATA SSD's met een lengte van 42 millimeter (M.2-2242).
Voor verdere vergelijkingen en benchmarks verwijzen wij u naar onze Vergelijkingstabel.

| Drive Performance Rating - Percent | |
| Aoostar GEM12 | |
| Geekom XT13 Pro | |
| Geekom XT12 Pro | |
| Minisforum AtomMan X7 Ti | |
| Geekom A7 | |
| Gemiddelde van klas Mini PC | |
| Acemagic F2A | |
* ... kleiner is beter
Continuous read: DiskSpd Read Loop, Queue Depth 8
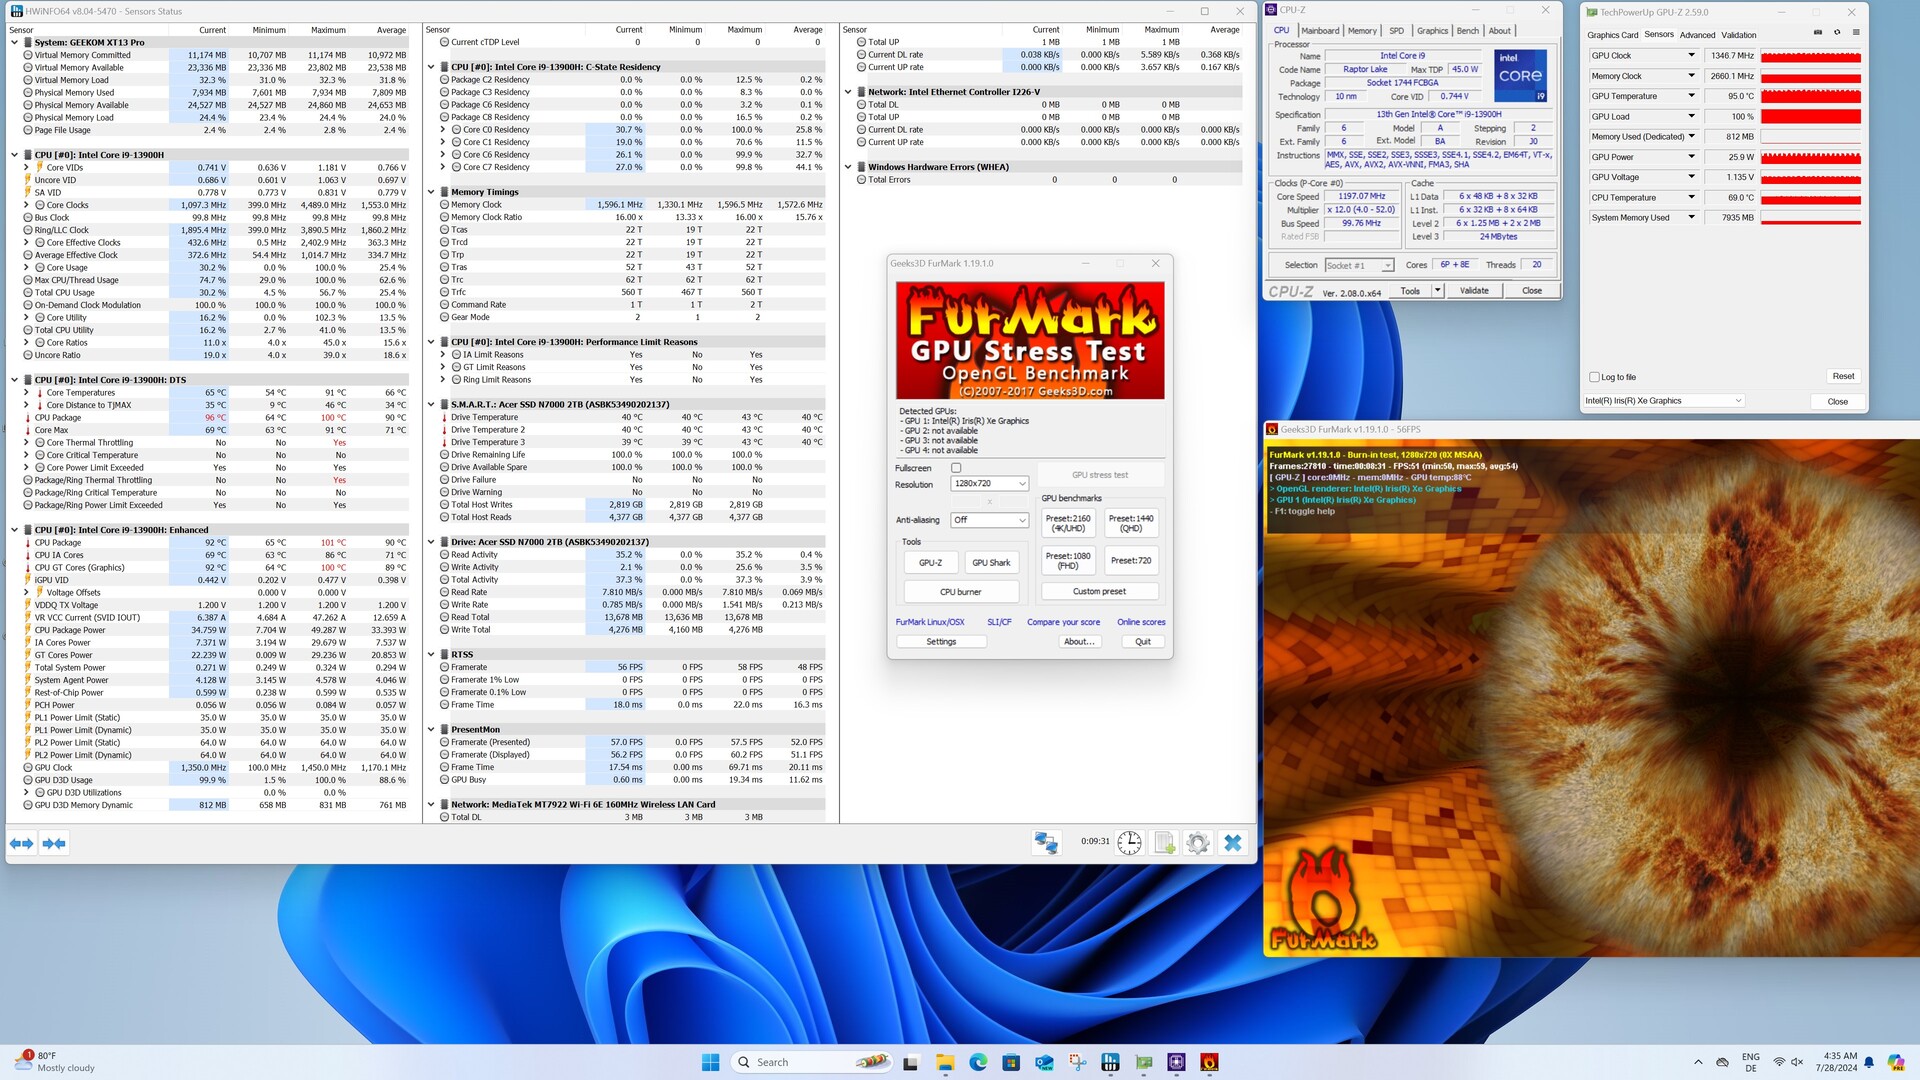
Grafische
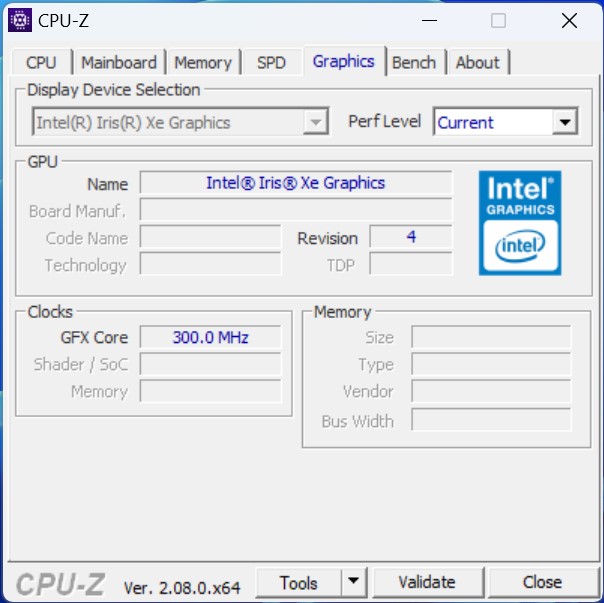
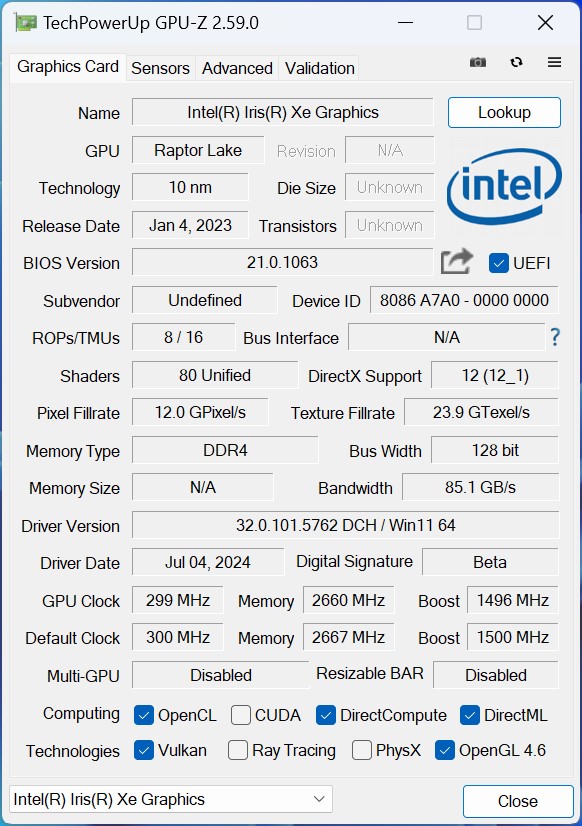
De Intel Iris Xe Graphics G7 handelt de 3D berekeningen af en is verantwoordelijk voor de beelduitvoer. Met 96 EU's is de Intel Core i9-13900H het snelste model in de serie. Het verouderde model heeft het echter moeilijk om het op te nemen tegen de moderne vertegenwoordigers. Als Geekom al de stap had durven nemen om een Meteor Lake SoC in de XT13 Pro te installeren, dan had men een duidelijk merkbare toename in 3D-prestaties kunnen verwachten. De prestaties van een Intel Arc 8-core iGPU zijn perfect te zien in de vergelijkingsgegevens. Ondertussen krijgt u nog meer 3D prestaties als er een AMD Radeon 780M in het systeem is geïnstalleerd. Geekom zelf biedt nu verschillende apparaten aan met deze iGPU, wat betekent dat de fabrikant het zichzelf moeilijk maakt in deze discipline. Een voorbeeld hiervan is de Geekom A7, de Geekom A8of de Geekom AE7.
Meer vergelijkingen en benchmarks vindt u in onze GPU vergelijkingstabel.
| 3DMark Performance Rating - Percent | |
| Geekom A7 | |
| Aoostar GEM12 | |
| Acemagic F2A | |
| Minisforum AtomMan X7 Ti | |
| Geekom XT13 Pro | |
| Geekom XT12 Pro | |
| 3DMark 11 - 1280x720 Performance GPU | |
| Geekom A7 | |
| Aoostar GEM12 | |
| Acemagic F2A | |
| Minisforum AtomMan X7 Ti | |
| Geekom XT13 Pro | |
| Geekom XT12 Pro | |
| 3DMark | |
| 2560x1440 Time Spy Graphics | |
| Acemagic F2A | |
| Minisforum AtomMan X7 Ti | |
| Geekom A7 | |
| Aoostar GEM12 | |
| Geekom XT13 Pro | |
| Geekom XT12 Pro | |
| 1920x1080 Fire Strike Graphics | |
| Geekom A7 | |
| Aoostar GEM12 | |
| Acemagic F2A | |
| Minisforum AtomMan X7 Ti | |
| Geekom XT13 Pro | |
| Geekom XT12 Pro | |
| Unigine Heaven 4.0 | |
| Extreme Preset OpenGL | |
| Aoostar GEM12 | |
| Acemagic F2A | |
| Minisforum AtomMan X7 Ti | |
| Geekom A7 | |
| Geekom XT13 Pro | |
| Geekom XT12 Pro | |
| Extreme Preset DX11 | |
| Aoostar GEM12 | |
| Minisforum AtomMan X7 Ti | |
| Acemagic F2A | |
| Geekom A7 | |
| Geekom XT13 Pro | |
| Geekom XT12 Pro | |
| Unigine Valley 1.0 | |
| 1920x1080 Extreme HD DirectX AA:x8 | |
| Aoostar GEM12 | |
| Minisforum AtomMan X7 Ti | |
| Geekom A7 | |
| Acemagic F2A | |
| Geekom XT13 Pro | |
| Geekom XT12 Pro | |
| 1920x1080 Extreme HD Preset OpenGL AA:x8 | |
| Minisforum AtomMan X7 Ti | |
| Aoostar GEM12 | |
| Acemagic F2A | |
| Geekom XT13 Pro | |
| Geekom XT12 Pro | |
| Geekom A7 | |
| Unigine Superposition | |
| 1280x720 720p Low | |
| Aoostar GEM12 | |
| Acemagic F2A | |
| Minisforum AtomMan X7 Ti | |
| Geekom A7 | |
| Geekom XT13 Pro | |
| Geekom XT12 Pro | |
| 1920x1080 1080p High | |
| Aoostar GEM12 | |
| Acemagic F2A | |
| Minisforum AtomMan X7 Ti | |
| Geekom A7 | |
| Geekom XT13 Pro | |
| Geekom XT12 Pro | |
| 1920x1080 1080p Extreme | |
| Acemagic F2A | |
| Minisforum AtomMan X7 Ti | |
| Aoostar GEM12 | |
| Geekom A7 | |
| Geekom XT13 Pro | |
| Geekom XT12 Pro | |
| ComputeMark v2.1 | |
| 1024x600 Normal, Score | |
| Geekom A7 | |
| Aoostar GEM12 | |
| Acemagic F2A | |
| Minisforum AtomMan X7 Ti | |
| Geekom XT13 Pro | |
| Geekom XT12 Pro | |
| 1024x600 Normal, Fluid 3DTex | |
| Aoostar GEM12 | |
| Geekom A7 | |
| Minisforum AtomMan X7 Ti | |
| Acemagic F2A | |
| Geekom XT13 Pro | |
| Geekom XT12 Pro | |
| 1024x600 Normal, Fluid 2DTexArr | |
| Geekom A7 | |
| Aoostar GEM12 | |
| Minisforum AtomMan X7 Ti | |
| Acemagic F2A | |
| Geekom XT13 Pro | |
| Geekom XT12 Pro | |
| 1024x600 Normal, Mandel Vector | |
| Geekom A7 | |
| Aoostar GEM12 | |
| Acemagic F2A | |
| Minisforum AtomMan X7 Ti | |
| Geekom XT12 Pro | |
| Geekom XT13 Pro | |
| 1024x600 Normal, Mandel Scalar | |
| Geekom A7 | |
| Aoostar GEM12 | |
| Acemagic F2A | |
| Minisforum AtomMan X7 Ti | |
| Geekom XT12 Pro | |
| Geekom XT13 Pro | |
| 1024x600 Normal, QJuliaRayTrace | |
| Geekom A7 | |
| Aoostar GEM12 | |
| Acemagic F2A | |
| Minisforum AtomMan X7 Ti | |
| Geekom XT13 Pro | |
| Geekom XT12 Pro | |
| LuxMark v2.0 64Bit | |
| Room GPUs-only | |
| Geekom A7 | |
| Aoostar GEM12 | |
| Minisforum AtomMan X7 Ti | |
| Geekom XT13 Pro | |
| Acemagic F2A | |
| Sala GPUs-only | |
| Minisforum AtomMan X7 Ti | |
| Acemagic F2A | |
| Geekom XT13 Pro | |
| Geekom A7 | |
| Aoostar GEM12 | |
| Affinity Photo 2 - Combined (Single / Multi GPU) | |
| Minisforum AtomMan X7 Ti | |
| Acemagic F2A | |
| Geekom XT13 Pro | |
| Geekom XT12 Pro | |
| Aoostar GEM12 | |
| Geekom A7 | |
| Geekom XT13 Pro, Intel Iris Xe Graphics G7 96EUs i9-13900H | Aoostar GEM12, AMD Radeon 780M R7 8845HS | Minisforum AtomMan X7 Ti, Intel Arc 8-Core iGPU Ultra 9 185H | Acemagic F2A, Intel Arc 8-Core iGPU Ultra 7 155H | Geekom XT12 Pro, Intel Iris Xe Graphics G7 96EUs i9-12900H | Geekom A7, AMD Radeon 780M R9 7940HS | Gemiddelde van klas Mini PC | |
|---|---|---|---|---|---|---|---|
| SPECviewperf 2020 | 309% | 36% | 25% | -4% | 278% | 188% | |
| 3840x2160 Medical (medical-03) | 3.63 | 11.2 209% | 4.23 17% | 5.05 39% | 3.49 -4% | 11.1 206% | 7.95 ? 119% |
| 3840x2160 Energy (energy-03) | 3.15 | 19.9 532% | 6.03 91% | 4.61 46% | 3.05 -3% | 14.1 348% | 11.4 ? 262% |
| 3840x2160 Creo (creo-03) | 16 | 33.4 109% | 18.5 16% | 17.9 12% | 14.8 -7% | 31.4 96% | 30.1 ? 88% |
| 3840x2160 CATIA (catia-06) | 7.9 | 23.2 194% | 11.1 41% | 10 27% | 7.78 -2% | 24.8 214% | 18.3 ? 132% |
| 3840x2160 3ds Max (3dsmax-07) | 10.3 | 20.4 98% | 14.9 45% | 12.9 25% | 9.69 -6% | 20.9 103% | 22.1 ? 115% |
| 3840x2160 Siemens NX (snx-04) | 6.13 | 64.1 946% | 6.24 2% | 5.7 -7% | 6.29 3% | 61.4 902% | 36.3 ? 492% |
| 3840x2160 Maya (maya-06) | 26.8 | 47.7 78% | 37.7 41% | 35.4 32% | 23.9 -11% | 47 75% | 56.6 ? 111% |
| 3DMark 05 Standard | 29045 punten | |
| 3DMark 06 Score 1366x768 | 30156 punten | |
| 3DMark Vantage P Result | 28599 punten | |
| 3DMark 11 Performance | 8024 punten | |
| 3DMark Ice Storm Standard Score | 155640 punten | |
| 3DMark Cloud Gate Standard Score | 28112 punten | |
| 3DMark Fire Strike Score | 5448 punten | |
| 3DMark Fire Strike Extreme Score | 2570 punten | |
| 3DMark Time Spy Score | 1920 punten | |
| 3DMark Steel Nomad Score | 183 punten | |
| 3DMark Steel Nomad Light Score | 1276 punten | |
Help | ||
Gamingprestaties
De Intel Iris Xe iGPU kan de meeste games niet aan. De verouderde iGPU haalt alleen bij lage resoluties en een lage of medium grafische voorinstelling voldoende framerates, als dat al het geval is. Als u de Geekom XT13 Pro toch wilt gebruiken om te gamen, moet u een omweg maken via een externe grafische kaart. Er zijn verschillende modellen die via USB4 met het apparaat gebruikt kunnen worden.
| Dota 2 Reborn | |
| 1280x720 min (0/3) fastest | |
| Geekom A7 | |
| Aoostar GEM12 | |
| Geekom XT13 Pro | |
| Minisforum AtomMan X7 Ti | |
| Geekom XT12 Pro | |
| Acemagic F2A | |
| 1920x1080 high (2/3) | |
| Geekom A7 | |
| Aoostar GEM12 | |
| Minisforum AtomMan X7 Ti | |
| Acemagic F2A | |
| Geekom XT13 Pro | |
| Geekom XT12 Pro | |
| GTA V | |
| 1024x768 Lowest Settings possible | |
| Geekom A7 | |
| Aoostar GEM12 | |
| Minisforum AtomMan X7 Ti | |
| Acemagic F2A | |
| Geekom XT13 Pro | |
| 1920x1080 High/On (Advanced Graphics Off) AA:2xMSAA + FX AF:8x | |
| Geekom A7 | |
| Aoostar GEM12 | |
| Minisforum AtomMan X7 Ti | |
| Acemagic F2A | |
| Geekom XT13 Pro | |
| Cyberpunk 2077 2.2 Phantom Liberty | |
| 1920x1080 Low Preset (FSR off) | |
| Aoostar GEM12 | |
| Minisforum AtomMan X7 Ti | |
| Acemagic F2A | |
| Geekom XT13 Pro | |
| Geekom XT12 Pro | |
| 1920x1080 High Preset (FSR off) | |
| Aoostar GEM12 | |
| Minisforum AtomMan X7 Ti | |
| Acemagic F2A | |
| Geekom XT13 Pro | |
| Geekom XT12 Pro | |
| Baldur's Gate 3 | |
| 1280x720 Low Preset | |
| Aoostar GEM12 | |
| Minisforum AtomMan X7 Ti | |
| Geekom XT13 Pro | |
| 1920x1080 High Preset | |
| Aoostar GEM12 | |
| Minisforum AtomMan X7 Ti | |
| Geekom XT13 Pro | |
| F1 24 | |
| 1920x1080 Low Preset AA:T AF:16x | |
| Minisforum AtomMan X7 Ti | |
| Geekom XT13 Pro | |
| 1920x1080 High Preset AA:T AF:16x | |
| Minisforum AtomMan X7 Ti | |
| Geekom XT13 Pro | |
FPS chart
| lage | gem. | hoge | ultra | |
|---|---|---|---|---|
| GTA V (2015) | 123.5 | 105.9 | 22.1 | 9 |
| Dota 2 Reborn (2015) | 117.2 | 82.9 | 72.5 | 66.5 |
| Final Fantasy XV Benchmark (2018) | 46 | 25.7 | 18.2 | |
| Baldur's Gate 3 (2023) | 19.9 | 15.4 | 13.5 | 13 |
| Cyberpunk 2077 2.2 Phantom Liberty (2023) | 18.6 | 15 | 13 | 11.4 |
| F1 24 (2024) | 43.1 | 37.3 | 26.7 |
Geekom XT13 Pro prestatiecontrole met een Nvidia GeForce RTX 3060 Ti
De Geekom XT13 Pro heeft twee USB4-poorten, die het gebruik van externe grafische kaarten ondersteunen. Zonder het algemene resultaat te beïnvloeden, hebben we enkele tests uitgevoerd met de Razer Core X en een Nvidia GeForce RTX 3060 Ti. Vergeleken met de verouderde iGPU van de Intel Core i9-13900H kunnen de 3D prestaties enorm worden verhoogd. De vergelijking met de andere testapparaten laat een bijna identiek resultaat zien in de synthetische tests. Gamingprestaties kunnen ook aanzienlijk worden verhoogd met deze combinatie, zoals te zien is aan de geteste games. Soms kunnen zelfs de modernste games tot in de kleinste details worden weergegeven.
| Performance Rating - Percent | |
| Geekom AE7 (Nvidia GeForce RTX 3060 Ti FE) | |
| Geekom A8 (Nvidia GeForce RTX 3060 Ti FE) | |
| Geekom GT13 Pro (Nvidia GeForce RTX 3060 Ti FE) | |
| Geekom XT13 Pro (Nvidia GeForce RTX 3060 Ti FE) | |
| Geekom XT12 Pro (Nvidia GeForce RTX 3060 Ti FE) | |
| Minisforum UH125 Pro (Nvidia GeForce RTX 3060 Ti FE) | |
| 3DMark 11 - 1280x720 Performance GPU | |
| Geekom A8 (Nvidia GeForce RTX 3060 Ti FE) | |
| Geekom AE7 (Nvidia GeForce RTX 3060 Ti FE) | |
| Geekom XT13 Pro (Nvidia GeForce RTX 3060 Ti FE) | |
| Geekom GT13 Pro (Nvidia GeForce RTX 3060 Ti FE) | |
| Geekom XT12 Pro (Nvidia GeForce RTX 3060 Ti FE) | |
| Minisforum UH125 Pro (Nvidia GeForce RTX 3060 Ti FE) | |
| 3DMark | |
| 2560x1440 Time Spy Graphics | |
| Geekom A8 (Nvidia GeForce RTX 3060 Ti FE) | |
| Geekom AE7 (Nvidia GeForce RTX 3060 Ti FE) | |
| Geekom XT13 Pro (Nvidia GeForce RTX 3060 Ti FE) | |
| Geekom GT13 Pro (Nvidia GeForce RTX 3060 Ti FE) | |
| Geekom XT12 Pro (Nvidia GeForce RTX 3060 Ti FE) | |
| Minisforum UH125 Pro (Nvidia GeForce RTX 3060 Ti FE) | |
| 1920x1080 Fire Strike Graphics | |
| Geekom AE7 (Nvidia GeForce RTX 3060 Ti FE) | |
| Geekom GT13 Pro (Nvidia GeForce RTX 3060 Ti FE) | |
| Geekom A8 (Nvidia GeForce RTX 3060 Ti FE) | |
| Geekom XT13 Pro (Nvidia GeForce RTX 3060 Ti FE) | |
| Minisforum UH125 Pro (Nvidia GeForce RTX 3060 Ti FE) | |
| Geekom XT12 Pro (Nvidia GeForce RTX 3060 Ti FE) | |
| 3840x2160 Fire Strike Ultra Graphics | |
| Geekom GT13 Pro (Nvidia GeForce RTX 3060 Ti FE) | |
| Geekom AE7 (Nvidia GeForce RTX 3060 Ti FE) | |
| Geekom XT12 Pro (Nvidia GeForce RTX 3060 Ti FE) | |
| Geekom XT13 Pro (Nvidia GeForce RTX 3060 Ti FE) | |
| Geekom A8 (Nvidia GeForce RTX 3060 Ti FE) | |
| Minisforum UH125 Pro (Nvidia GeForce RTX 3060 Ti FE) | |
| Unigine Superposition | |
| 1280x720 720p Low | |
| Geekom AE7 (Nvidia GeForce RTX 3060 Ti FE) | |
| Geekom GT13 Pro (Nvidia GeForce RTX 3060 Ti FE) | |
| Geekom A8 (Nvidia GeForce RTX 3060 Ti FE) | |
| Geekom XT13 Pro (Nvidia GeForce RTX 3060 Ti FE) | |
| Geekom XT12 Pro (Nvidia GeForce RTX 3060 Ti FE) | |
| Minisforum UH125 Pro (Nvidia GeForce RTX 3060 Ti FE) | |
| 1920x1080 1080p High | |
| Geekom GT13 Pro (Nvidia GeForce RTX 3060 Ti FE) | |
| Geekom A8 (Nvidia GeForce RTX 3060 Ti FE) | |
| Geekom AE7 (Nvidia GeForce RTX 3060 Ti FE) | |
| Geekom XT13 Pro (Nvidia GeForce RTX 3060 Ti FE) | |
| Minisforum UH125 Pro (Nvidia GeForce RTX 3060 Ti FE) | |
| Geekom XT12 Pro (Nvidia GeForce RTX 3060 Ti FE) | |
| 1920x1080 1080p Extreme | |
| Geekom GT13 Pro (Nvidia GeForce RTX 3060 Ti FE) | |
| Geekom XT13 Pro (Nvidia GeForce RTX 3060 Ti FE) | |
| Geekom XT12 Pro (Nvidia GeForce RTX 3060 Ti FE) | |
| Minisforum UH125 Pro (Nvidia GeForce RTX 3060 Ti FE) | |
| Geekom A8 (Nvidia GeForce RTX 3060 Ti FE) | |
| Geekom AE7 (Nvidia GeForce RTX 3060 Ti FE) | |
| 3840x2160 4k Optimized | |
| Geekom GT13 Pro (Nvidia GeForce RTX 3060 Ti FE) | |
| Geekom XT13 Pro (Nvidia GeForce RTX 3060 Ti FE) | |
| Geekom XT12 Pro (Nvidia GeForce RTX 3060 Ti FE) | |
| Geekom A8 (Nvidia GeForce RTX 3060 Ti FE) | |
| Minisforum UH125 Pro (Nvidia GeForce RTX 3060 Ti FE) | |
| Geekom AE7 (Nvidia GeForce RTX 3060 Ti FE) | |
| 7680x4320 8k Optimized | |
| Geekom GT13 Pro (Nvidia GeForce RTX 3060 Ti FE) | |
| Geekom XT13 Pro (Nvidia GeForce RTX 3060 Ti FE) | |
| Geekom XT12 Pro (Nvidia GeForce RTX 3060 Ti FE) | |
| Minisforum UH125 Pro (Nvidia GeForce RTX 3060 Ti FE) | |
| Geekom A8 (Nvidia GeForce RTX 3060 Ti FE) | |
| Geekom AE7 (Nvidia GeForce RTX 3060 Ti FE) | |
| Unigine Valley 1.0 | |
| 1920x1080 Extreme HD DirectX AA:x8 | |
| Geekom XT12 Pro (Nvidia GeForce RTX 3060 Ti FE) | |
| Geekom GT13 Pro (Nvidia GeForce RTX 3060 Ti FE) | |
| Geekom XT13 Pro (Nvidia GeForce RTX 3060 Ti FE) | |
| Geekom A8 (Nvidia GeForce RTX 3060 Ti FE) | |
| Geekom AE7 (Nvidia GeForce RTX 3060 Ti FE) | |
| Minisforum UH125 Pro (Nvidia GeForce RTX 3060 Ti FE) | |
| 1920x1080 Extreme HD Preset OpenGL AA:x8 | |
| Geekom GT13 Pro (Nvidia GeForce RTX 3060 Ti FE) | |
| Geekom XT12 Pro (Nvidia GeForce RTX 3060 Ti FE) | |
| Geekom XT13 Pro (Nvidia GeForce RTX 3060 Ti FE) | |
| Geekom A8 (Nvidia GeForce RTX 3060 Ti FE) | |
| Geekom AE7 (Nvidia GeForce RTX 3060 Ti FE) | |
| Minisforum UH125 Pro (Nvidia GeForce RTX 3060 Ti FE) | |
| Unigine Heaven 4.0 | |
| Extreme Preset OpenGL | |
| Geekom A8 (Nvidia GeForce RTX 3060 Ti FE) | |
| Geekom AE7 (Nvidia GeForce RTX 3060 Ti FE) | |
| Geekom GT13 Pro (Nvidia GeForce RTX 3060 Ti FE) | |
| Geekom XT13 Pro (Nvidia GeForce RTX 3060 Ti FE) | |
| Minisforum UH125 Pro (Nvidia GeForce RTX 3060 Ti FE) | |
| Geekom XT12 Pro (Nvidia GeForce RTX 3060 Ti FE) | |
| Extreme Preset DX11 | |
| Geekom XT13 Pro (Nvidia GeForce RTX 3060 Ti FE) | |
| Geekom GT13 Pro (Nvidia GeForce RTX 3060 Ti FE) | |
| Geekom A8 (Nvidia GeForce RTX 3060 Ti FE) | |
| Geekom XT12 Pro (Nvidia GeForce RTX 3060 Ti FE) | |
| Geekom AE7 (Nvidia GeForce RTX 3060 Ti FE) | |
| Minisforum UH125 Pro (Nvidia GeForce RTX 3060 Ti FE) | |
| ComputeMark v2.1 | |
| 1024x600 Normal, Score | |
| Geekom GT13 Pro (Nvidia GeForce RTX 3060 Ti FE) | |
| Geekom AE7 (Nvidia GeForce RTX 3060 Ti FE) | |
| Geekom A8 (Nvidia GeForce RTX 3060 Ti FE) | |
| Geekom XT13 Pro (Nvidia GeForce RTX 3060 Ti FE) | |
| Minisforum UH125 Pro (Nvidia GeForce RTX 3060 Ti FE) | |
| Geekom XT12 Pro (Nvidia GeForce RTX 3060 Ti FE) | |
| 1024x600 Normal, Fluid 3DTex | |
| Geekom GT13 Pro (Nvidia GeForce RTX 3060 Ti FE) | |
| Geekom AE7 (Nvidia GeForce RTX 3060 Ti FE) | |
| Minisforum UH125 Pro (Nvidia GeForce RTX 3060 Ti FE) | |
| Geekom A8 (Nvidia GeForce RTX 3060 Ti FE) | |
| Geekom XT13 Pro (Nvidia GeForce RTX 3060 Ti FE) | |
| Geekom XT12 Pro (Nvidia GeForce RTX 3060 Ti FE) | |
| 1024x600 Normal, Fluid 2DTexArr | |
| Geekom GT13 Pro (Nvidia GeForce RTX 3060 Ti FE) | |
| Geekom AE7 (Nvidia GeForce RTX 3060 Ti FE) | |
| Minisforum UH125 Pro (Nvidia GeForce RTX 3060 Ti FE) | |
| Geekom A8 (Nvidia GeForce RTX 3060 Ti FE) | |
| Geekom XT13 Pro (Nvidia GeForce RTX 3060 Ti FE) | |
| Geekom XT12 Pro (Nvidia GeForce RTX 3060 Ti FE) | |
| 1024x600 Normal, Mandel Vector | |
| Geekom GT13 Pro (Nvidia GeForce RTX 3060 Ti FE) | |
| Geekom AE7 (Nvidia GeForce RTX 3060 Ti FE) | |
| Geekom A8 (Nvidia GeForce RTX 3060 Ti FE) | |
| Geekom XT13 Pro (Nvidia GeForce RTX 3060 Ti FE) | |
| Minisforum UH125 Pro (Nvidia GeForce RTX 3060 Ti FE) | |
| Geekom XT12 Pro (Nvidia GeForce RTX 3060 Ti FE) | |
| 1024x600 Normal, Mandel Scalar | |
| Geekom GT13 Pro (Nvidia GeForce RTX 3060 Ti FE) | |
| Geekom AE7 (Nvidia GeForce RTX 3060 Ti FE) | |
| Geekom A8 (Nvidia GeForce RTX 3060 Ti FE) | |
| Geekom XT13 Pro (Nvidia GeForce RTX 3060 Ti FE) | |
| Minisforum UH125 Pro (Nvidia GeForce RTX 3060 Ti FE) | |
| Geekom XT12 Pro (Nvidia GeForce RTX 3060 Ti FE) | |
| 1024x600 Normal, QJuliaRayTrace | |
| Geekom GT13 Pro (Nvidia GeForce RTX 3060 Ti FE) | |
| Geekom AE7 (Nvidia GeForce RTX 3060 Ti FE) | |
| Geekom A8 (Nvidia GeForce RTX 3060 Ti FE) | |
| Geekom XT13 Pro (Nvidia GeForce RTX 3060 Ti FE) | |
| Minisforum UH125 Pro (Nvidia GeForce RTX 3060 Ti FE) | |
| Geekom XT12 Pro (Nvidia GeForce RTX 3060 Ti FE) | |
| Photoshop PugetBench - GPU Score | |
| Geekom A8 (Nvidia GeForce RTX 3060 Ti FE) | |
| Geekom AE7 (Nvidia GeForce RTX 3060 Ti FE) | |
| Geekom XT12 Pro (Nvidia GeForce RTX 3060 Ti FE) | |
| Geekom GT13 Pro (Nvidia GeForce RTX 3060 Ti FE) | |
| Minisforum UH125 Pro (Nvidia GeForce RTX 3060 Ti FE) | |
| Geekom XT13 Pro (Nvidia GeForce RTX 3060 Ti FE) | |
| Premiere Pro PugetBench - GPU 0.9 | |
| Geekom A8 (Nvidia GeForce RTX 3060 Ti FE) | |
| Geekom AE7 (Nvidia GeForce RTX 3060 Ti FE) | |
| Geekom GT13 Pro (Nvidia GeForce RTX 3060 Ti FE) | |
| Minisforum UH125 Pro (Nvidia GeForce RTX 3060 Ti FE) | |
| Geekom XT13 Pro (Nvidia GeForce RTX 3060 Ti FE) | |
| Geekom XT12 Pro (Nvidia GeForce RTX 3060 Ti FE) | |
| Cyberpunk 2077 2.2 Phantom Liberty | |
| 1280x720 Low Preset (FSR off) | |
| Geekom AE7 (Nvidia GeForce RTX 3060 Ti FE) | |
| Geekom A8 (Nvidia GeForce RTX 3060 Ti FE) | |
| Geekom XT13 Pro (Nvidia GeForce RTX 3060 Ti FE) | |
| Geekom GT13 Pro (Nvidia GeForce RTX 3060 Ti FE) | |
| Geekom XT12 Pro (Nvidia GeForce RTX 3060 Ti FE) | |
| Minisforum UH125 Pro (Nvidia GeForce RTX 3060 Ti FE) | |
| Geekom XT13 Pro | |
| 1920x1080 Medium Preset (FSR off) | |
| Geekom AE7 (Nvidia GeForce RTX 3060 Ti FE) | |
| Geekom XT13 Pro (Nvidia GeForce RTX 3060 Ti FE) | |
| Geekom A8 (Nvidia GeForce RTX 3060 Ti FE) | |
| Geekom GT13 Pro (Nvidia GeForce RTX 3060 Ti FE) | |
| Geekom XT12 Pro (Nvidia GeForce RTX 3060 Ti FE) | |
| Minisforum UH125 Pro (Nvidia GeForce RTX 3060 Ti FE) | |
| Geekom XT13 Pro | |
| 1920x1080 Ultra Preset (FSR off) | |
| Geekom AE7 (Nvidia GeForce RTX 3060 Ti FE) | |
| Geekom XT13 Pro (Nvidia GeForce RTX 3060 Ti FE) | |
| Geekom GT13 Pro (Nvidia GeForce RTX 3060 Ti FE) | |
| Geekom A8 (Nvidia GeForce RTX 3060 Ti FE) | |
| Geekom XT12 Pro (Nvidia GeForce RTX 3060 Ti FE) | |
| Minisforum UH125 Pro (Nvidia GeForce RTX 3060 Ti FE) | |
| Geekom XT13 Pro | |
| Baldur's Gate 3 | |
| 1920x1080 Low Preset | |
| Geekom GT13 Pro (Nvidia GeForce RTX 3060 Ti FE) | |
| Geekom XT12 Pro (Nvidia GeForce RTX 3060 Ti FE) | |
| Geekom XT13 Pro (Nvidia GeForce RTX 3060 Ti FE) | |
| Geekom AE7 (Nvidia GeForce RTX 3060 Ti FE) | |
| Geekom A8 (Nvidia GeForce RTX 3060 Ti FE) | |
| Minisforum UH125 Pro (Nvidia GeForce RTX 3060 Ti FE) | |
| Geekom XT13 Pro | |
| 1920x1080 Medium Preset | |
| Geekom XT13 Pro (Nvidia GeForce RTX 3060 Ti FE) | |
| Geekom GT13 Pro (Nvidia GeForce RTX 3060 Ti FE) | |
| Geekom A8 (Nvidia GeForce RTX 3060 Ti FE) | |
| Geekom XT12 Pro (Nvidia GeForce RTX 3060 Ti FE) | |
| Geekom AE7 (Nvidia GeForce RTX 3060 Ti FE) | |
| Minisforum UH125 Pro (Nvidia GeForce RTX 3060 Ti FE) | |
| Geekom XT13 Pro | |
| 1920x1080 Ultra Preset | |
| Geekom GT13 Pro (Nvidia GeForce RTX 3060 Ti FE) | |
| Geekom XT13 Pro (Nvidia GeForce RTX 3060 Ti FE) | |
| Geekom A8 (Nvidia GeForce RTX 3060 Ti FE) | |
| Geekom XT12 Pro (Nvidia GeForce RTX 3060 Ti FE) | |
| Geekom AE7 (Nvidia GeForce RTX 3060 Ti FE) | |
| Minisforum UH125 Pro (Nvidia GeForce RTX 3060 Ti FE) | |
| Geekom XT13 Pro | |
| F1 24 | |
| 1920x1080 Low Preset AA:T AF:16x | |
| Geekom AE7 (Nvidia GeForce RTX 3060 Ti FE) | |
| Geekom A8 (Nvidia GeForce RTX 3060 Ti FE) | |
| Geekom GT13 Pro (Nvidia GeForce RTX 3060 Ti FE) | |
| Geekom XT13 Pro (Nvidia GeForce RTX 3060 Ti FE) | |
| Geekom XT12 Pro (Nvidia GeForce RTX 3060 Ti FE) | |
| Minisforum UH125 Pro (Nvidia GeForce RTX 3060 Ti FE) | |
| Geekom XT13 Pro | |
| 1920x1080 Medium Preset AA:T AF:16x | |
| Geekom A8 (Nvidia GeForce RTX 3060 Ti FE) | |
| Geekom AE7 (Nvidia GeForce RTX 3060 Ti FE) | |
| Geekom XT12 Pro (Nvidia GeForce RTX 3060 Ti FE) | |
| Geekom XT13 Pro (Nvidia GeForce RTX 3060 Ti FE) | |
| Geekom GT13 Pro (Nvidia GeForce RTX 3060 Ti FE) | |
| Minisforum UH125 Pro (Nvidia GeForce RTX 3060 Ti FE) | |
| Geekom XT13 Pro | |
| 1920x1080 Ultra High Preset AA:T AF:16x | |
| Geekom AE7 (Nvidia GeForce RTX 3060 Ti FE) | |
| Geekom A8 (Nvidia GeForce RTX 3060 Ti FE) | |
| Geekom XT13 Pro (Nvidia GeForce RTX 3060 Ti FE) | |
| Geekom GT13 Pro (Nvidia GeForce RTX 3060 Ti FE) | |
| Geekom XT12 Pro (Nvidia GeForce RTX 3060 Ti FE) | |
| Minisforum UH125 Pro (Nvidia GeForce RTX 3060 Ti FE) | |
| Geekom XT13 Pro, Intel Iris Xe Graphics G7 96EUs i9-13900H | Geekom XT13 Pro (Nvidia GeForce RTX 3060 Ti FE), i9-13900H | Geekom GT13 Pro (Nvidia GeForce RTX 3060 Ti FE), i9-13900H | Geekom XT12 Pro (Nvidia GeForce RTX 3060 Ti FE), i9-12900H | Minisforum UH125 Pro (Nvidia GeForce RTX 3060 Ti FE), Ultra 5 125H | Geekom AE7 (Nvidia GeForce RTX 3060 Ti FE), R9 7940HS | Geekom A8 (Nvidia GeForce RTX 3060 Ti FE), R9 8945HS | Gemiddelde van klas Mini PC | |
|---|---|---|---|---|---|---|---|---|
| SPECviewperf 2020 | 391% | 387% | 321% | 182% | 395% | 516% | 188% | |
| 3840x2160 Medical (medical-03) | 3.63 | 13 258% | 10.8 198% | 11.8 225% | 10.9 200% | 13 258% | 10.8 198% | 7.95 ? 119% |
| 3840x2160 Energy (energy-03) | 3.15 | 20.9 563% | 21 567% | 18.9 500% | 17.8 465% | 20.9 563% | 50.3 1497% | 11.4 ? 262% |
| 3840x2160 Creo (creo-03) | 16 | 74.2 364% | 76.4 378% | 62.7 292% | 26.6 66% | 76.8 380% | 76.6 379% | 30.1 ? 88% |
| 3840x2160 CATIA (catia-06) | 7.9 | 39.4 399% | 40.1 408% | 32.8 315% | 23.6 199% | 39.2 396% | 38.8 391% | 18.3 ? 132% |
| 3840x2160 3ds Max (3dsmax-07) | 10.3 | 47.2 358% | 47.3 359% | 40 288% | 28.7 179% | 46.5 351% | 45.9 346% | 22.1 ? 115% |
| 3840x2160 Siemens NX (snx-04) | 6.13 | 16.5 169% | 16.5 169% | 15.2 148% | 11.4 86% | 16.6 171% | 16.6 171% | 36.3 ? 492% |
| 3840x2160 Maya (maya-06) | 26.8 | 194 624% | 196 631% | 155 478% | 47.5 77% | 199 643% | 195 628% | 56.6 ? 111% |
| lage | gem. | hoge | ultra | QHD | 4K | |
|---|---|---|---|---|---|---|
| GTA V (2015) | 182.2 | 178.4 | 170.3 | 104.2 | 92.7 | 103.4 |
| Dota 2 Reborn (2015) | 165.8 | 138.3 | 132 | 121.9 | 104.6 | |
| Final Fantasy XV Benchmark (2018) | 183.7 | 142.2 | 98.8 | 77.6 | 48.6 | |
| X-Plane 11.11 (2018) | 146.4 | 137.9 | 106.3 | 92.1 | ||
| Baldur's Gate 3 (2023) | 113 | 91.3 | 79 | 78.5 | 61.6 | 37.1 |
| Cyberpunk 2077 2.2 Phantom Liberty (2023) | 88.2 | 81.4 | 71.7 | 64.4 | 44.5 | 22.2 |
| F1 24 (2024) | 76.9 | 73.1 | 60.5 | 42.2 | 36.9 | 19.2 |
Uitstoot - Zwakke koeling en laag stroomverbruik
Geluidsemissies
Zelfs de apparaten met hetzelfde ontwerp waren niet in staat om indruk te maken met topwaarden op het gebied van geluidsemissies. Dit geldt ook voor de Geekom XT13 Pro, tenminste onder belasting. De mini-pc is erg stil in rust en is nauwelijks hoorbaar. De ventilator draait echter altijd, wat betekent dat semi-passieve werking niet mogelijk is. Onder belasting draait de ventilator af en toe flink, en we konden een piekgeluidsdrukniveau van 49,5 dB(A) meten. Het maximale volume is echter niet altijd aanwezig. Tijdens de stresstest schommelde de ventilatorsnelheid steeds weer, zodat de Geekom XT13 Pro onder belasting slechts 38 dB(A) bereikte. We zagen hetzelfde fenomeen bij gemiddelde belasting. Hier schommelt het meetbare volume tussen 38 en 42,2 dB(A)
Helaas is de Geekom XT12 Pro niet een van de stilste apparaten. Het apparaat werkt alleen bijna geruisloos als het stationair draait, er is alleen een stil ventilatorgeluid hoorbaar. Dit verandert onder belasting, want de mini-pc is duidelijk hoorbaar tot 44,2 dB(A). We konden zelfs tot 47,2 dB(A) meten tijdens het gamen. Tijdens het gamen konden we echter geen permanent hoog geluidsdrukniveau waarnemen. Hier schommelde het resultaat tussen 39 en 47,2 dB(A).
Geluidsniveau
| Onbelast |
| 27.6 / 27.8 / 27.9 dB (A) |
| Belasting |
| 42.2 / 49.5 dB (A) |
 | ||
30 dB stil 40 dB(A) hoorbaar 50 dB(A) luid |
||
min: | ||
| Geekom XT13 Pro i9-13900H, Iris Xe G7 96EUs | Aoostar GEM12 R7 8845HS, Radeon 780M | Minisforum AtomMan X7 Ti Ultra 9 185H, Arc 8-Core | Acemagic F2A Ultra 7 155H, Arc 8-Core | Geekom XT12 Pro i9-12900H, Iris Xe G7 96EUs | Geekom A7 R9 7940HS, Radeon 780M | |
|---|---|---|---|---|---|---|
| Noise | 10% | 1% | 2% | 2% | -9% | |
| uit / omgeving * | 25 | 24.3 3% | 24.1 4% | 24.9 -0% | 25.4 -2% | 25.4 -2% |
| Idle Minimum * | 27.6 | 27.5 -0% | 29.8 -8% | 25.4 8% | 28 -1% | 33.3 -21% |
| Idle Average * | 27.8 | 27.6 1% | 29.9 -8% | 25.7 8% | 28.1 -1% | 33.6 -21% |
| Idle Maximum * | 27.9 | 27.6 1% | 30 -8% | 25.7 8% | 28.5 -2% | 33.7 -21% |
| Load Average * | 42.2 | 36 15% | 37.3 12% | 47.8 -13% | 39.6 6% | 43.3 -3% |
| Cyberpunk 2077 ultra * | 46.6 | 35.4 24% | ||||
| Load Maximum * | 49.5 | 38.2 23% | 43.5 12% | 49 1% | 44.2 11% | 43.3 13% |
| Witcher 3 ultra * | 35.4 | 40.2 | 45.23 | 47.2 | 43.2 |
* ... kleiner is beter
Temperatuur
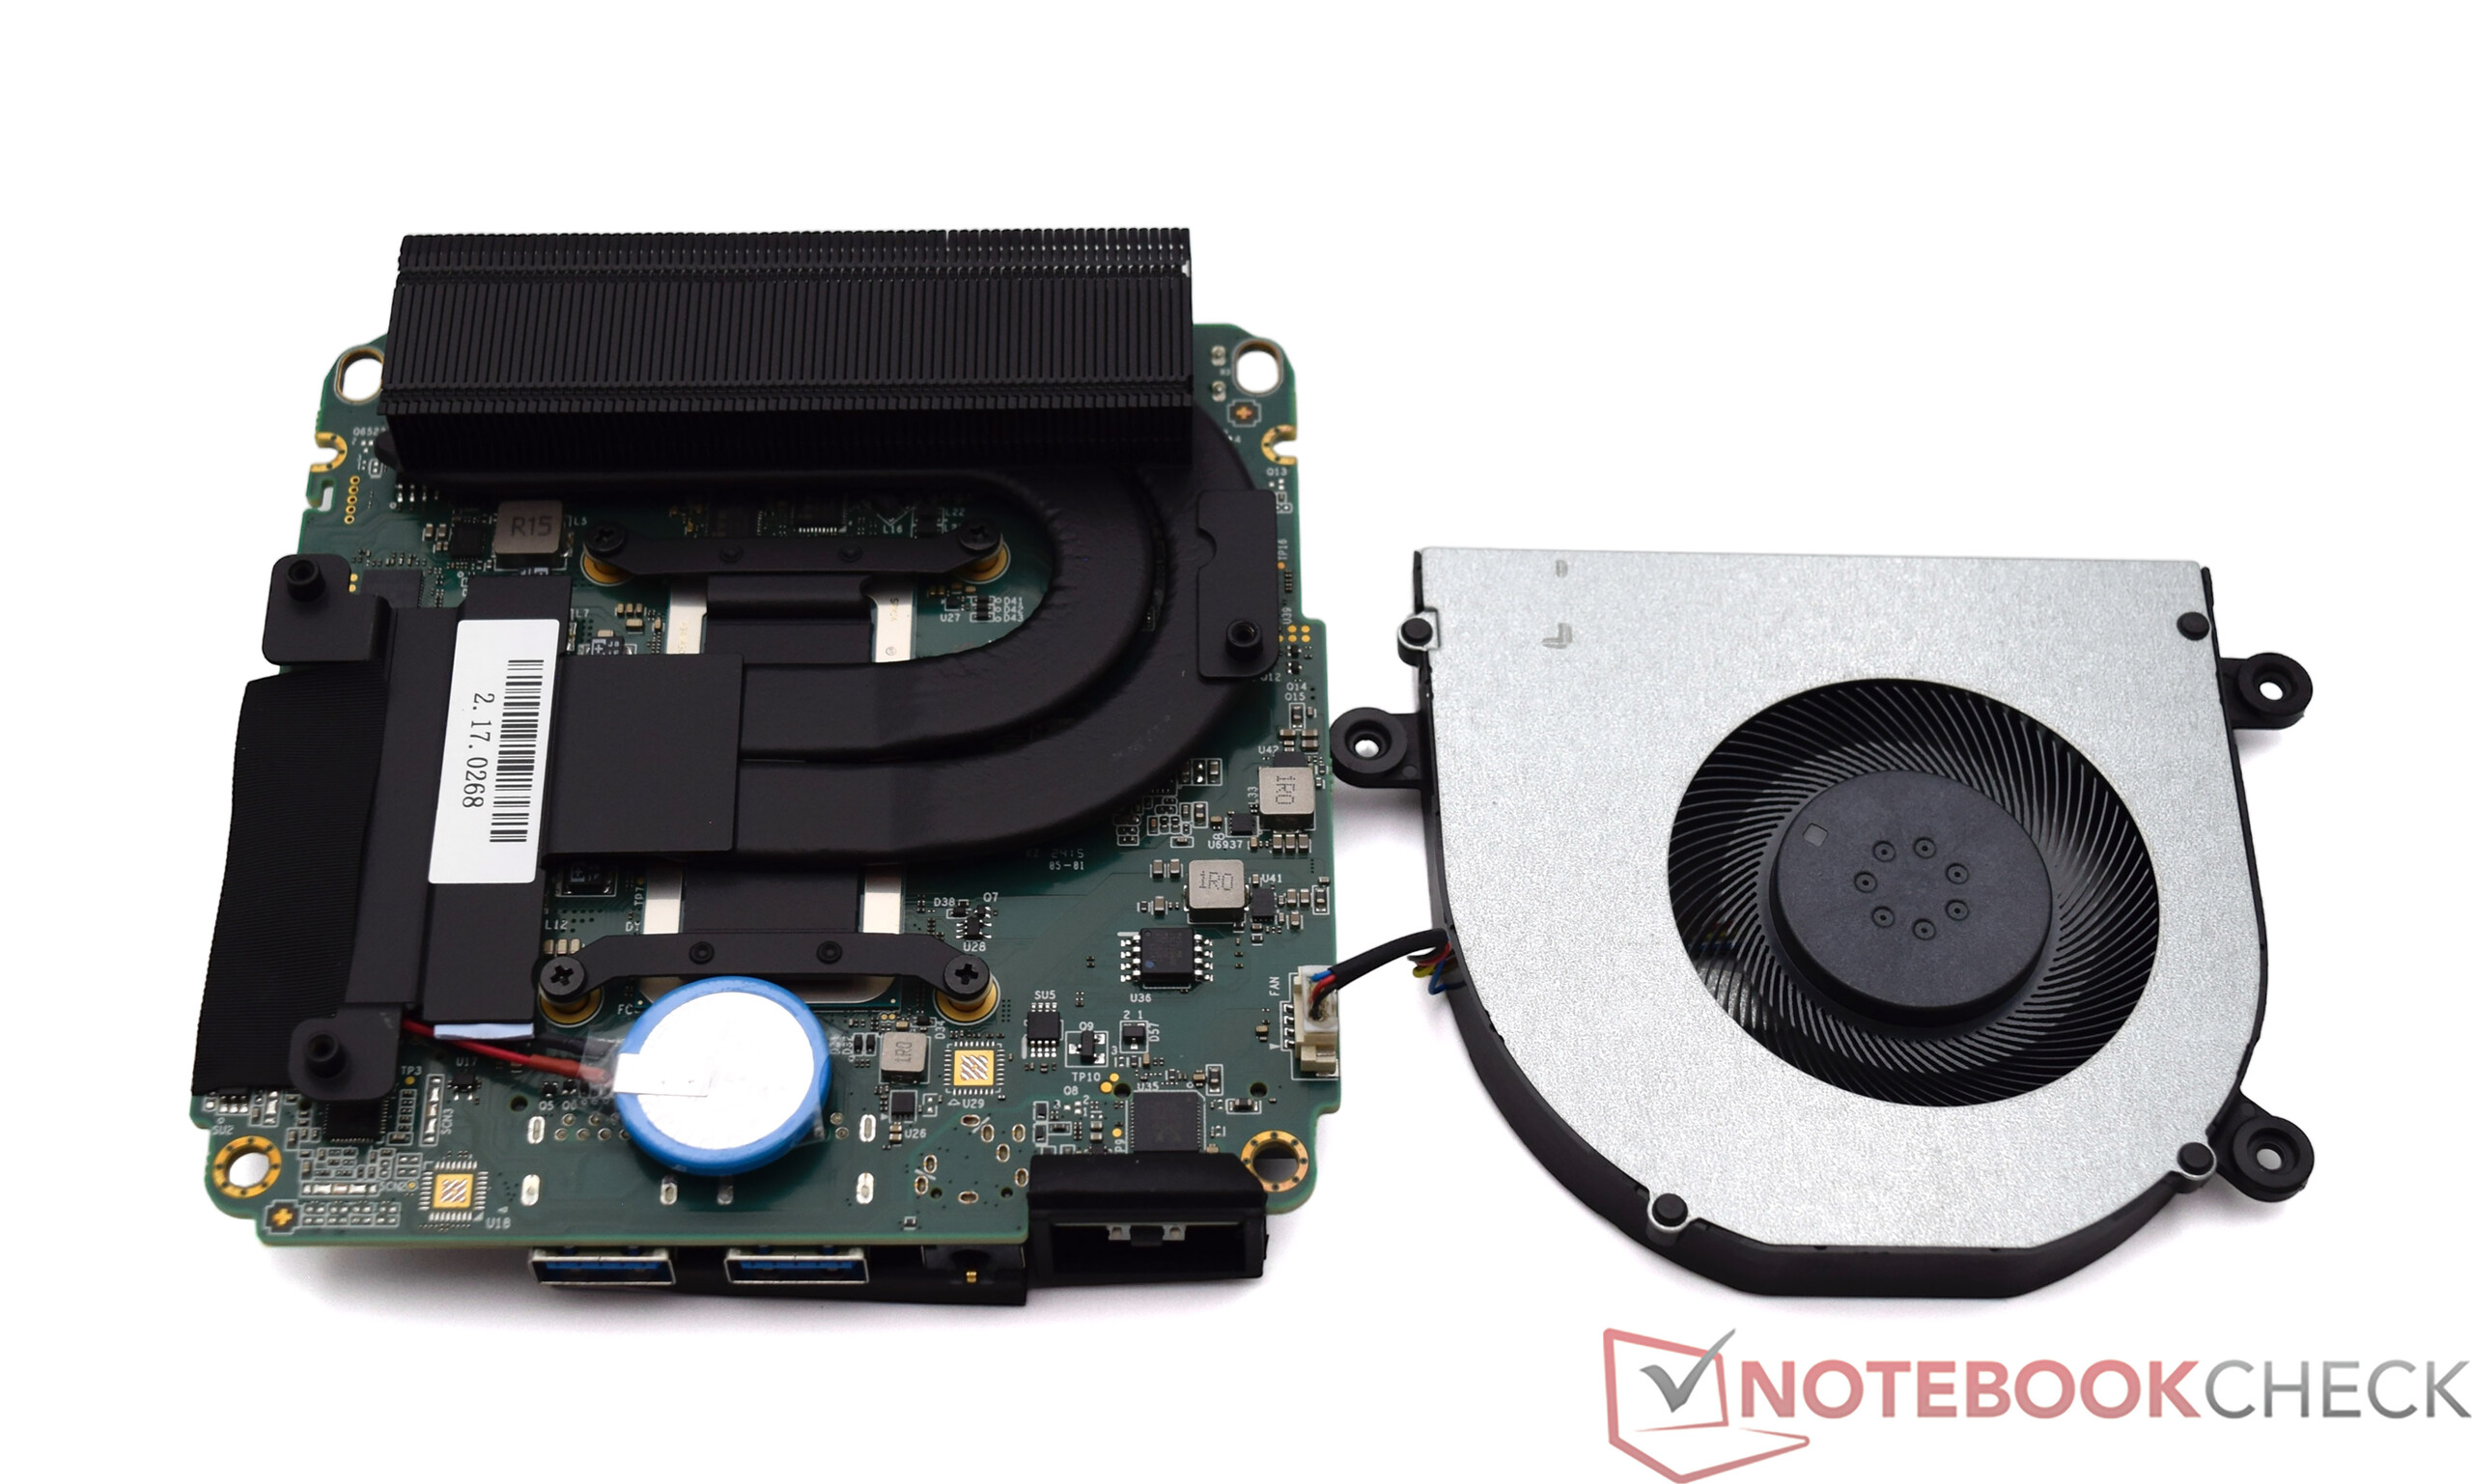
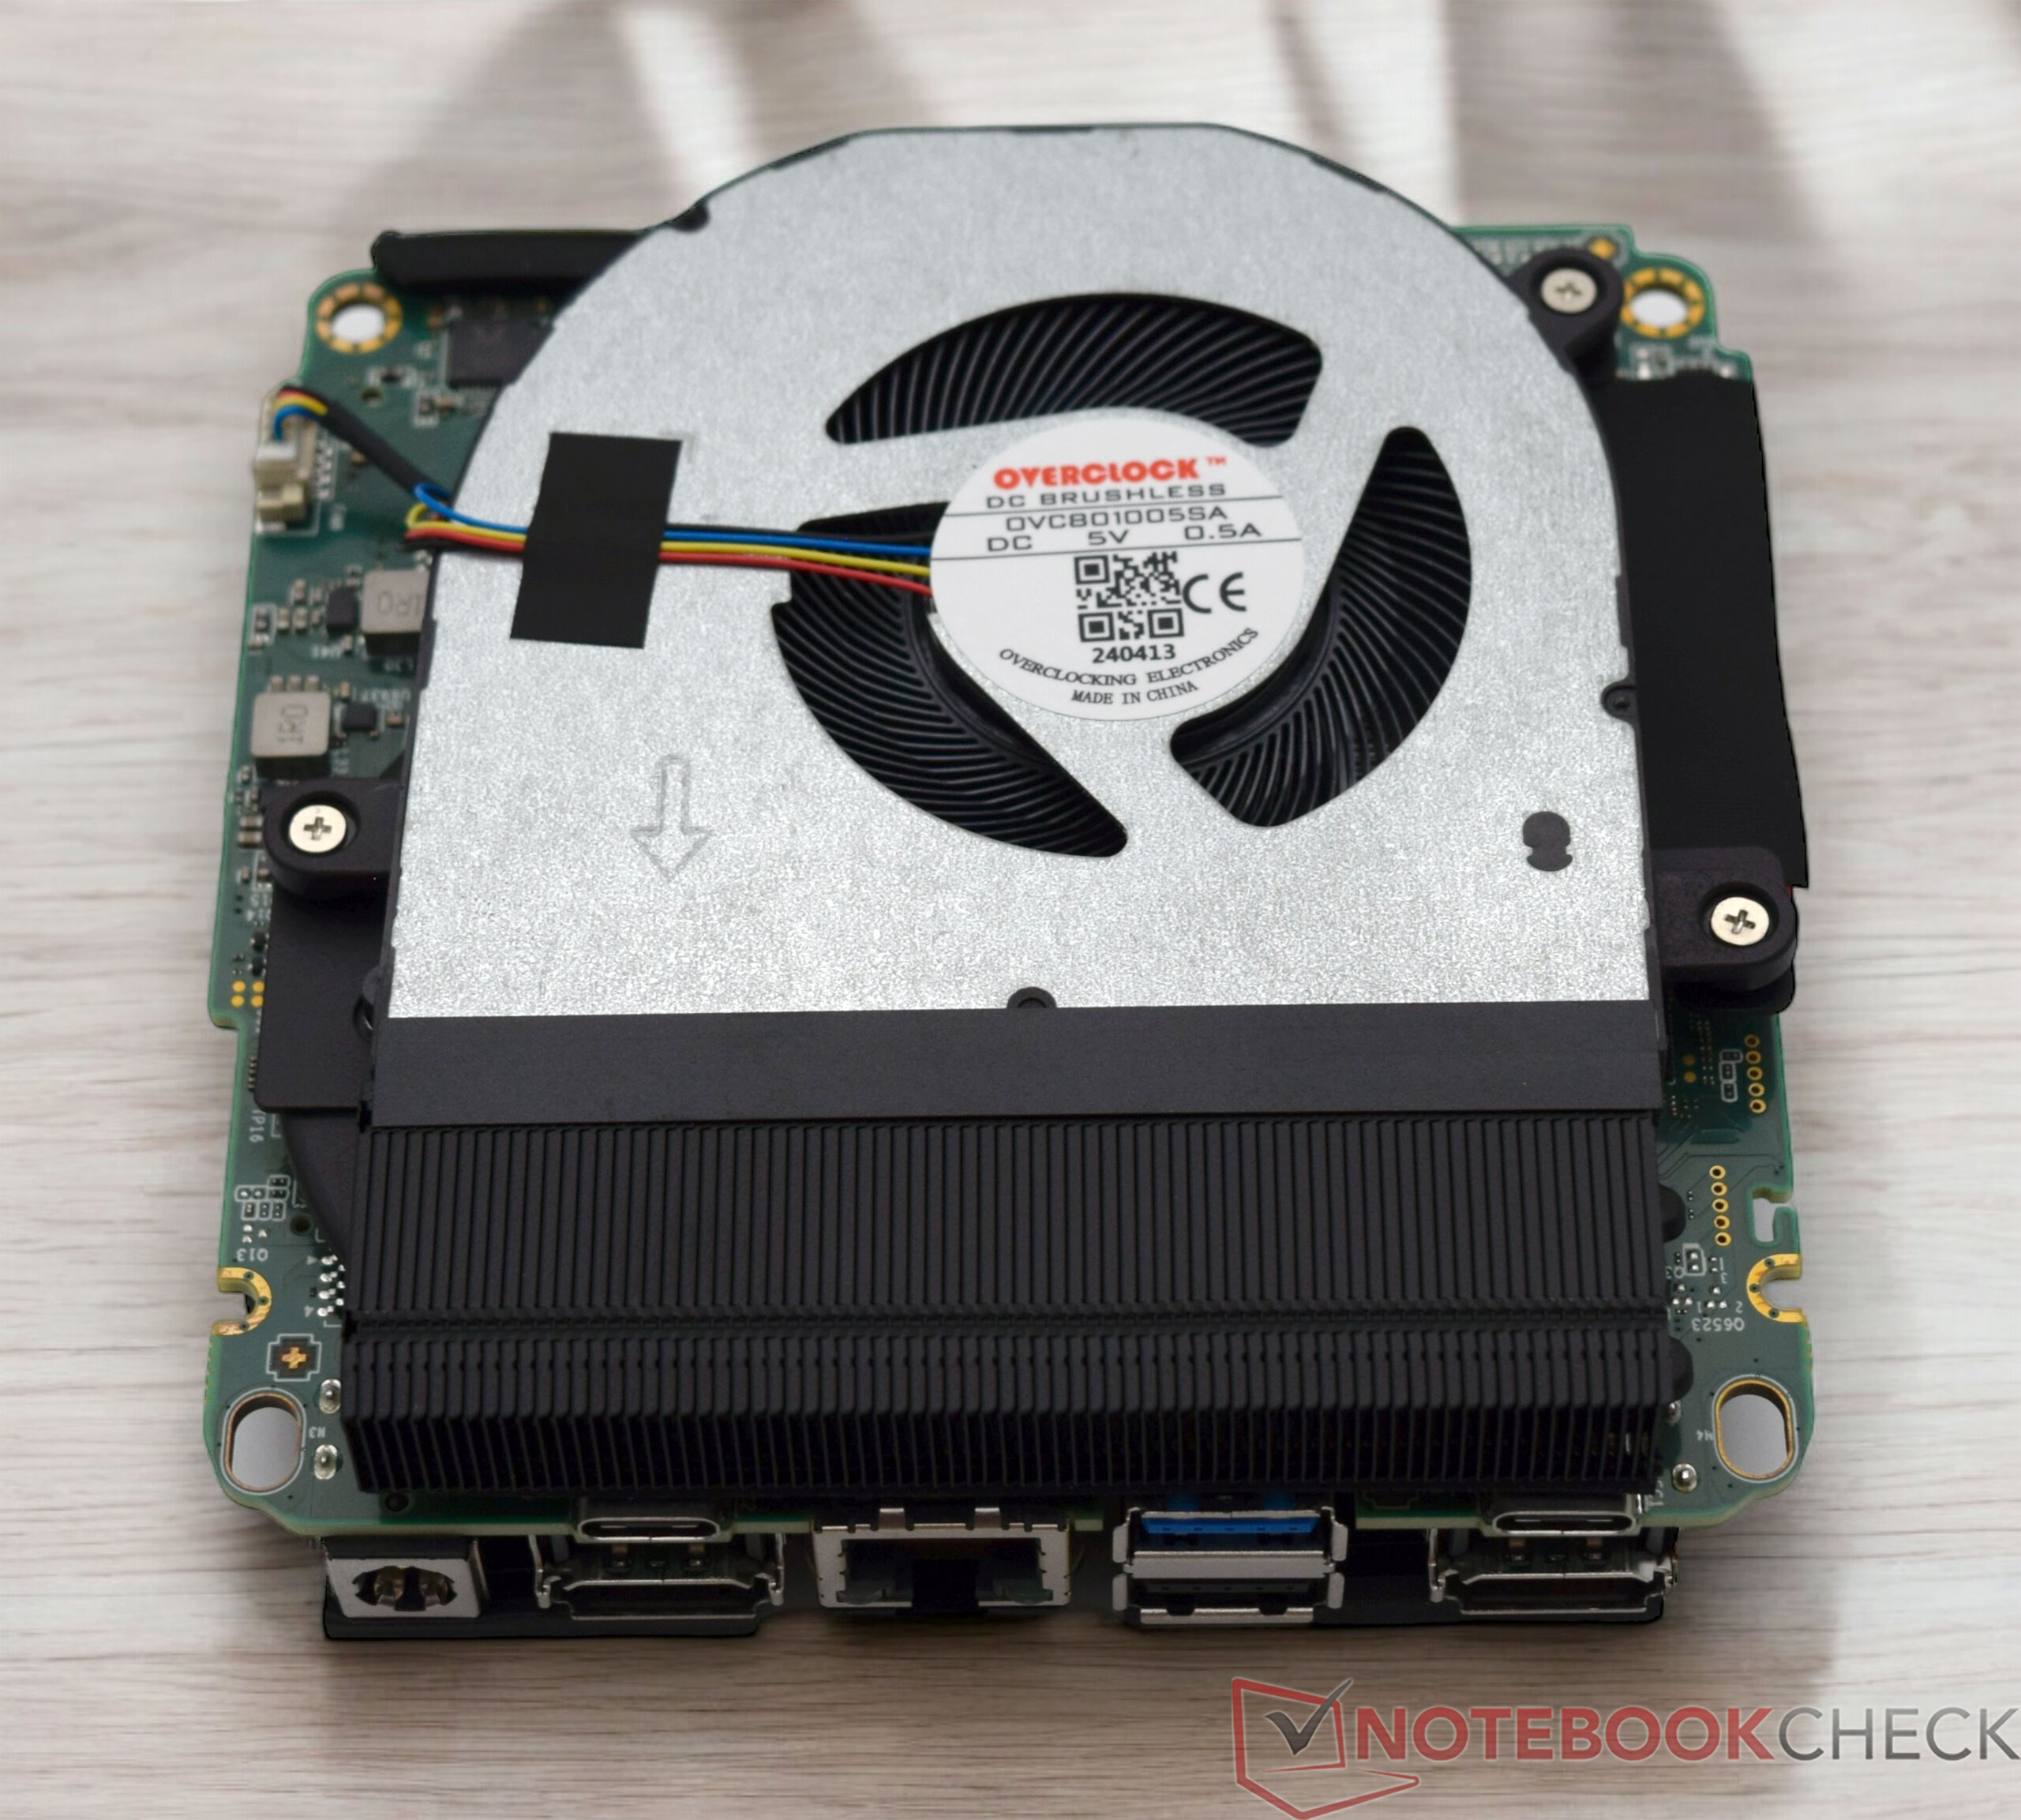
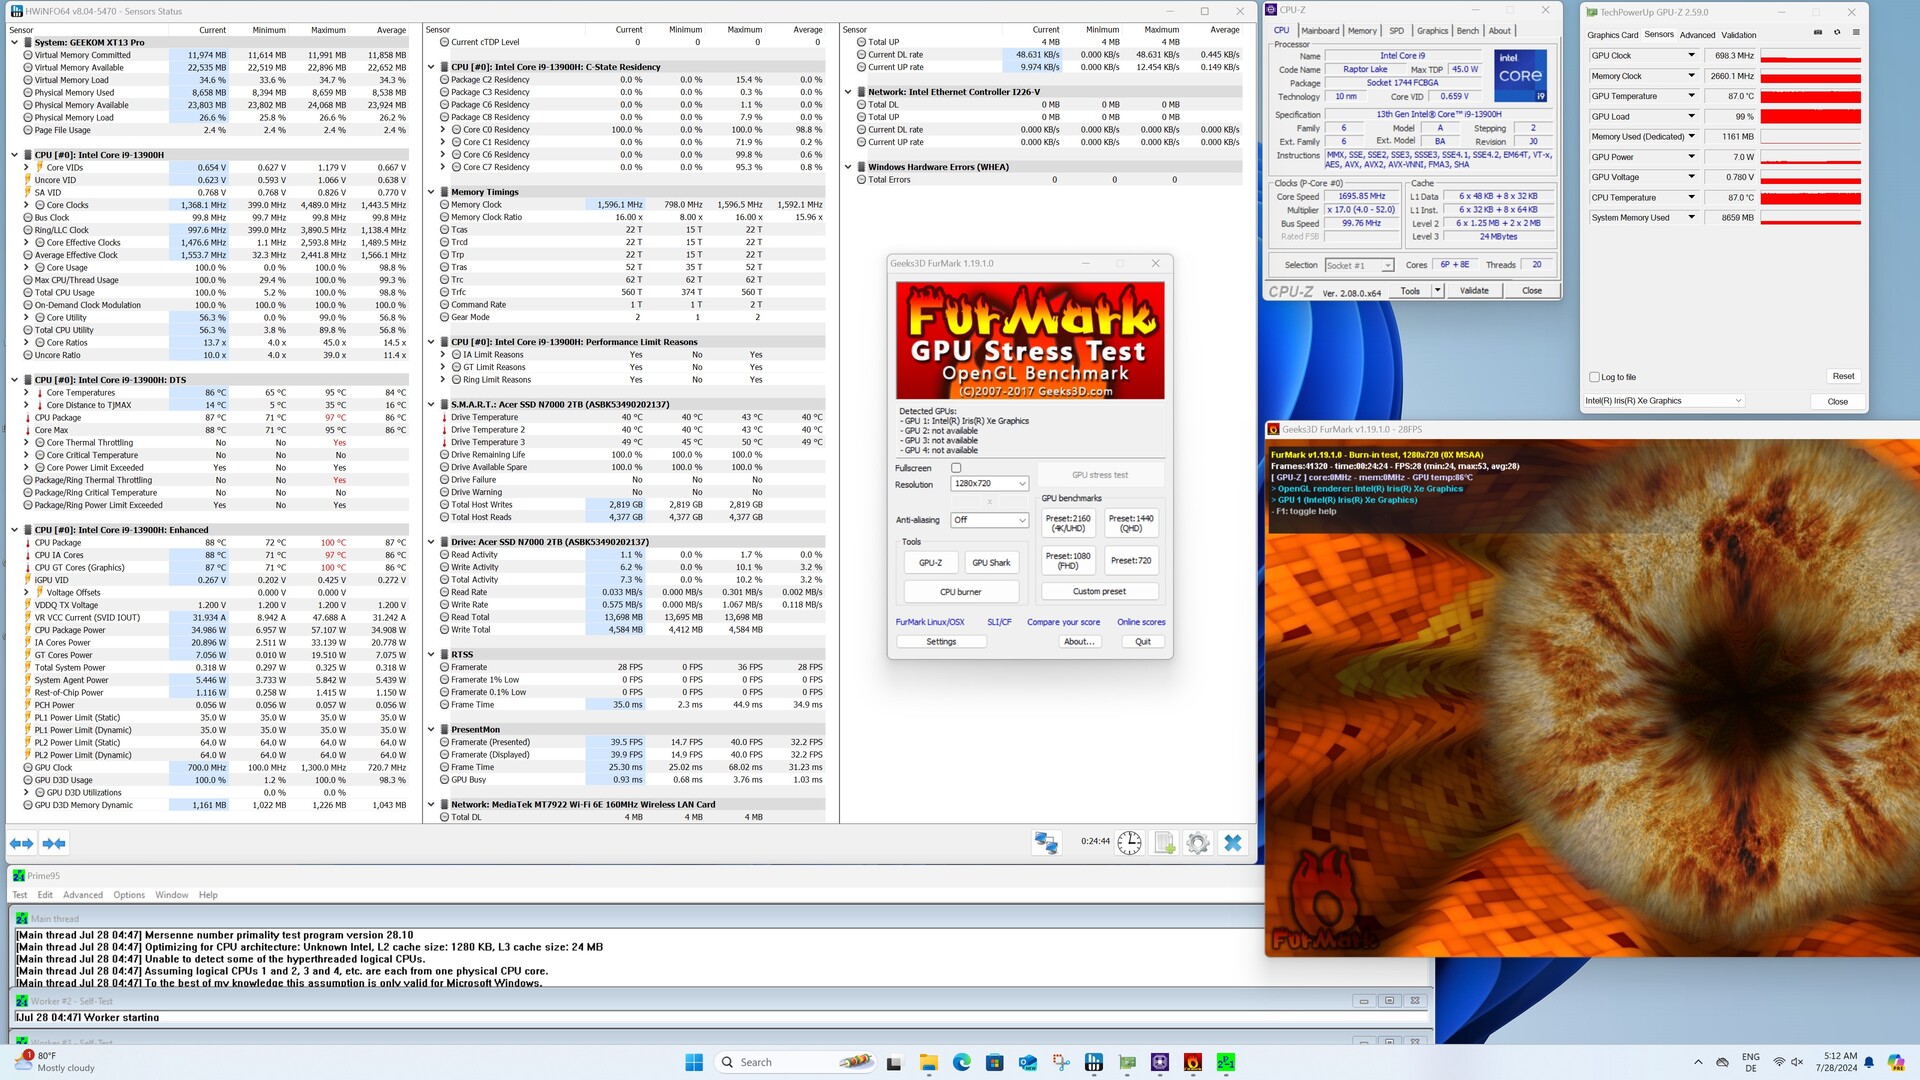
De behuizing warmt merkbaar op onder belasting. We kunnen echter geen kritieke waarden vinden. De SoC ziet er een beetje anders uit, omdat Geekom geen limiet stelt aan de maximale temperatuur, die onder belasting al snel 100 °C bereikt. In tegenstelling tot de Cinebench R15 multi-loop, overschrijdt de Intel Core i9-13900H de limiet van 64 watt niet in de stresstest. De SoC warmt te snel op en de prestaties moeten worden gereduceerd. Over een langere periode stabiliseert de temperatuur zich dan rond de 90 °C, wat geen probleem is voor de processor. Het extreem compacte ontwerp maakt het simpelweg onmogelijk om een krachtiger koelsysteem te installeren.
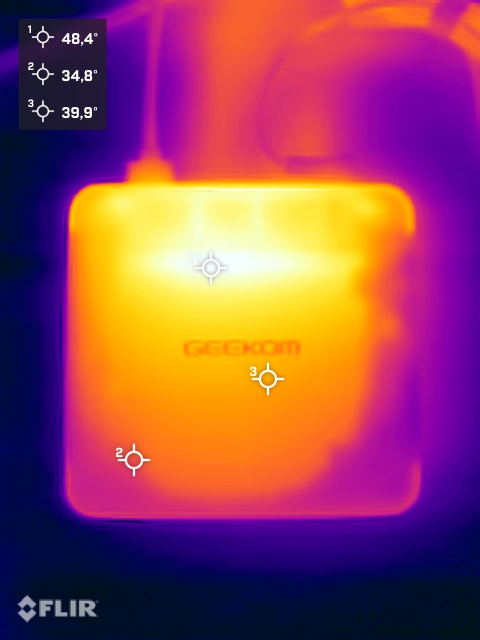
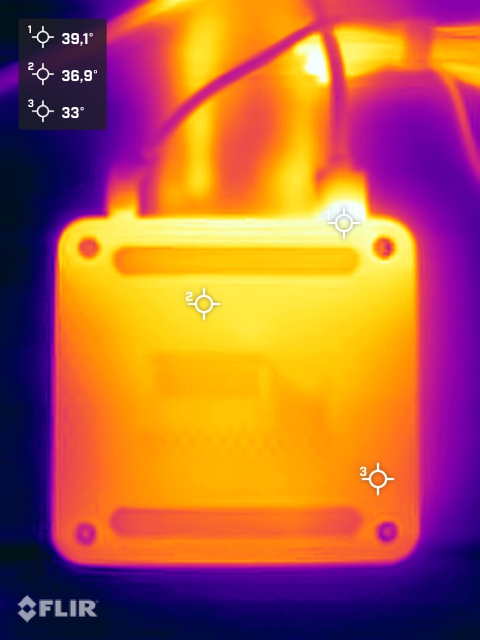
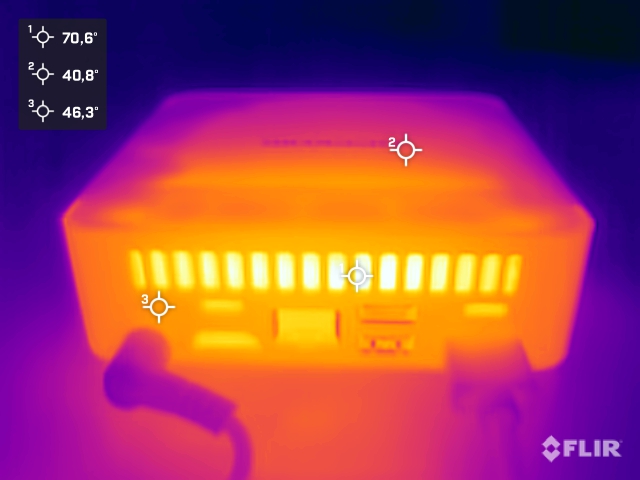
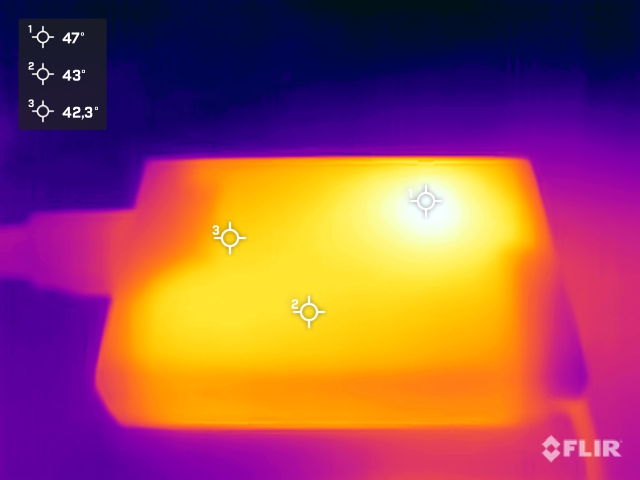
(-) De maximumtemperatuur aan de bovenzijde bedraagt 45.7 °C / 114 F, vergeleken met het gemiddelde van 35.8 °C / 96 F, variërend van 21.6 tot 69.5 °C voor de klasse Mini PC.
(±) De bodem warmt op tot een maximum van 40.3 °C / 105 F, vergeleken met een gemiddelde van 36.1 °C / 97 F
(+) Bij onbelast gebruik bedraagt de gemiddelde temperatuur voor de bovenzijde 27.9 °C / 82 F, vergeleken met het apparaatgemiddelde van 32.3 °C / 90 F.
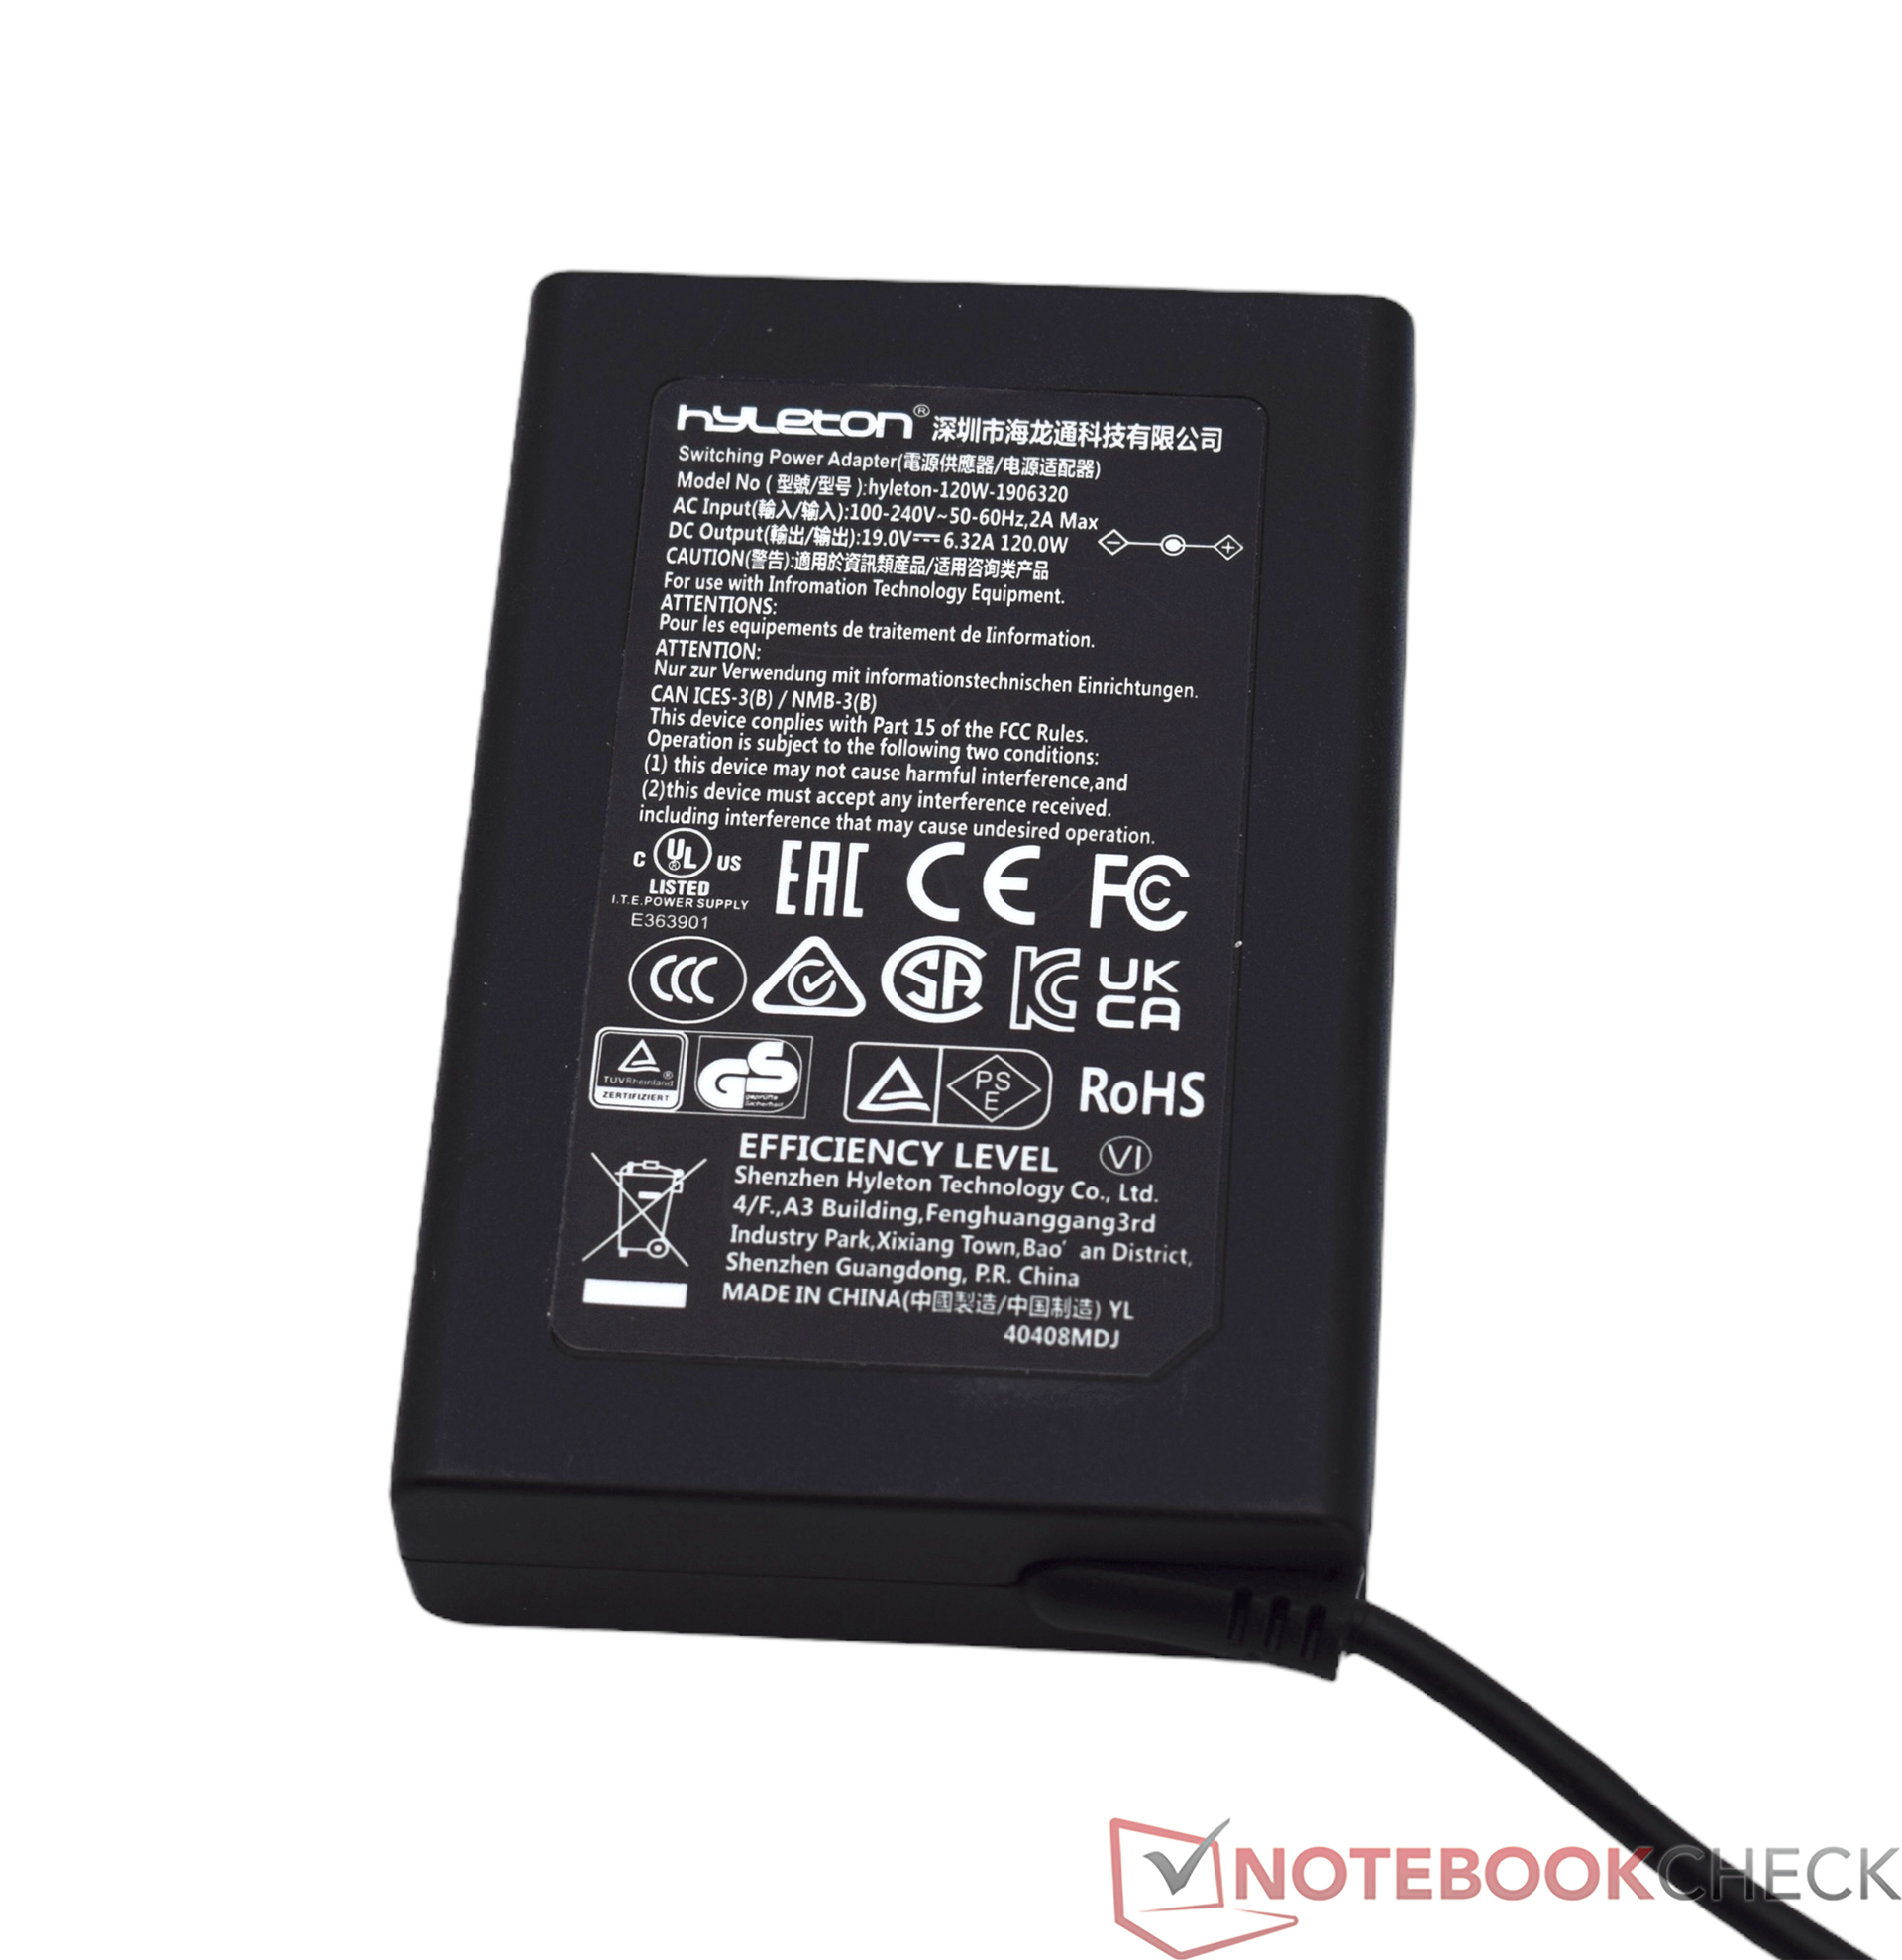
Stroomverbruik
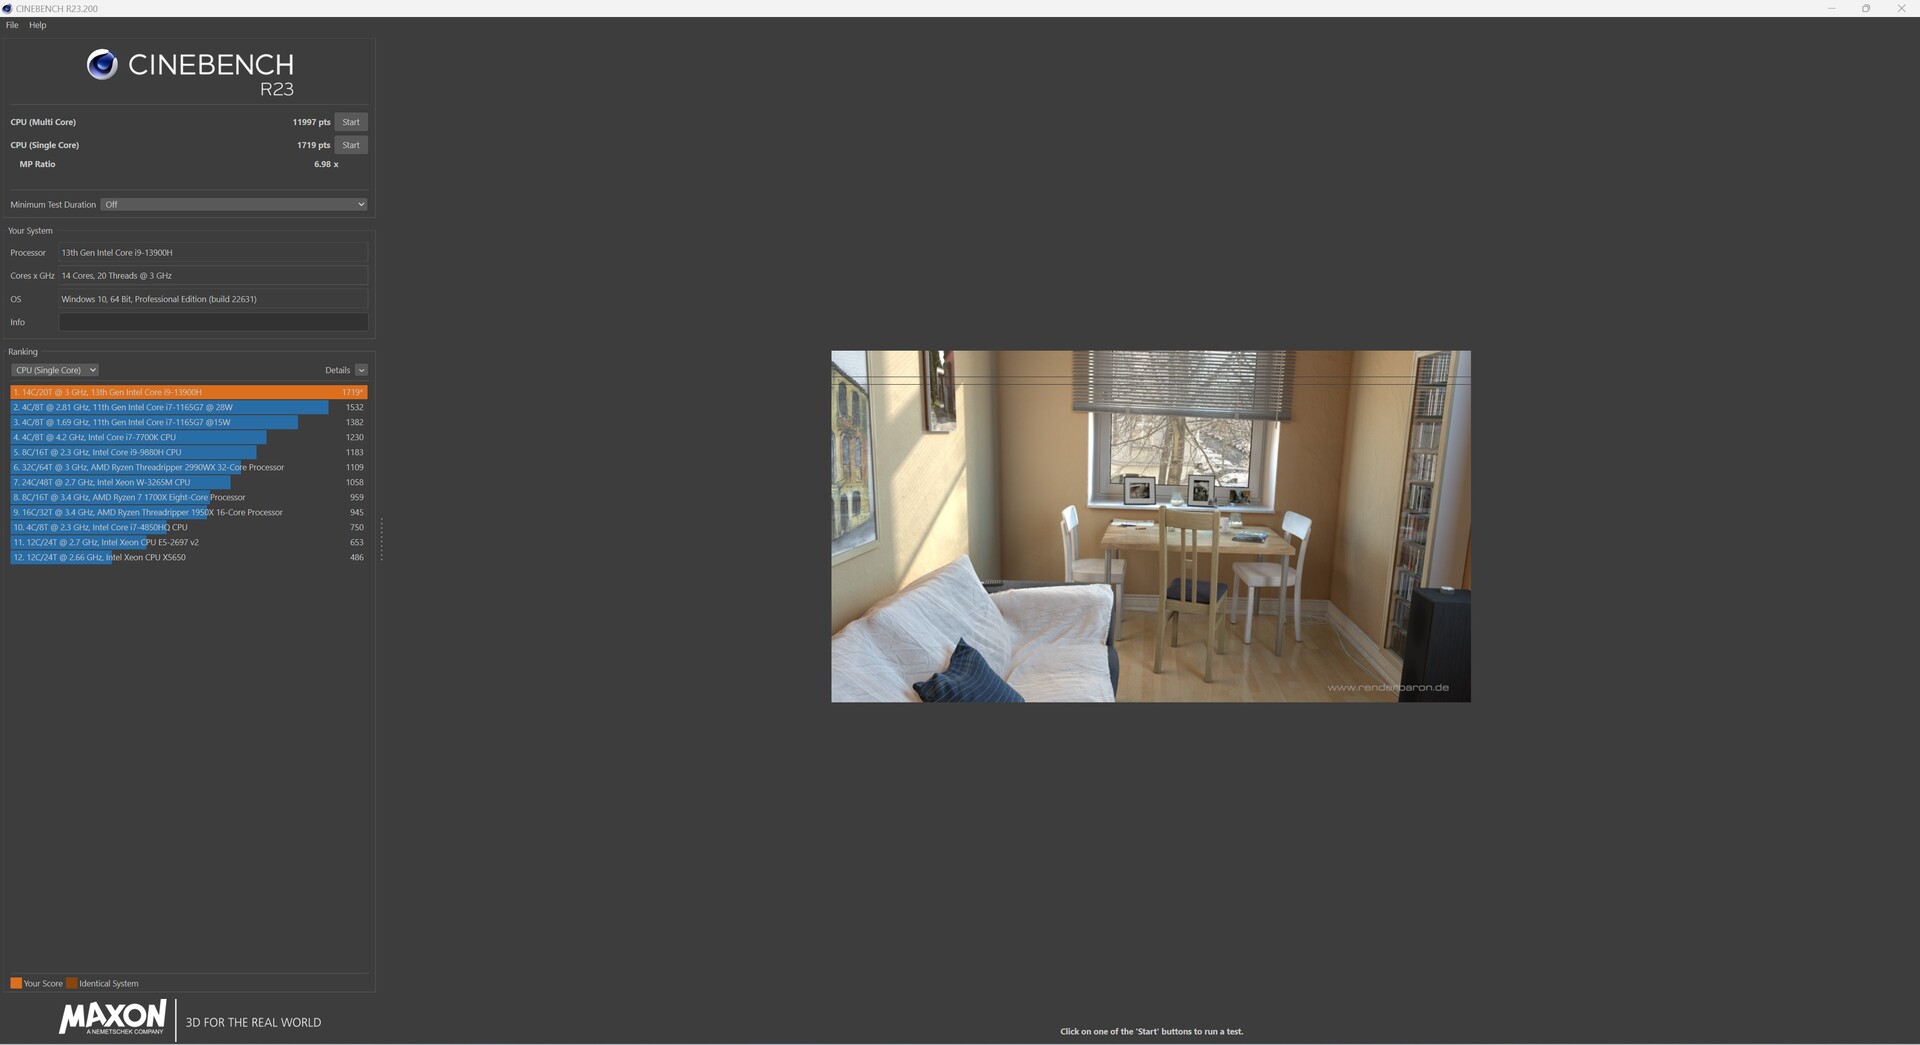
Het stroomverbruik van de Geekom XT13 Pro steekt zeer gunstig af bij zijn concurrenten. We hebben alleen lage waarden gemeten, zelfs in inactieve modus. De lage vermogenslimieten (PL1 en PL2) van de Intel Core i9-13900H zorgen voor een relatief lage energiebehoefte onder belasting. Bij gemiddelde belasting doet het systeem het met iets minder dan 50 watt. Onder belasting zien we de 94,5 watt slechts korte tijd wanneer het systeem nog gebruik kan maken van de Turbo. We konden een ietwat eigenaardig gedrag waarnemen. In de Cinebench R23 Sigle test hebben we veel pieken gedocumenteerd, wat nog nooit bij andere testapparaten is gezien. We hebben de test verschillende keren herhaald - met hetzelfde resultaat. Het is redelijk om aan te nemen dat de SoC in dit geval herhaaldelijk op een temperatuurlimiet werkt, waardoor deze kortstondig meer stroom kan opnemen. De voeding wordt geleverd door een kleine voedingseenheid van 120 watt. Dezelfde voedingseenheid wordt bij veel Geekom-apparaten meegeleverd.
| Uit / Standby | |
| Inactief | |
| Belasting |
|
Key:
min: | |
| Geekom XT13 Pro i9-13900H, Iris Xe G7 96EUs | Aoostar GEM12 R7 8845HS, Radeon 780M | Minisforum AtomMan X7 Ti Ultra 9 185H, Arc 8-Core | Acemagic F2A Ultra 7 155H, Arc 8-Core | Geekom XT12 Pro i9-12900H, Iris Xe G7 96EUs | Geekom A7 R9 7940HS, Radeon 780M | Gemiddeld Intel Iris Xe Graphics G7 96EUs | Gemiddelde van klas Mini PC | |
|---|---|---|---|---|---|---|---|---|
| Power Consumption | -38% | -34% | -35% | -21% | 11% | 2% | -41% | |
| Idle Minimum * | 6.3 | 8.2 -30% | 8.2 -30% | 9.1 -44% | 5.7 10% | 3.8 40% | 5.41 ? 14% | 9.52 ? -51% |
| Idle Average * | 7.1 | 10 -41% | 12.1 -70% | 10.3 -45% | 9.5 -34% | 4.8 32% | 8.6 ? -21% | 11.6 ? -63% |
| Idle Maximum * | 9 | 14.6 -62% | 14 -56% | 14.4 -60% | 16.5 -83% | 6.5 28% | 10.9 ? -21% | 14.9 ? -66% |
| Load Average * | 49.8 | 73.9 -48% | 53.1 -7% | 54.9 -10% | 53.3 -7% | 71.9 -44% | 45.4 ? 9% | 58.8 ? -18% |
| Cyberpunk 2077 ultra external monitor * | 54 | 79.9 -48% | ||||||
| Load Maximum * | 94.5 | 95.3 -1% | 100.4 -6% | 110.4 -17% | 87.8 7% | 94.7 -0% | 67.6 ? 28% | 99.7 ? -6% |
* ... kleiner is beter
Efficiency
| Performance Rating - Percent | |
| Geekom A8 | |
| Minisforum AtomMan X7 Ti | |
| Acemagic F2A | |
| Geekom XT13 Pro | |
| Geekom XT12 Pro | |
| Power Consumption | |
| Cinebench R23 Multi Power Efficiency - external Monitor | |
| Geekom A8 | |
| Minisforum AtomMan X7 Ti | |
| Geekom XT13 Pro | |
| Acemagic F2A | |
| Geekom XT12 Pro | |
| Cinebench R23 Single Power Efficiency - external Monitor | |
| Geekom A8 | |
| Minisforum AtomMan X7 Ti | |
| Acemagic F2A | |
| Geekom XT13 Pro | |
| Geekom XT12 Pro | |
| Cinebench R15 Multi Efficiency (external Monitor) | |
| Geekom A8 | |
| Minisforum AtomMan X7 Ti | |
| Geekom XT13 Pro | |
| Acemagic F2A | |
| Geekom XT12 Pro | |
Power consumption with external monitor
Power consumption with external monitor
Pro
Contra
Verdict - Premium prijs zonder premium prestaties

De Geekom XT13 Pro is een krachtige mini-PC. Dit konden we echter al bevestigen met de Geekom XT12 Pro. Als we deze twee modellen alleen met elkaar vergelijken, kunt u voor het oudere apparaat kiezen zonder merkbaar prestatieverlies. De Intel Core i9-13900H van de Geekom XT13 Pro kan geen merkbare prestatiewinst opleveren. De technische verschillen met de Intel Core i9-12900H zijn te klein. Geekom durft de gewaagde stap van een mini-pc op basis van de Meteor Lake-serie niet aan. Dit betekent dat Geekom achterblijft, aangezien veel andere fabrikanten hun modelseries al hebben uitgerust met de nieuwste processors van Intel. Het grootste nadeel van de Geekom XT13 Pro is de iGPU, die in alle tests onderdoet voor de moderne vertegenwoordigers. Geekom doet hier echter niet alleen onder voor zijn concurrenten, maar ook voor zichzelf. Geekom's eigen portfolio bevat mini-pc's met de nieuwste AMD SoC's, die technisch niet veel slechter zijn, maar een all-round beter resultaat leveren. En dan hebben we het nog niet eens over de prijs gehad. Helaas valt de Geekom XT13 Pro hier volledig buiten de boot. 999 euro staat er momenteel op de rekening als het het topmodel moet worden. Andere mini-pc's kosten iets minder, maar bieden meer prestaties.
De Geekom XT13 Pro levert voldoende prestaties met de Intel Core i9-13900H en maakt indruk met zijn veelzijdige functies. De prijs-prestatieverhouding van de Geekom XT13 Pro komt echter totaal niet overeen.
De goede connectiviteit, waarmee Geekom in het verleden herhaaldelijk punten heeft gescoord, moet positief worden benadrukt. Tot de vele aansluitingen behoren twee USB4-poorten, wat de aankoopbeslissing kan beïnvloeden in termen van toekomstbestendigheid. De drie jaar fabrieksgarantie spreekt ook in het voordeel van een apparaat van Geekom. Deze is natuurlijk ook beschikbaar voor andere apparaten van de fabrikant. De efficiëntie kon alleen iets worden verhoogd in vergelijking met de Geekom XT12 Pro. In deze discipline is de Intel Core i9-13900H duidelijk inferieur aan de modernere Meteor Lake processors. Om deze reden kunnen we de Geekom XT13 Pro geen koopadvies geven, zelfs niet in verhouding tot de hoge aankoopprijs. Als de Geekom XT13 Pro geen schapverwarmer moet worden, moet Geekom dringend zijn huidige prijsstelling herzien.
Opmerking: We hebben ons beoordelingssysteem onlangs bijgewerkt en de resultaten van versie 8 zijn niet vergelijkbaar met de resultaten van versie 7. Meer informatie vindt u hier.
Geekom XT13 Pro
- 30-07-2024 v8
Sebastian Bade
 Total Sustainability Score:
 Transparantie
De selectie van te beoordelen apparaten wordt gemaakt door onze redactie. Het testexemplaar werd door de fabrikant gratis aan de auteur ter beoordeling verstrekt. Er was geen invloed van derden op deze recensie, noch ontving de fabrikant vóór publicatie een exemplaar van deze recensie. Er bestond geen verplichting om deze recensie te publiceren. Wij accepteren nooit een compensatie of betaling in ruil voor onze beoordelingen. Als onafhankelijk mediabedrijf is Notebookcheck niet onderworpen aan het gezag van fabrikanten, detailhandelaren of uitgevers.
[transparency_disclaimer]Dit is hoe Notebookcheck test
Elk jaar beoordeelt Notebookcheck onafhankelijk honderden laptops en smartphones met behulp van gestandaardiseerde procedures om ervoor te zorgen dat alle resultaten vergelijkbaar zijn. We hebben onze testmethoden al zo'n 20 jaar voortdurend ontwikkeld en daarbij de industriestandaard bepaald. In onze testlaboratoria wordt gebruik gemaakt van hoogwaardige meetapparatuur door ervaren technici en redacteuren. Deze tests omvatten een validatieproces in meerdere fasen. Ons complexe beoordelingssysteem is gebaseerd op honderden goed onderbouwde metingen en benchmarks, waardoor de objectiviteit behouden blijft. Meer informatie over onze testmethoden kunt u hier vinden.
Price comparison
