

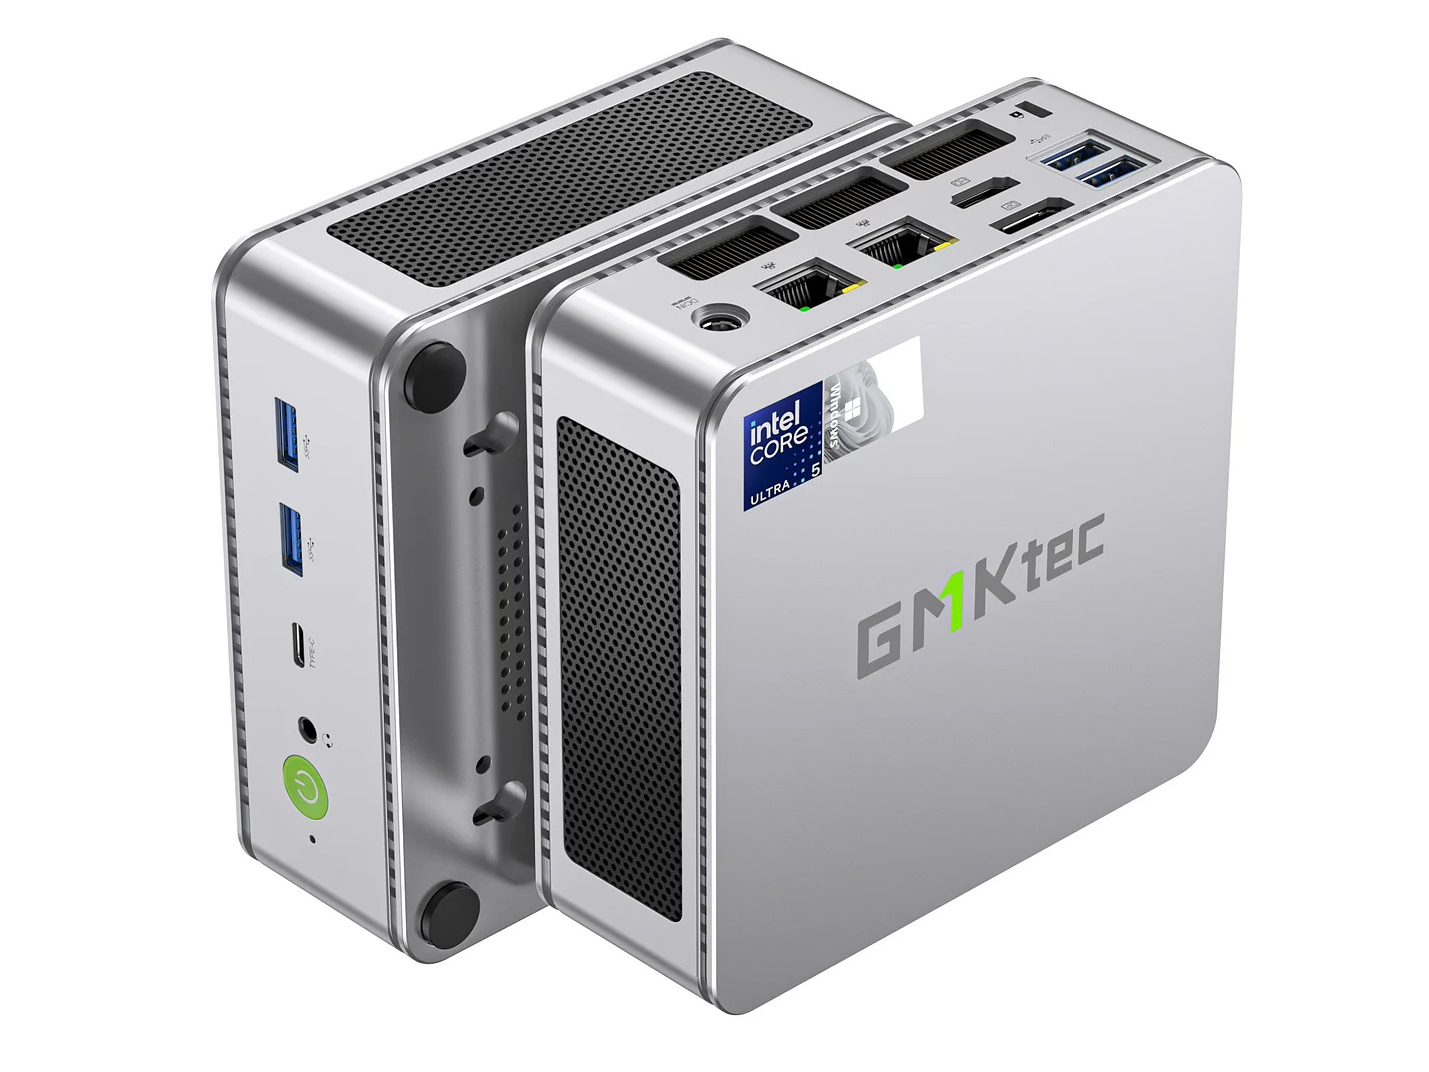
GMK NucBox K9 mini PC review: Core Ultra 5 125H met Arc 7 grafische weergave

Nadat we een paar maanden geleden de GMK NucBox K6 hebben beoordeeld, zijn we nu klaar om de NucBox K9 aan te pakken, compleet met de nieuwere AI-geschikte Meteor Lake-H processor. Afgezien van de CPU-swap van AMD naar Intel blijft het chassis van de twee modellen echter identiek, dus we raden u aan om onze review van de NucBox K6 te bekijken om meer te weten te komen over de fysieke kenmerken van het systeem.
Onze testunit is uitgerust met de Core Ultra 5 125H CPU, 1 TB SSD en 32 GB RAM voor ongeveer $860 of $570 in de uitverkoop. Gebruikers kunnen configureren zonder RAM of SSD voor een kale opstelling, maar de Core Ultra 5 CPU staat vast voor alle opties.
Alternatieven zijn andere krachtige mini-pc's zoals de Beelink SER8, Bosgame M1of Geekom AX8 Pro.
Meer GMKtec beoordelingen:
Potentiële concurrenten in vergelijkings
Evaluatie | Versie | Datum | Model | Gewicht | Hoogte | Formaat | Resolutie | Beste prijs |
|---|---|---|---|---|---|---|---|---|
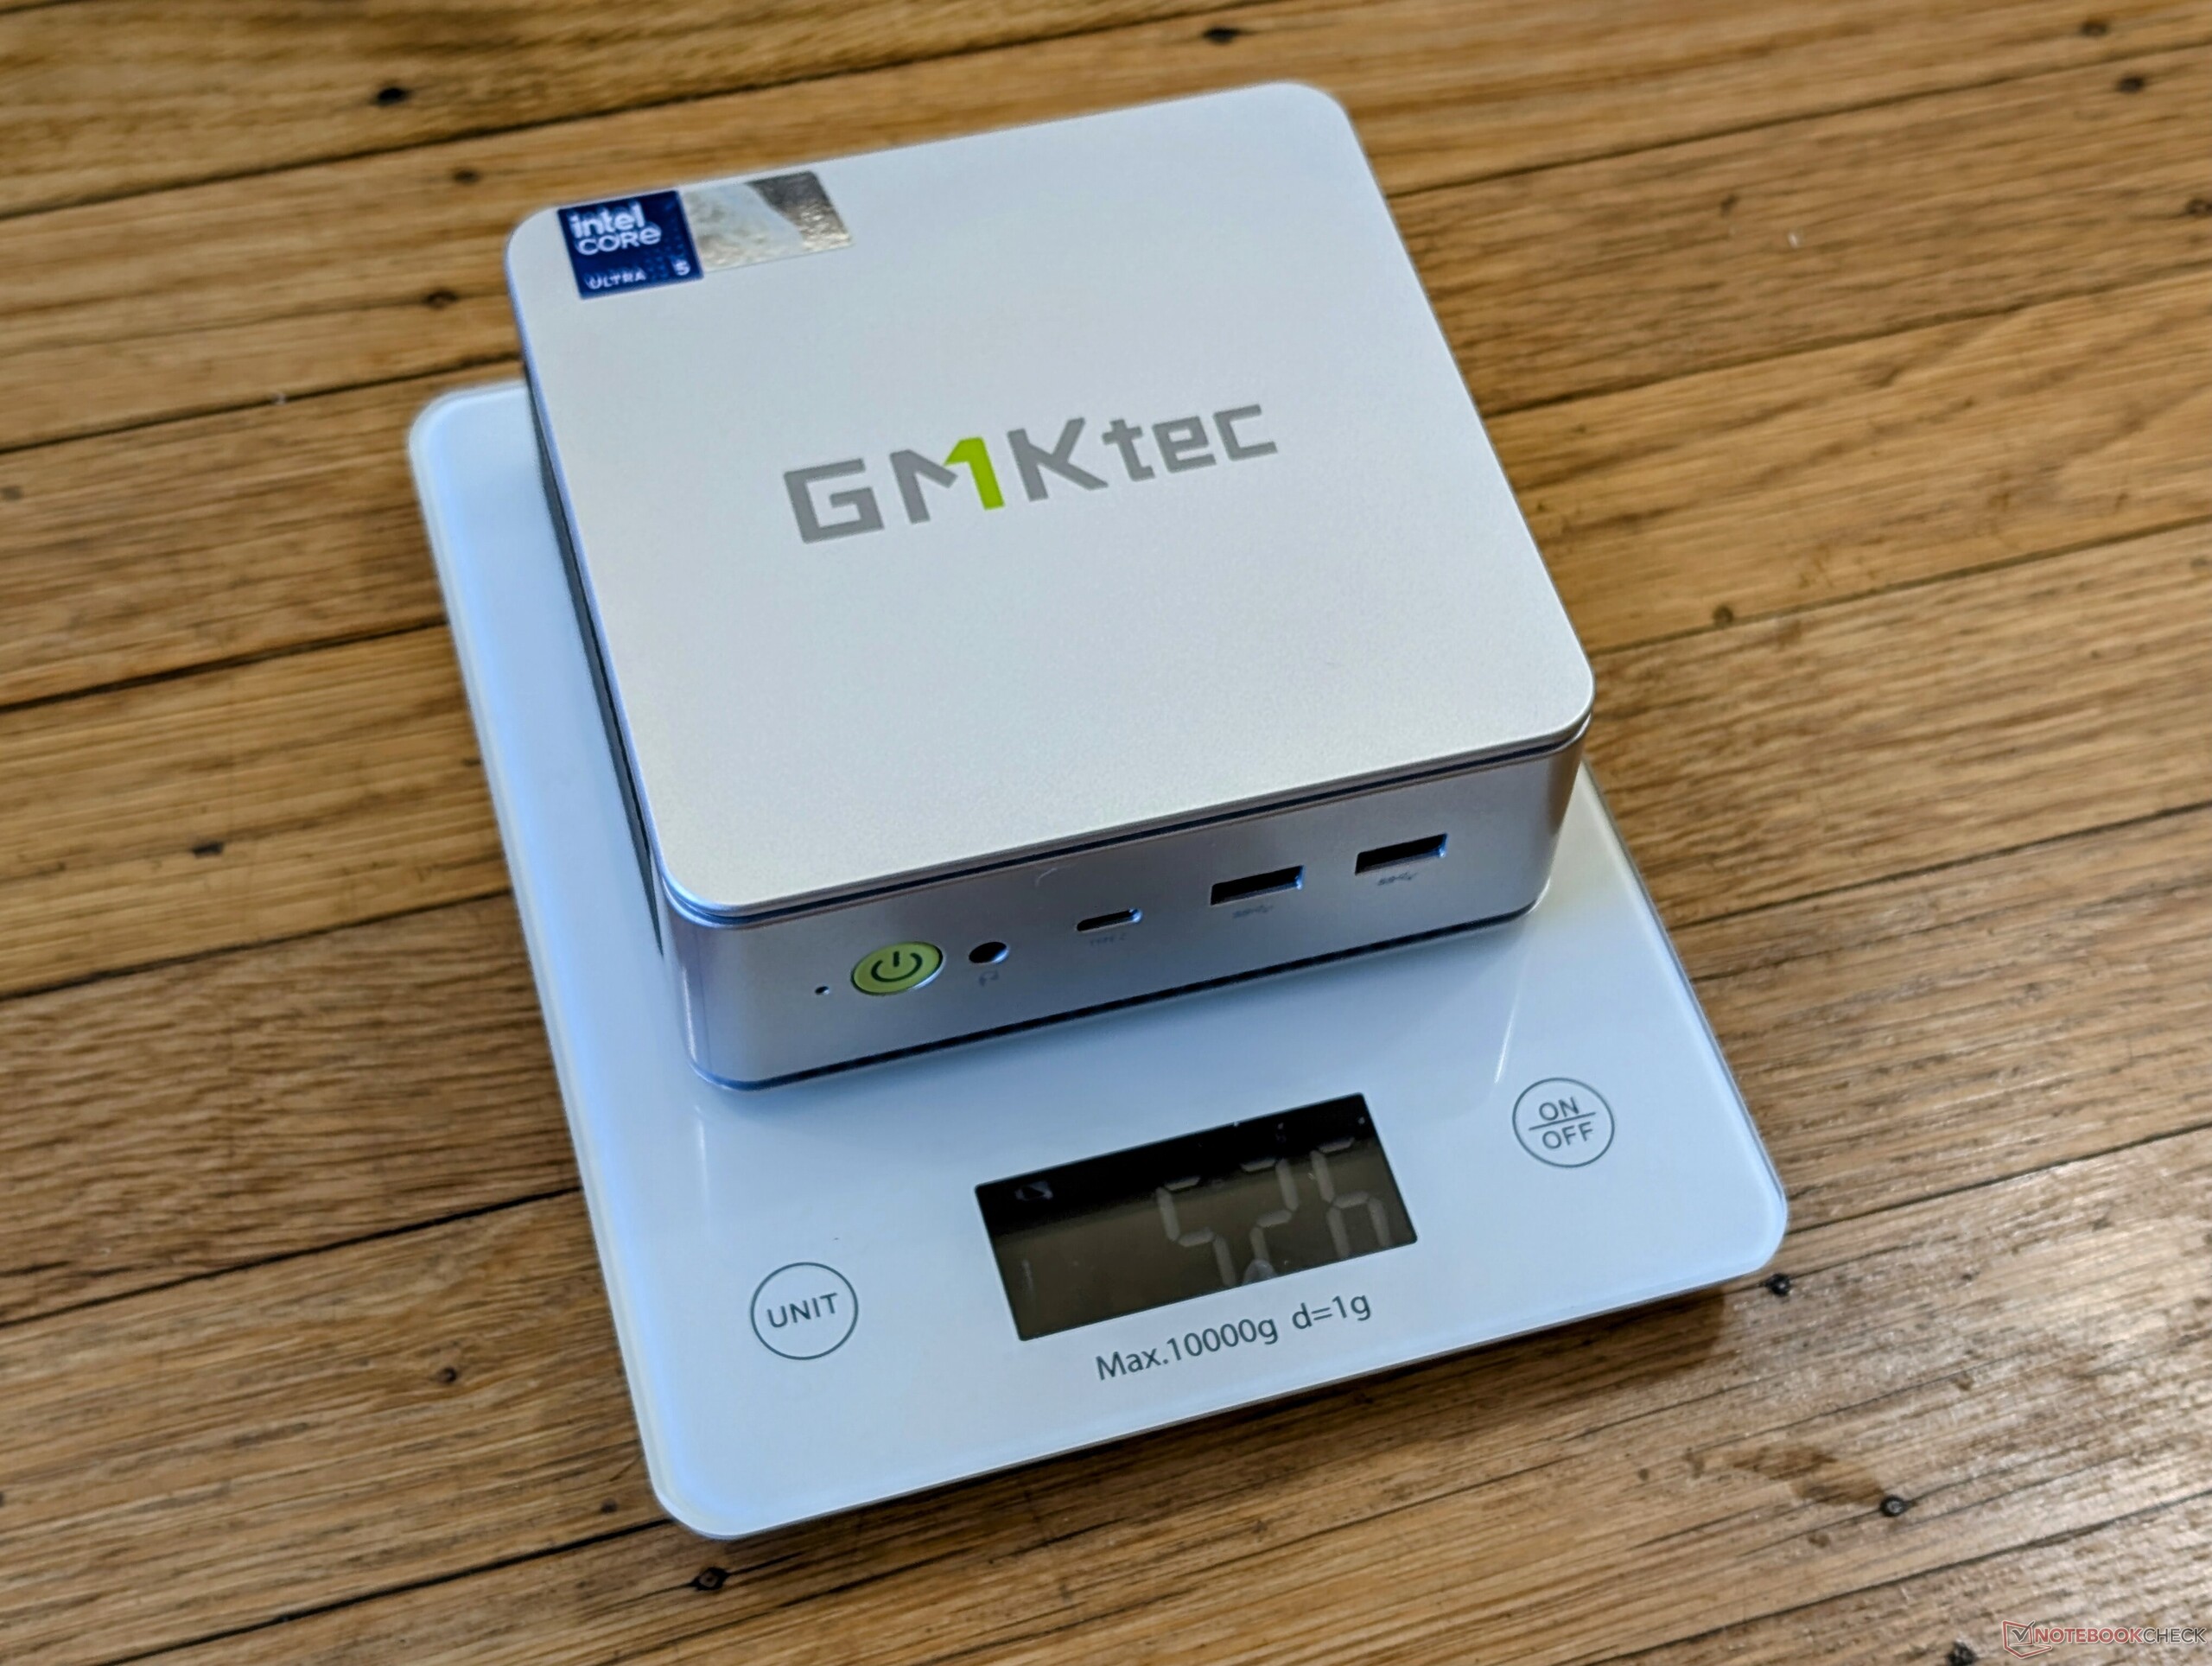
| 67.3 % | v8 | 09-2024 | GMK NucBox K9 Ultra 5 125H, Arc 7-Core | 528 g | 47 mm | x | ||
| 83.6 % v7 (old) | v7 (old) | 04-2024 | GMK NucBox K6 R7 7840HS, Radeon 780M | 514 g | 47 mm | x | ||
| 63.6 % | v8 | 07-2024 | GMK NucBox M6 R5 6600H, Radeon 660M | 526 g | 48 mm | x | ||
| 74.9 % | v8 | 07-2024 | Beelink SER8 R7 8845HS, Radeon 780M | 776 g | 44.7 mm | x | ||
v (old) | 12-2022 | Beelink SEi12 Core i5-1235U i5-1235U, Iris Xe G7 80EUs | 465 g | 42 mm | x | |||
| 84.5 % v7 (old) | v7 (old) | 05-2024 | BOSGAME M1 R7 7840HS, Radeon 780M | 766 g | 51 mm | x |
Opmerking: We hebben ons beoordelingssysteem onlangs bijgewerkt en de resultaten van versie 8 zijn niet vergelijkbaar met de resultaten van versie 7. Meer informatie is beschikbaar hier .
Case - Een andere kleur
Het plastic en metalen chassis blijft identiek aan de door AMD aangedreven NucBox K6, zij het in een matgrijs/zilveren kleur.
Connectiviteit - Snellere USB-poorten
De poortopties en positionering zijn niet veranderd ten opzichte van de NucBox K6, maar de USB-poorten hebben wel een upgrade gekregen. Alle USB-A poorten zijn nu USB4 in plaats van 2.0 of 3.2. Ondertussen ondersteunt de USB-C poort officieel Thunderbolt 4.
USB-C lichtnetadapters van derden kunnen het systeem van stroom voorzien in plaats van de lichtnetadapter als deze voldoende stroom kan leveren. Prestaties en compatibiliteit met alle USB-C adapters zijn echter niet gegarandeerd.
Communicatie
Een Intel AX201 is standaard in plaats van de MediaTek RZ616 voor Wi-Fi 6 en Bluetooth 5.2 connectiviteit. Wi-Fi 6E en Wi-Fi 7 zijn niet inbegrepen om kosten te besparen.
| Networking | |
| iperf3 transmit AXE11000 | |
| GMK NucBox M6 | |
| Beelink SEi12 Core i5-1235U | |
| BOSGAME M1 | |
| GMK NucBox K9 | |
| Beelink SER8 | |
| GMK NucBox K6 | |
| iperf3 receive AXE11000 | |
| BOSGAME M1 | |
| GMK NucBox M6 | |
| Beelink SEi12 Core i5-1235U | |
| GMK NucBox K6 | |
| Beelink SER8 | |
| GMK NucBox K9 | |
| iperf3 transmit AXE11000 6GHz | |
| BOSGAME M1 | |
| GMK NucBox K6 | |
| GMK NucBox M6 | |
| iperf3 receive AXE11000 6GHz | |
| BOSGAME M1 | |
| GMK NucBox K6 | |
| GMK NucBox M6 | |
Onderhoud
De upgradebare componenten zijn identiek aan de NucBox K6.
Duurzaamheid
De fabrikant maakt reclame voor een "duurzaam geproduceerd" systeem zonder in detail te treden over wat dat inhoudt. De verpakking zelf is meestal van karton met een beetje plastic.
Accessoires en garantie
De verkoopverpakking bevat een VESA-montagebeugel en HDMI-kabel naast de gebruikelijke papieren en AC-adapter. Bij aankoop in de VS geldt een fabrieksgarantie van een jaar.
Prestaties - Meteor Lake Standard
Testomstandigheden
We hebben Windows in de modus Prestaties gezet voordat we de onderstaande benchmarks uitvoerden.
Processor
De CPU-prestaties zijn waar we ze verwachten ten opzichte van andere pc's in onze database met dezelfde Core Ultra 5 125H processor. De Meteor Lake CPU is nek-aan-nek met de laatste generatie Core i9-13900H wat op papier geweldig klinkt, totdat u zich herinnert dat de door AMD aangedreven NucBox K6 met de oudere Ryzen 7 7840HS zelfs sneller is dan beide Intel-oplossingen. Het ontbreken van een Core Ultra 7 optie is dus vreemd, aangezien de NucBox K9 de nieuwere box is.
Hoewel er een geïntegreerde AI aanwezig is, is deze niet compatibel met Co-Pilot+.
Cinebench R15 Multi Loop
Cinebench R23: Multi Core | Single Core
Cinebench R20: CPU (Multi Core) | CPU (Single Core)
Cinebench R15: CPU Multi 64Bit | CPU Single 64Bit
Blender: v2.79 BMW27 CPU
7-Zip 18.03: 7z b 4 | 7z b 4 -mmt1
Geekbench 6.4: Multi-Core | Single-Core
Geekbench 5.5: Multi-Core | Single-Core
HWBOT x265 Benchmark v2.2: 4k Preset
LibreOffice : 20 Documents To PDF
R Benchmark 2.5: Overall mean
* ... kleiner is beter
AIDA64: FP32 Ray-Trace | FPU Julia | CPU SHA3 | CPU Queen | FPU SinJulia | FPU Mandel | CPU AES | CPU ZLib | FP64 Ray-Trace | CPU PhotoWorxx
| Performance Rating | |
| Beelink SER8 | |
| BOSGAME M1 | |
| GMK NucBox K6 | |
| GMK NucBox M6 | |
| GMK NucBox K9 | |
| Gemiddeld Intel Core Ultra 5 125H | |
| Beelink SEi12 Core i5-1235U | |
| AIDA64 / FP32 Ray-Trace | |
| Beelink SER8 | |
| BOSGAME M1 | |
| GMK NucBox K6 | |
| GMK NucBox M6 | |
| Gemiddeld Intel Core Ultra 5 125H (8430 - 13639, n=6) | |
| GMK NucBox K9 | |
| Beelink SEi12 Core i5-1235U | |
| AIDA64 / FPU Julia | |
| Beelink SER8 | |
| BOSGAME M1 | |
| GMK NucBox K6 | |
| GMK NucBox M6 | |
| GMK NucBox K9 | |
| Gemiddeld Intel Core Ultra 5 125H (43652 - 70880, n=6) | |
| Beelink SEi12 Core i5-1235U | |
| AIDA64 / CPU SHA3 | |
| Beelink SER8 | |
| BOSGAME M1 | |
| GMK NucBox K6 | |
| GMK NucBox K9 | |
| Gemiddeld Intel Core Ultra 5 125H (2047 - 3404, n=6) | |
| GMK NucBox M6 | |
| Beelink SEi12 Core i5-1235U | |
| AIDA64 / CPU Queen | |
| BOSGAME M1 | |
| Beelink SER8 | |
| GMK NucBox K6 | |
| GMK NucBox M6 | |
| Gemiddeld Intel Core Ultra 5 125H (77892 - 79986, n=6) | |
| GMK NucBox K9 | |
| Beelink SEi12 Core i5-1235U | |
| AIDA64 / FPU SinJulia | |
| Beelink SER8 | |
| BOSGAME M1 | |
| GMK NucBox K6 | |
| GMK NucBox M6 | |
| GMK NucBox K9 | |
| Gemiddeld Intel Core Ultra 5 125H (6588 - 7851, n=6) | |
| Beelink SEi12 Core i5-1235U | |
| AIDA64 / FPU Mandel | |
| Beelink SER8 | |
| BOSGAME M1 | |
| GMK NucBox K6 | |
| GMK NucBox M6 | |
| GMK NucBox K9 | |
| Gemiddeld Intel Core Ultra 5 125H (21210 - 35321, n=6) | |
| Beelink SEi12 Core i5-1235U | |
| AIDA64 / CPU AES | |
| Beelink SER8 | |
| BOSGAME M1 | |
| GMK NucBox K6 | |
| GMK NucBox K9 | |
| GMK NucBox M6 | |
| Beelink SEi12 Core i5-1235U | |
| Gemiddeld Intel Core Ultra 5 125H (45524 - 108402, n=6) | |
| AIDA64 / CPU ZLib | |
| Beelink SER8 | |
| BOSGAME M1 | |
| GMK NucBox K6 | |
| GMK NucBox K9 | |
| Gemiddeld Intel Core Ultra 5 125H (594 - 994, n=6) | |
| GMK NucBox M6 | |
| Beelink SEi12 Core i5-1235U | |
| AIDA64 / FP64 Ray-Trace | |
| Beelink SER8 | |
| BOSGAME M1 | |
| GMK NucBox K6 | |
| GMK NucBox M6 | |
| Gemiddeld Intel Core Ultra 5 125H (4345 - 7221, n=6) | |
| GMK NucBox K9 | |
| Beelink SEi12 Core i5-1235U | |
| AIDA64 / CPU PhotoWorxx | |
| Gemiddeld Intel Core Ultra 5 125H (45724 - 49844, n=6) | |
| GMK NucBox K9 | |
| BOSGAME M1 | |
| GMK NucBox K6 | |
| Beelink SER8 | |
| GMK NucBox M6 | |
| Beelink SEi12 Core i5-1235U | |
Stresstest
Bij het starten van de Prime95-stress verhoogde de CPU naar 2,3 GHz en 45 W en hield deze waarden vast tijdens de gehele duur van de stresstest. De kerntemperatuur bleef steken op 80 C, wat iets koeler is dan wat we registreerden op de snellere AMD-aangedreven NucBox K6.
Bij het uitvoeren van Cyberpunk 2077 om gamingstress weer te geven, stabiliseerde de kerntemperatuur op 72 C, wat vergelijkbaar is met de NucBox K6, hoewel de NucBox K9 games langzamer uitvoert, zoals onze sectie Gamingprestaties hieronder zal laten zien.

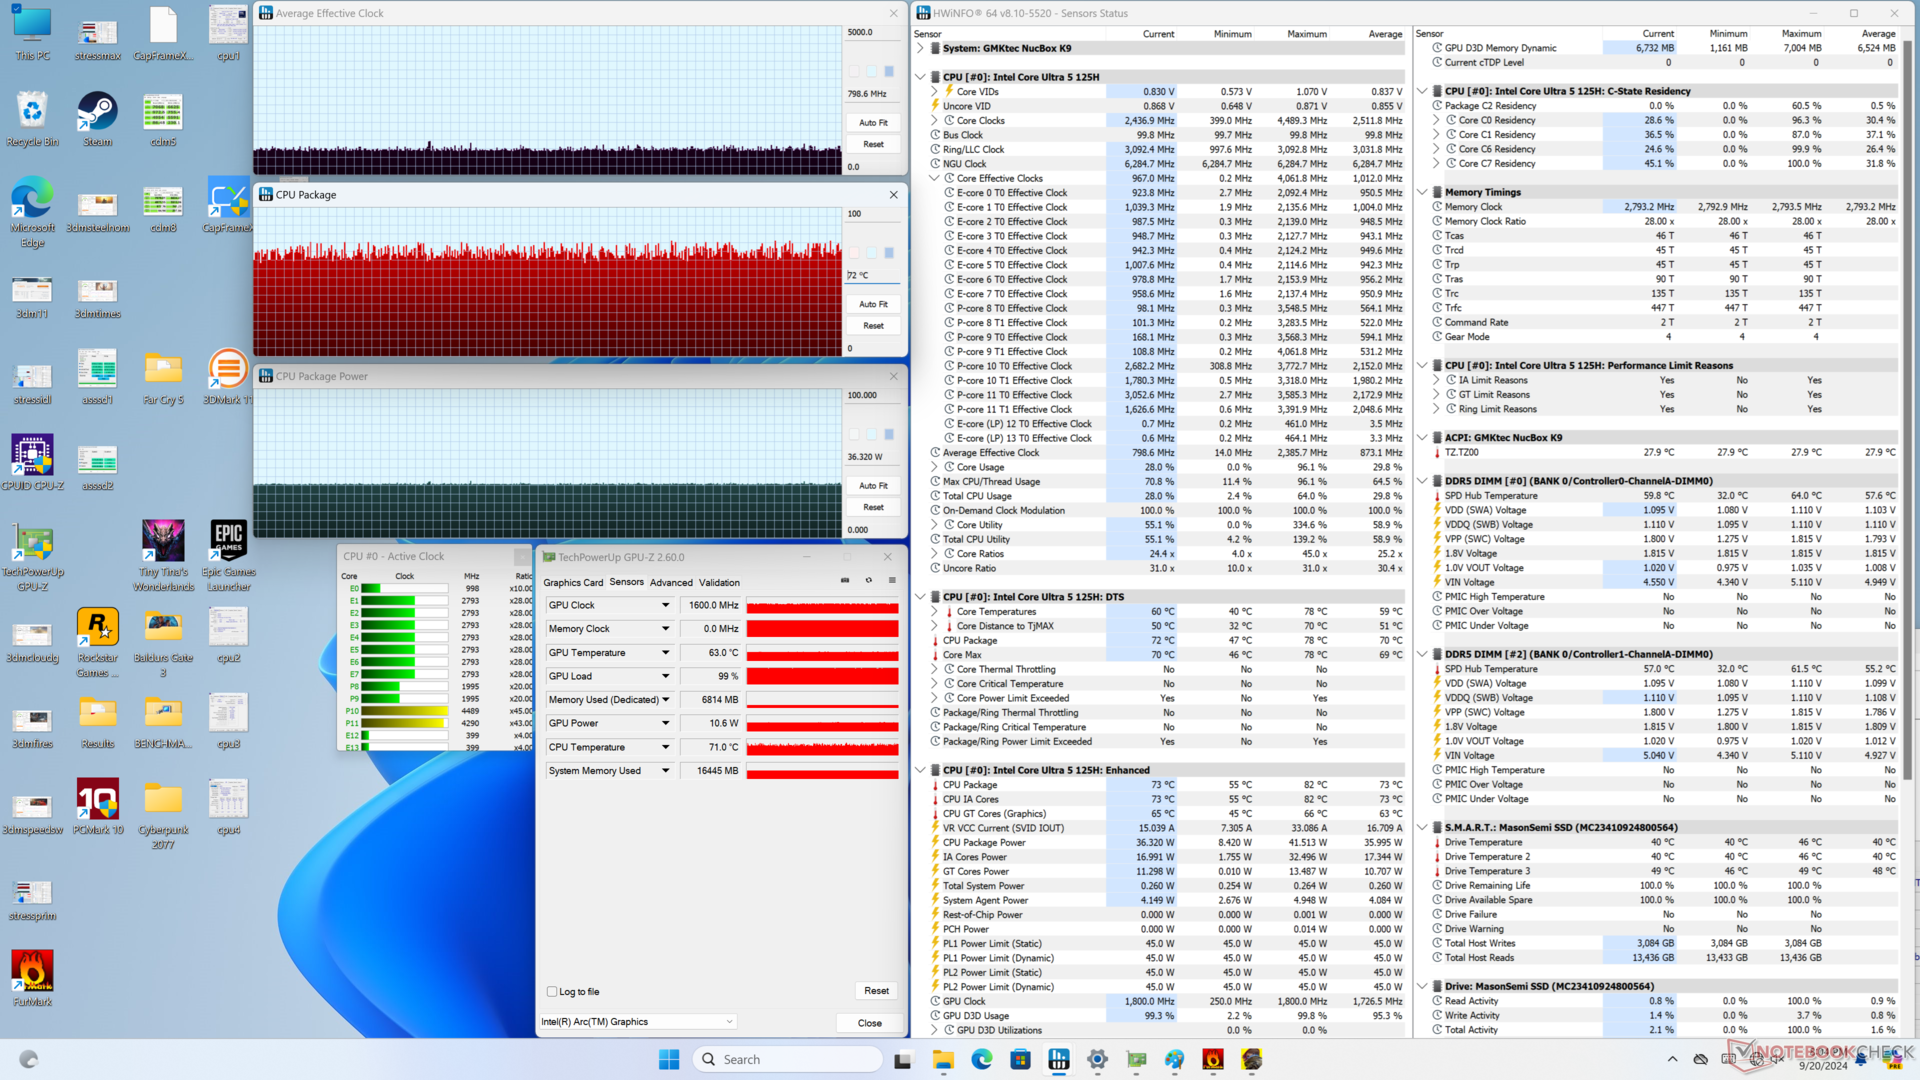
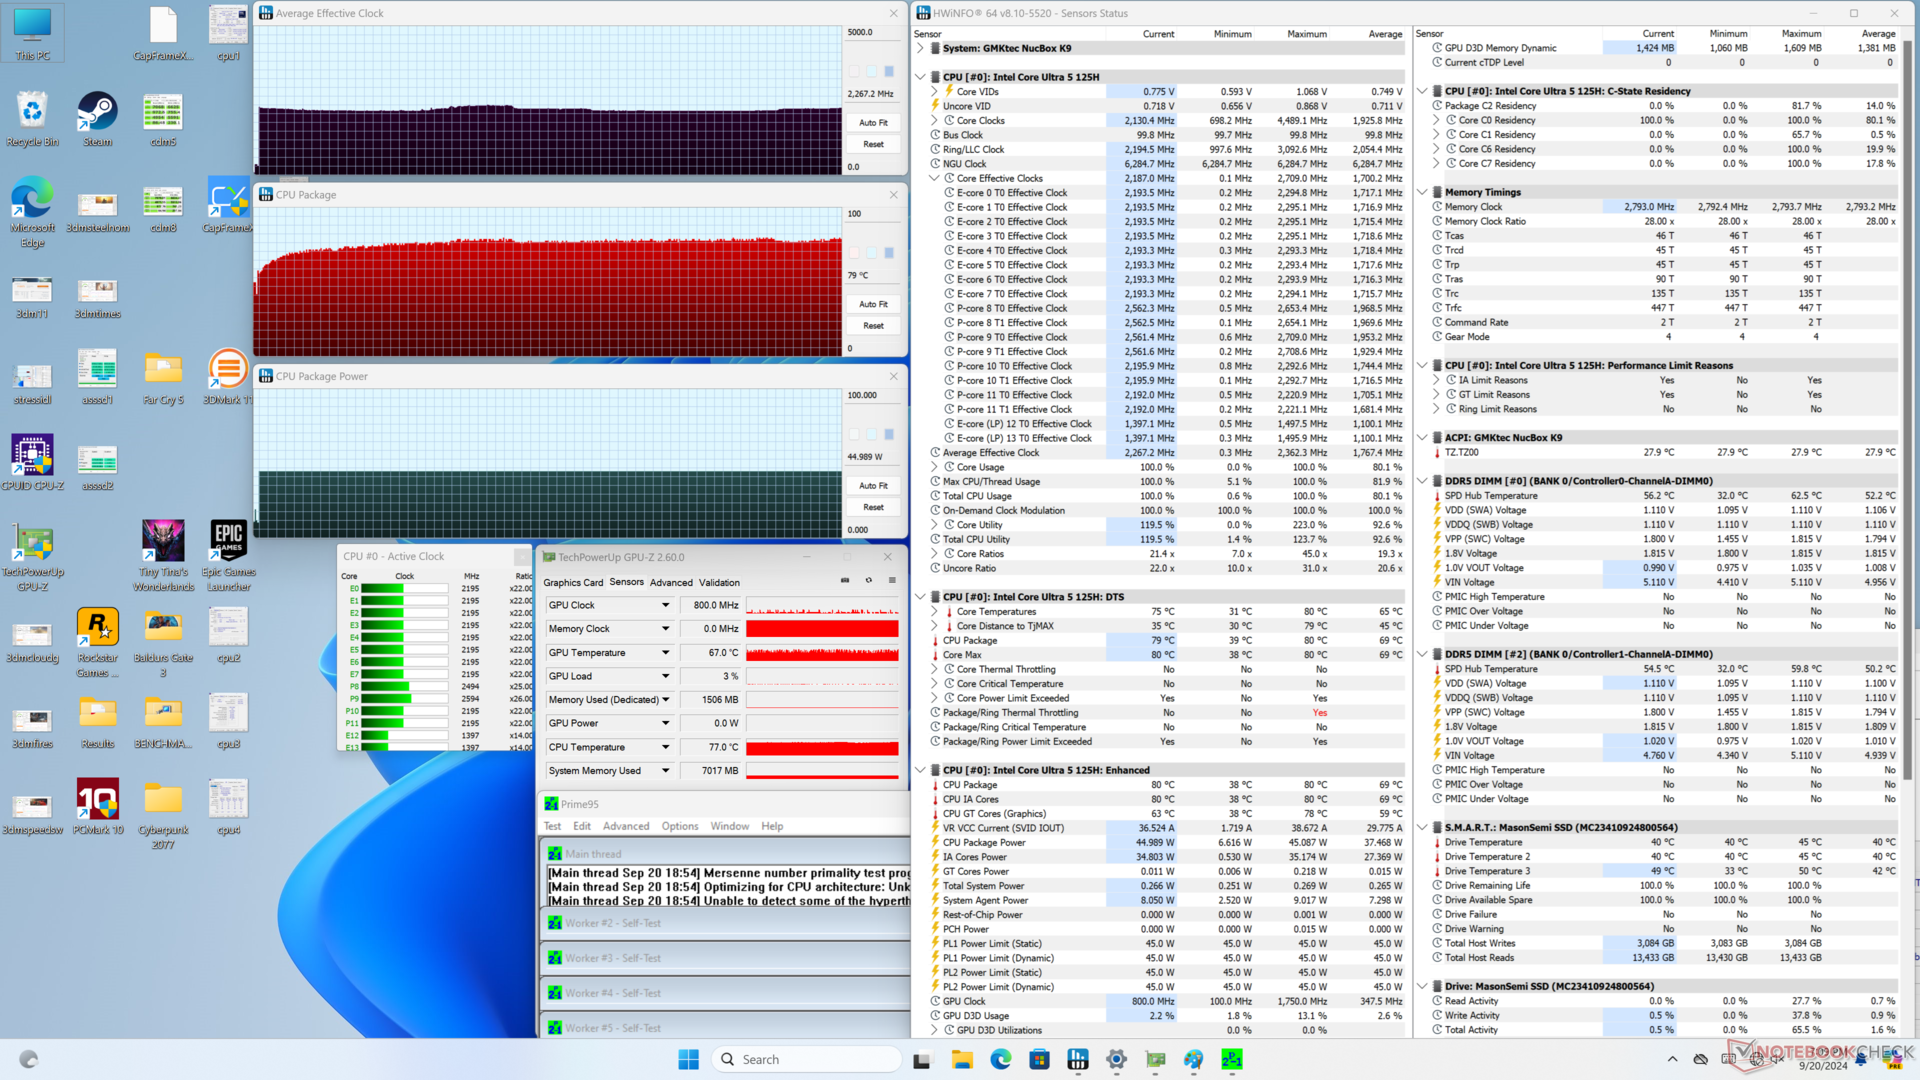
| Gemiddelde CPU-klok (GHz) | GPU-klok (MHz) | Gemiddelde CPU-temperatuur (°C) | |
| Inactief systeem | -- | -- | 40 |
| Prime95-stress | 2.3 | -- | 79 |
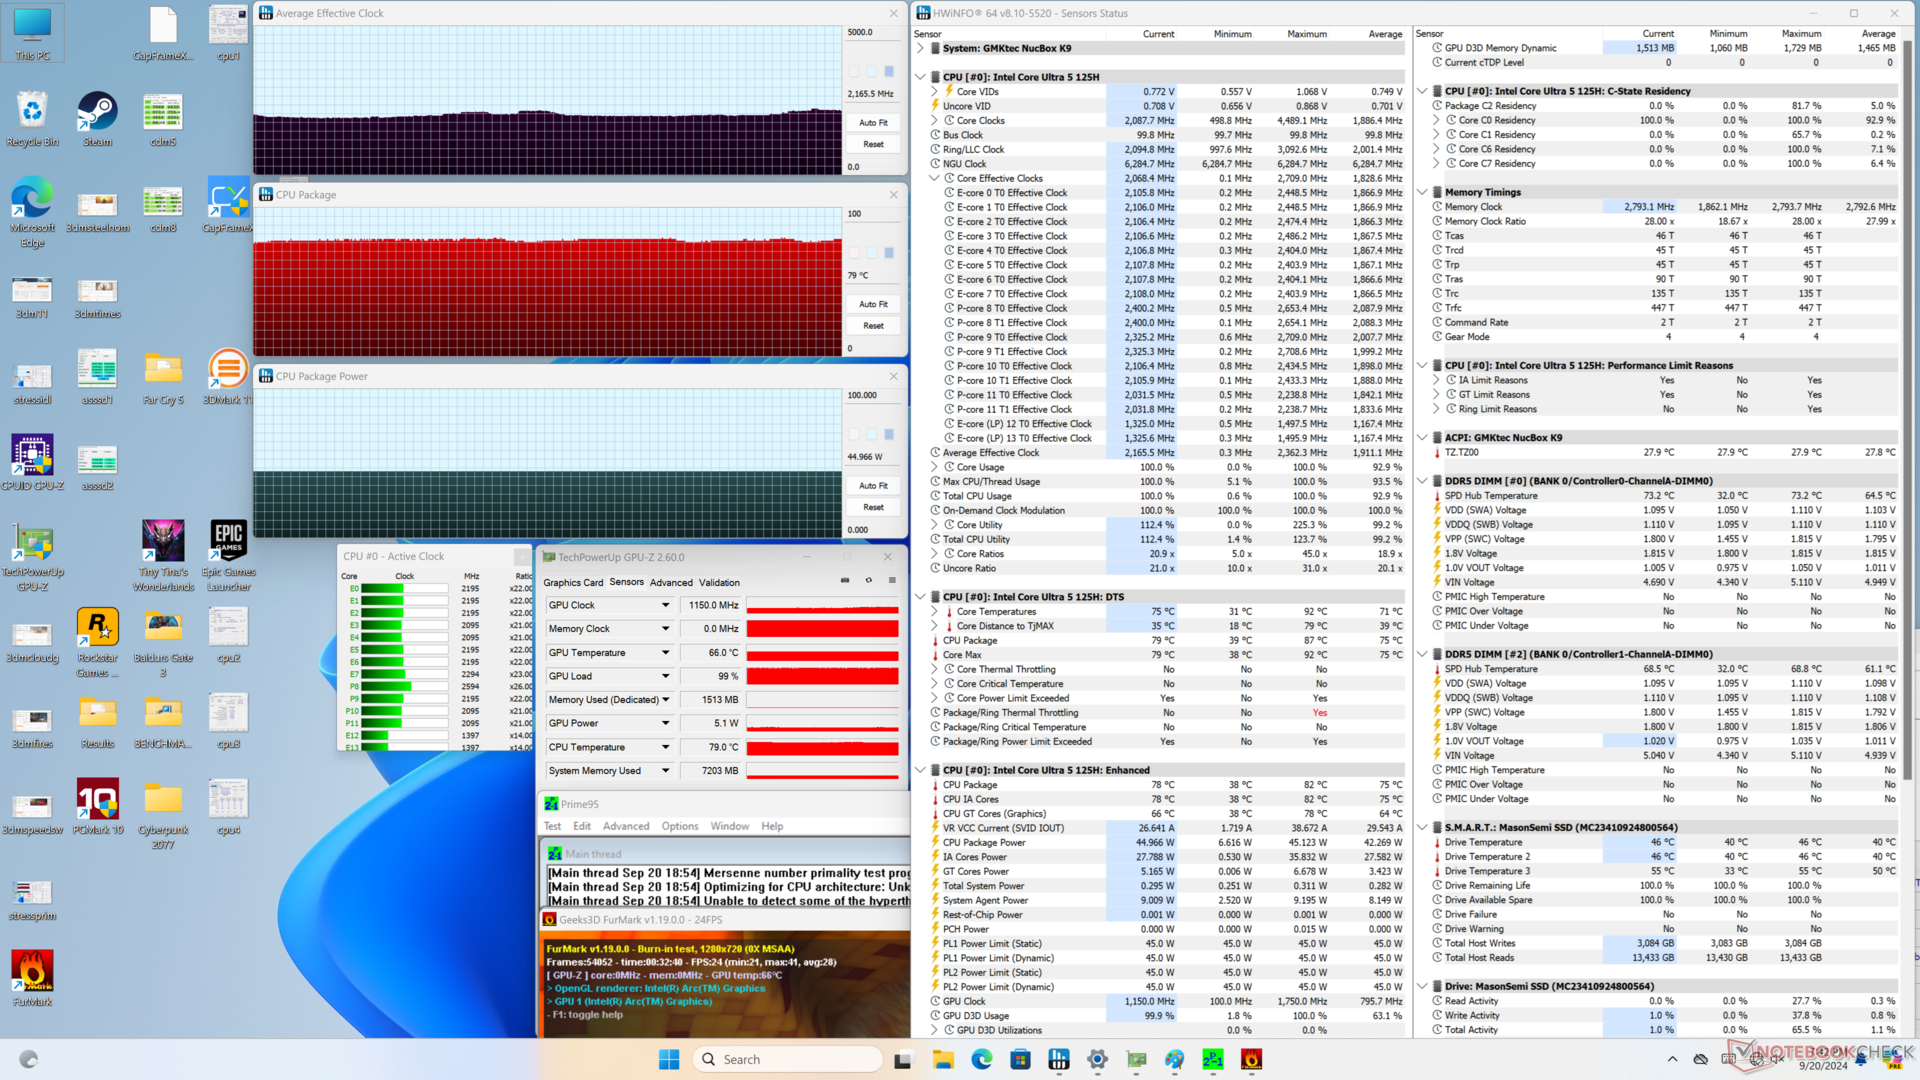
| Prime95 + FurMark Stress | 2.2 | 1150 | 79 |
| Cyberpunk 2077 Stress | 0.9 | 1600 | 72 |
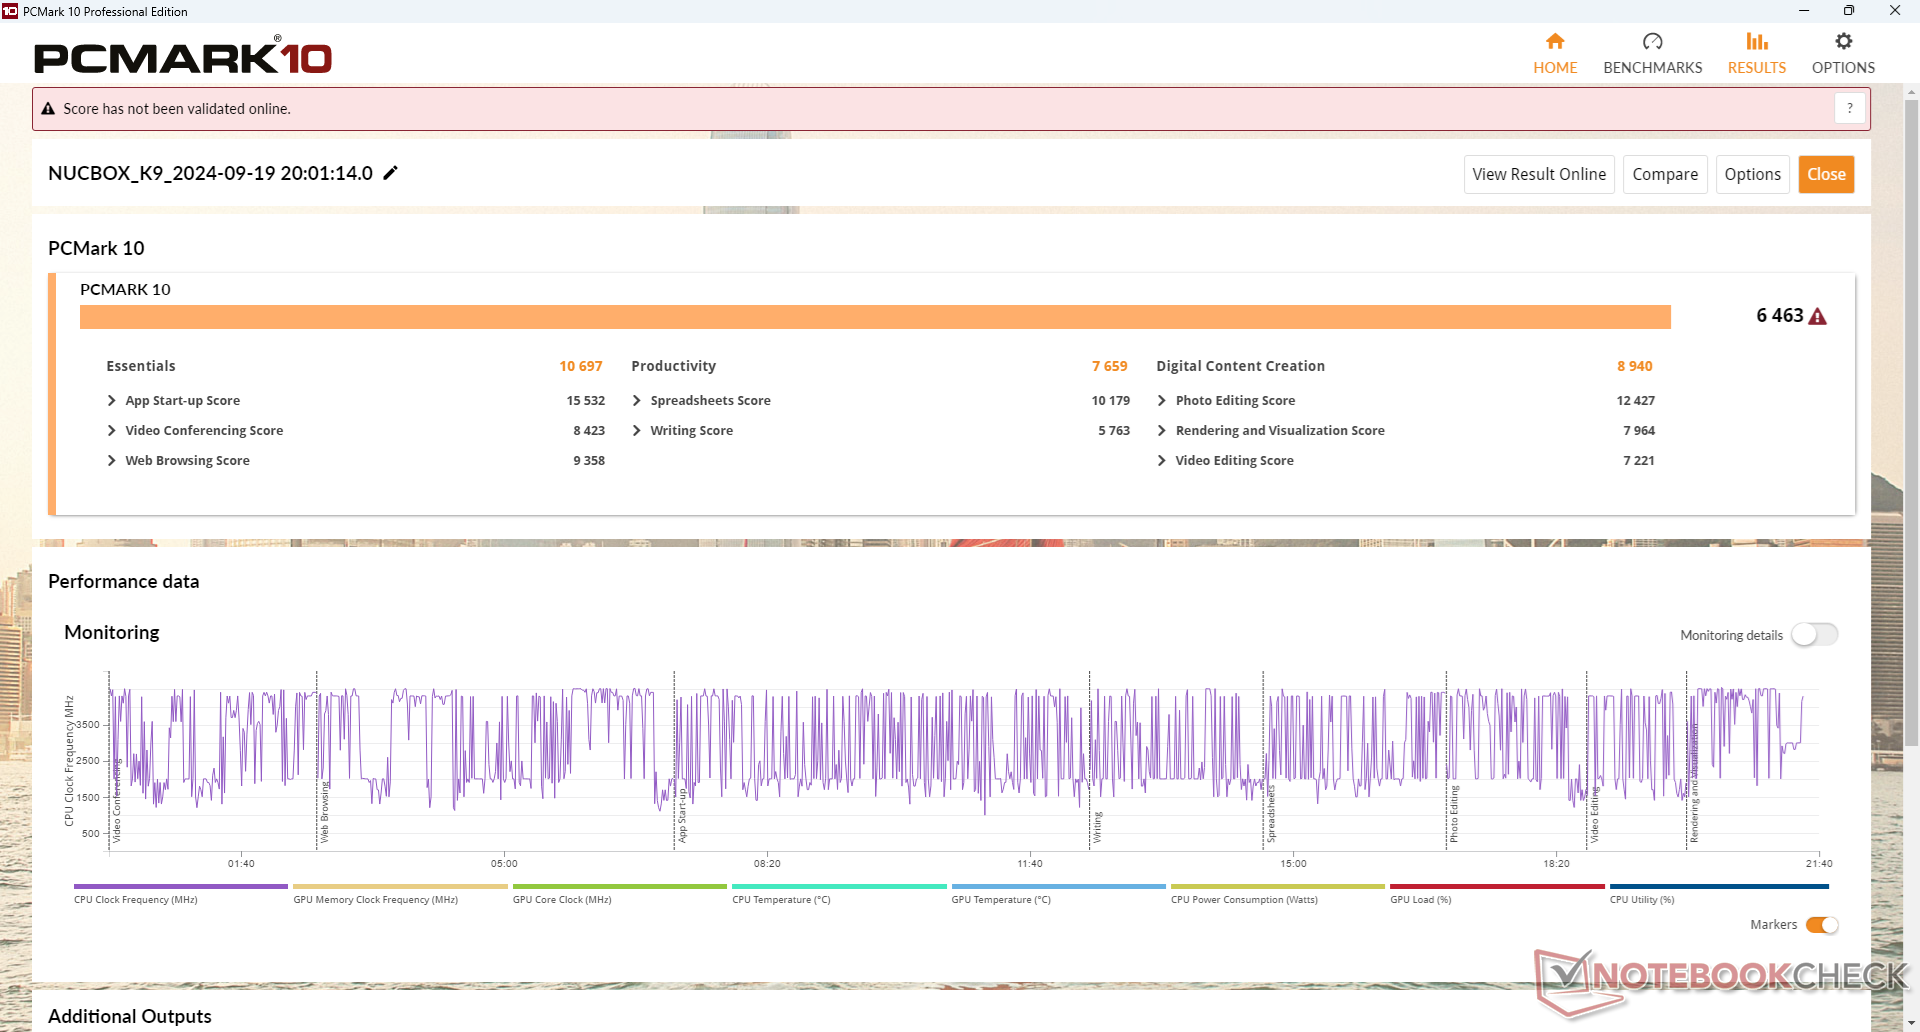
Systeemprestaties
CrossMark: Overall | Productivity | Creativity | Responsiveness
WebXPRT 3: Overall
WebXPRT 4: Overall
Mozilla Kraken 1.1: Total
| PCMark 10 / Score | |
| Beelink SER8 | |
| GMK NucBox K6 | |
| BOSGAME M1 | |
| GMK NucBox K9 | |
| Gemiddeld Intel Core Ultra 5 125H, Intel Arc 7-Core iGPU (6194 - 6463, n=6) | |
| GMK NucBox M6 | |
| Beelink SEi12 Core i5-1235U | |
| PCMark 10 / Essentials | |
| Beelink SER8 | |
| GMK NucBox K6 | |
| BOSGAME M1 | |
| Beelink SEi12 Core i5-1235U | |
| GMK NucBox K9 | |
| GMK NucBox M6 | |
| Gemiddeld Intel Core Ultra 5 125H, Intel Arc 7-Core iGPU (9427 - 10697, n=6) | |
| PCMark 10 / Productivity | |
| GMK NucBox K6 | |
| Beelink SER8 | |
| BOSGAME M1 | |
| GMK NucBox M6 | |
| Gemiddeld Intel Core Ultra 5 125H, Intel Arc 7-Core iGPU (7042 - 8000, n=6) | |
| GMK NucBox K9 | |
| Beelink SEi12 Core i5-1235U | |
| PCMark 10 / Digital Content Creation | |
| Beelink SER8 | |
| BOSGAME M1 | |
| GMK NucBox K6 | |
| GMK NucBox K9 | |
| Gemiddeld Intel Core Ultra 5 125H, Intel Arc 7-Core iGPU (8198 - 9506, n=6) | |
| GMK NucBox M6 | |
| Beelink SEi12 Core i5-1235U | |
| CrossMark / Overall | |
| BOSGAME M1 | |
| Beelink SER8 | |
| GMK NucBox K6 | |
| Beelink SEi12 Core i5-1235U | |
| GMK NucBox K9 | |
| Gemiddeld Intel Core Ultra 5 125H, Intel Arc 7-Core iGPU (1522 - 1633, n=5) | |
| GMK NucBox M6 | |
| CrossMark / Productivity | |
| BOSGAME M1 | |
| GMK NucBox K6 | |
| Beelink SER8 | |
| Beelink SEi12 Core i5-1235U | |
| GMK NucBox K9 | |
| GMK NucBox M6 | |
| Gemiddeld Intel Core Ultra 5 125H, Intel Arc 7-Core iGPU (1432 - 1594, n=5) | |
| CrossMark / Creativity | |
| BOSGAME M1 | |
| Beelink SER8 | |
| GMK NucBox K6 | |
| Gemiddeld Intel Core Ultra 5 125H, Intel Arc 7-Core iGPU (1683 - 1765, n=5) | |
| GMK NucBox K9 | |
| GMK NucBox M6 | |
| Beelink SEi12 Core i5-1235U | |
| CrossMark / Responsiveness | |
| Beelink SEi12 Core i5-1235U | |
| BOSGAME M1 | |
| Beelink SER8 | |
| GMK NucBox K6 | |
| GMK NucBox K9 | |
| GMK NucBox M6 | |
| Gemiddeld Intel Core Ultra 5 125H, Intel Arc 7-Core iGPU (1171 - 1520, n=5) | |
| WebXPRT 3 / Overall | |
| Beelink SER8 | |
| GMK NucBox K6 | |
| BOSGAME M1 | |
| Beelink SEi12 Core i5-1235U | |
| GMK NucBox K9 | |
| Gemiddeld Intel Core Ultra 5 125H, Intel Arc 7-Core iGPU (245 - 263, n=6) | |
| GMK NucBox M6 | |
| WebXPRT 4 / Overall | |
| GMK NucBox K6 | |
| Beelink SER8 | |
| BOSGAME M1 | |
| Gemiddeld Intel Core Ultra 5 125H, Intel Arc 7-Core iGPU (227 - 240, n=5) | |
| Beelink SEi12 Core i5-1235U | |
| GMK NucBox K9 | |
| GMK NucBox M6 | |
| Mozilla Kraken 1.1 / Total | |
| GMK NucBox M6 | |
| Beelink SEi12 Core i5-1235U | |
| Gemiddeld Intel Core Ultra 5 125H, Intel Arc 7-Core iGPU (560 - 595, n=6) | |
| GMK NucBox K9 | |
| GMK NucBox K6 | |
| BOSGAME M1 | |
| Beelink SER8 | |
* ... kleiner is beter
| PCMark 10 Score | 6463 punten | |
Help | ||
| AIDA64 / Memory Copy | |
| Gemiddeld Intel Core Ultra 5 125H (67482 - 87473, n=6) | |
| BOSGAME M1 | |
| GMK NucBox K6 | |
| Beelink SER8 | |
| GMK NucBox K9 | |
| GMK NucBox M6 | |
| Beelink SEi12 Core i5-1235U | |
| AIDA64 / Memory Read | |
| Gemiddeld Intel Core Ultra 5 125H (70520 - 76803, n=6) | |
| GMK NucBox K9 | |
| Beelink SER8 | |
| BOSGAME M1 | |
| GMK NucBox K6 | |
| GMK NucBox M6 | |
| Beelink SEi12 Core i5-1235U | |
| AIDA64 / Memory Write | |
| BOSGAME M1 | |
| GMK NucBox K6 | |
| Beelink SER8 | |
| GMK NucBox K9 | |
| Gemiddeld Intel Core Ultra 5 125H (63162 - 72443, n=6) | |
| GMK NucBox M6 | |
| Beelink SEi12 Core i5-1235U | |
| AIDA64 / Memory Latency | |
| Gemiddeld Intel Core Ultra 5 125H (127.3 - 184.8, n=6) | |
| GMK NucBox K9 | |
| Beelink SEi12 Core i5-1235U | |
| BOSGAME M1 | |
| Beelink SER8 | |
| GMK NucBox K6 | |
| GMK NucBox M6 | |
* ... kleiner is beter
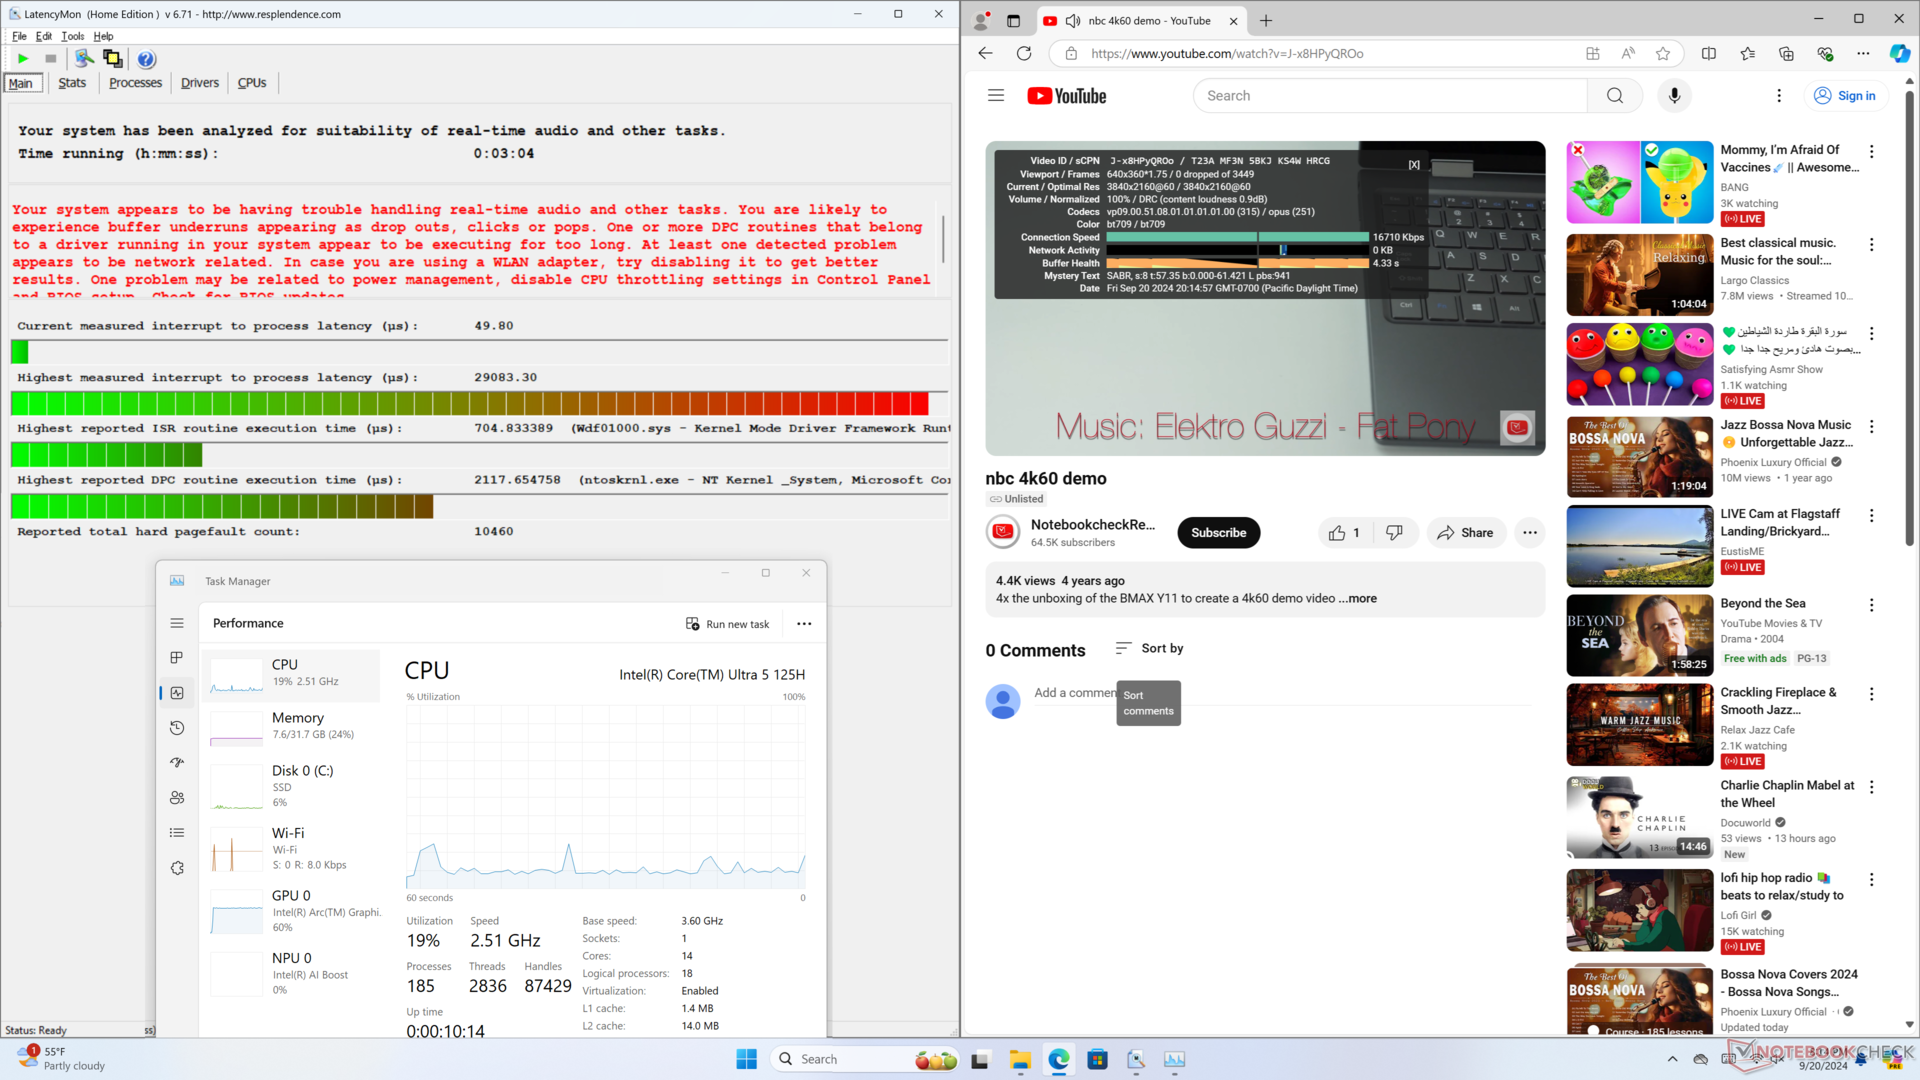
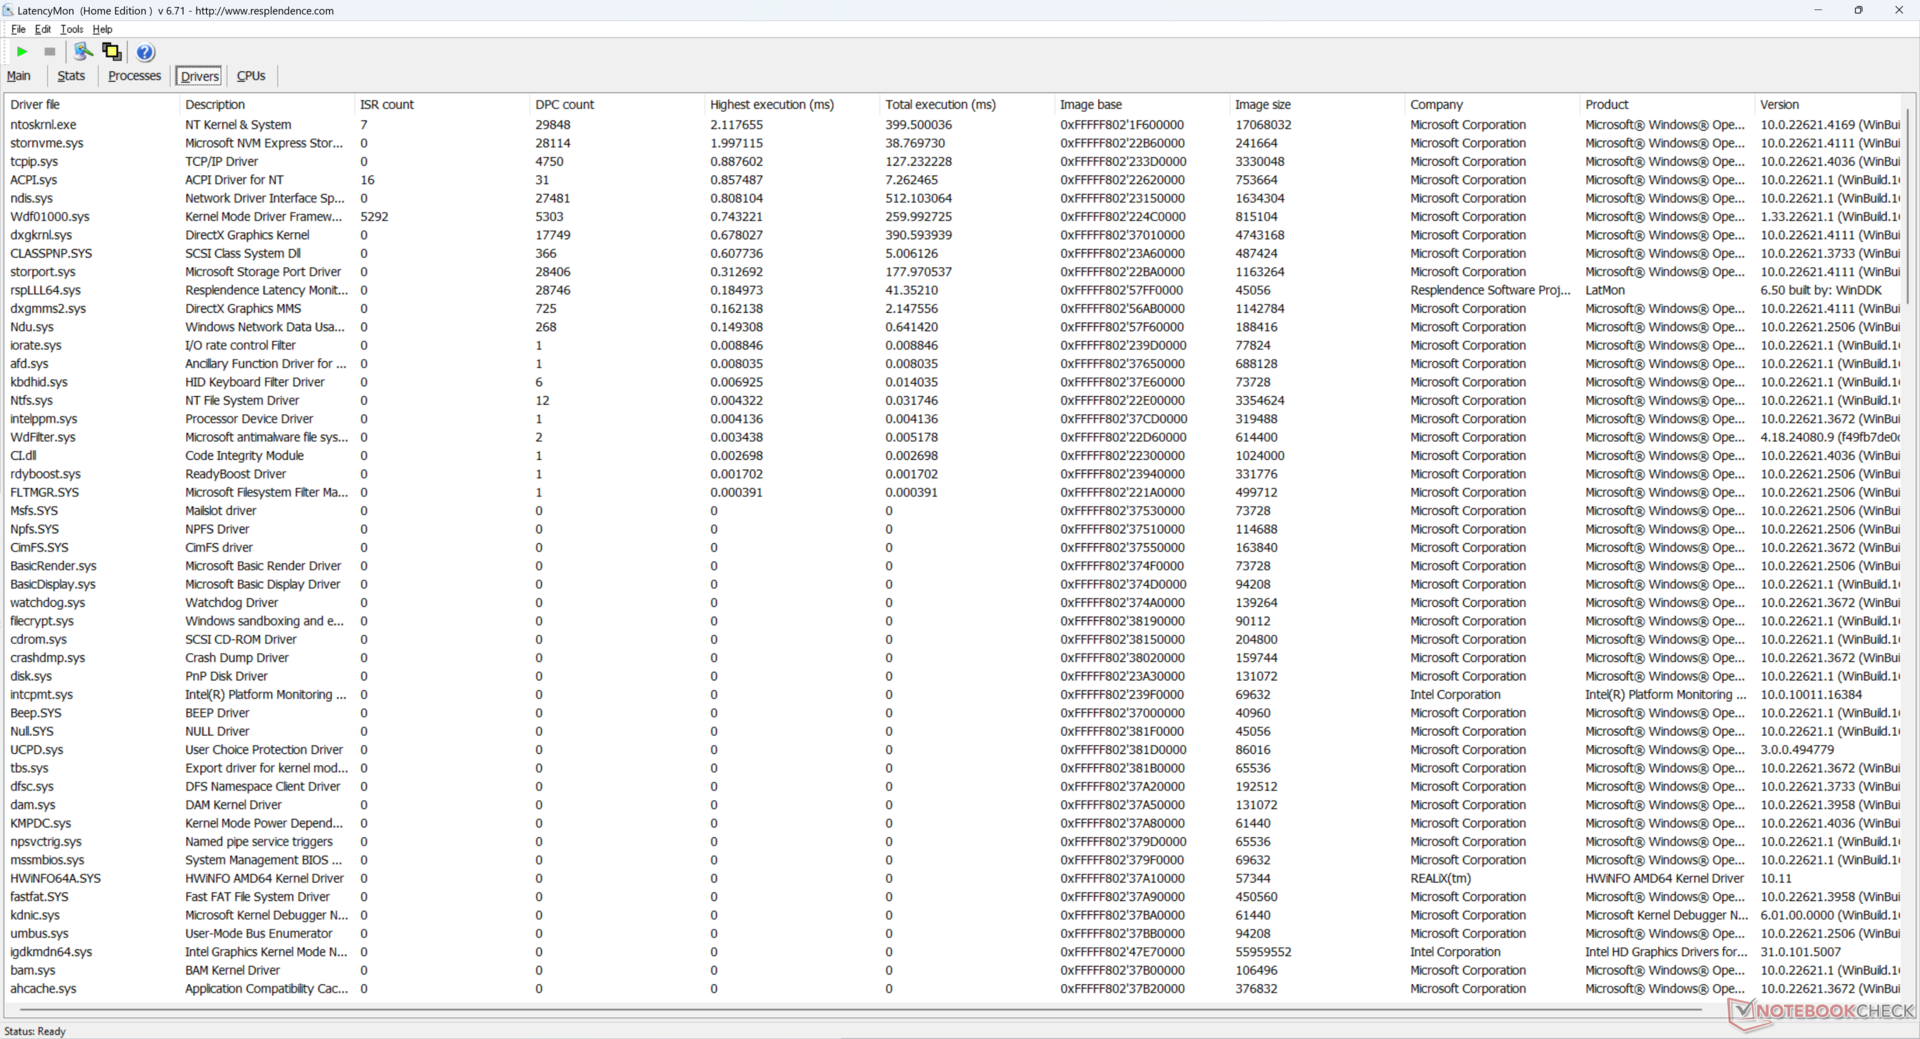
DPC latentie
LatencyMon onthult DPC-problemen met betrekking tot ntoskrnl.exe bij het openen van meerdere tabbladen van onze startpagina. het afspelen van 4K-video's met 60 FPS verloopt verder perfect, zonder dropped frames.
| DPC Latencies / LatencyMon - interrupt to process latency (max), Web, Youtube, Prime95 | |
| GMK NucBox K9 | |
| GMK NucBox M6 | |
| GMK NucBox K6 | |
| BOSGAME M1 | |
| Beelink SER8 | |
| Beelink SEi12 Core i5-1235U | |
* ... kleiner is beter
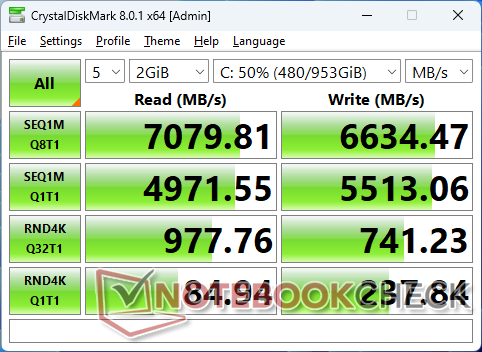
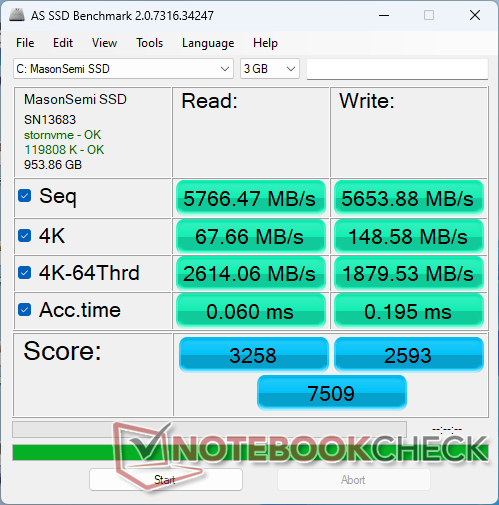
Opslagapparaten
GMK gebruikt dezelfde 1 TB MasonSemi MC7000 PCIe4 x4 NVMe SSD voor zowel de NucBox K6 als de K9 modellen. De prestaties zijn snel en vergelijkbaar met de Samsung PM9A1-serie die vaak op high-end pc's wordt gebruikt, ondanks de minder bekende merknaam. We kunnen geen noemenswaardige prestatievermindering waarnemen wanneer DiskSpd in een lus wordt uitgevoerd.

| Drive Performance Rating - Percent | |
| GMK NucBox K6 | |
| GMK NucBox K9 | |
| Beelink SEi12 Core i5-1235U | |
| Beelink SER8 | |
| BOSGAME M1 | |
| GMK NucBox M6 | |
* ... kleiner is beter
Disk Throttling: DiskSpd Read Loop, Queue Depth 8
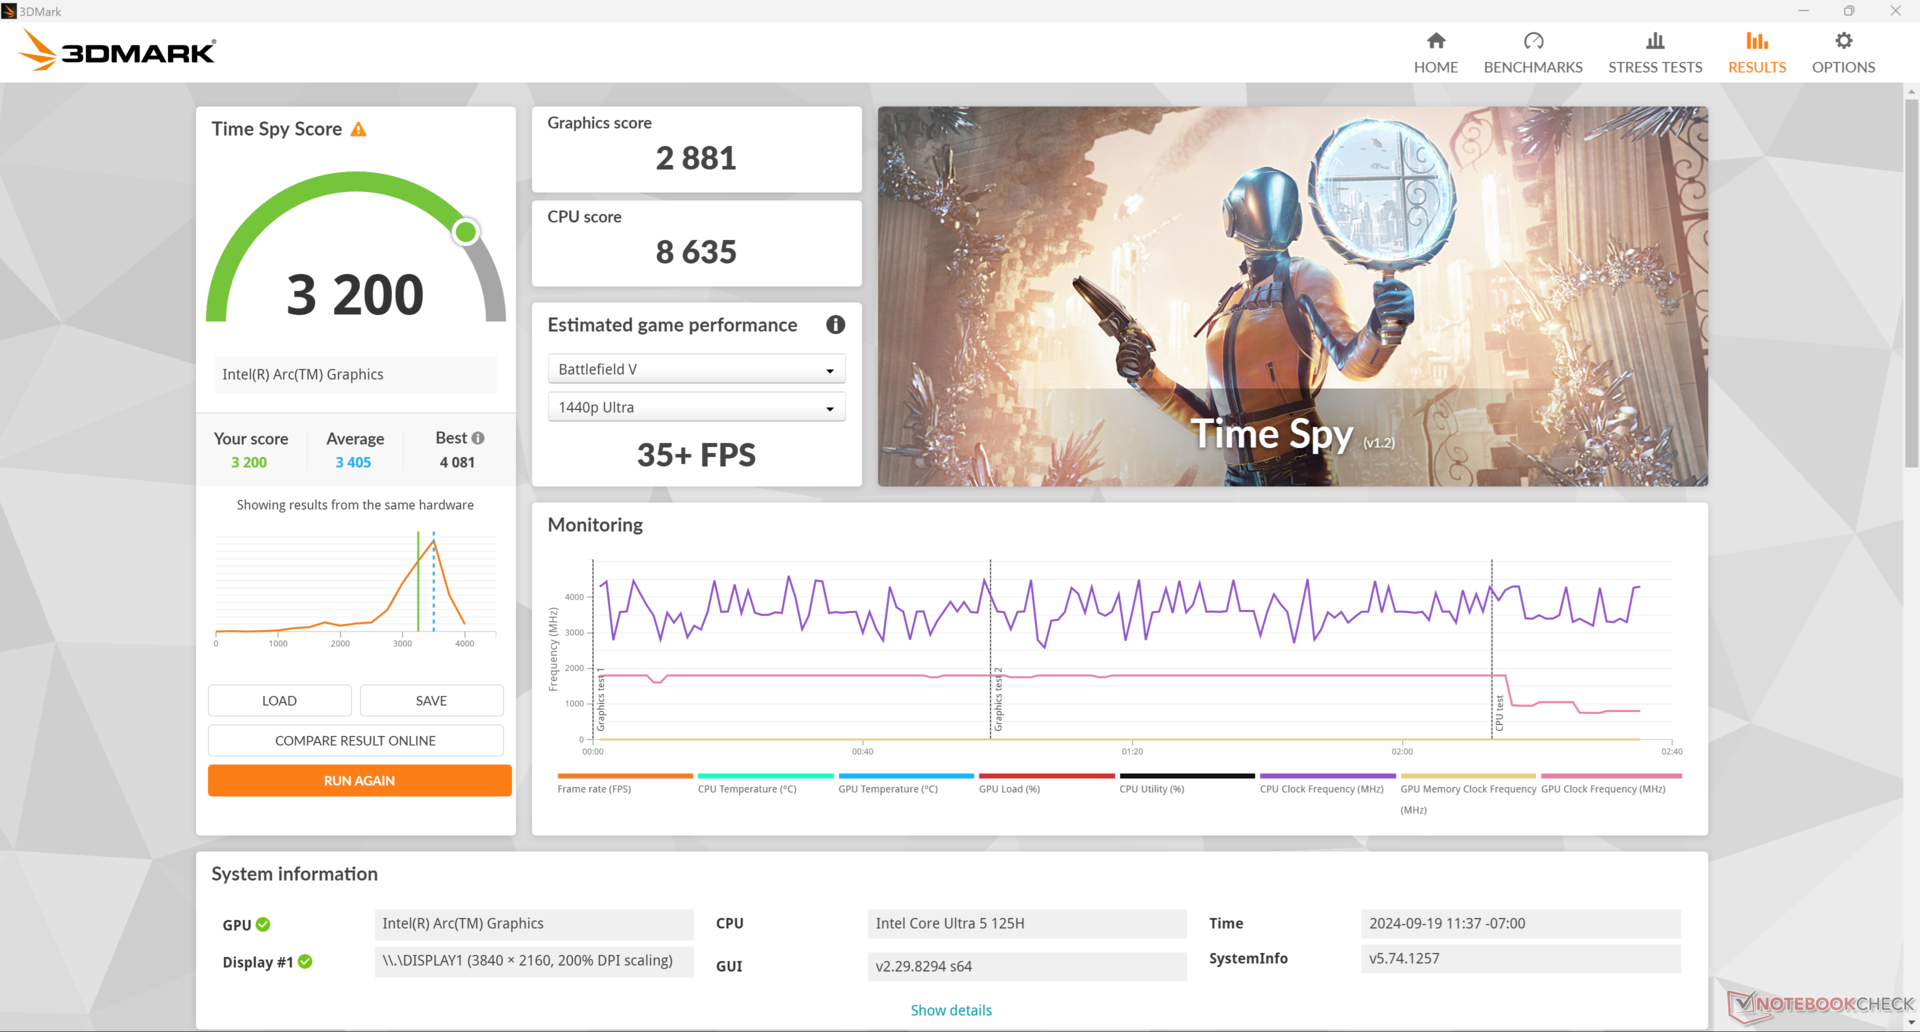
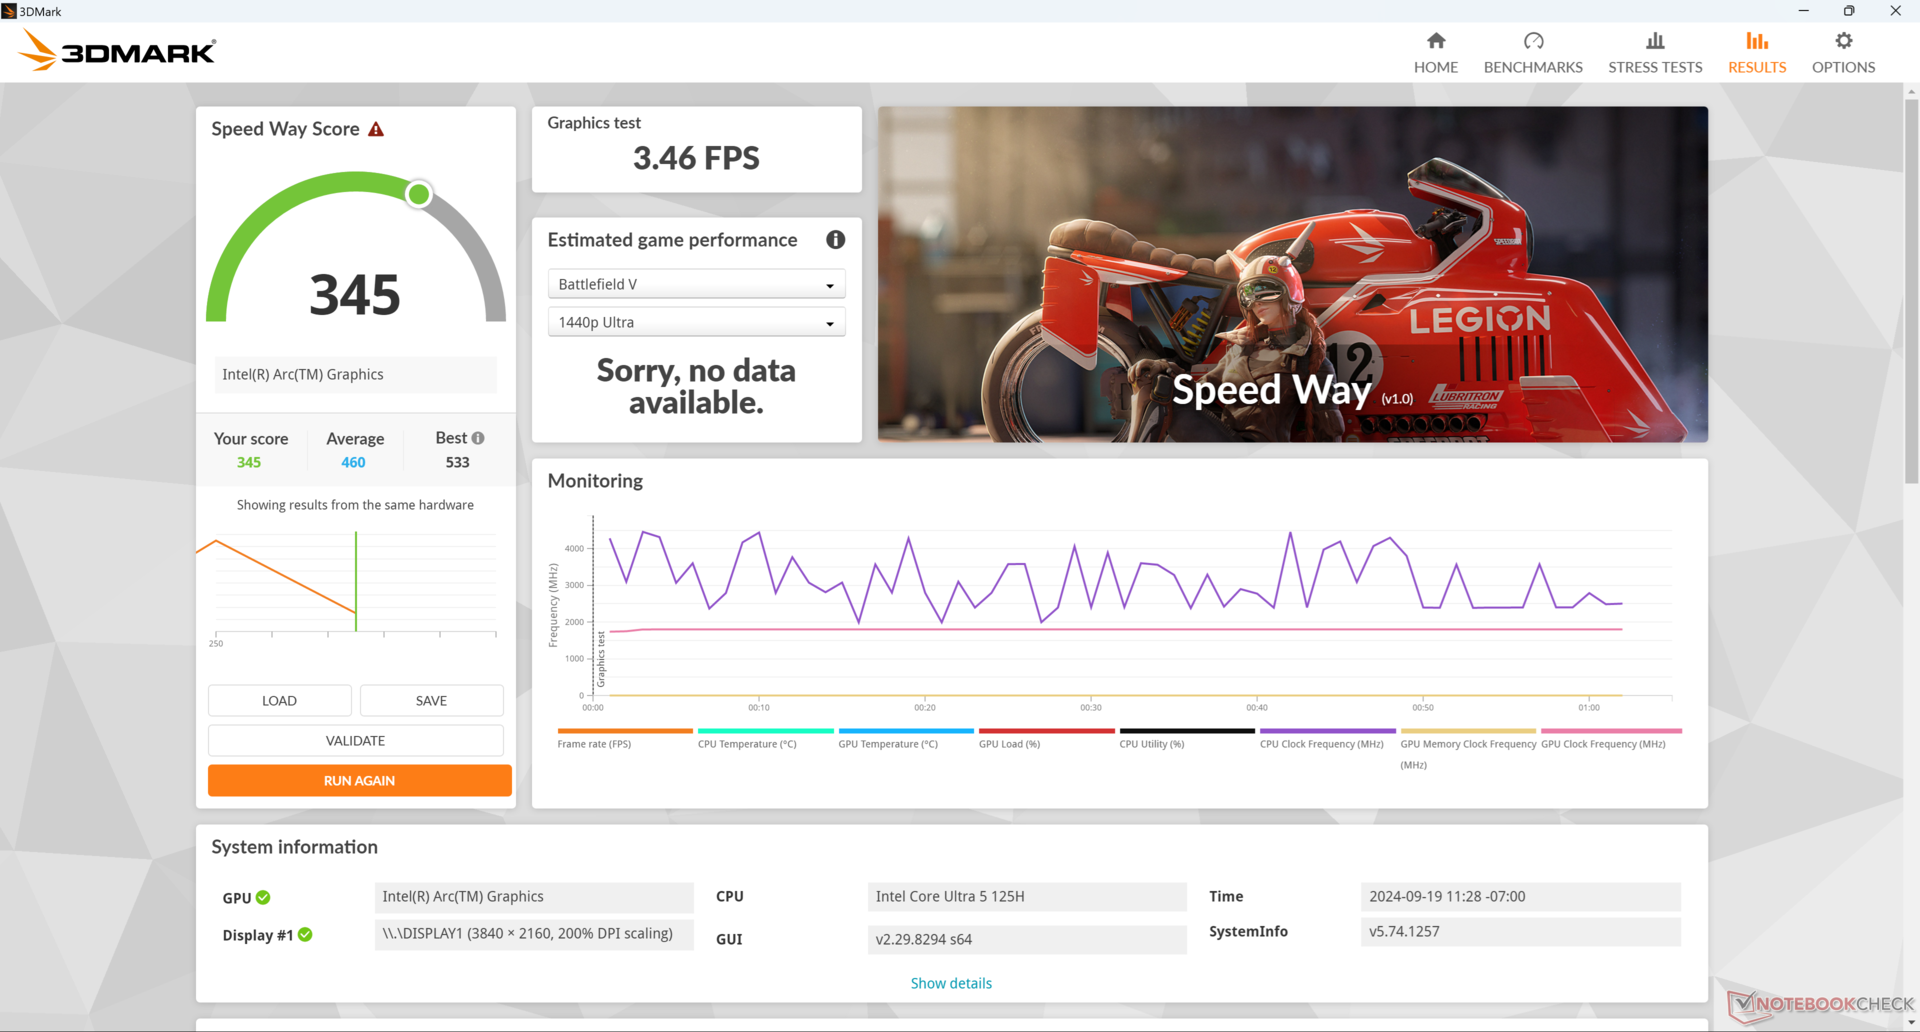
GPU-prestaties
De grafische prestaties zijn iets langzamer dan de gemiddelde PC in onze database met dezelfde geïntegreerde Arc 7 GPU met ongeveer 5 procent. De geïntegreerde Arc 8 GPU op de duurdere Core Ultra 7-H en Core Ultra 9-H processoren is ongeveer 15 procent sneller dan onze Arc 7 oplossing, maar helaas zijn er geen dergelijke SKU's beschikbaar met de NucBox K9. Desalniettemin zijn de algehele prestaties vergelijkbaar met die van de concurrerende laatste generatie Radeon 780M volgens 3DMark benchmarks.
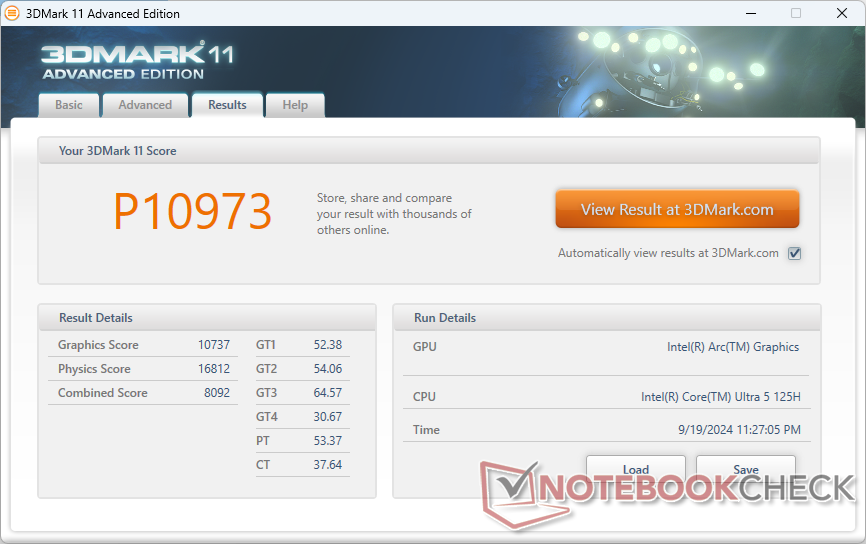

| 3DMark 11 Performance | 10973 punten | |
| 3DMark Cloud Gate Standard Score | 28997 punten | |
| 3DMark Fire Strike Score | 6716 punten | |
| 3DMark Time Spy Score | 3200 punten | |
| 3DMark Steel Nomad Score | 581 punten | |
Help | ||
* ... kleiner is beter
Gaming prestaties
Helaas zijn de gamingprestaties veel langzamer in vergelijking met de NucBox K6, hoewel de 3DMark-resultaten hierboven anders doen vermoeden. De meeste geteste titels, waaronder GTA V, DOTA 2 Reborn, Final Fantasy XV, F1 22 en Baldur's Gate 3 , lopen tussen de 10 en 40 procent langzamer op onze Intel-aangedreven NucBox K9. De framerates stotterden ook tijdens het stationair draaien van Cyberpunk 2077, zoals onze grafiek hieronder laat zien.
| Performance Rating - Percent | |
| BOSGAME M1 -1! | |
| Beelink SER8 -1! | |
| GMK NucBox K6 | |
| GMK NucBox K9 | |
| GMK NucBox M6 -1! | |
| Beelink SEi12 Core i5-1235U -1! | |
| GTA V - 1920x1080 Highest Settings possible AA:4xMSAA + FX AF:16x | |
| GMK NucBox K6 | |
| GMK NucBox K9 | |
| Beelink SEi12 Core i5-1235U | |
| Final Fantasy XV Benchmark - 1920x1080 High Quality | |
| BOSGAME M1 | |
| Beelink SER8 | |
| GMK NucBox K6 | |
| GMK NucBox K9 | |
| GMK NucBox M6 | |
| Beelink SEi12 Core i5-1235U | |
| Strange Brigade - 1920x1080 ultra AA:ultra AF:16 | |
| BOSGAME M1 | |
| Beelink SER8 | |
| GMK NucBox K6 | |
| GMK NucBox K9 | |
| GMK NucBox M6 | |
| Beelink SEi12 Core i5-1235U | |
| Dota 2 Reborn - 1920x1080 ultra (3/3) best looking | |
| Beelink SER8 | |
| BOSGAME M1 | |
| GMK NucBox K6 | |
| GMK NucBox K9 | |
| GMK NucBox M6 | |
| Beelink SEi12 Core i5-1235U | |
| X-Plane 11.11 - 1920x1080 high (fps_test=3) | |
| GMK NucBox K6 | |
| Beelink SER8 | |
| BOSGAME M1 | |
| GMK NucBox K9 | |
| GMK NucBox M6 | |
| Beelink SEi12 Core i5-1235U | |
| Far Cry 5 - 1920x1080 Ultra Preset AA:T | |
| BOSGAME M1 | |
| Beelink SER8 | |
| GMK NucBox K6 | |
| GMK NucBox K9 | |
| GMK NucBox M6 | |
| F1 22 | |
| 1280x720 Ultra Low Preset AA:T AF:16x | |
| GMK NucBox K6 | |
| Beelink SER8 | |
| GMK NucBox K9 | |
| Gemiddeld Intel Arc 7-Core iGPU (n=1) | |
| Framework Laptop 13.5 Core Ultra 7 155H | |
| GMK NucBox M6 | |
| 1920x1080 Low Preset AA:T AF:16x | |
| GMK NucBox K6 | |
| Beelink SER8 | |
| GMK NucBox K9 | |
| Gemiddeld Intel Arc 7-Core iGPU (n=1) | |
| Framework Laptop 13.5 Core Ultra 7 155H | |
| GMK NucBox M6 | |
| 1920x1080 Medium Preset AA:T AF:16x | |
| GMK NucBox K6 | |
| Beelink SER8 | |
| GMK NucBox K9 | |
| Gemiddeld Intel Arc 7-Core iGPU (n=1) | |
| Framework Laptop 13.5 Core Ultra 7 155H | |
| GMK NucBox M6 | |
| 1920x1080 High Preset AA:T AF:16x | |
| GMK NucBox K6 | |
| Beelink SER8 | |
| Framework Laptop 13.5 Core Ultra 7 155H | |
| GMK NucBox K9 | |
| Gemiddeld Intel Arc 7-Core iGPU (n=1) | |
| GMK NucBox M6 | |
Cyberpunk 2077 ultra FPS Chart
| lage | gem. | hoge | ultra | |
|---|---|---|---|---|
| GTA V (2015) | 143.6 | 125.5 | 33.6 | 12.7 |
| Dota 2 Reborn (2015) | 97.7 | 83.1 | 75.6 | 73.3 |
| Final Fantasy XV Benchmark (2018) | 59.6 | 33.3 | 22.3 | |
| X-Plane 11.11 (2018) | 57 | 44.8 | 37.3 | |
| Far Cry 5 (2018) | 71 | 40 | 37 | 35 |
| Strange Brigade (2018) | 148.6 | 63.9 | 53.5 | 43.5 |
| Tiny Tina's Wonderlands (2022) | 50.7 | 39.4 | 26.8 | 22.4 |
| F1 22 (2022) | 79.4 | 71.9 | 52.9 | |
| Baldur's Gate 3 (2023) | 33.7 | 27.9 | 24.2 | 23.1 |
| Cyberpunk 2077 2.2 Phantom Liberty (2023) | 30.9 | 25.2 | 21.3 | 18.8 |
Uitstoot - Ventilatoren staan altijd aan
Systeemgeluid
Er is altijd ventilatorgeluid aanwezig op het apparaat, ongeacht de belasting van het scherm, net als bij de NucBox K6. Gewoon stationair draaien op het bureaublad is al 30 tot 36 dB(A) tegen een stille achtergrond van 23 dB(A), zelfs als het apparaat in de spaarstand staat. Het geluid van de ventilator tijdens het gamen of het uitvoeren van andere veeleisende belastingen lijkt echter stiller te zijn op de NucBox K9 met ongeveer 44 dB(A) vergeleken met bijna 48 dB(A) op de NucBox K6.
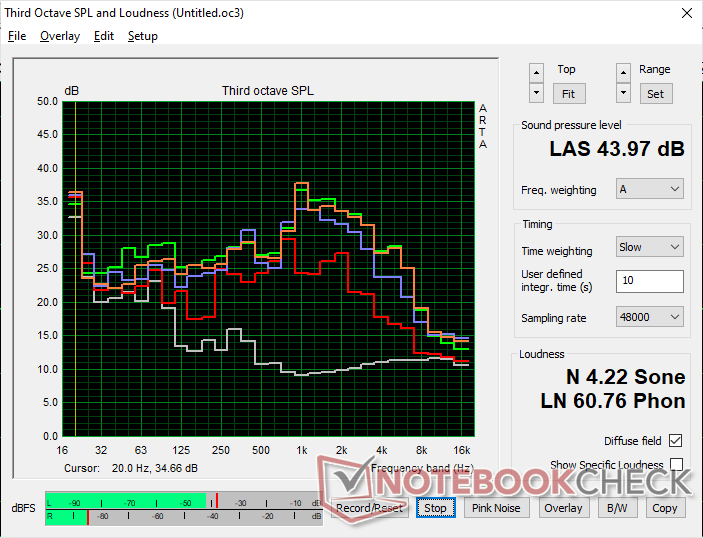
Geluidsniveau
| Onbelast |
| 29.8 / 35.7 / 35.7 dB (A) |
| Belasting |
| 41.9 / 44 dB (A) |
 | ||
30 dB stil 40 dB(A) hoorbaar 50 dB(A) luid |
||
min: | ||
| GMK NucBox K9 Arc 7-Core, Ultra 5 125H, MasonSemi 1TB MC7000 | GMK NucBox K6 Radeon 780M, R7 7840HS, MasonSemi 1TB MC7000 | GMK NucBox M6 Radeon 660M, R5 6600H, AirDisk APF 10-512G | Beelink SER8 Radeon 780M, R7 8845HS, Crucial P3 Plus CT1000P3PSSD8 | Beelink SEi12 Core i5-1235U Iris Xe G7 80EUs, i5-1235U, Kingston NV1 SNVS/500GCN | BOSGAME M1 Radeon 780M, R7 7840HS | |
|---|---|---|---|---|---|---|
| Noise | -2% | -4% | 14% | 14% | 4% | |
| uit / omgeving * | 23 | 23.2 -1% | 24.2 -5% | 23.6 -3% | 23.3 -1% | 23.2 -1% |
| Idle Minimum * | 29.8 | 31.3 -5% | 31.9 -7% | 28.8 3% | 27.8 7% | 32 -7% |
| Idle Average * | 35.7 | 31.3 12% | 32 10% | 28.8 19% | 27.8 22% | 32 10% |
| Idle Maximum * | 35.7 | 33.4 6% | 33.8 5% | 30.5 15% | 27.8 22% | 32 10% |
| Load Average * | 41.9 | 47.5 -13% | 48.5 -16% | 34.6 17% | 32 24% | 38.7 8% |
| Cyberpunk 2077 ultra * | 43.8 | 34.1 22% | ||||
| Load Maximum * | 44 | 47.7 -8% | 48.5 -10% | 34.5 22% | 39.2 11% | 42 5% |
| Witcher 3 ultra * | 43.6 | 48.5 | 34.1 | 41.7 |
* ... kleiner is beter
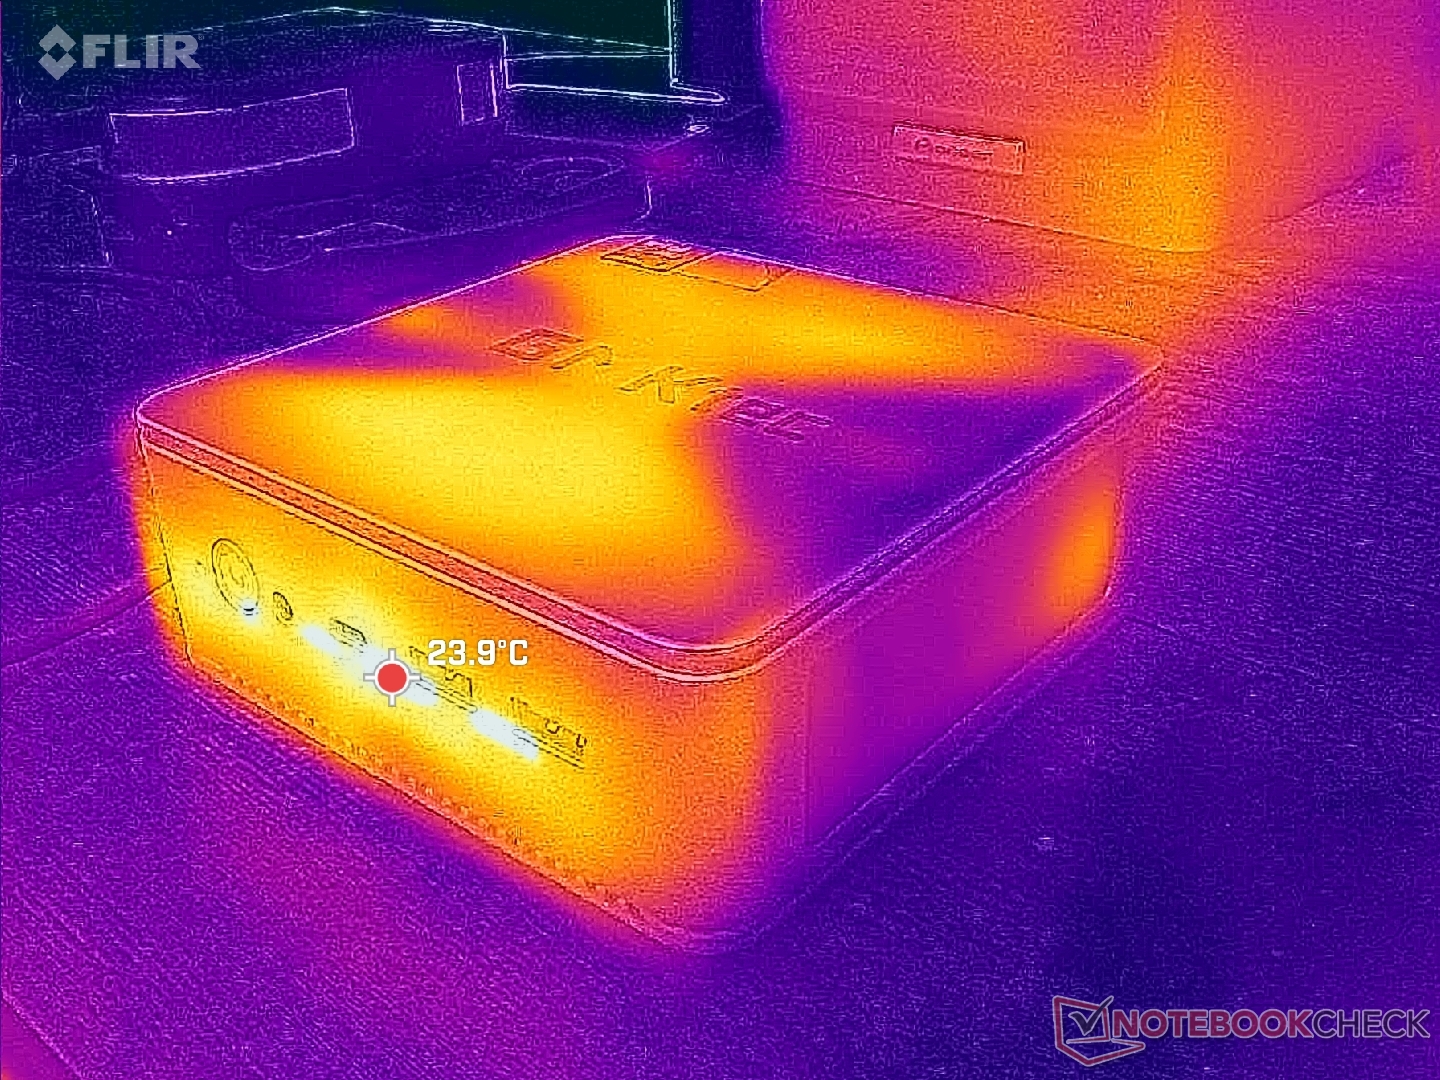
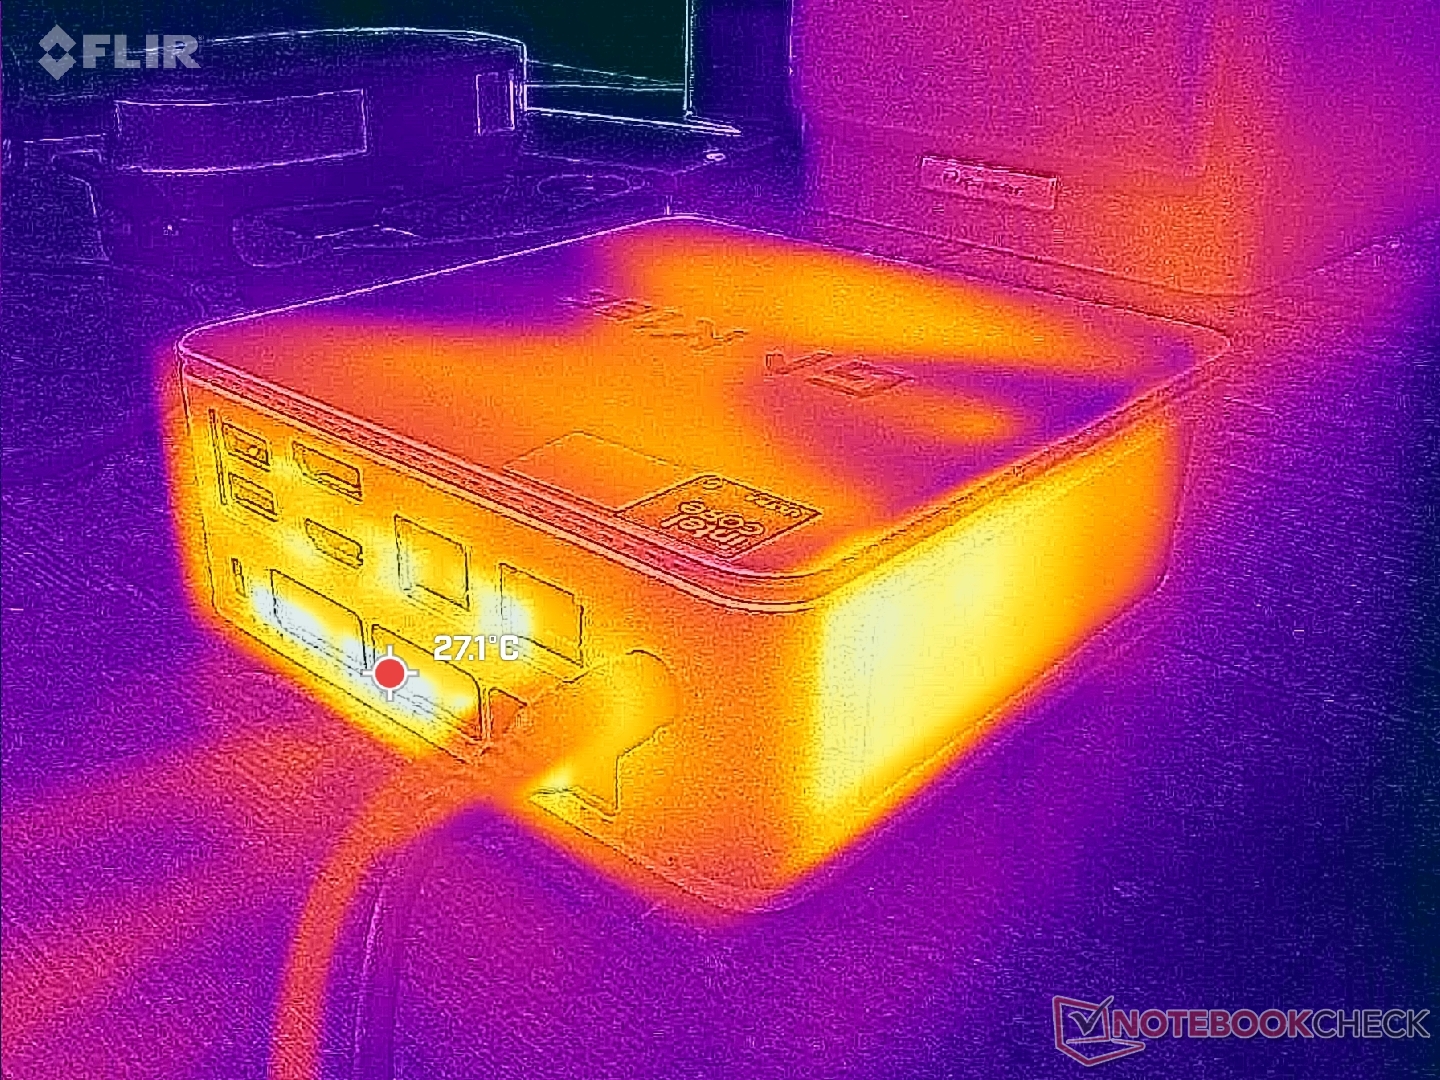
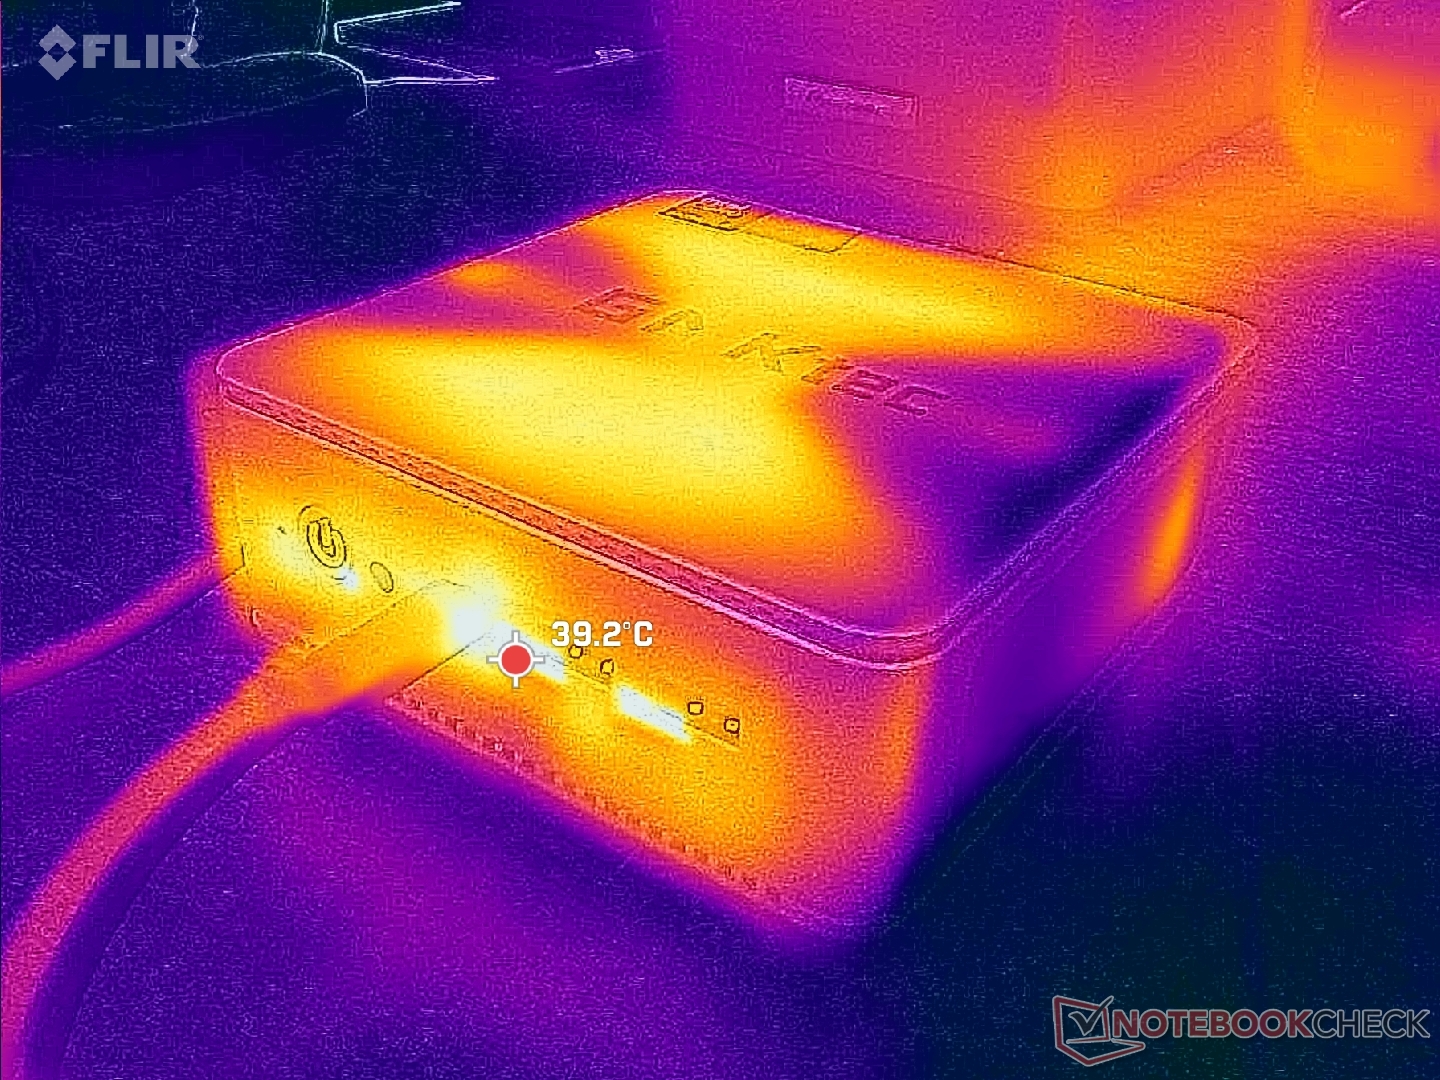
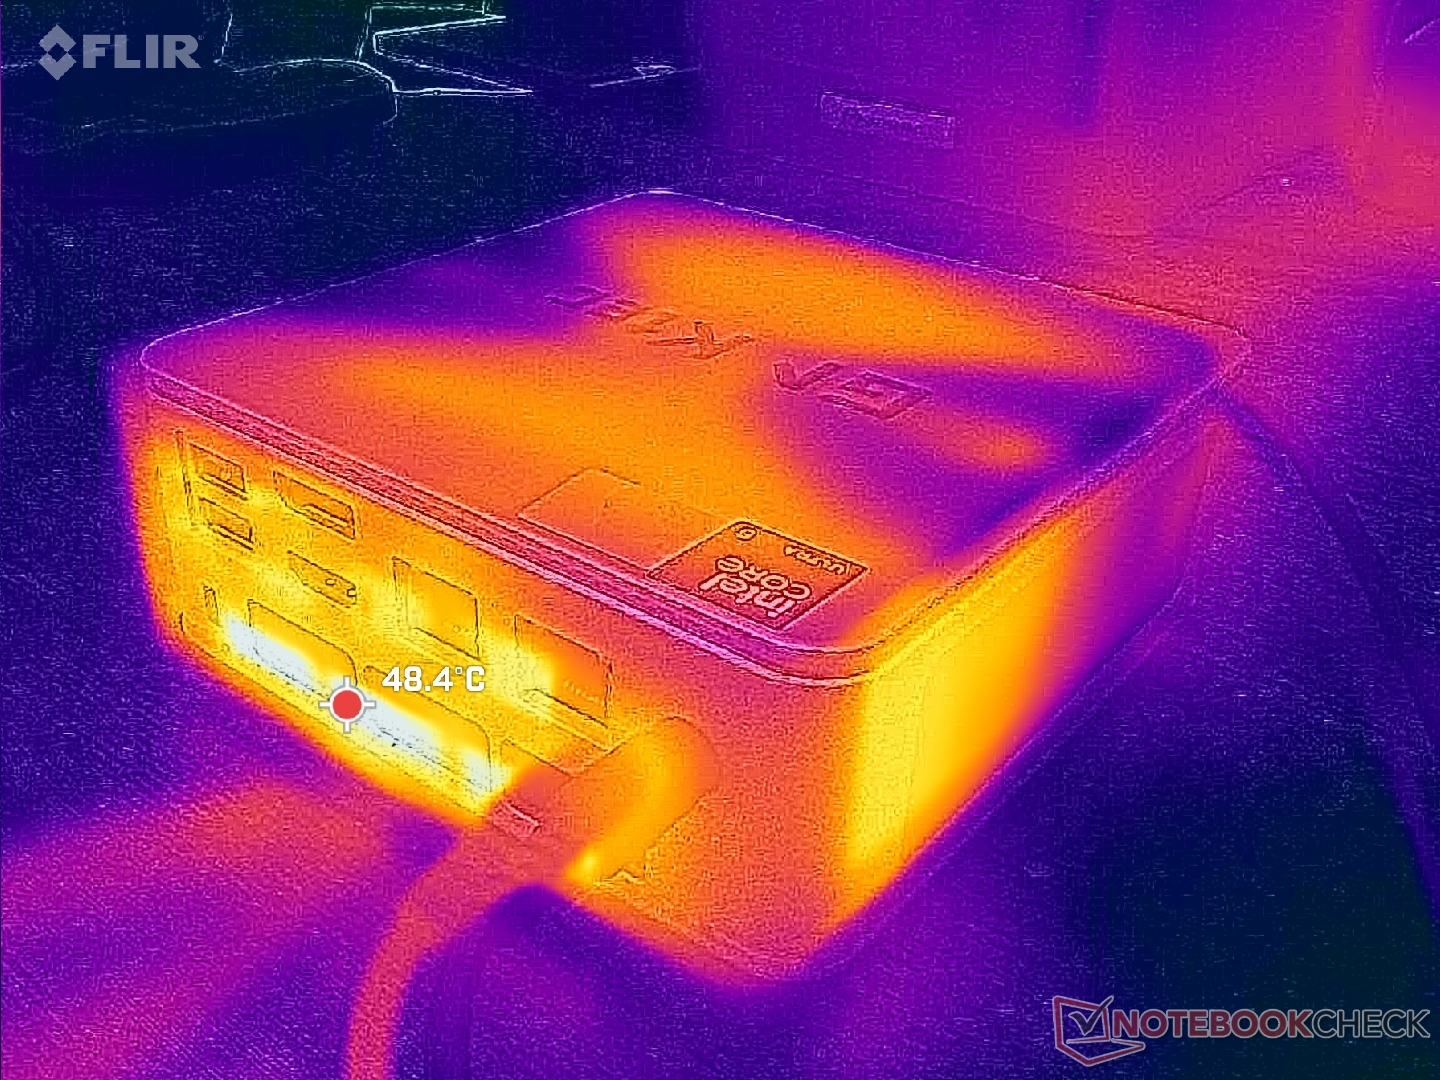
Temperatuur
De oppervlaktetemperaturen zijn geen probleem. De ventilatieroosters bevinden zich aan elke kant van het apparaat, behalve aan de bovenkant, wat betekent dat u er veilig notebooks en andere kleine voorwerpen op kunt plaatsen zonder de luchtstroom te belemmeren.
Energiebeheer
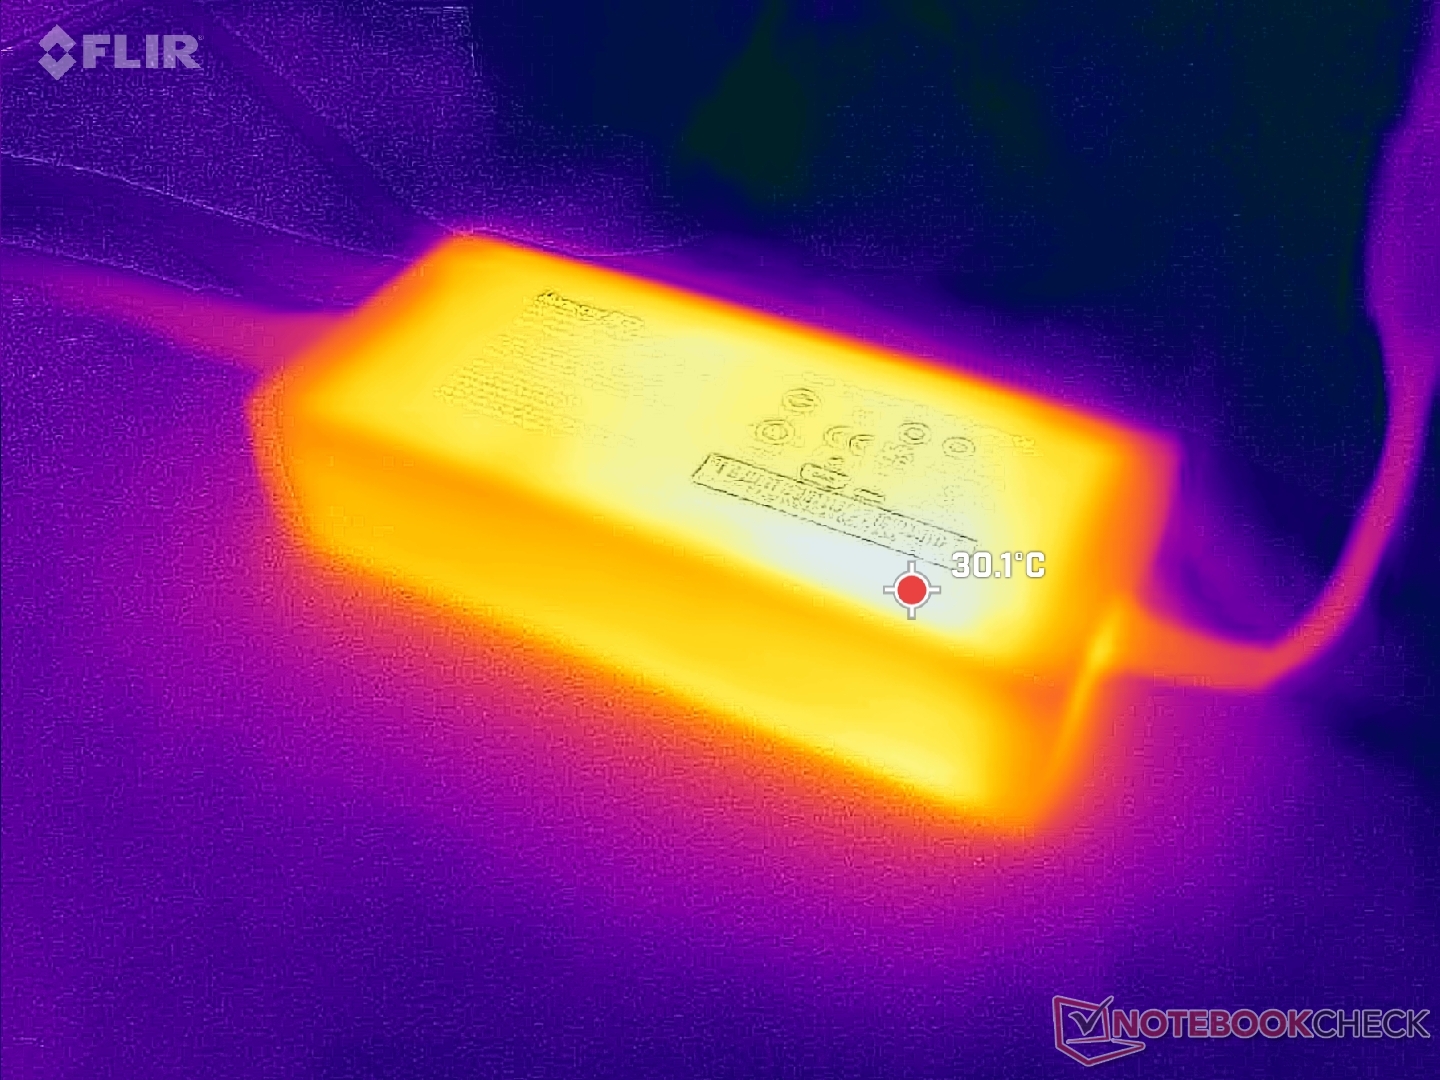
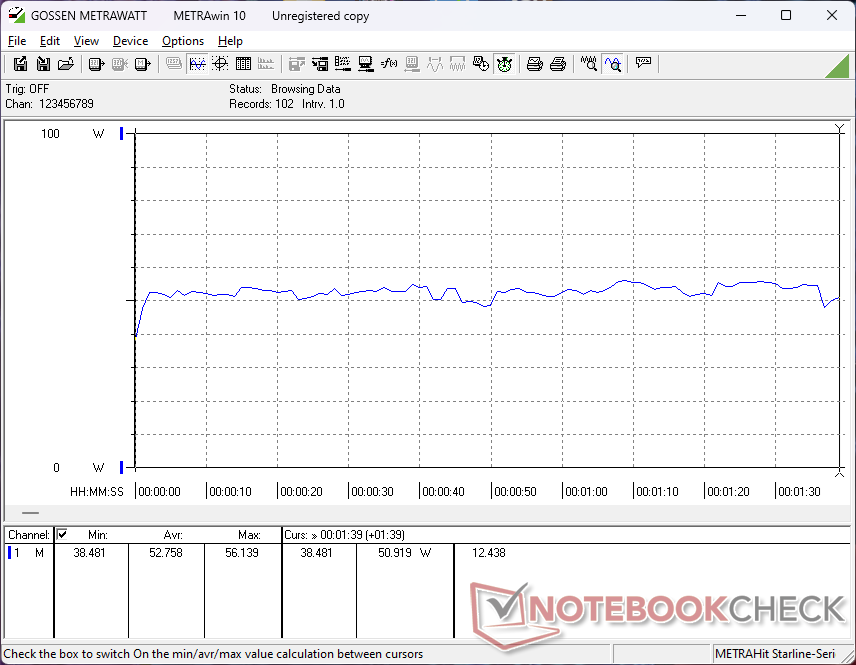
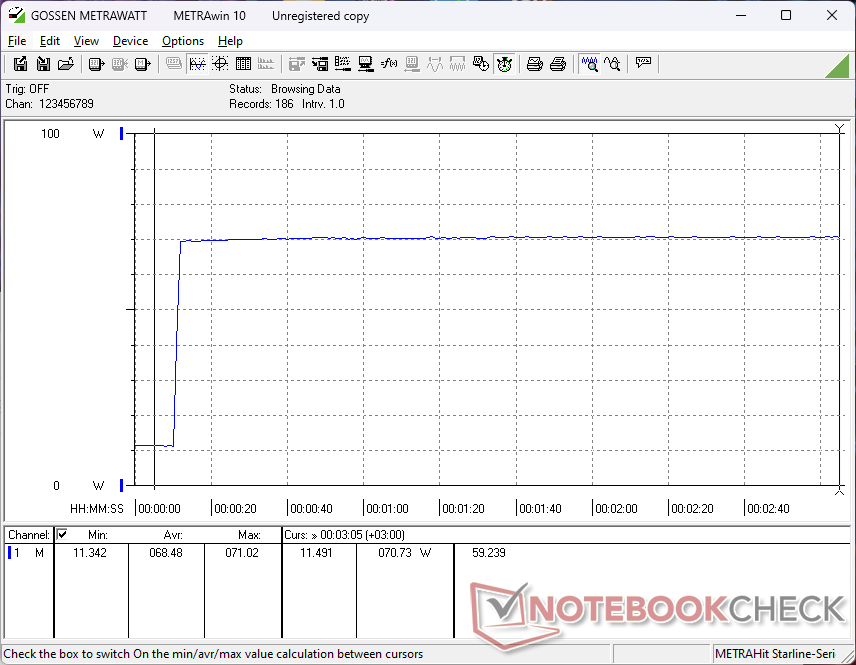
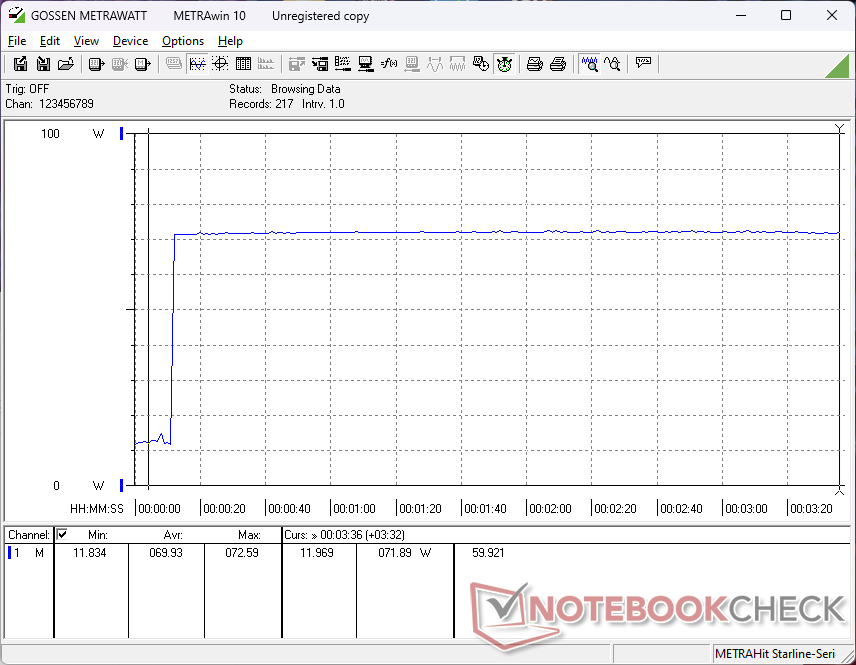
Stroomverbruik
Het verbruik bij stationair draaien op het bureaublad is hoger dan verwacht en bedraagt ongeveer 11 W, zelfs in de energiespaarstand, vergeleken met 6 tot 8 W bij andere modellen zoals de NucBox M6 of de Beelink SER8 Beelink SER8. Bij het uitvoeren van meer veeleisende belastingen zoals 3DMark 06 of Cyberpunk 2077 is het verbruik echter merkbaar lager dan op de snellere NucBox K6.
We zijn in staat om een maximum stroomverbruik van 73 W te registreren op de kleine-medium (~14,5 x 6,4 x 3 cm) 120 W AC adapter. De grote overhead kan worden toegeschreven aan de Thunderbolt 4 poort voor het geval dat aangesloten monitors of accessoires extra stroom nodig hebben.
| Uit / Standby | |
| Inactief | |
| Belasting |
|
Key:
min: | |
| GMK NucBox K9 Ultra 5 125H, Arc 7-Core, MasonSemi 1TB MC7000, , x, | GMK NucBox K6 R7 7840HS, Radeon 780M, MasonSemi 1TB MC7000, , x, | GMK NucBox M6 R5 6600H, Radeon 660M, AirDisk APF 10-512G, , x, | Beelink SER8 R7 8845HS, Radeon 780M, Crucial P3 Plus CT1000P3PSSD8, , x, | Beelink SEi12 Core i5-1235U i5-1235U, Iris Xe G7 80EUs, Kingston NV1 SNVS/500GCN, , x, | BOSGAME M1 R7 7840HS, Radeon 780M, , , x, | |
|---|---|---|---|---|---|---|
| Power Consumption | 10% | 10% | 9% | -43% | 4% | |
| Idle Minimum * | 10.9 | 6.7 39% | 7.9 28% | 7.3 33% | 15.8 -45% | 7.3 33% |
| Idle Average * | 11 | 7 36% | 8 27% | 7.3 34% | 16.8 -53% | 7.3 34% |
| Idle Maximum * | 11.4 | 7.6 33% | 8.3 27% | 8.4 26% | 17 -49% | 8.4 26% |
| Load Average * | 52.8 | 74.3 -41% | 61.5 -16% | 68.2 -29% | 54.4 -3% | 72.7 -38% |
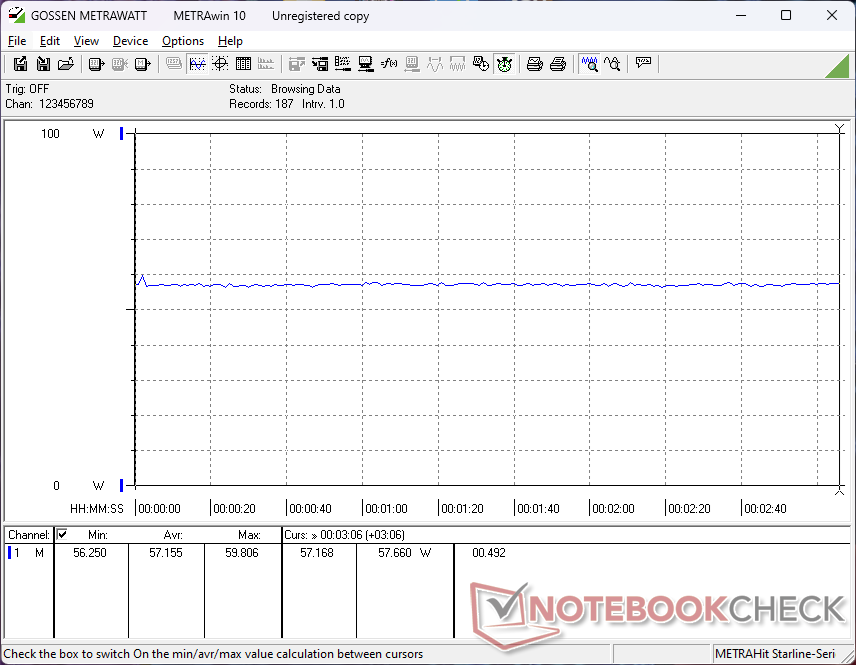
| Cyberpunk 2077 ultra external monitor * | 57.1 | |||||
| Load Maximum * | 72.2 | 85.7 -19% | 84.6 -17% | 84.3 -17% | 119.1 -65% | 99.1 -37% |
| Witcher 3 ultra * | 75 | 47.3 | 75.1 | 50.7 | 80.5 |
* ... kleiner is beter
Power Consumption Prime95+FurMark Stress Test
Power Consumption external Monitor
Pro
Contra
Verdict - nieuwer maar niet sneller
Voor $570 in de uitverkoop met 32 GB RAM en 1 TB aan opslag, vertegenwoordigt de NucBox K9 een goede waarde in vergelijking met de Beelink SER8 die momenteel met $ 630 duurder is bij Amazon. De grootste vijand van GMK is waarschijnlijk GMK zelf, aangezien modellen zoals de NucBox K6 zowel goedkoper als sneller zijn dan de NucBox K9 in wat in wezen hetzelfde chassisontwerp is met dezelfde fysieke kenmerken. In dit scenario is er bijna geen reden om de NucBox K9 te kopen in plaats van de K6, tenzij u de geïntegreerde NPU belangrijker vindt dan rauwe CPU- en GPU-kracht. Zelfs de concurrerende Bosgame M1 is momenteel goedkoper en sneller voor $500. Het klopt dat de NucBox K9 een beetje stiller is, maar dat komt alleen omdat het model om te beginnen ook een beetje langzamer is.
De NucBox K9 is zeker geen slechte mini-PC, maar zijn hogere prijs en langzamere prestaties dan die van de oudere NucBox K6 zullen veel kopers in verwarring brengen, vooral diegenen die niet geïnteresseerd zijn in AI-versnelling.
Naast de prijs- en prestatieverschillen tussen de NucBox K6 en K9 modellen, begint het ontwerp van de serie zijn leeftijd te tonen. Concurrenten zoals Bosgame hebben sterkere metalen chassisontwerpen, terwijl Beelink onlangs zijn SER-serie herontworpen heeft om er veel professioneler en zelfs luxueuzer uit te zien. De overwegend plastic GMK NucBox werkt goed genoeg, maar het is misschien hoog tijd voor een revisie met materialen van hogere kwaliteit of mogelijk gereedschapsloos onderhoud.
Prijs en beschikbaarheid
De GMKtec NucBox K9 wordt nu verzonden zoals geconfigureerd in deze review op Amazon voor $720 (na coupon) of rechtstreeks van de fabrikant voor $570. Een kale SKU is ook verkrijgbaar voor $400.
Opmerking: We hebben ons beoordelingssysteem onlangs bijgewerkt en de resultaten van versie 8 zijn niet vergelijkbaar met de resultaten van versie 7. Meer informatie is beschikbaar hier .
GMK NucBox K9
- 30-10-2024 v8
Allen Ngo
 Total Sustainability Score:
 Transparantie
De selectie van te beoordelen apparaten wordt gemaakt door onze redactie. Het testexemplaar werd ten behoeve van deze beoordeling door de fabrikant of detailhandelaar in bruikleen aan de auteur verstrekt. De kredietverstrekker had geen invloed op deze recensie, noch ontving de fabrikant vóór publicatie een exemplaar van deze recensie. Er bestond geen verplichting om deze recensie te publiceren. Wij accepteren nooit een compensatie of betaling in ruil voor onze beoordelingen. Als onafhankelijk mediabedrijf is Notebookcheck niet onderworpen aan het gezag van fabrikanten, detailhandelaren of uitgevers.
[transparency_disclaimer]Dit is hoe Notebookcheck test
Elk jaar beoordeelt Notebookcheck onafhankelijk honderden laptops en smartphones met behulp van gestandaardiseerde procedures om ervoor te zorgen dat alle resultaten vergelijkbaar zijn. We hebben onze testmethoden al zo'n 20 jaar voortdurend ontwikkeld en daarbij de industriestandaard bepaald. In onze testlaboratoria wordt gebruik gemaakt van hoogwaardige meetapparatuur door ervaren technici en redacteuren. Deze tests omvatten een validatieproces in meerdere fasen. Ons complexe beoordelingssysteem is gebaseerd op honderden goed onderbouwde metingen en benchmarks, waardoor de objectiviteit behouden blijft. Meer informatie over onze testmethoden kunt u hier vinden.
Price comparison

