

GMK NucBox M6 beoordeling: Een uitgebalanceerde mini PC voor minder dan $300

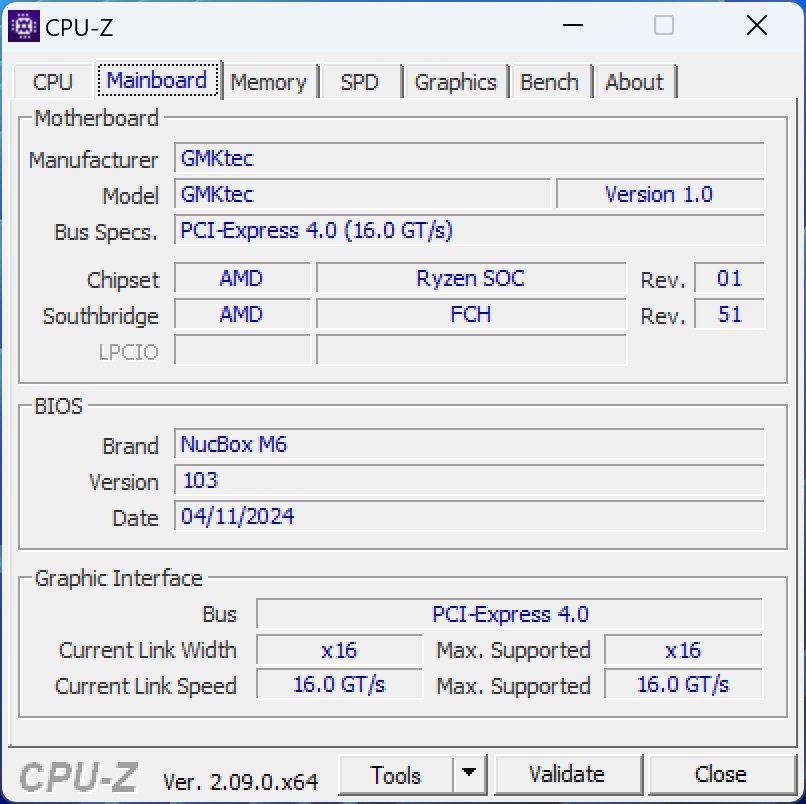
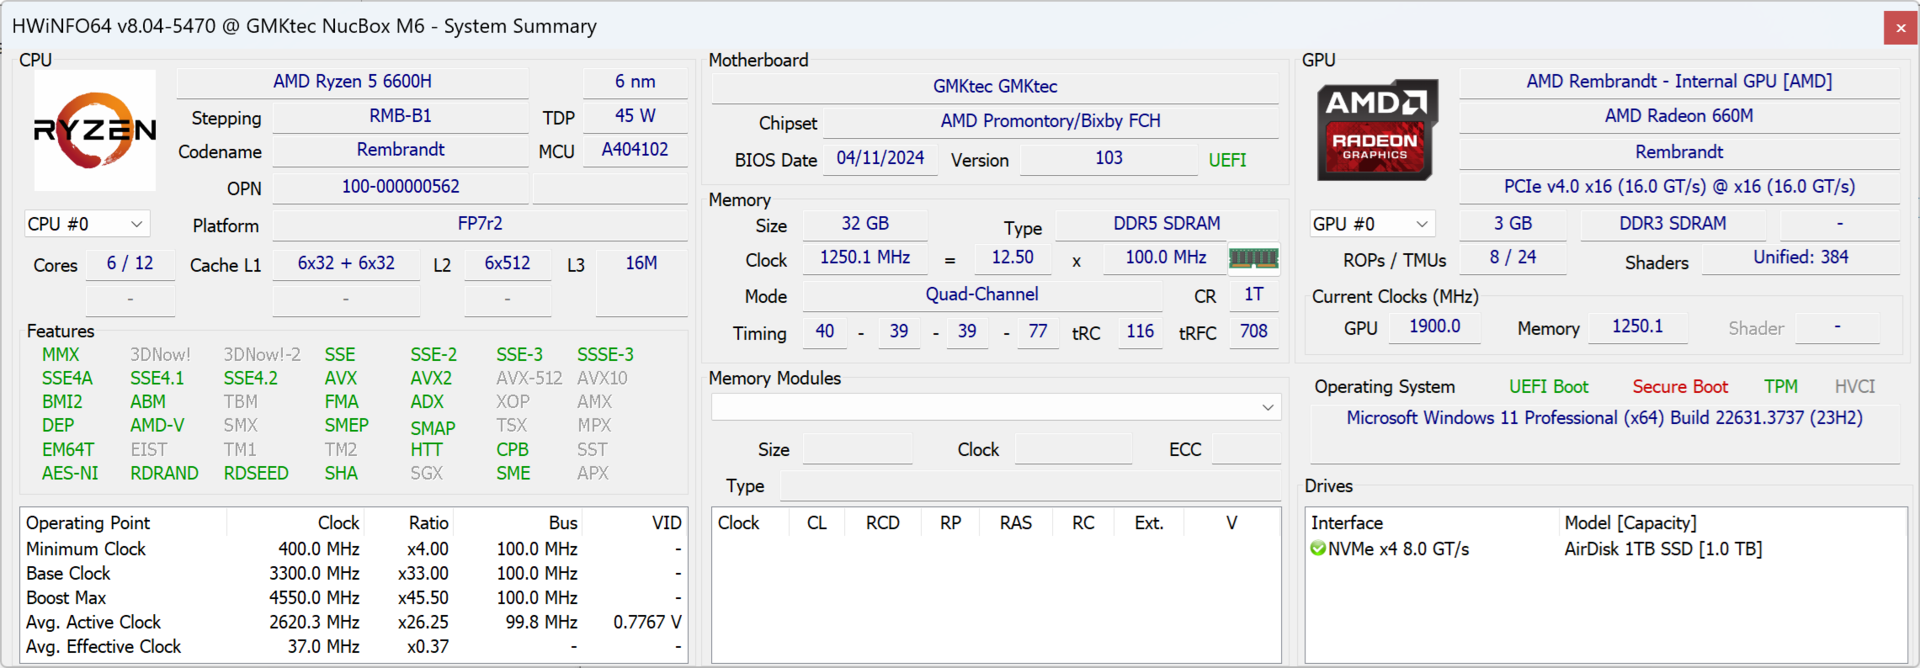
De NucBox M6 is de snellere versie van de NucBox M5. GMK heeft de U-serie Ryzen 7 5700U in de M5 vervangen door de nieuwere H-serie Ryzen 5 6600H in de M6. Het chassisontwerp en de fysieke kenmerken zijn verder ongewijzigd, dus we raden u aan om onze onze review van de M5 te bekijken voor meer informatie over de serie.
Onze reviewconfiguratie wordt verkocht voor $300, compleet met 16 GB RAM, 512 GB SSD en Windows 11 Pro. De vanafprijs kan zelfs nog lager zijn, namelijk slechts $ 230 voor een barebones kit. Alle SKU's worden geleverd met dezelfde zwarte kleuroptie en Ryzen 5 6600H processor.
Concurrenten voor de NucBox M6 zijn andere betaalbare mini-pc's zoals de Beelink SER5, Maxtang MTN-FP750of Geekom Mini IT12.
Meer GMK beoordelingen:
Potentiële concurrenten in vergelijkings
Evaluatie | Versie | Datum | Model | Gewicht | Hoogte | Formaat | Resolutie | Beste prijs |
|---|---|---|---|---|---|---|---|---|
| 63.6 % | v8 | 07-2024 | GMK NucBox M6 R5 6600H, Radeon 660M | 526 g | 48 mm | x | ||
| 78.9 % v7 (old) | v7 (old) | 04-2024 | GMK NucBox M5 R7 5700U, Vega 8 | 505 g | 48 mm | x | ||
| 83.6 % v7 (old) | v7 (old) | 04-2024 | GMK NucBox K6 R7 7840HS, Radeon 780M | 514 g | 47 mm | x | ||
| 84.5 % v7 (old) | v7 (old) | 05-2024 | BOSGAME M1 R7 7840HS, Radeon 780M | 766 g | 51 mm | x | ||
| 82.1 % v7 (old) | v7 (old) | 11-2023 | Beelink SER5 R5 5560U, Vega 6 | 439 g | 42 mm | x | ||
| 80.8 % v7 (old) | v7 (old) | 04-2023 | Intel NUC 13 Pro Kit NUC13ANK i7-1360P, Iris Xe G7 96EUs | 538 g | 37 mm | x |
Hinweis: We hebben ons beoordelingssysteem kürzlich geactualiseerd en de resultaten van versie 8 zijn niet vergelijkbaar met de resultaten van versie 7. Meer informatie vindt u hier beschikbaar.
Opmerking: We hebben ons beoordelingssysteem onlangs bijgewerkt en de resultaten van versie 8 zijn niet vergelijkbaar met de resultaten van versie 7. Meer informatie is beschikbaar hier .
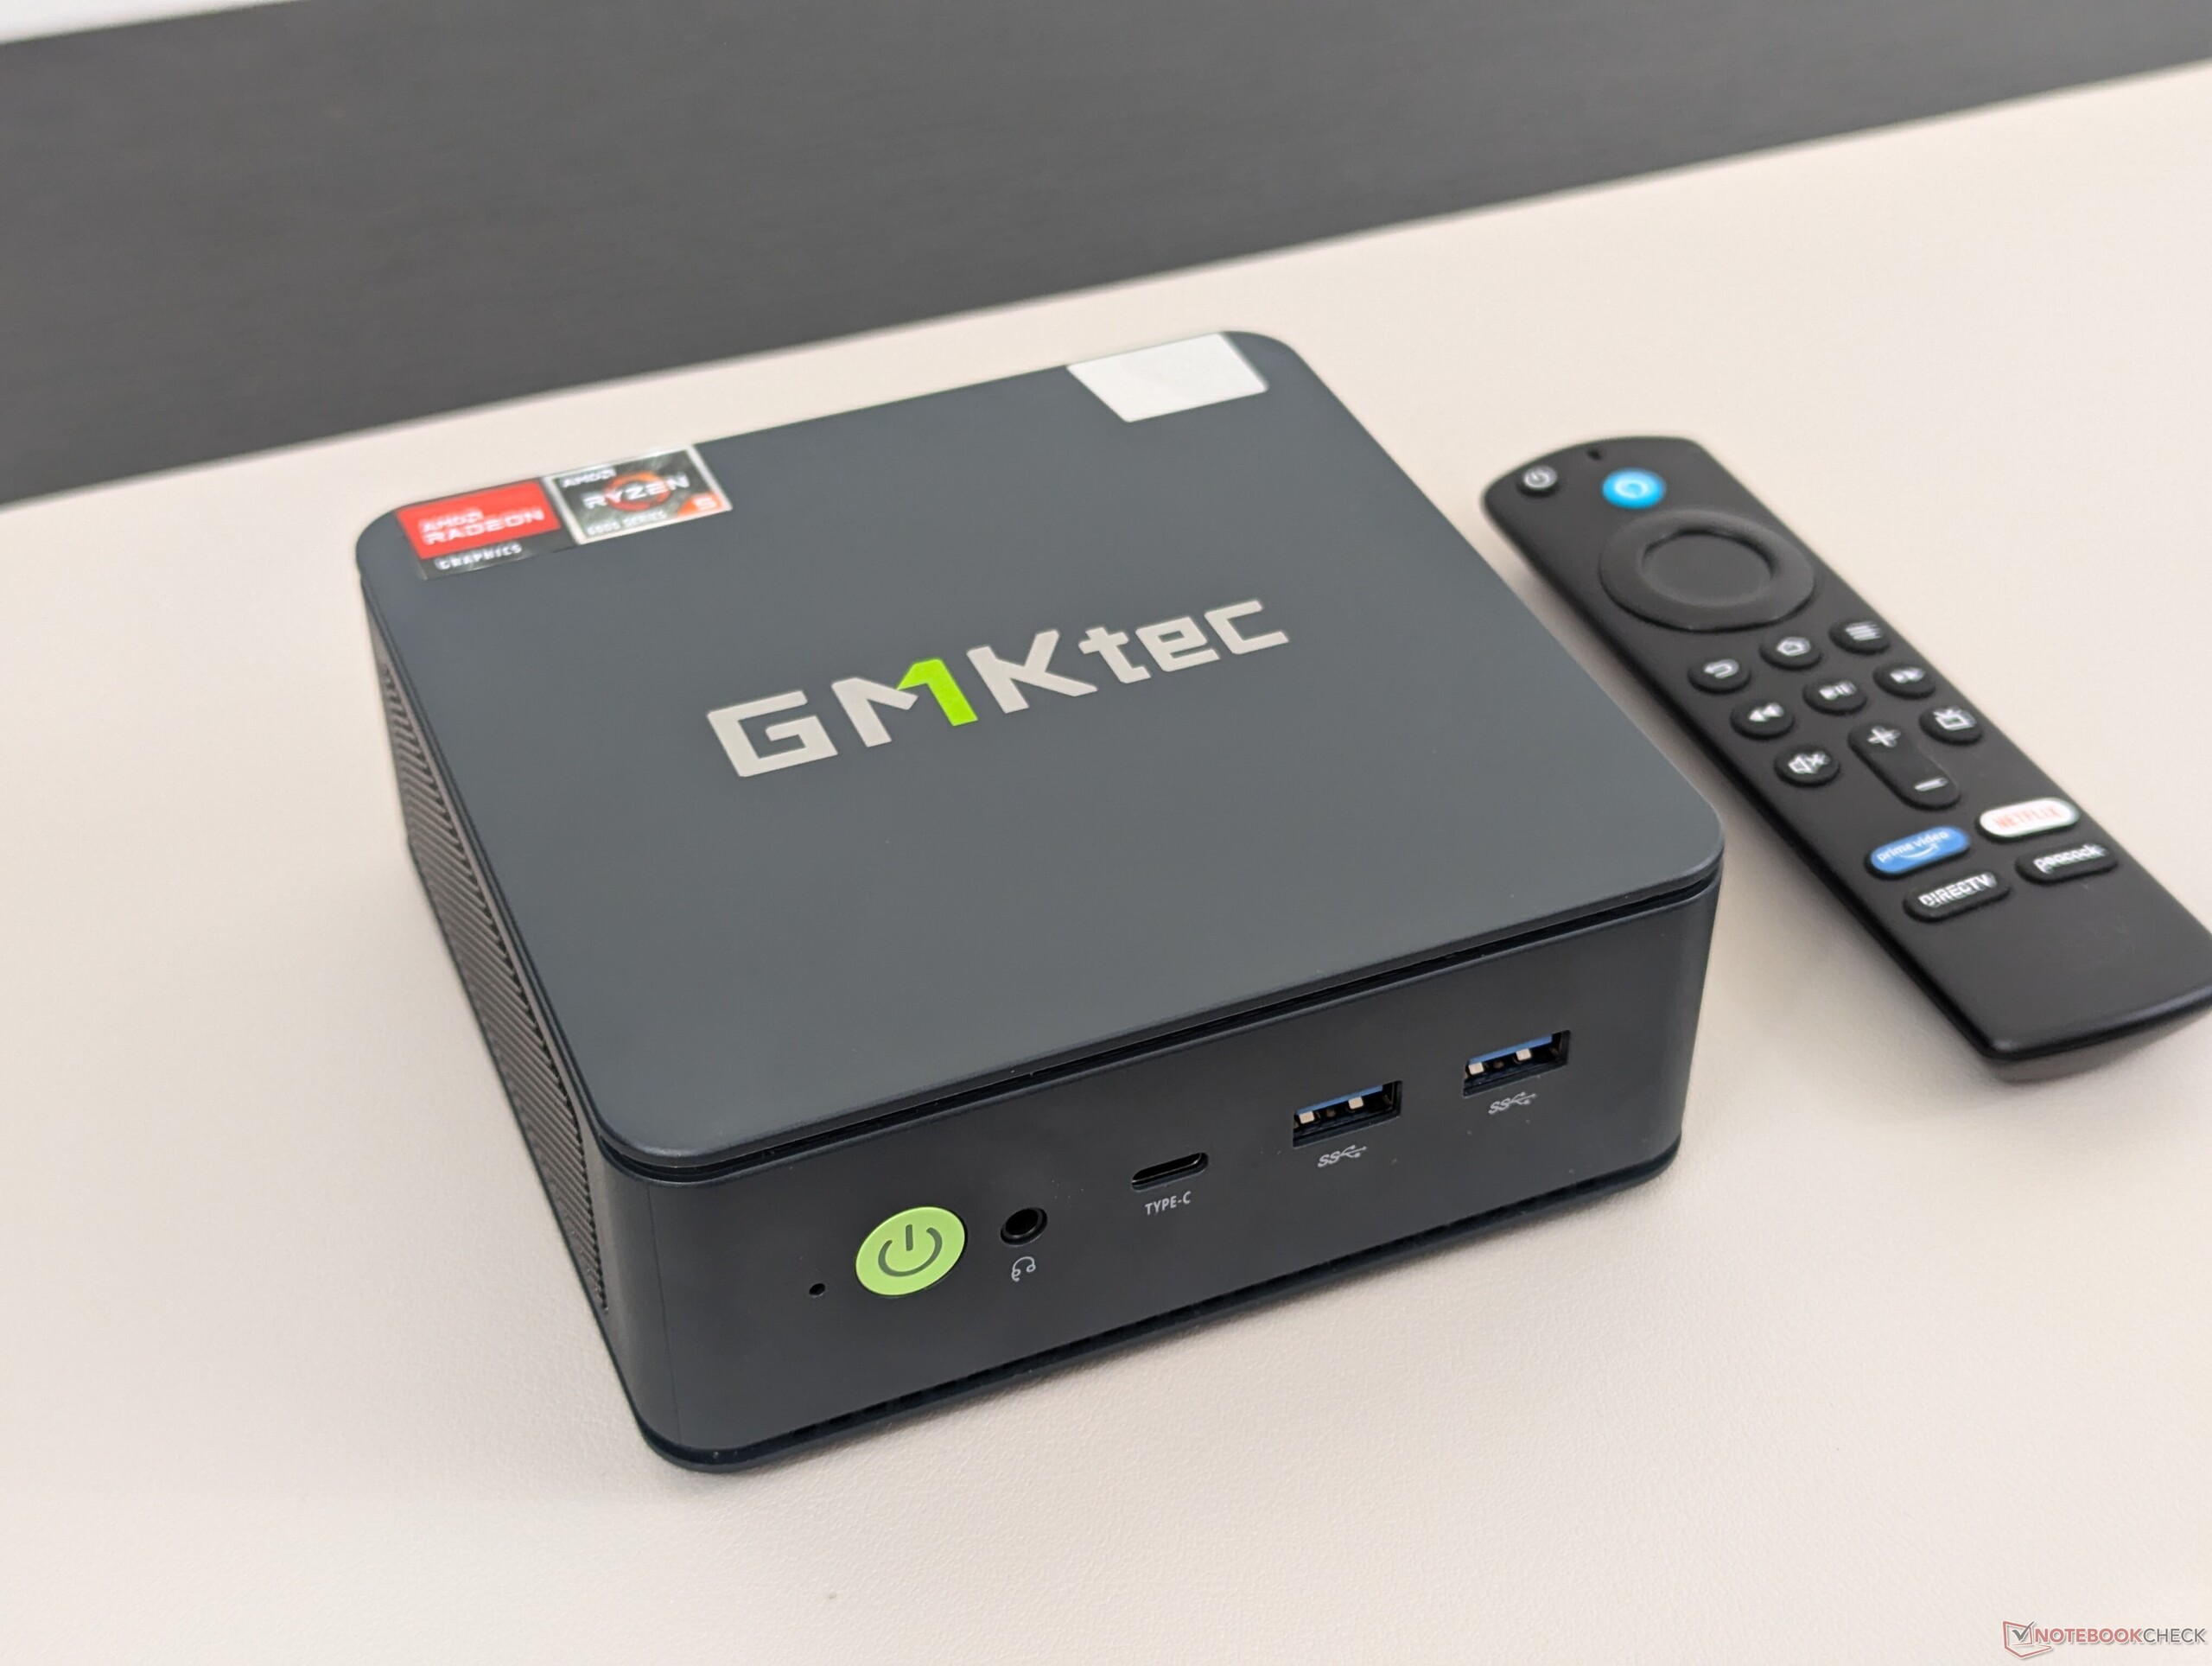
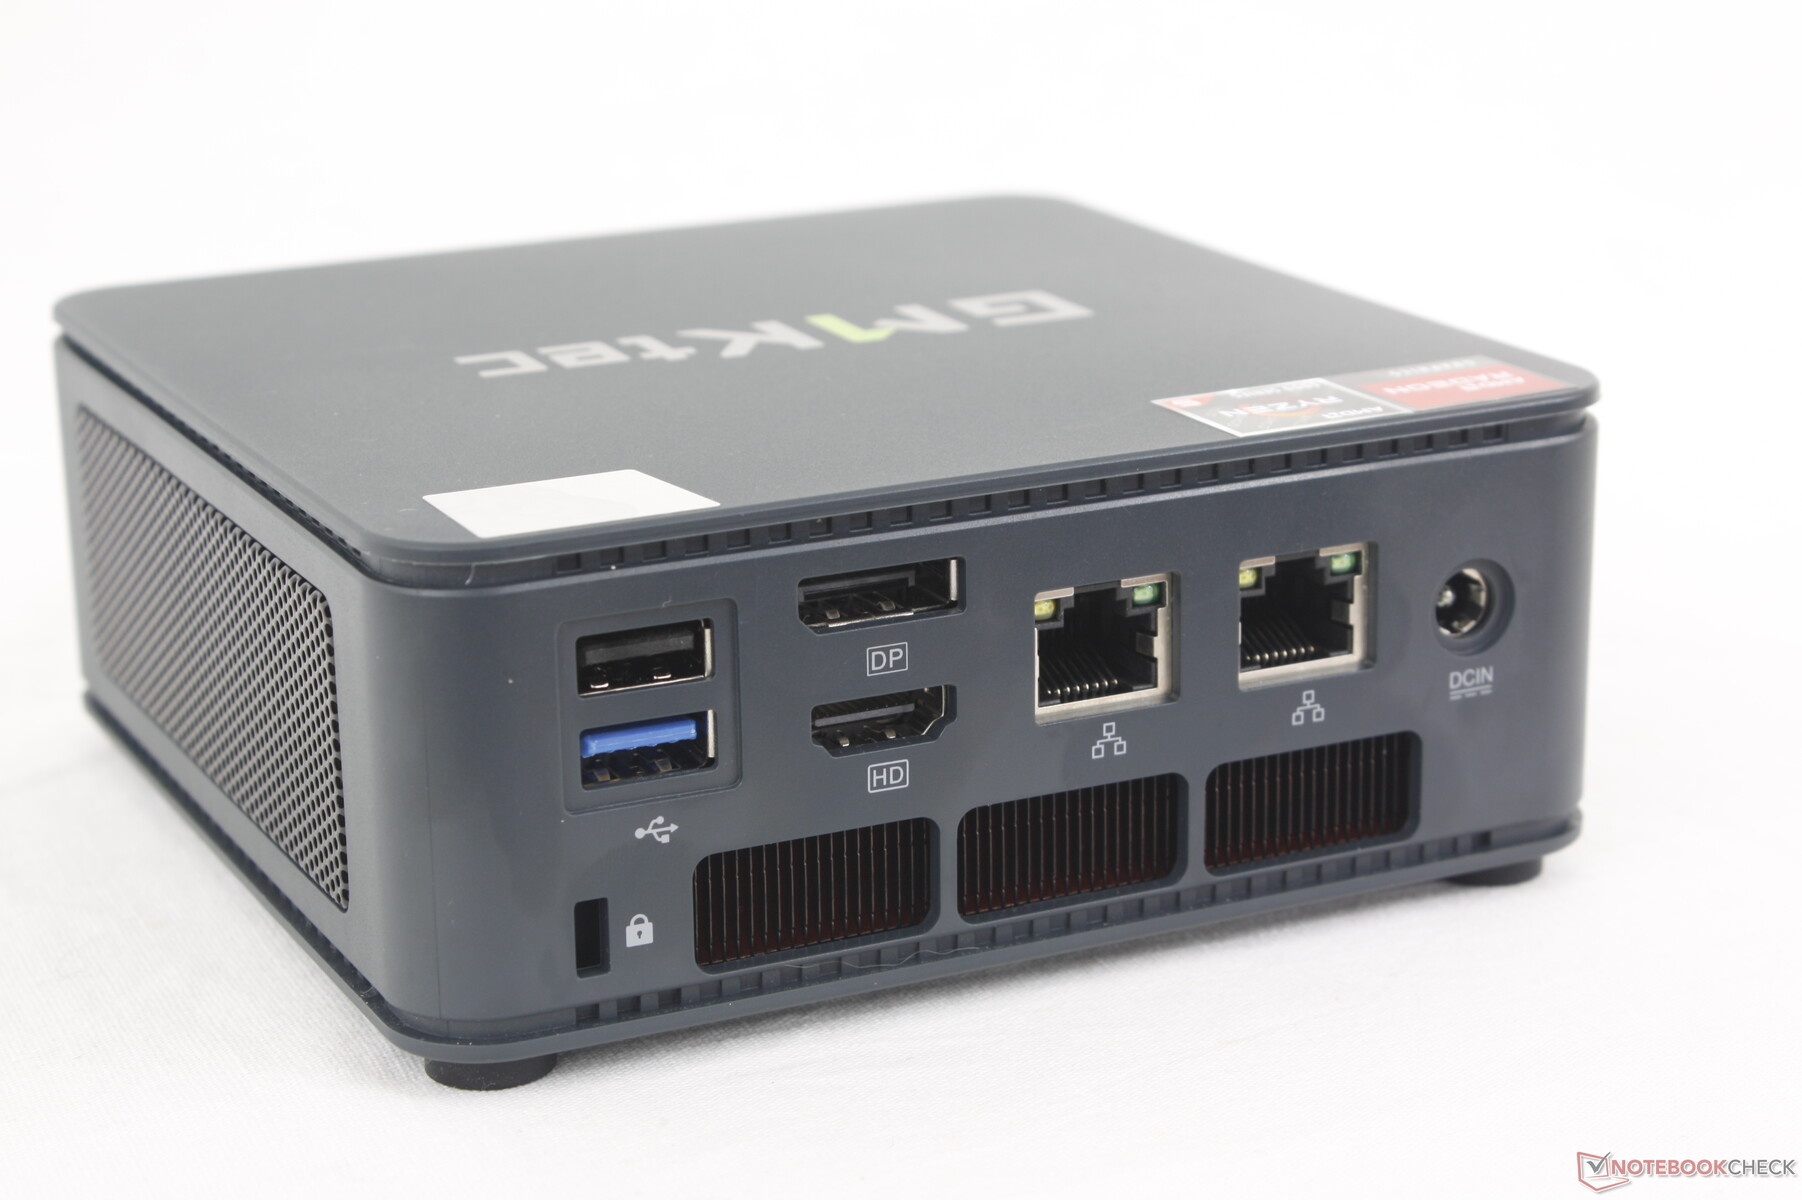
Behuizing - Vertrouwd plastic ontwerp
Connectiviteit
Hoewel de poortopties identiek zijn aan de NucBox M5, is het belangrijk om op te merken dat de M6 geen USB4 ondersteunt, ondanks de marketing van de fabrikant. Apparaatbeheer geeft alleen ondersteuning voor USB 3.2 en geen USB4. Power Delivery en DisplayPort via USB-C worden gelukkig nog wel ondersteund.

Communicatie
Onze WiFi-tests laten zien dat de prestaties sneller zijn op Wi-Fi 6 dan op Wi-Fi 6E, zelfs na meerdere pogingen opnieuw. De Wi-Fi 6E-snelheden zijn abnormaal langzaam, wat wijst op mogelijke antenneproblemen met de MediaTek MT7922-module in ons testapparaat.
| Networking | |
| iperf3 transmit AXE11000 | |
| GMK NucBox M6 | |
| BOSGAME M1 | |
| GMK NucBox M5 | |
| Beelink SER5 | |
| Intel NUC 13 Pro Kit NUC13ANK | |
| GMK NucBox K6 | |
| iperf3 receive AXE11000 | |
| BOSGAME M1 | |
| GMK NucBox M6 | |
| Beelink SER5 | |
| GMK NucBox M5 | |
| GMK NucBox K6 | |
| Intel NUC 13 Pro Kit NUC13ANK | |
| iperf3 transmit AXE11000 6GHz | |
| Intel NUC 13 Pro Kit NUC13ANK | |
| GMK NucBox M5 | |
| BOSGAME M1 | |
| GMK NucBox K6 | |
| GMK NucBox M6 | |
| iperf3 receive AXE11000 6GHz | |
| Intel NUC 13 Pro Kit NUC13ANK | |
| GMK NucBox M5 | |
| BOSGAME M1 | |
| GMK NucBox K6 | |
| GMK NucBox M6 | |
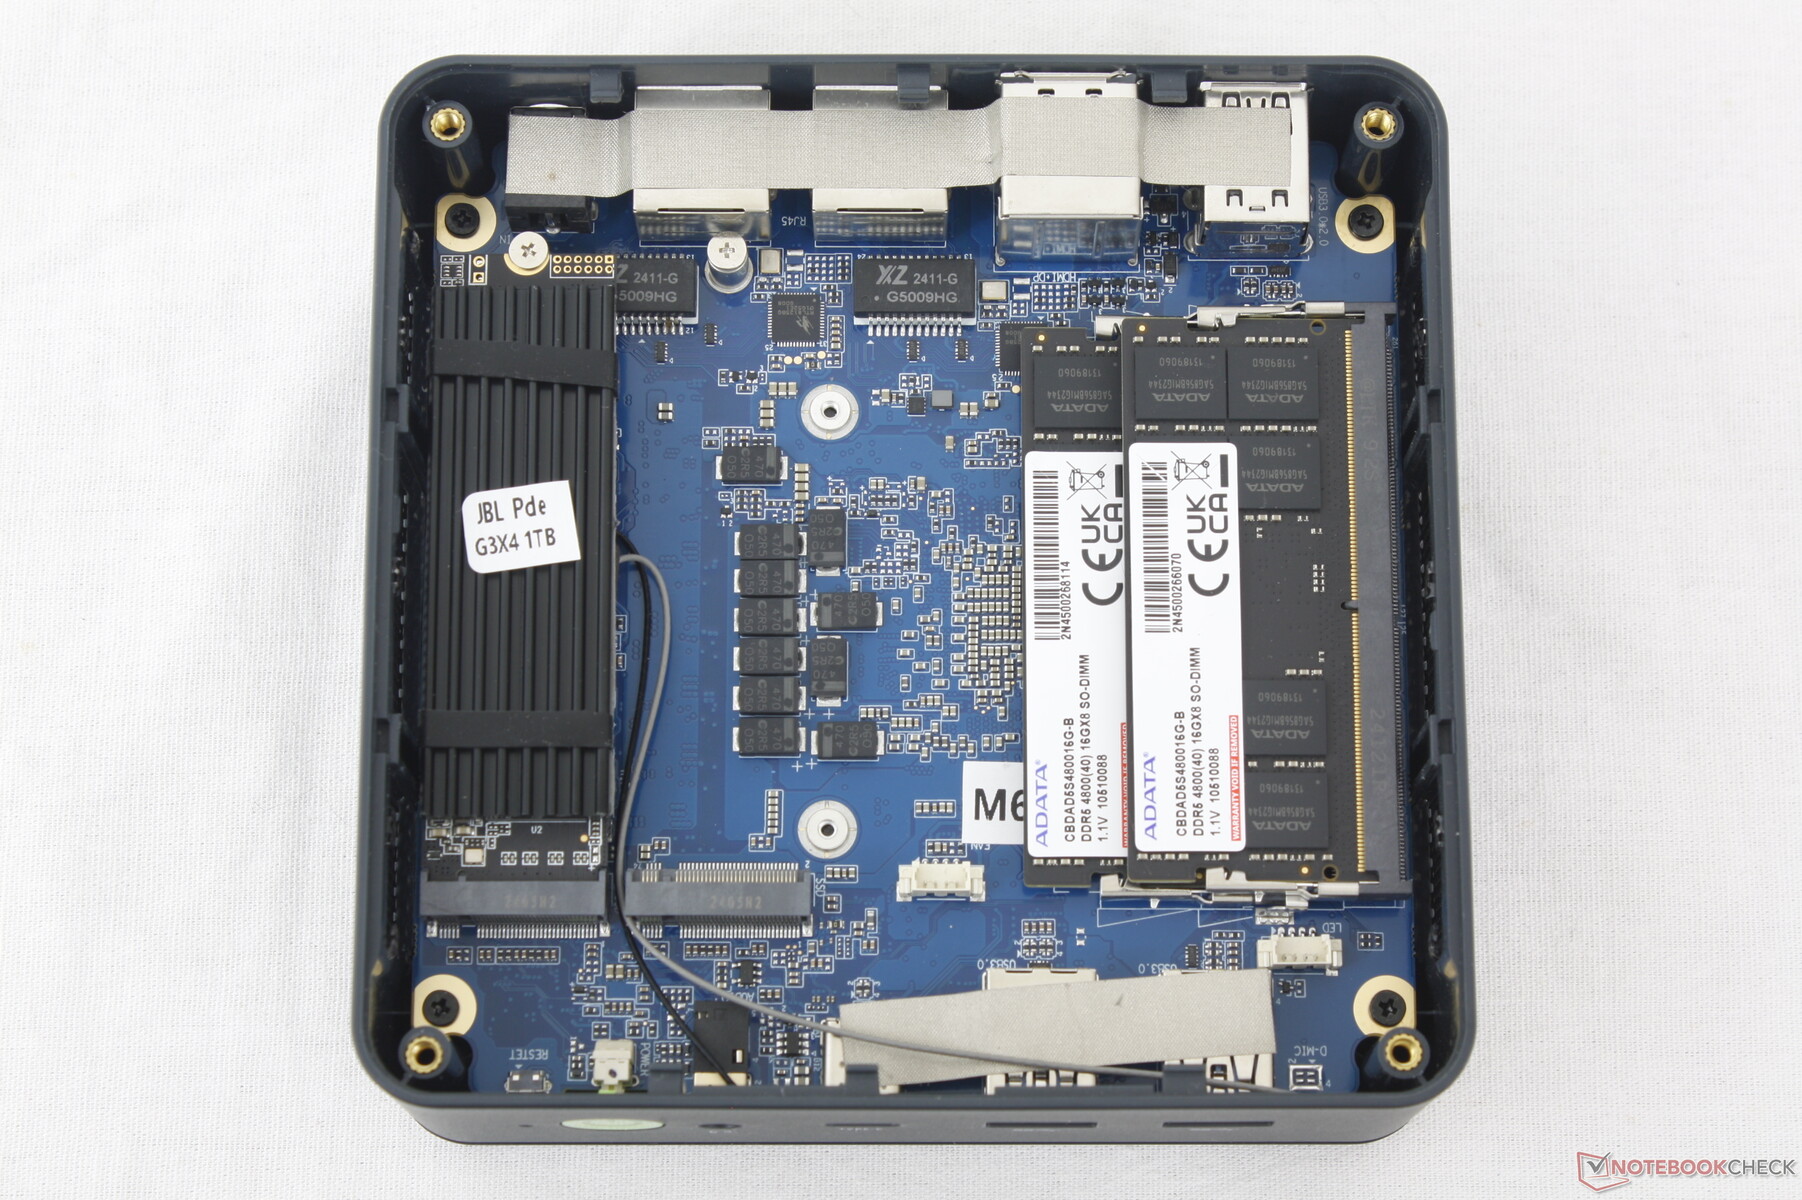
Onderhoud
Het bovenpaneel kan alleen met een kruiskopschroevendraaier worden verwijderd voor eenvoudig onderhoud.

Accessoires en garantie
De verpakking bevat naast de gebruikelijke handleidingen en AC-adapter ook een verwijderbare VESA-bevestiging en HDMI-kabel. Merk op dat USB-C AC-adapters van derden ook gebruikt kunnen worden als ze voldoen aan de stroomvereisten van de mini PC.
Bij aankoop in de VS geldt de gebruikelijke beperkte fabrieksgarantie van een jaar.
Prestaties - Goede CPU voor de prijs
Testomstandigheden
We hebben Windows in de modus Prestaties gezet voordat we de onderstaande benchmarks uitvoerden.
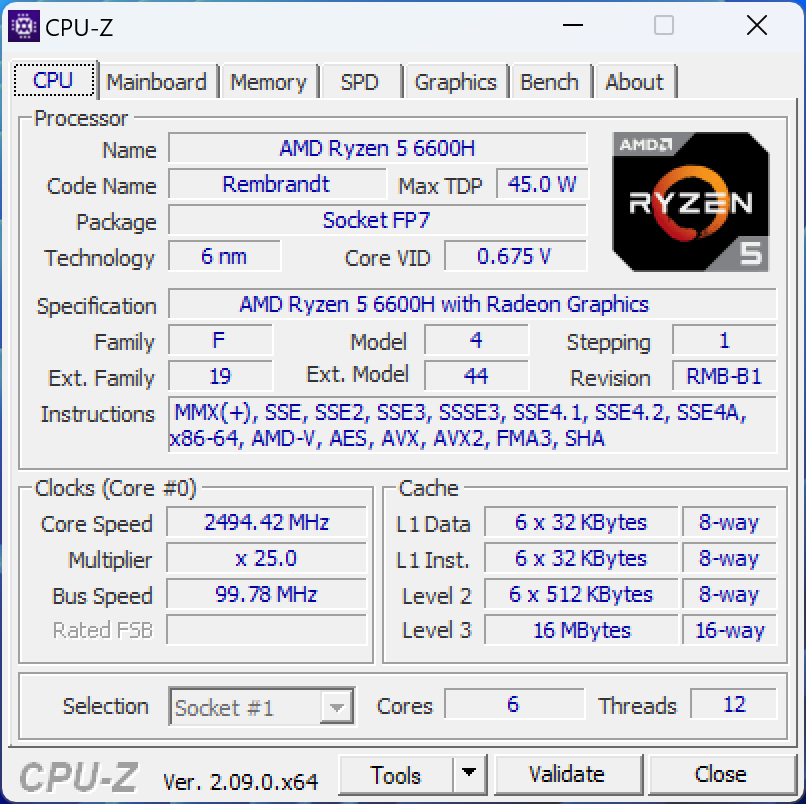
Processor
Voor een middelgrote processor uit 2022 is de Ryzen 5 6600H nog steeds een goede kracht met multi-thread resultaten tussen die van de concurrerende Core i5-12450H en Core i5-12500H. Gebruikers die niet kunnen kiezen tussen de NucBox M5 of M6 zullen merken dat de Ryzen 5 6600H sneller is dan de Ryzen 7 5700U met ongeveer 60 procent.
Cinebench R15 Multi Loop
Cinebench R23: Multi Core | Single Core
Cinebench R20: CPU (Multi Core) | CPU (Single Core)
Cinebench R15: CPU Multi 64Bit | CPU Single 64Bit
Blender: v2.79 BMW27 CPU
7-Zip 18.03: 7z b 4 | 7z b 4 -mmt1
Geekbench 6.4: Multi-Core | Single-Core
Geekbench 5.5: Multi-Core | Single-Core
HWBOT x265 Benchmark v2.2: 4k Preset
LibreOffice : 20 Documents To PDF
R Benchmark 2.5: Overall mean
| CPU Performance Rating | |
| Minisforum AtomMan X7 Ti | |
| Aoostar GEM12 | |
| BOSGAME M1 | |
| Acemagic F2A | |
| HP Elite Mini 800 G9-5M9T9EA | |
| Geekom GT13 Pro | |
| Intel NUC 13 Pro Kit NUC13ANK -2! | |
| Geekom XT12 Pro | |
| Aorus 15 YE5-54DEB34SH | |
| Aoostar GEM10 | |
| GMK NucBox M6 | |
| Maxtang MTN-FP750 | |
| Gemiddeld AMD Ryzen 5 6600H | |
| Geekom Mini IT12 | |
| Acemagic AD15 | |
| GMK NucBox M5 | |
| Intel NUC11TNKi5 -2! | |
| Cinebench R23 / Multi Core | |
| Acemagic F2A | |
| Minisforum AtomMan X7 Ti | |
| Aoostar GEM12 | |
| BOSGAME M1 | |
| HP Elite Mini 800 G9-5M9T9EA | |
| Aorus 15 YE5-54DEB34SH | |
| Aoostar GEM10 | |
| Geekom GT13 Pro | |
| Intel NUC 13 Pro Kit NUC13ANK | |
| Maxtang MTN-FP750 | |
| Geekom XT12 Pro | |
| Gemiddeld AMD Ryzen 5 6600H (10226 - 10717, n=3) | |
| GMK NucBox M6 | |
| Geekom Mini IT12 | |
| Acemagic AD15 | |
| GMK NucBox M5 | |
| Intel NUC11TNKi5 | |
| Cinebench R23 / Single Core | |
| Intel NUC 13 Pro Kit NUC13ANK | |
| Minisforum AtomMan X7 Ti | |
| Geekom XT12 Pro | |
| Aoostar GEM12 | |
| HP Elite Mini 800 G9-5M9T9EA | |
| Acemagic F2A | |
| BOSGAME M1 | |
| Geekom GT13 Pro | |
| Aorus 15 YE5-54DEB34SH | |
| Geekom Mini IT12 | |
| Maxtang MTN-FP750 | |
| Aoostar GEM10 | |
| GMK NucBox M6 | |
| Acemagic AD15 | |
| Gemiddeld AMD Ryzen 5 6600H (1458 - 1486, n=3) | |
| Intel NUC11TNKi5 | |
| GMK NucBox M5 | |
| Cinebench R20 / CPU (Multi Core) | |
| Minisforum AtomMan X7 Ti | |
| Acemagic F2A | |
| BOSGAME M1 | |
| Aoostar GEM12 | |
| HP Elite Mini 800 G9-5M9T9EA | |
| Aoostar GEM10 | |
| Aorus 15 YE5-54DEB34SH | |
| Geekom GT13 Pro | |
| Intel NUC 13 Pro Kit NUC13ANK | |
| Maxtang MTN-FP750 | |
| Geekom XT12 Pro | |
| GMK NucBox M6 | |
| Gemiddeld AMD Ryzen 5 6600H (3965 - 4141, n=3) | |
| Geekom Mini IT12 | |
| Acemagic AD15 | |
| GMK NucBox M5 | |
| Intel NUC11TNKi5 | |
| Cinebench R20 / CPU (Single Core) | |
| Intel NUC 13 Pro Kit NUC13ANK | |
| Minisforum AtomMan X7 Ti | |
| Geekom XT12 Pro | |
| Aoostar GEM12 | |
| HP Elite Mini 800 G9-5M9T9EA | |
| BOSGAME M1 | |
| Acemagic F2A | |
| Geekom GT13 Pro | |
| Aorus 15 YE5-54DEB34SH | |
| Geekom Mini IT12 | |
| Maxtang MTN-FP750 | |
| Aoostar GEM10 | |
| GMK NucBox M6 | |
| Gemiddeld AMD Ryzen 5 6600H (564 - 584, n=3) | |
| Acemagic AD15 | |
| Intel NUC11TNKi5 | |
| GMK NucBox M5 | |
| Cinebench R15 / CPU Multi 64Bit | |
| Minisforum AtomMan X7 Ti | |
| Acemagic F2A | |
| BOSGAME M1 | |
| Aoostar GEM12 | |
| HP Elite Mini 800 G9-5M9T9EA | |
| Aorus 15 YE5-54DEB34SH | |
| Geekom GT13 Pro | |
| Geekom XT12 Pro | |
| Aoostar GEM10 | |
| Intel NUC 13 Pro Kit NUC13ANK | |
| Maxtang MTN-FP750 | |
| GMK NucBox M6 | |
| Gemiddeld AMD Ryzen 5 6600H (1626 - 1740, n=3) | |
| Acemagic AD15 | |
| Geekom Mini IT12 | |
| GMK NucBox M5 | |
| Intel NUC11TNKi5 | |
| Cinebench R15 / CPU Single 64Bit | |
| Aoostar GEM12 | |
| BOSGAME M1 | |
| Intel NUC 13 Pro Kit NUC13ANK | |
| Minisforum AtomMan X7 Ti | |
| Acemagic F2A | |
| HP Elite Mini 800 G9-5M9T9EA | |
| Geekom XT12 Pro | |
| Aorus 15 YE5-54DEB34SH | |
| Maxtang MTN-FP750 | |
| Geekom GT13 Pro | |
| GMK NucBox M6 | |
| Aoostar GEM10 | |
| Geekom Mini IT12 | |
| Gemiddeld AMD Ryzen 5 6600H (231 - 243, n=3) | |
| Acemagic AD15 | |
| Intel NUC11TNKi5 | |
| GMK NucBox M5 | |
| Blender / v2.79 BMW27 CPU | |
| Intel NUC11TNKi5 | |
| GMK NucBox M5 | |
| Geekom Mini IT12 | |
| Acemagic AD15 | |
| Gemiddeld AMD Ryzen 5 6600H (291 - 306, n=3) | |
| Geekom XT12 Pro | |
| GMK NucBox M6 | |
| Maxtang MTN-FP750 | |
| Intel NUC 13 Pro Kit NUC13ANK | |
| Geekom GT13 Pro | |
| Aoostar GEM10 | |
| Aorus 15 YE5-54DEB34SH | |
| HP Elite Mini 800 G9-5M9T9EA | |
| Aoostar GEM12 | |
| BOSGAME M1 | |
| Acemagic F2A | |
| Minisforum AtomMan X7 Ti | |
| 7-Zip 18.03 / 7z b 4 -mmt1 | |
| Aoostar GEM12 | |
| BOSGAME M1 | |
| Geekom GT13 Pro | |
| Intel NUC 13 Pro Kit NUC13ANK | |
| HP Elite Mini 800 G9-5M9T9EA | |
| Geekom XT12 Pro | |
| Maxtang MTN-FP750 | |
| GMK NucBox M6 | |
| Gemiddeld AMD Ryzen 5 6600H (5466 - 5720, n=3) | |
| Minisforum AtomMan X7 Ti | |
| Aoostar GEM10 | |
| Acemagic AD15 | |
| Acemagic F2A | |
| Aorus 15 YE5-54DEB34SH | |
| Geekom Mini IT12 | |
| Intel NUC11TNKi5 | |
| GMK NucBox M5 | |
| Geekbench 6.4 / Multi-Core | |
| Minisforum AtomMan X7 Ti | |
| BOSGAME M1 | |
| Aoostar GEM12 | |
| Acemagic F2A | |
| Geekom GT13 Pro | |
| Aorus 15 YE5-54DEB34SH | |
| HP Elite Mini 800 G9-5M9T9EA | |
| Geekom XT12 Pro | |
| Aoostar GEM10 | |
| GMK NucBox M6 | |
| Gemiddeld AMD Ryzen 5 6600H (n=1) | |
| Geekom Mini IT12 | |
| Acemagic AD15 | |
| Maxtang MTN-FP750 | |
| GMK NucBox M5 | |
| Geekbench 6.4 / Single-Core | |
| Aoostar GEM12 | |
| BOSGAME M1 | |
| Geekom GT13 Pro | |
| Minisforum AtomMan X7 Ti | |
| HP Elite Mini 800 G9-5M9T9EA | |
| Geekom XT12 Pro | |
| Acemagic F2A | |
| Aorus 15 YE5-54DEB34SH | |
| Geekom Mini IT12 | |
| Acemagic AD15 | |
| Maxtang MTN-FP750 | |
| Aoostar GEM10 | |
| GMK NucBox M6 | |
| Gemiddeld AMD Ryzen 5 6600H (n=1) | |
| GMK NucBox M5 | |
| Geekbench 5.5 / Multi-Core | |
| Minisforum AtomMan X7 Ti | |
| Acemagic F2A | |
| Aoostar GEM12 | |
| BOSGAME M1 | |
| Geekom GT13 Pro | |
| Intel NUC 13 Pro Kit NUC13ANK | |
| Aorus 15 YE5-54DEB34SH | |
| HP Elite Mini 800 G9-5M9T9EA | |
| Geekom XT12 Pro | |
| Aoostar GEM10 | |
| GMK NucBox M6 | |
| Geekom Mini IT12 | |
| Gemiddeld AMD Ryzen 5 6600H (6403 - 8195, n=3) | |
| Maxtang MTN-FP750 | |
| Acemagic AD15 | |
| GMK NucBox M5 | |
| Intel NUC11TNKi5 | |
| Geekbench 5.5 / Single-Core | |
| Aoostar GEM12 | |
| BOSGAME M1 | |
| Minisforum AtomMan X7 Ti | |
| Intel NUC 13 Pro Kit NUC13ANK | |
| Geekom GT13 Pro | |
| HP Elite Mini 800 G9-5M9T9EA | |
| Geekom XT12 Pro | |
| Acemagic F2A | |
| Geekom Mini IT12 | |
| Aorus 15 YE5-54DEB34SH | |
| Acemagic AD15 | |
| Aoostar GEM10 | |
| Maxtang MTN-FP750 | |
| GMK NucBox M6 | |
| Gemiddeld AMD Ryzen 5 6600H (1446 - 1513, n=3) | |
| Intel NUC11TNKi5 | |
| GMK NucBox M5 | |
| HWBOT x265 Benchmark v2.2 / 4k Preset | |
| Minisforum AtomMan X7 Ti | |
| Aoostar GEM12 | |
| BOSGAME M1 | |
| Acemagic F2A | |
| HP Elite Mini 800 G9-5M9T9EA | |
| Aorus 15 YE5-54DEB34SH | |
| Aoostar GEM10 | |
| Intel NUC 13 Pro Kit NUC13ANK | |
| Geekom GT13 Pro | |
| GMK NucBox M6 | |
| Gemiddeld AMD Ryzen 5 6600H (11.5 - 14.2, n=3) | |
| Maxtang MTN-FP750 | |
| Geekom XT12 Pro | |
| Geekom Mini IT12 | |
| Acemagic AD15 | |
| GMK NucBox M5 | |
| Intel NUC11TNKi5 | |
| LibreOffice / 20 Documents To PDF | |
| Aorus 15 YE5-54DEB34SH | |
| GMK NucBox M5 | |
| Gemiddeld AMD Ryzen 5 6600H (52.4 - 60, n=3) | |
| Maxtang MTN-FP750 | |
| Geekom Mini IT12 | |
| HP Elite Mini 800 G9-5M9T9EA | |
| GMK NucBox M6 | |
| Intel NUC11TNKi5 | |
| Aoostar GEM10 | |
| Minisforum AtomMan X7 Ti | |
| Aoostar GEM12 | |
| BOSGAME M1 | |
| Acemagic F2A | |
| Intel NUC 13 Pro Kit NUC13ANK | |
| Acemagic AD15 | |
| Geekom XT12 Pro | |
| Geekom GT13 Pro | |
| R Benchmark 2.5 / Overall mean | |
| Intel NUC11TNKi5 | |
| GMK NucBox M5 | |
| Acemagic AD15 | |
| Aorus 15 YE5-54DEB34SH | |
| Aoostar GEM10 | |
| Gemiddeld AMD Ryzen 5 6600H (0.4995 - 0.532, n=3) | |
| Maxtang MTN-FP750 | |
| Geekom Mini IT12 | |
| GMK NucBox M6 | |
| Acemagic F2A | |
| Geekom XT12 Pro | |
| Minisforum AtomMan X7 Ti | |
| HP Elite Mini 800 G9-5M9T9EA | |
| Intel NUC 13 Pro Kit NUC13ANK | |
| BOSGAME M1 | |
| Geekom GT13 Pro | |
| Aoostar GEM12 | |
Cinebench R23: Multi Core | Single Core
Cinebench R20: CPU (Multi Core) | CPU (Single Core)
Cinebench R15: CPU Multi 64Bit | CPU Single 64Bit
Blender: v2.79 BMW27 CPU
7-Zip 18.03: 7z b 4 | 7z b 4 -mmt1
Geekbench 6.4: Multi-Core | Single-Core
Geekbench 5.5: Multi-Core | Single-Core
HWBOT x265 Benchmark v2.2: 4k Preset
LibreOffice : 20 Documents To PDF
R Benchmark 2.5: Overall mean
* ... kleiner is beter
AIDA64: FP32 Ray-Trace | FPU Julia | CPU SHA3 | CPU Queen | FPU SinJulia | FPU Mandel | CPU AES | CPU ZLib | FP64 Ray-Trace | CPU PhotoWorxx
| Performance Rating | |
| BOSGAME M1 | |
| GMK NucBox K6 | |
| GMK NucBox M6 | |
| Gemiddeld AMD Ryzen 5 6600H | |
| Intel NUC 13 Pro Kit NUC13ANK | |
| Beelink SER5 | |
| GMK NucBox M5 | |
| AIDA64 / FP32 Ray-Trace | |
| BOSGAME M1 | |
| GMK NucBox K6 | |
| Gemiddeld AMD Ryzen 5 6600H (12156 - 12871, n=3) | |
| GMK NucBox M6 | |
| Intel NUC 13 Pro Kit NUC13ANK | |
| Beelink SER5 | |
| GMK NucBox M5 | |
| AIDA64 / FPU Julia | |
| BOSGAME M1 | |
| GMK NucBox K6 | |
| GMK NucBox M6 | |
| Gemiddeld AMD Ryzen 5 6600H (75025 - 78277, n=3) | |
| Beelink SER5 | |
| Intel NUC 13 Pro Kit NUC13ANK | |
| GMK NucBox M5 | |
| AIDA64 / CPU SHA3 | |
| BOSGAME M1 | |
| GMK NucBox K6 | |
| Intel NUC 13 Pro Kit NUC13ANK | |
| GMK NucBox M6 | |
| Gemiddeld AMD Ryzen 5 6600H (2606 - 2689, n=3) | |
| Beelink SER5 | |
| GMK NucBox M5 | |
| AIDA64 / CPU Queen | |
| BOSGAME M1 | |
| GMK NucBox K6 | |
| Intel NUC 13 Pro Kit NUC13ANK | |
| GMK NucBox M6 | |
| Gemiddeld AMD Ryzen 5 6600H (78765 - 82119, n=3) | |
| GMK NucBox M5 | |
| Beelink SER5 | |
| AIDA64 / FPU SinJulia | |
| BOSGAME M1 | |
| GMK NucBox K6 | |
| GMK NucBox M5 | |
| GMK NucBox M6 | |
| Gemiddeld AMD Ryzen 5 6600H (9184 - 9739, n=3) | |
| Beelink SER5 | |
| Intel NUC 13 Pro Kit NUC13ANK | |
| AIDA64 / FPU Mandel | |
| BOSGAME M1 | |
| GMK NucBox K6 | |
| GMK NucBox M6 | |
| Gemiddeld AMD Ryzen 5 6600H (41153 - 43222, n=3) | |
| Beelink SER5 | |
| Intel NUC 13 Pro Kit NUC13ANK | |
| GMK NucBox M5 | |
| AIDA64 / CPU AES | |
| BOSGAME M1 | |
| GMK NucBox K6 | |
| GMK NucBox M6 | |
| Gemiddeld AMD Ryzen 5 6600H (100609 - 104138, n=3) | |
| Intel NUC 13 Pro Kit NUC13ANK | |
| Beelink SER5 | |
| GMK NucBox M5 | |
| AIDA64 / CPU ZLib | |
| BOSGAME M1 | |
| GMK NucBox K6 | |
| Intel NUC 13 Pro Kit NUC13ANK | |
| GMK NucBox M6 | |
| Gemiddeld AMD Ryzen 5 6600H (634 - 660, n=3) | |
| GMK NucBox M5 | |
| Beelink SER5 | |
| AIDA64 / FP64 Ray-Trace | |
| BOSGAME M1 | |
| GMK NucBox K6 | |
| Gemiddeld AMD Ryzen 5 6600H (6545 - 6911, n=3) | |
| GMK NucBox M6 | |
| Intel NUC 13 Pro Kit NUC13ANK | |
| Beelink SER5 | |
| GMK NucBox M5 | |
| AIDA64 / CPU PhotoWorxx | |
| BOSGAME M1 | |
| GMK NucBox K6 | |
| GMK NucBox M6 | |
| Intel NUC 13 Pro Kit NUC13ANK | |
| GMK NucBox M5 | |
| Gemiddeld AMD Ryzen 5 6600H (16218 - 29621, n=3) | |
| Beelink SER5 | |
Stresstest
De CPU steeg naar 4,1 GHz, 54 W en 78 C tijdens het uitvoeren van Prime95 stress, voordat hij een paar seconden later snel daalde en stabiliseerde naar 3,9 GHz en 50 W. Hoewel de maximale Turbo Core-prestaties niet onbeperkt zijn, is de daling verrassend marginaal.
De kerntemperatuur stabiliseert zich op slechts 64 C bij het uitvoeren van Witcher 3 om typische gamingbelastingen weer te geven, wat vergelijkbaar is met de langzamere NucBox M5.
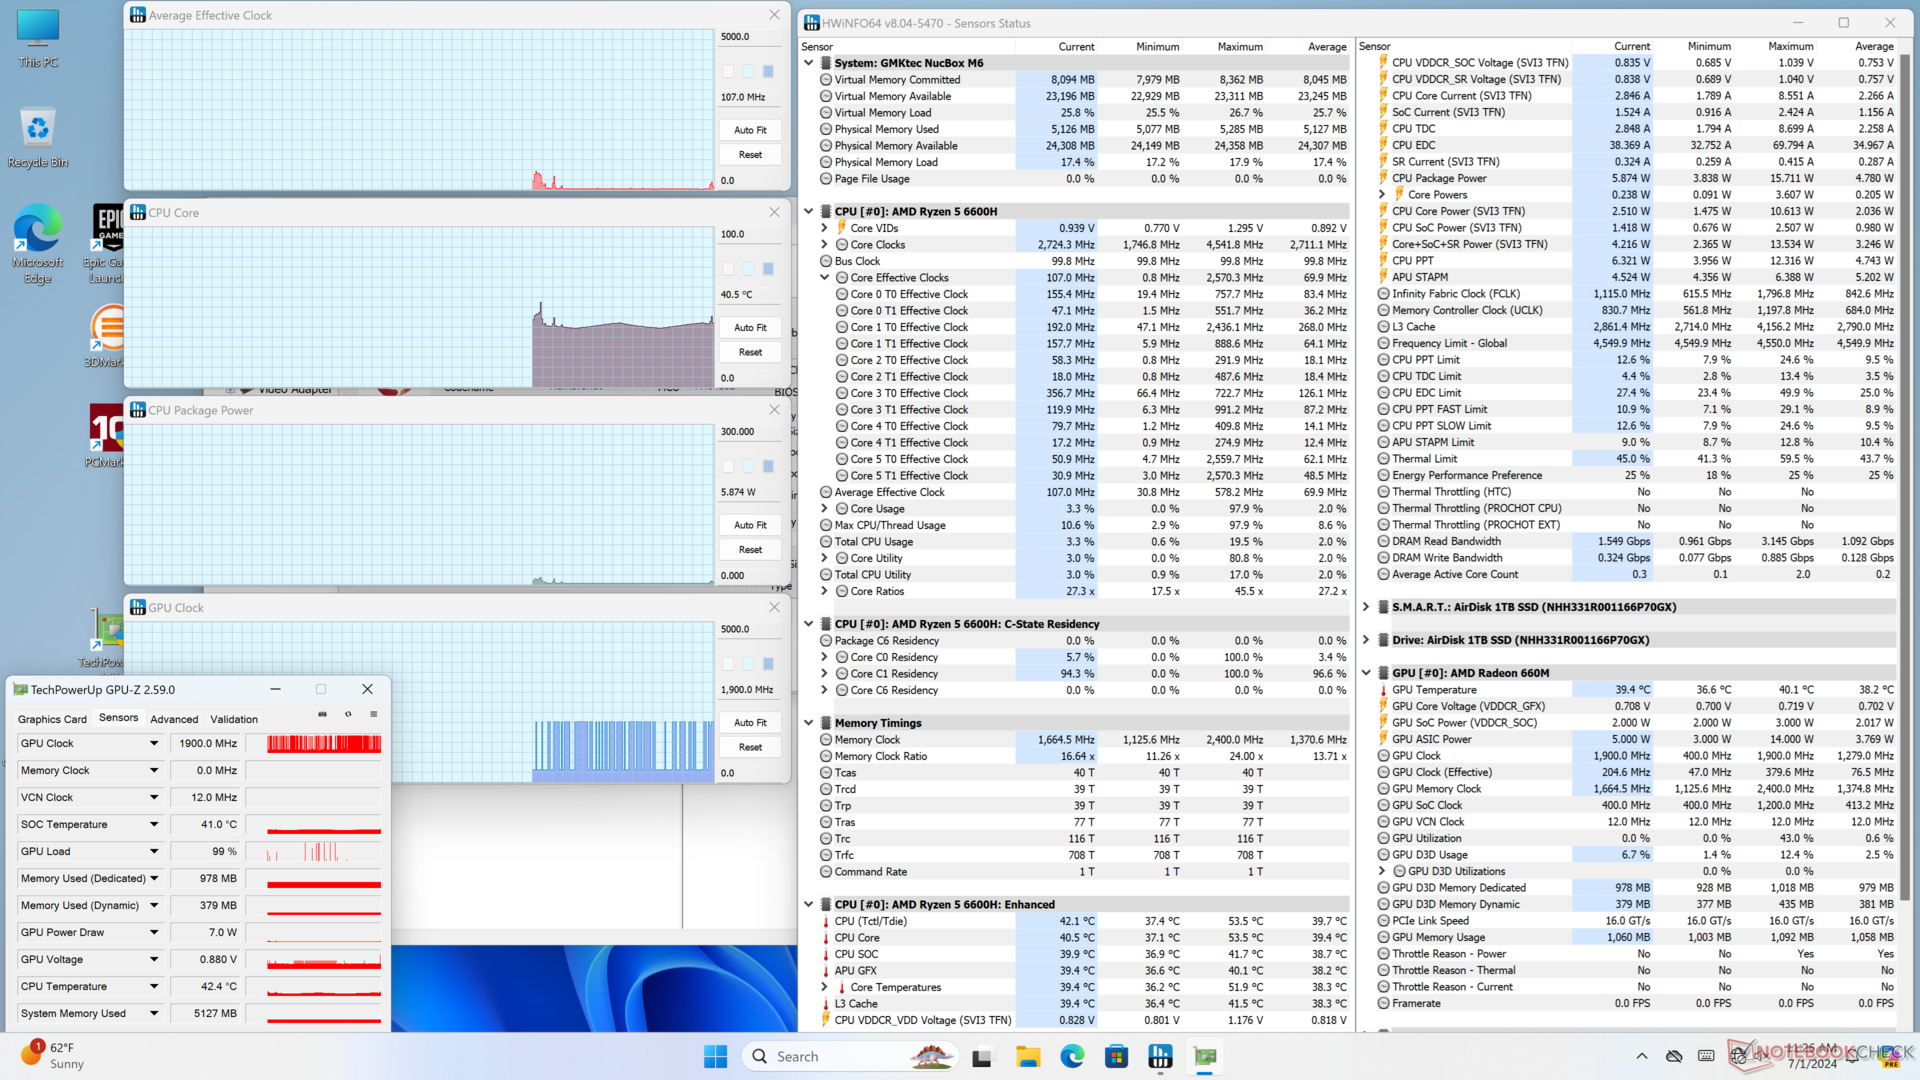
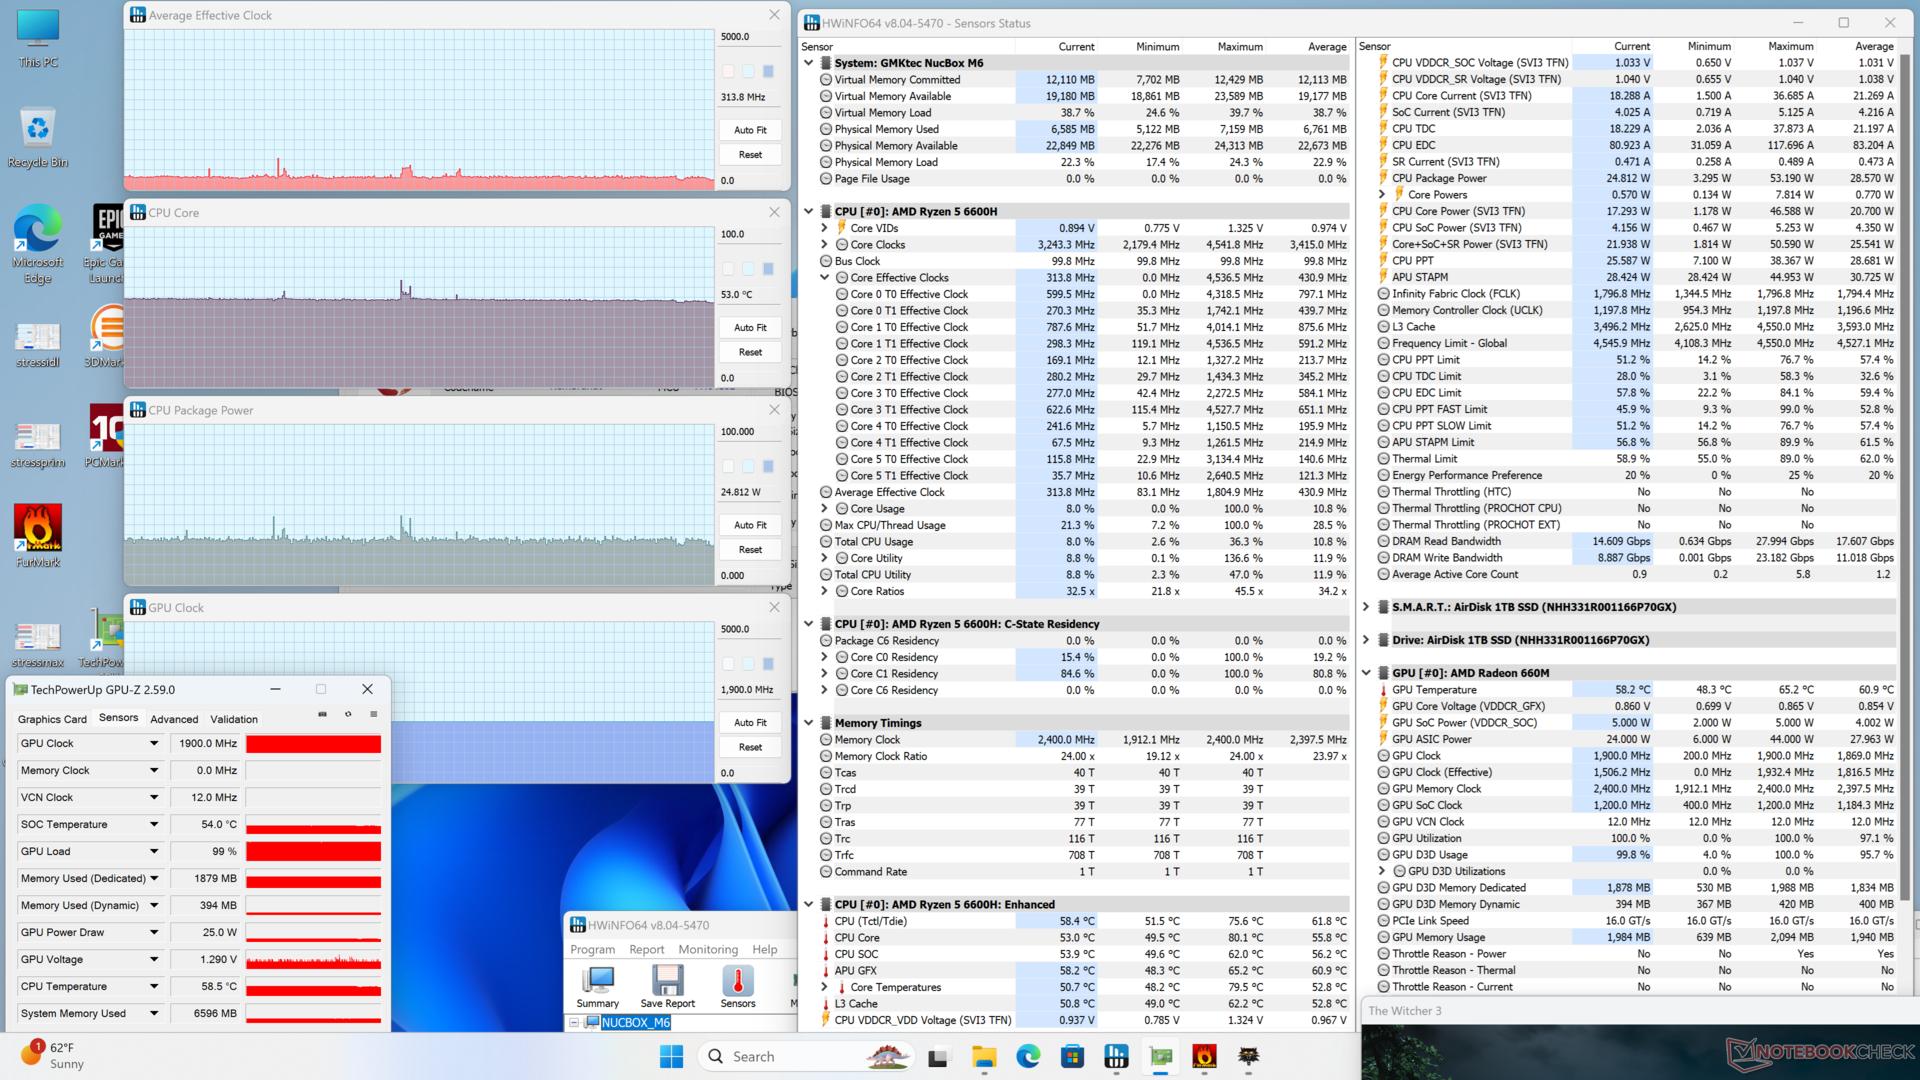

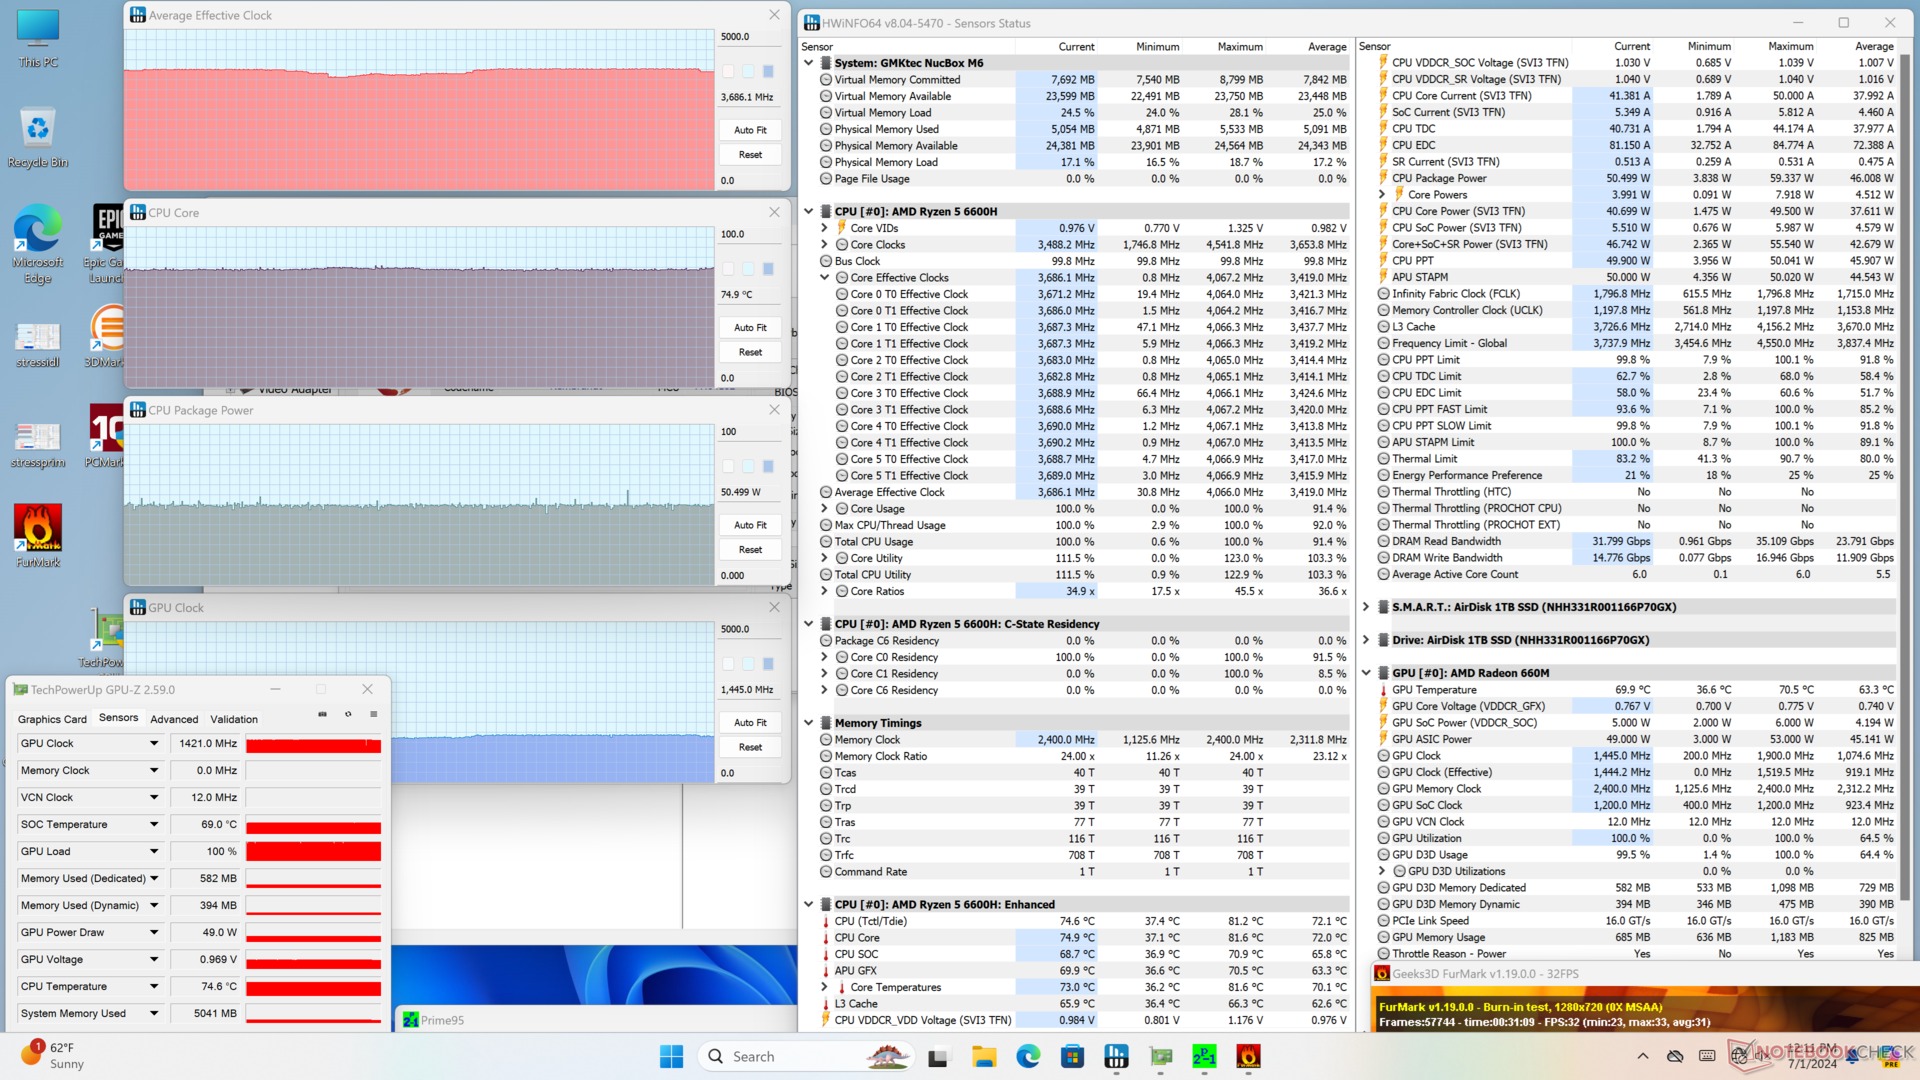
| Gemiddelde CPU-klok (GHz) | GPU-klok (MHz) | Gemiddelde CPU-temperatuur (°C) | |
| Inactief systeem | -- | -- | 40 |
| Prime95 Stress | ~3.9 | -- | 80 |
| Prime95 + FurMark Stress | ~3.7 | 1421 | 75 |
| Witcher 3 Stress | ~0,3 | 1900 | 54 |
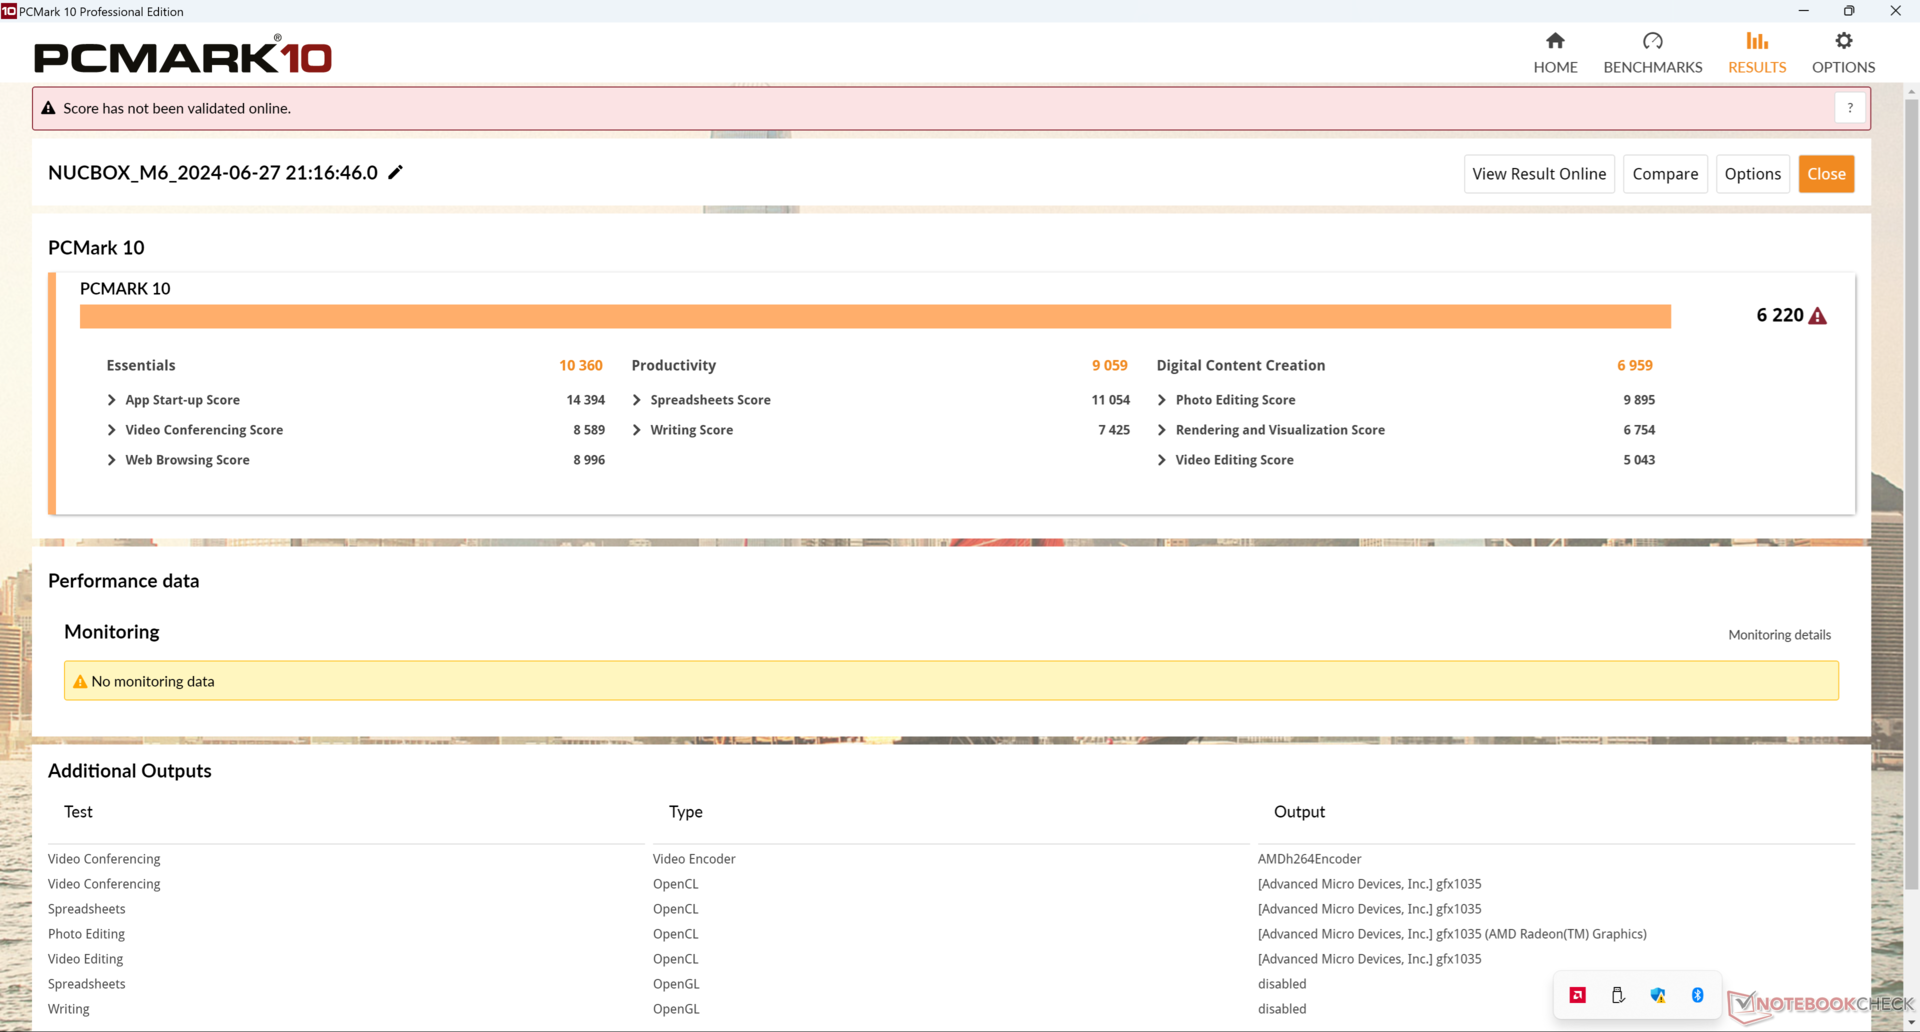
Systeemprestaties
CrossMark: Overall | Productivity | Creativity | Responsiveness
WebXPRT 3: Overall
WebXPRT 4: Overall
Mozilla Kraken 1.1: Total
| PCMark 10 / Score | |
| GMK NucBox K6 | |
| BOSGAME M1 | |
| Intel NUC 13 Pro Kit NUC13ANK | |
| GMK NucBox M6 | |
| Gemiddeld AMD Ryzen 5 6600H, AMD Radeon 660M (n=1) | |
| Beelink SER5 | |
| GMK NucBox M5 | |
| PCMark 10 / Essentials | |
| Intel NUC 13 Pro Kit NUC13ANK | |
| GMK NucBox K6 | |
| BOSGAME M1 | |
| GMK NucBox M6 | |
| Gemiddeld AMD Ryzen 5 6600H, AMD Radeon 660M (n=1) | |
| GMK NucBox M5 | |
| Beelink SER5 | |
| PCMark 10 / Productivity | |
| GMK NucBox K6 | |
| BOSGAME M1 | |
| GMK NucBox M6 | |
| Gemiddeld AMD Ryzen 5 6600H, AMD Radeon 660M (n=1) | |
| Beelink SER5 | |
| GMK NucBox M5 | |
| Intel NUC 13 Pro Kit NUC13ANK | |
| PCMark 10 / Digital Content Creation | |
| BOSGAME M1 | |
| GMK NucBox K6 | |
| Intel NUC 13 Pro Kit NUC13ANK | |
| GMK NucBox M6 | |
| Gemiddeld AMD Ryzen 5 6600H, AMD Radeon 660M (n=1) | |
| Beelink SER5 | |
| GMK NucBox M5 | |
| CrossMark / Overall | |
| BOSGAME M1 | |
| GMK NucBox K6 | |
| Intel NUC 13 Pro Kit NUC13ANK | |
| GMK NucBox M6 | |
| Gemiddeld AMD Ryzen 5 6600H, AMD Radeon 660M (n=1) | |
| Beelink SER5 | |
| GMK NucBox M5 | |
| CrossMark / Productivity | |
| BOSGAME M1 | |
| GMK NucBox K6 | |
| Intel NUC 13 Pro Kit NUC13ANK | |
| GMK NucBox M6 | |
| Gemiddeld AMD Ryzen 5 6600H, AMD Radeon 660M (n=1) | |
| Beelink SER5 | |
| GMK NucBox M5 | |
| CrossMark / Creativity | |
| BOSGAME M1 | |
| GMK NucBox K6 | |
| Intel NUC 13 Pro Kit NUC13ANK | |
| GMK NucBox M6 | |
| Gemiddeld AMD Ryzen 5 6600H, AMD Radeon 660M (n=1) | |
| Beelink SER5 | |
| GMK NucBox M5 | |
| CrossMark / Responsiveness | |
| BOSGAME M1 | |
| GMK NucBox K6 | |
| Intel NUC 13 Pro Kit NUC13ANK | |
| GMK NucBox M6 | |
| Gemiddeld AMD Ryzen 5 6600H, AMD Radeon 660M (n=1) | |
| Beelink SER5 | |
| GMK NucBox M5 | |
| WebXPRT 3 / Overall | |
| GMK NucBox K6 | |
| BOSGAME M1 | |
| Intel NUC 13 Pro Kit NUC13ANK | |
| Beelink SER5 | |
| GMK NucBox M6 | |
| Gemiddeld AMD Ryzen 5 6600H, AMD Radeon 660M (n=1) | |
| GMK NucBox M5 | |
| WebXPRT 4 / Overall | |
| Intel NUC 13 Pro Kit NUC13ANK | |
| GMK NucBox K6 | |
| BOSGAME M1 | |
| GMK NucBox M6 | |
| Gemiddeld AMD Ryzen 5 6600H, AMD Radeon 660M (n=1) | |
| Beelink SER5 | |
| GMK NucBox M5 | |
| Mozilla Kraken 1.1 / Total | |
| GMK NucBox M5 | |
| Beelink SER5 | |
| GMK NucBox M6 | |
| Gemiddeld AMD Ryzen 5 6600H, AMD Radeon 660M (n=1) | |
| GMK NucBox K6 | |
| BOSGAME M1 | |
| Intel NUC 13 Pro Kit NUC13ANK | |
* ... kleiner is beter
| PCMark 10 Score | 6220 punten | |
Help | ||
| AIDA64 / Memory Copy | |
| BOSGAME M1 | |
| GMK NucBox K6 | |
| GMK NucBox M6 | |
| Intel NUC 13 Pro Kit NUC13ANK | |
| Gemiddeld AMD Ryzen 5 6600H (28335 - 50886, n=3) | |
| GMK NucBox M5 | |
| Beelink SER5 | |
| AIDA64 / Memory Read | |
| BOSGAME M1 | |
| GMK NucBox K6 | |
| GMK NucBox M6 | |
| GMK NucBox M5 | |
| Intel NUC 13 Pro Kit NUC13ANK | |
| Gemiddeld AMD Ryzen 5 6600H (34300 - 51684, n=3) | |
| Beelink SER5 | |
| AIDA64 / Memory Write | |
| BOSGAME M1 | |
| GMK NucBox K6 | |
| GMK NucBox M6 | |
| Gemiddeld AMD Ryzen 5 6600H (31788 - 55160, n=3) | |
| GMK NucBox M5 | |
| Intel NUC 13 Pro Kit NUC13ANK | |
| Beelink SER5 | |
| AIDA64 / Memory Latency | |
| GMK NucBox M5 | |
| Intel NUC 13 Pro Kit NUC13ANK | |
| Beelink SER5 | |
| BOSGAME M1 | |
| GMK NucBox K6 | |
| GMK NucBox M6 | |
| Gemiddeld AMD Ryzen 5 6600H (81.7 - 89.8, n=3) | |
* ... kleiner is beter
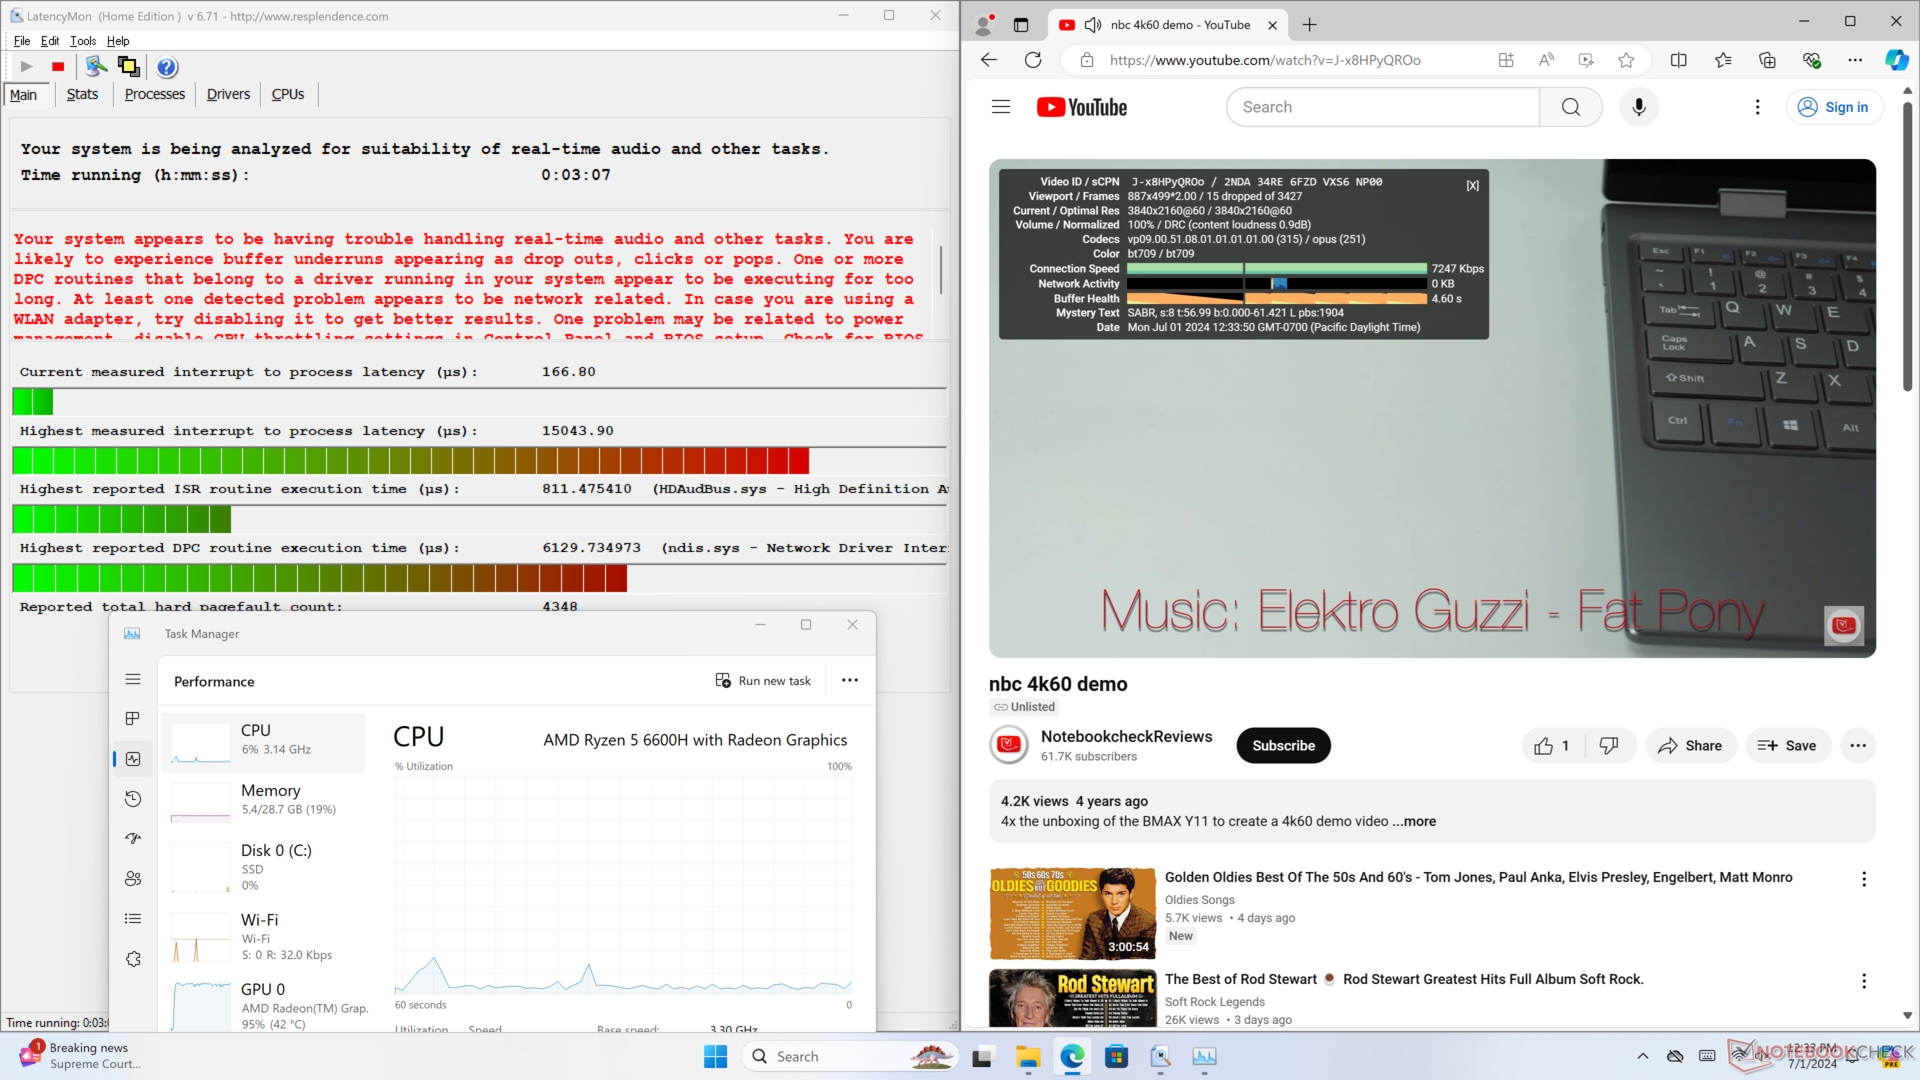
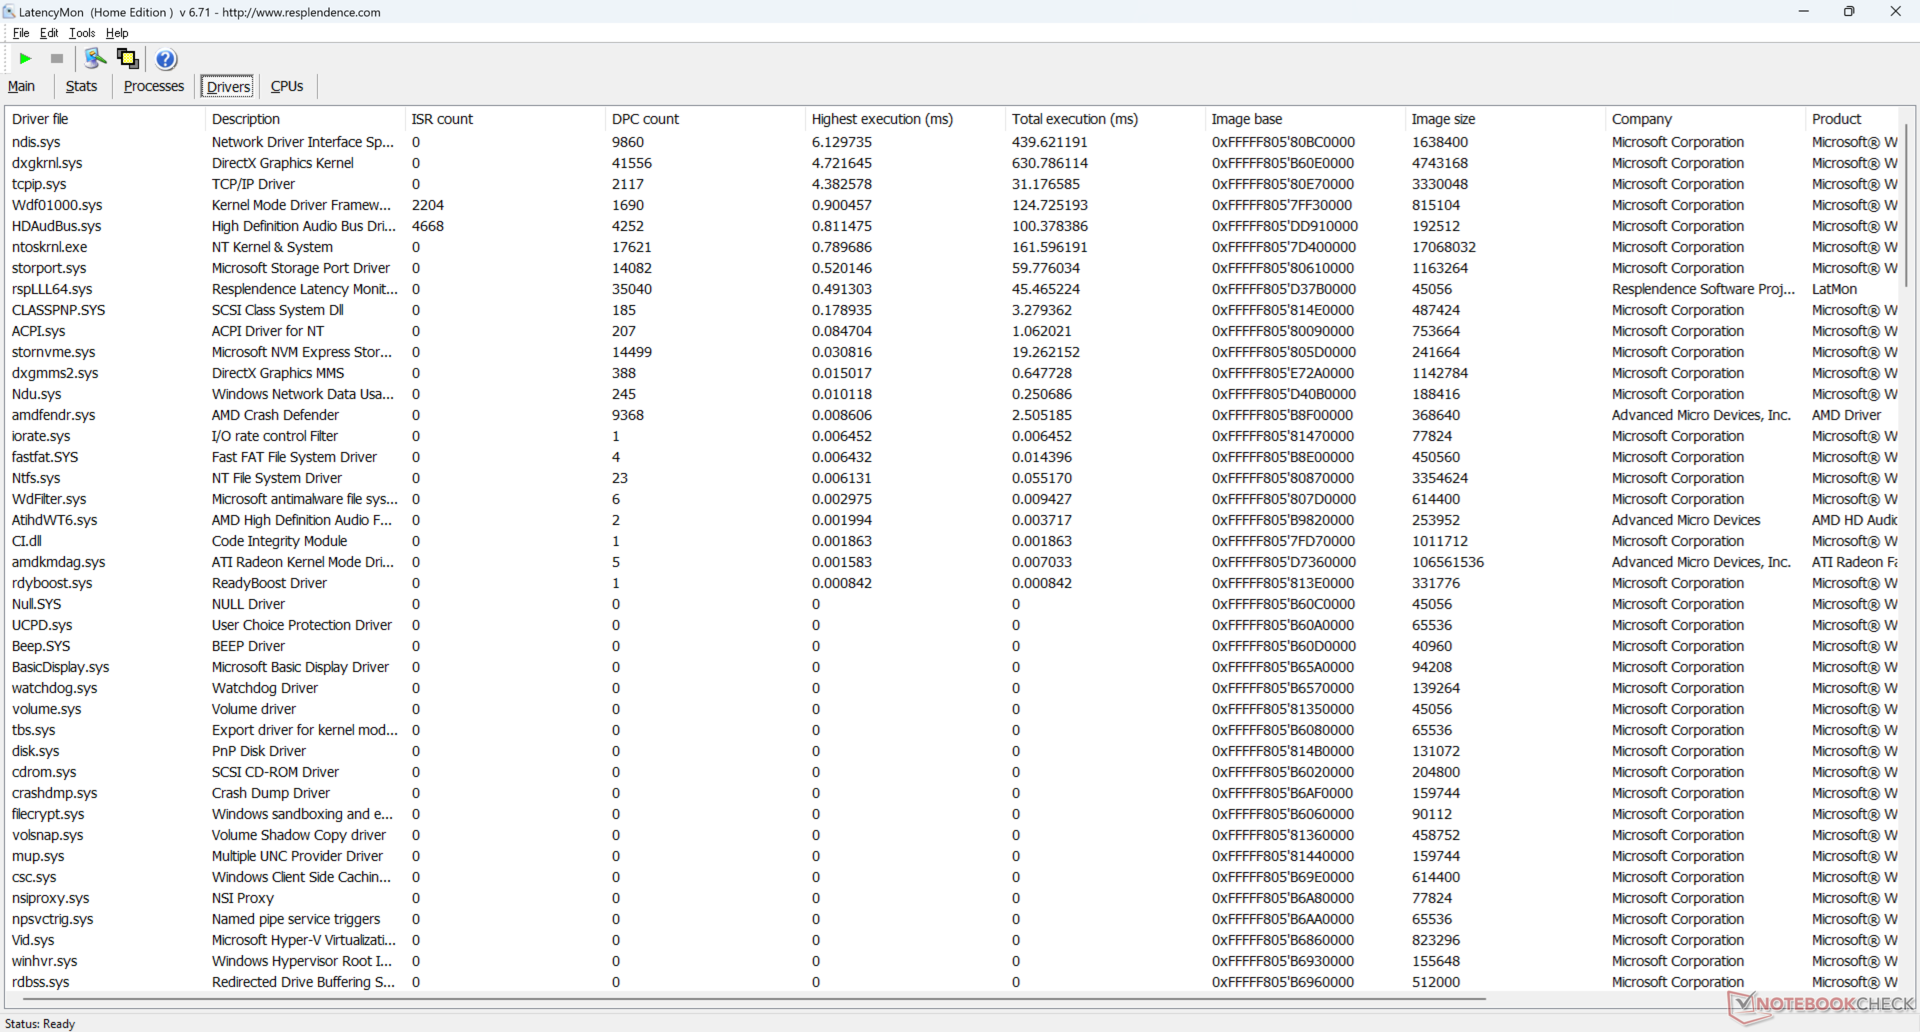
DPC latentie
LatencyMon onthult grote DPC-problemen bij het openen van meerdere browsertabbladen van onze startpagina, zelfs na meerdere hertests. het afspelen van 4K-video's bij 60 FPS is ook problematisch met 15 dropped frames over een periode van 60 seconden. Deze problemen bleven bestaan ondanks het bijwerken van zowel Windows- als AMD-stuurprogramma's naar hun nieuwste respectievelijke versies op het moment van de test.
| DPC Latencies / LatencyMon - interrupt to process latency (max), Web, Youtube, Prime95 | |
| GMK NucBox M6 | |
| GMK NucBox K6 | |
| GMK NucBox M5 | |
| BOSGAME M1 | |
| Intel NUC 13 Pro Kit NUC13ANK | |
| Beelink SER5 | |
* ... kleiner is beter
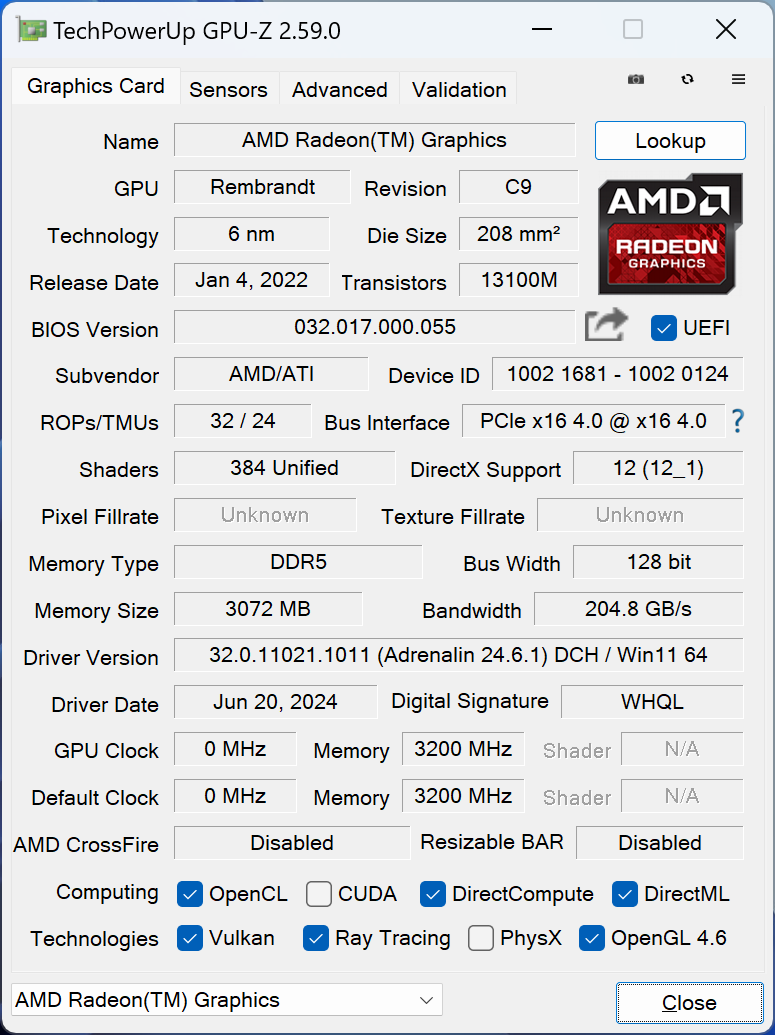
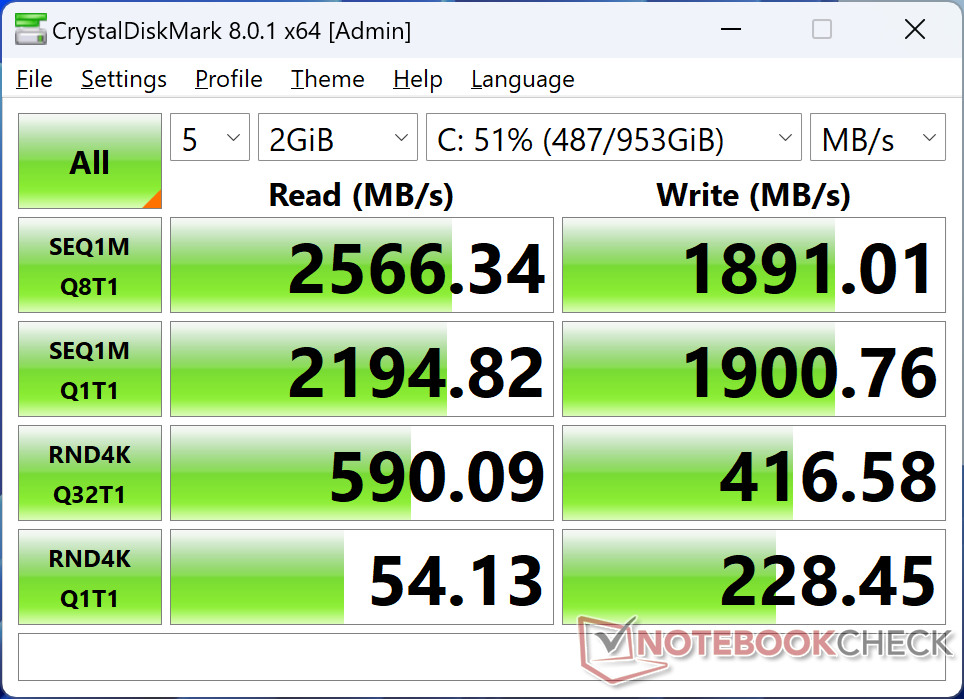
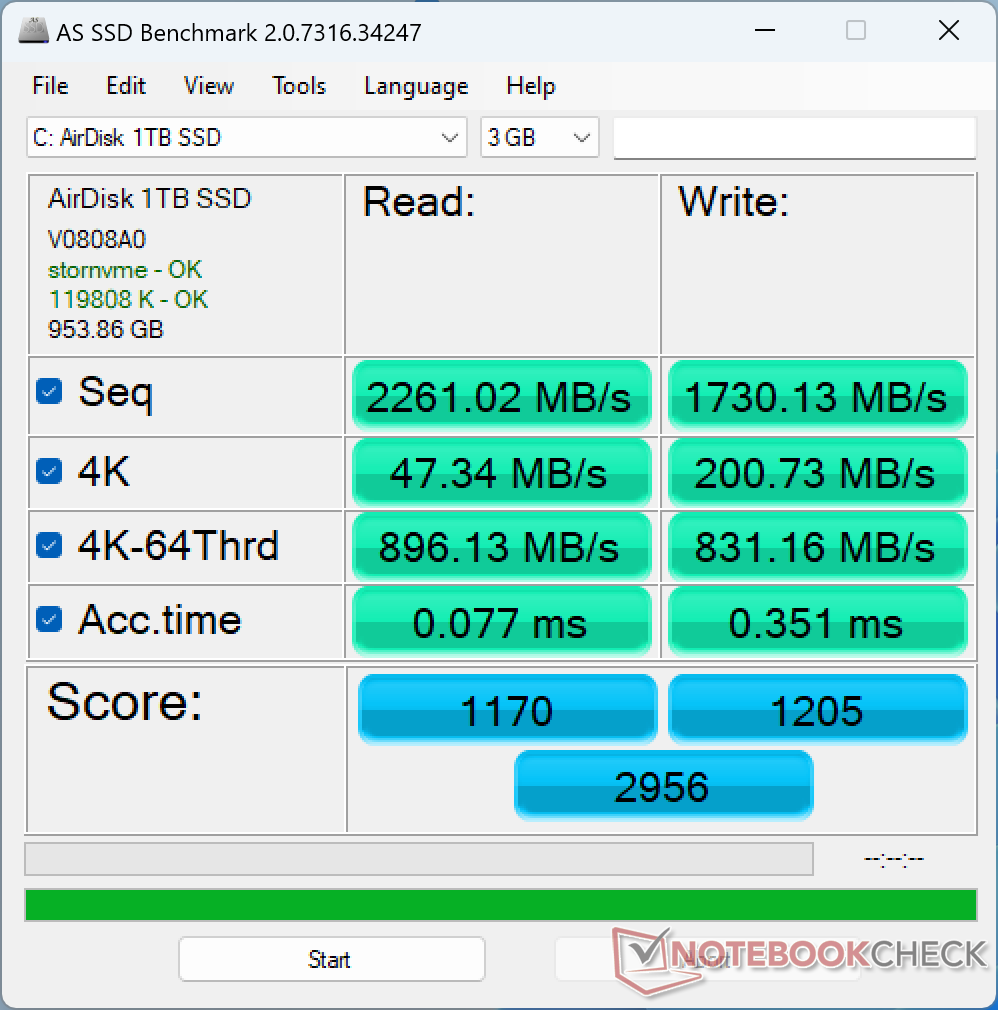
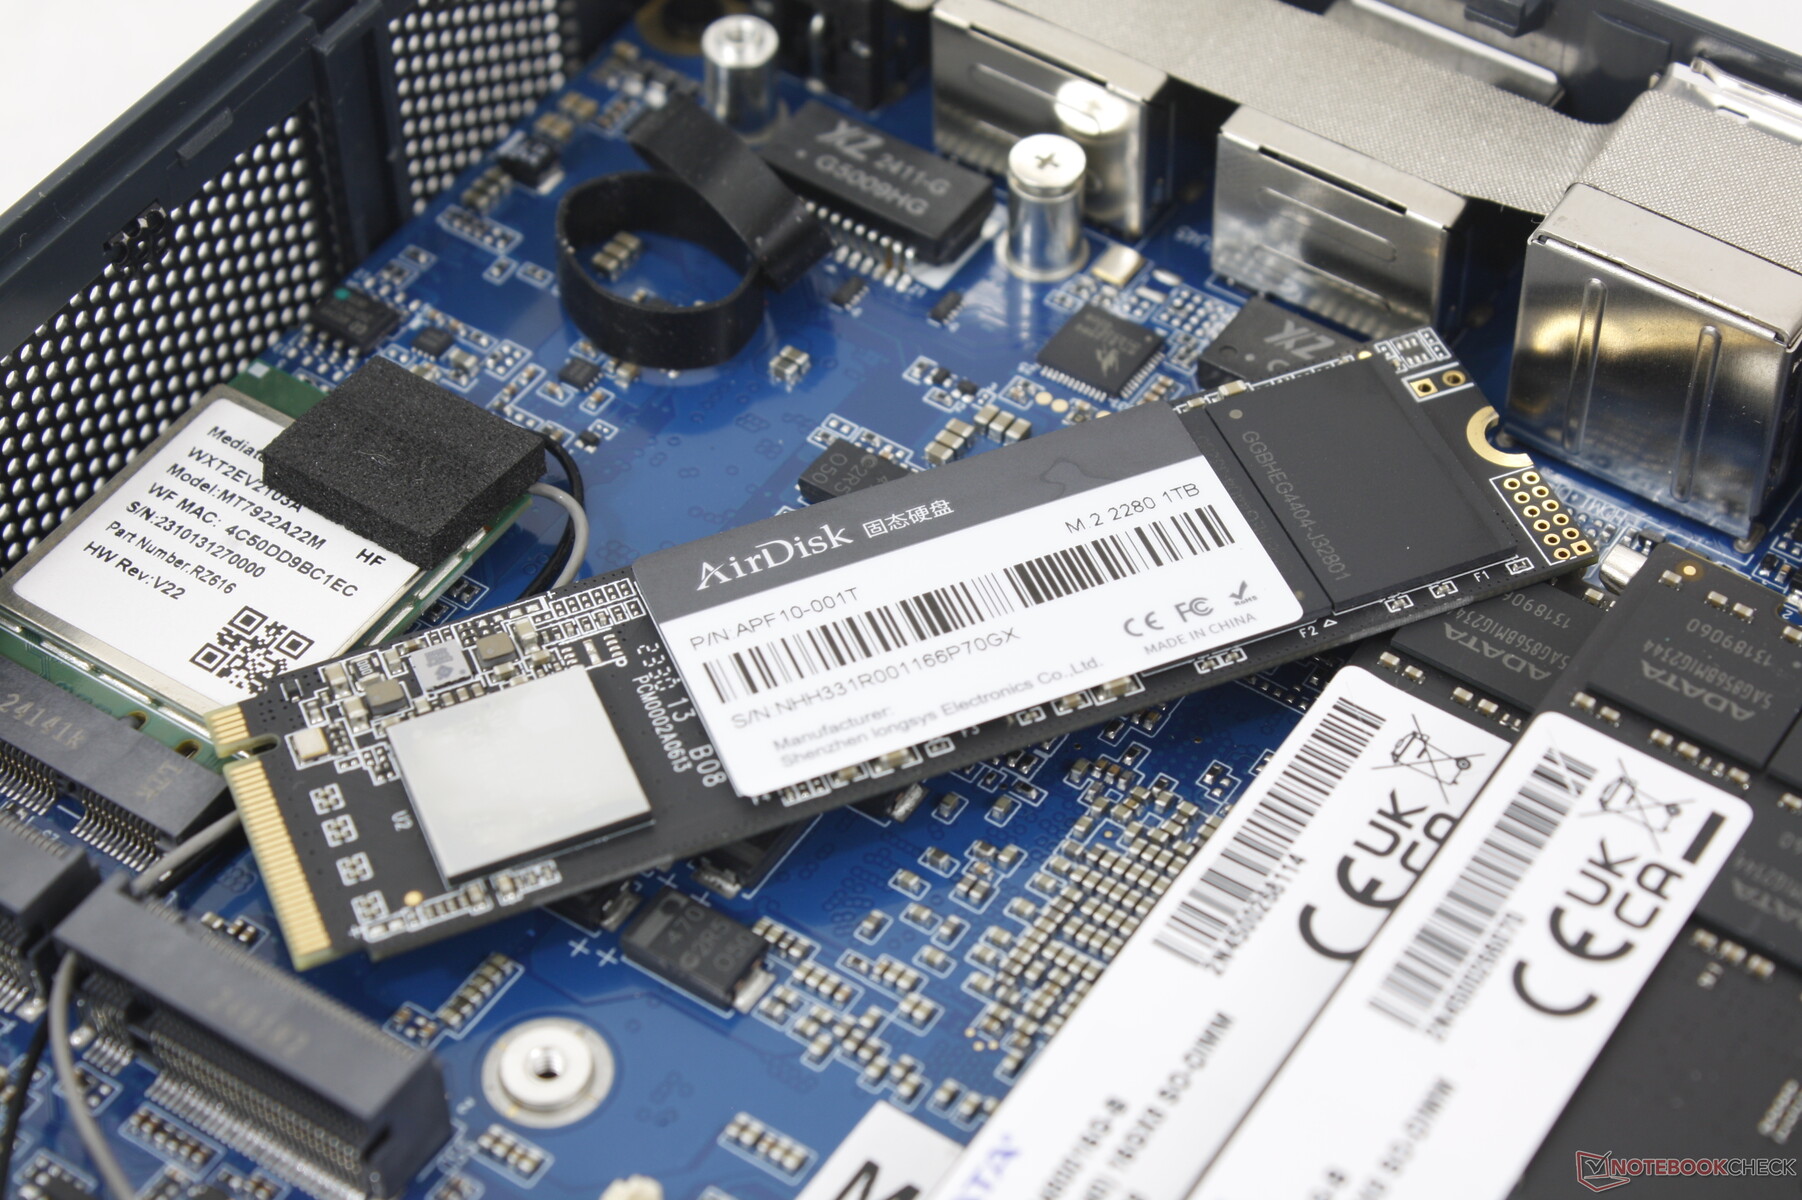
Opslagapparaten
Het systeem wordt geleverd met een PCIe3 x4 NVMe SSD van AirDisk in plaats van de meer gebruikelijke PCIe4-schijf, waarschijnlijk om kosten te besparen. De middelgrote SSD biedt een stabiele leessnelheid van 2600 MB/s, wat voldoende is gezien de CPU waarmee hij is gekoppeld.

| Drive Performance Rating - Percent | |
| GMK NucBox K6 | |
| Intel NUC 13 Pro Kit NUC13ANK | |
| Beelink SER5 | |
| BOSGAME M1 | |
| GMK NucBox M5 | |
| GMK NucBox M6 | |
* ... kleiner is beter
Disk Throttling: DiskSpd Read Loop, Queue Depth 8
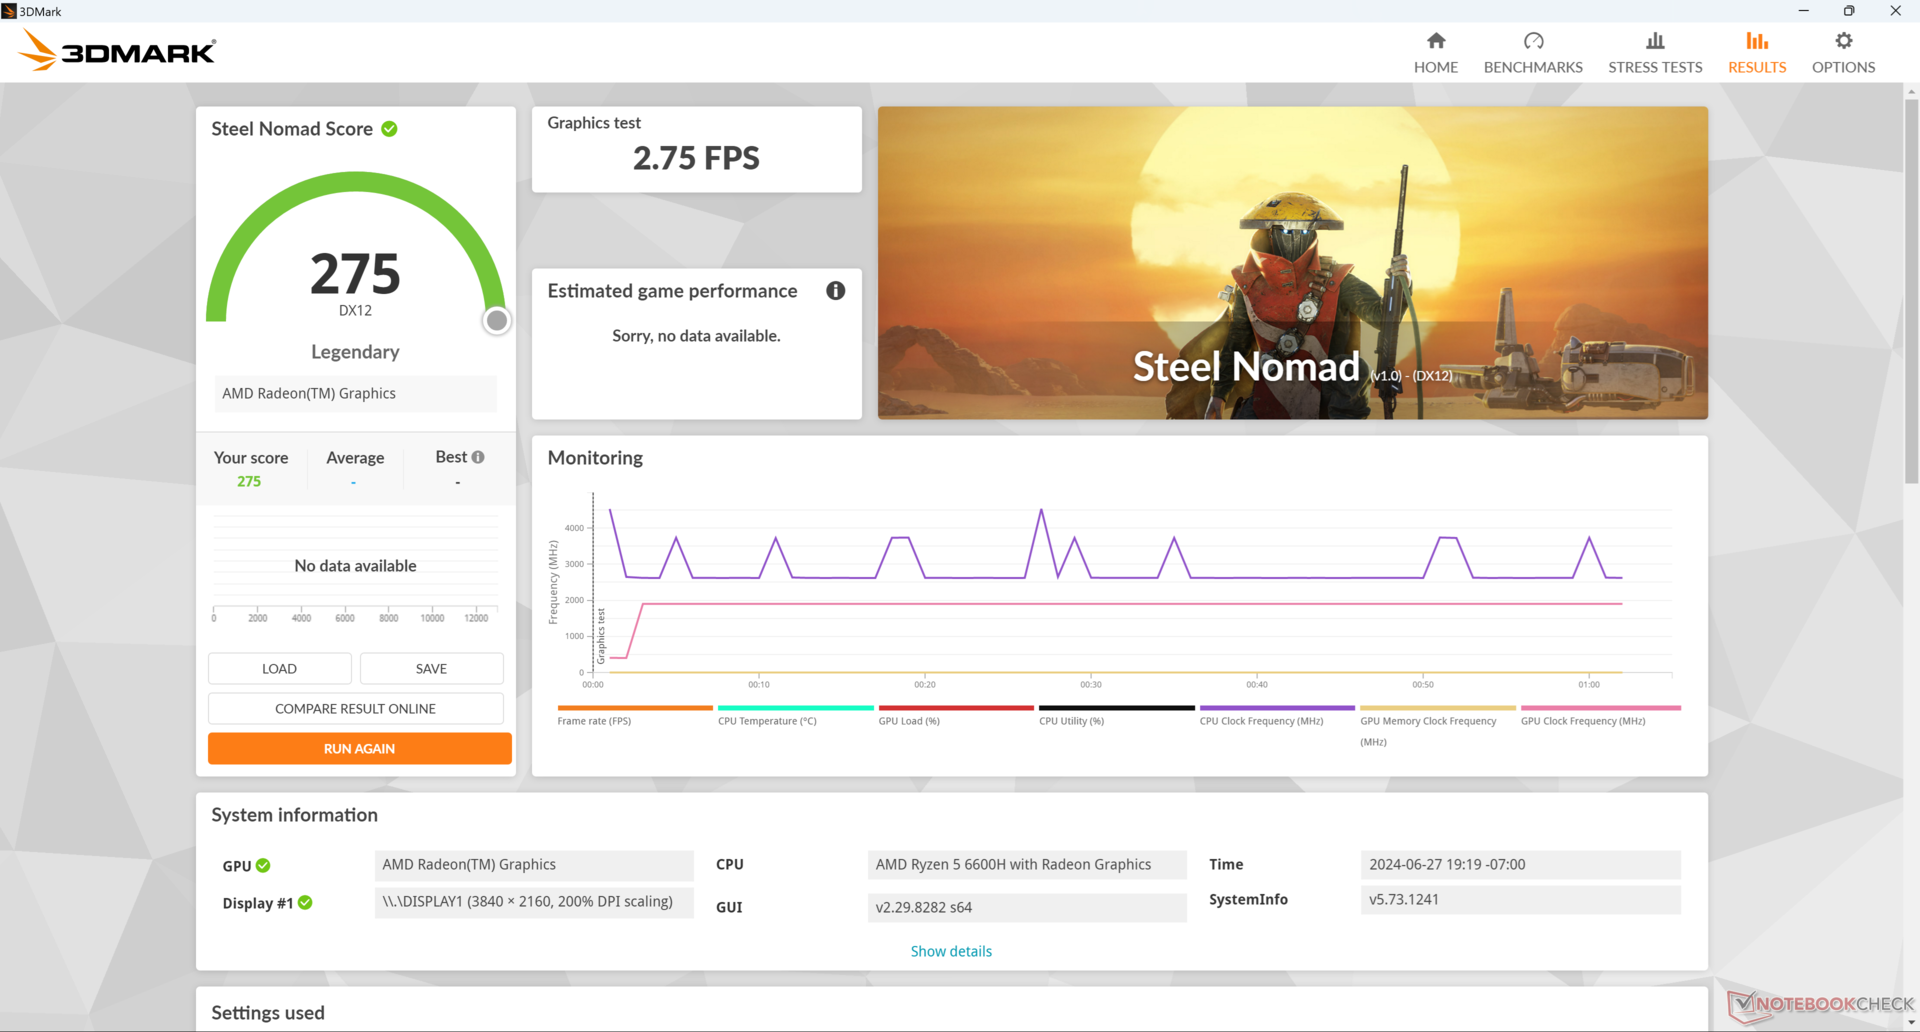
GPU-prestaties - De Radeon 660M heeft het moeilijk in de meeste games
De Radeon 660M is ruwweg 35 procent langzamer dan de Radeon 680M om ongeveer op gelijke hoogte te komen met de meer gangbare Iris Xe 96 EU's. Hoewel het niet bijzonder geschikt is voor de meeste games, is het in ieder geval een respectabele sprong ten opzichte van de Radeon RX Vega 8 op oudere generatie Zen processoren.
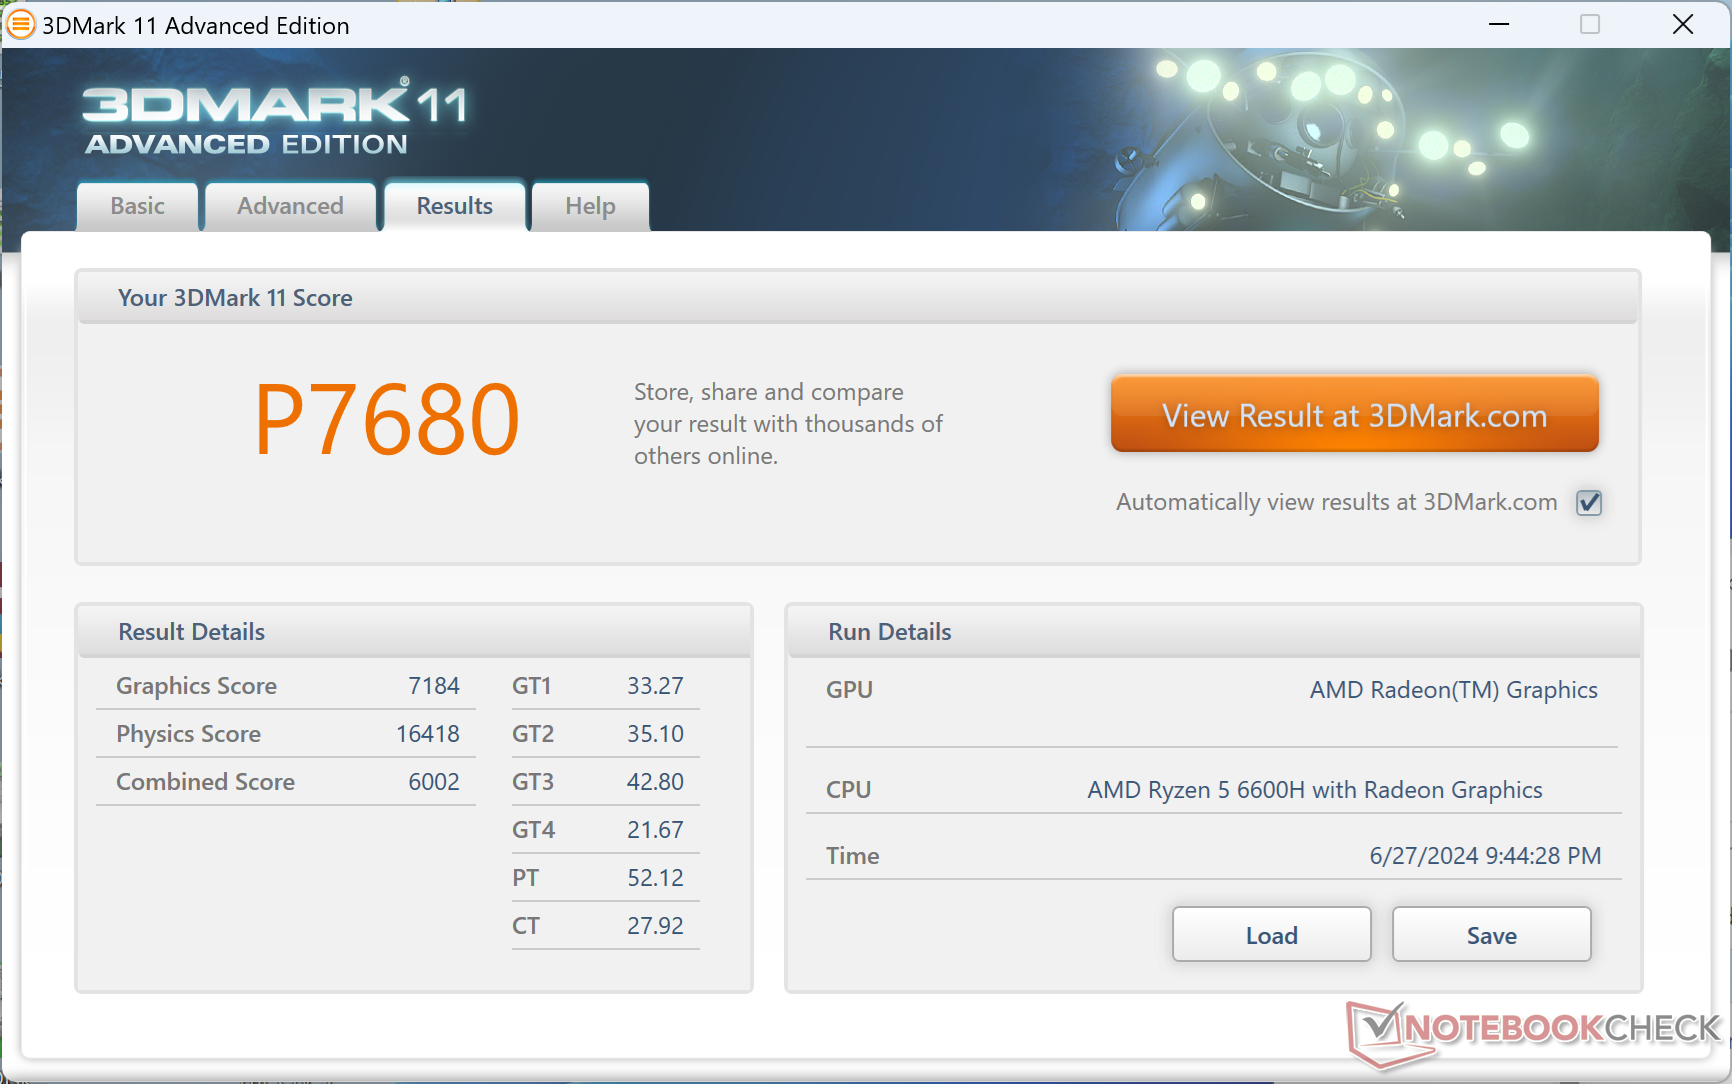
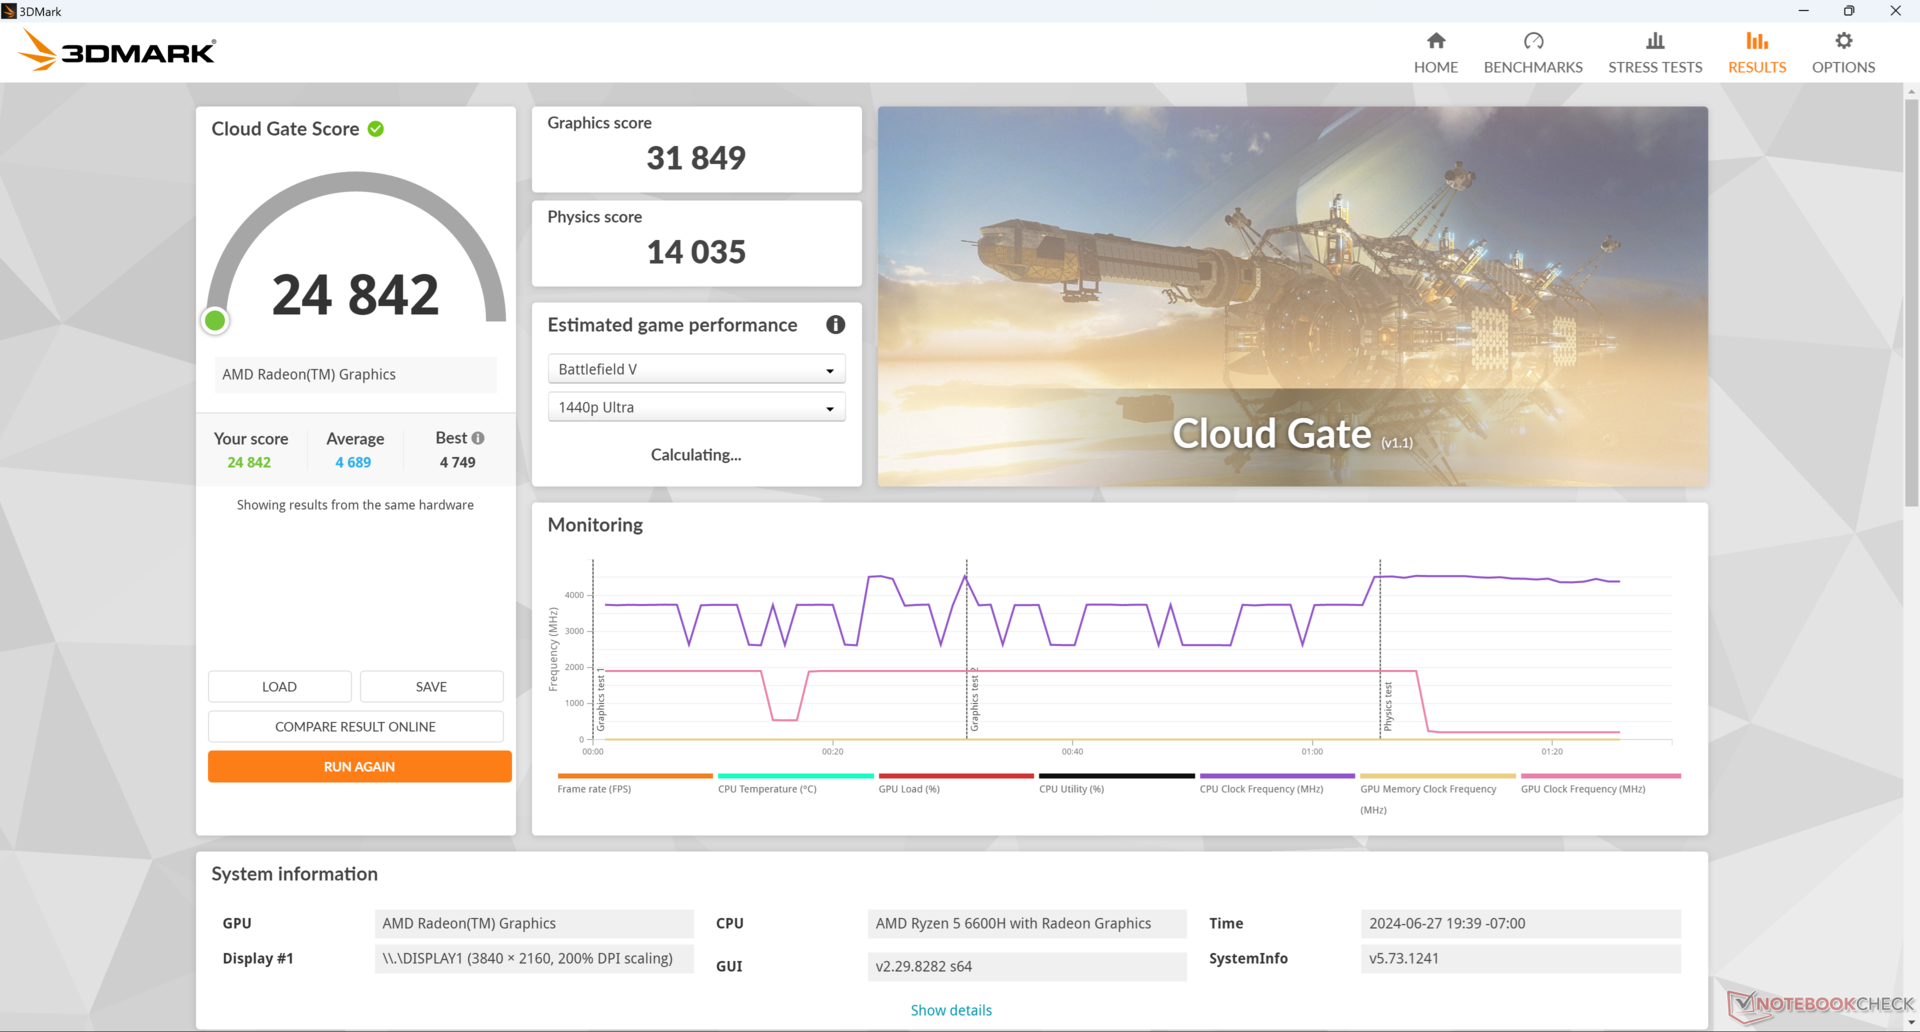
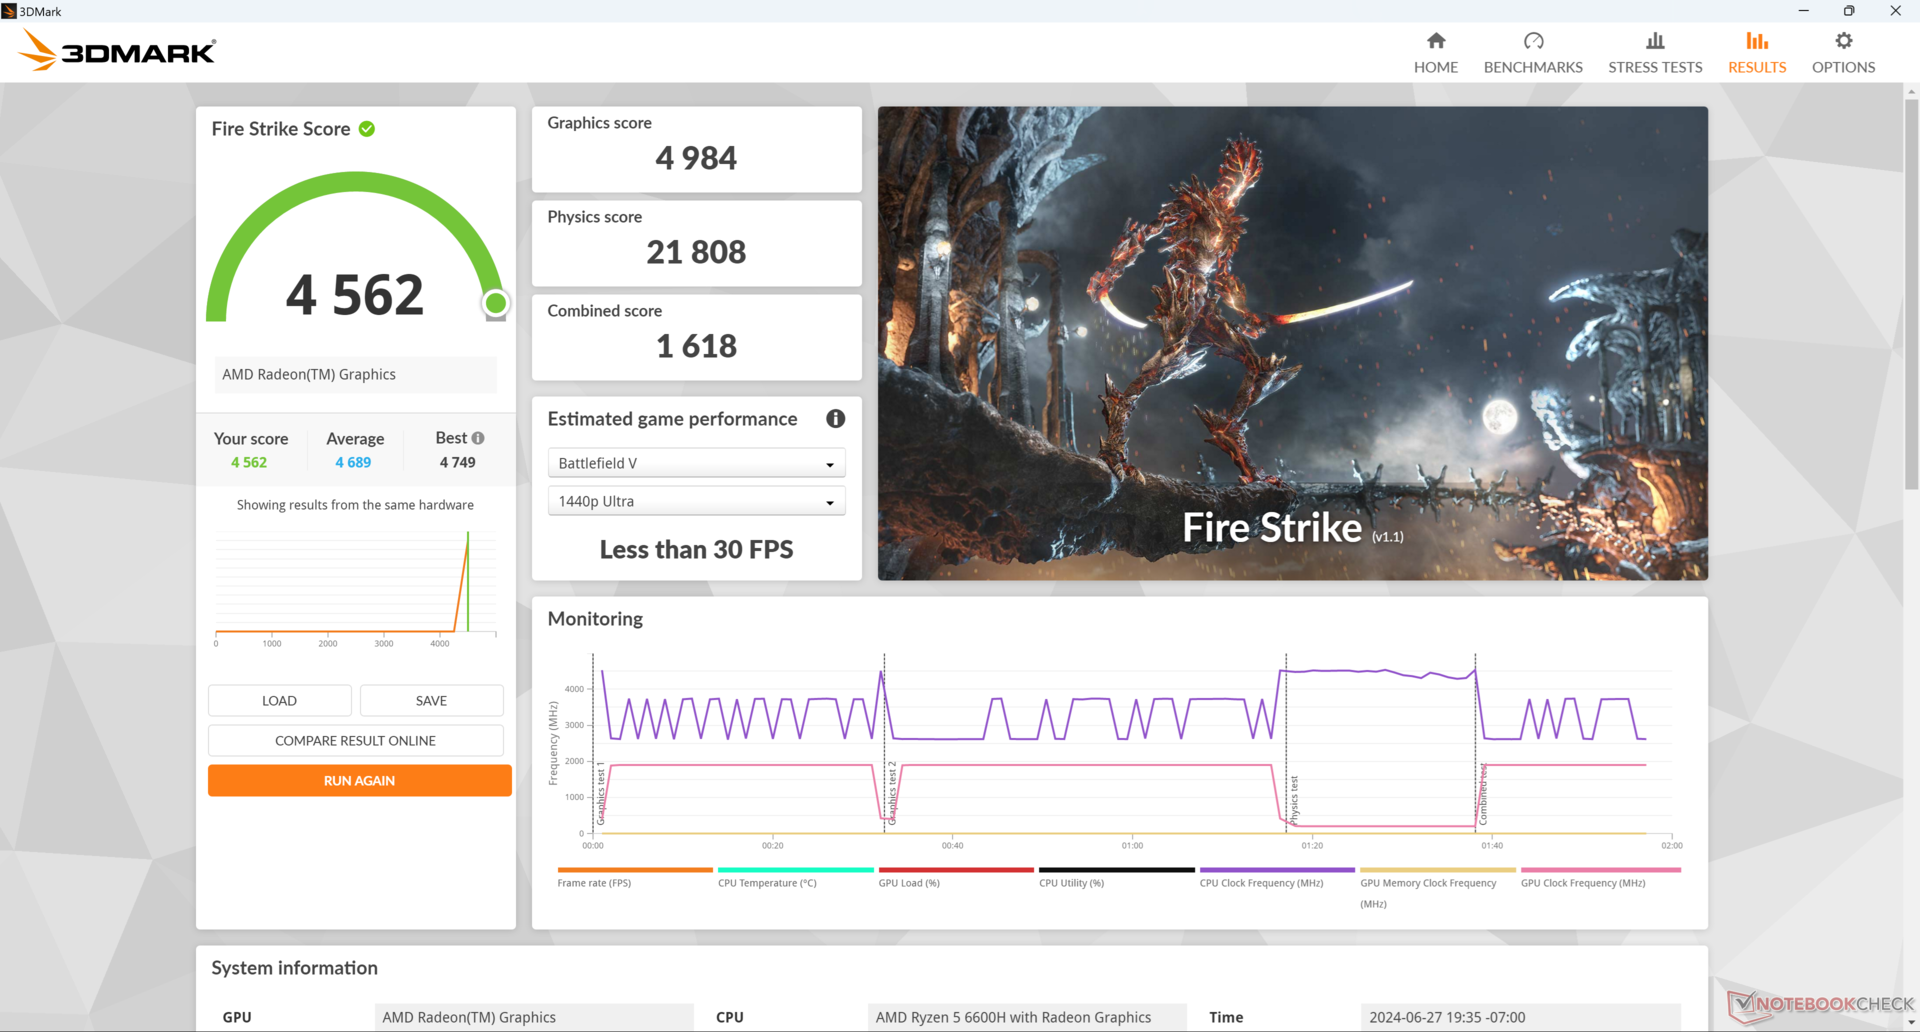
| 3DMark 11 Performance | 7680 punten | |
| 3DMark Cloud Gate Standard Score | 24842 punten | |
| 3DMark Fire Strike Score | 4562 punten | |
| 3DMark Time Spy Score | 1793 punten | |
| 3DMark Steel Nomad Score | 275 punten | |
Help | ||
| Blender | |
| v3.3 Classroom HIP/AMD | |
| Gemiddeld AMD Radeon 660M (438 - 755, n=8) | |
| Maxtang MTN-FP750 | |
| Aoostar GEM10 | |
| v3.3 Classroom CPU | |
| GMK NucBox M5 | |
| Acemagic AD15 | |
| Gemiddeld AMD Radeon 660M (323 - 968, n=10) | |
| Geekom XT12 Pro | |
| GMK NucBox M6 | |
| Geekom GT13 Pro | |
| Intel NUC 13 Pro Kit NUC13ANK | |
| Maxtang MTN-FP750 | |
| Aoostar GEM10 | |
| HP Elite Mini 800 G9-5M9T9EA | |
| Aoostar GEM12 | |
| BOSGAME M1 | |
| Acemagic F2A | |
| Minisforum AtomMan X7 Ti | |
| v3.3 Classroom oneAPI/Intel | |
| Minisforum AtomMan X7 Ti | |
* ... kleiner is beter
| Performance Rating - Percent | |
| BOSGAME M1 | |
| GMK NucBox K6 | |
| GMK NucBox M6 | |
| Intel NUC 13 Pro Kit NUC13ANK -2! | |
| GMK NucBox M5 | |
| Beelink SER5 | |
| The Witcher 3 - 1920x1080 Ultra Graphics & Postprocessing (HBAO+) | |
| BOSGAME M1 | |
| GMK NucBox K6 | |
| GMK NucBox M6 | |
| Intel NUC 13 Pro Kit NUC13ANK | |
| GMK NucBox M5 | |
| Beelink SER5 | |
| Final Fantasy XV Benchmark - 1920x1080 High Quality | |
| BOSGAME M1 | |
| GMK NucBox K6 | |
| GMK NucBox M6 | |
| GMK NucBox M5 | |
| Beelink SER5 | |
| Strange Brigade - 1920x1080 ultra AA:ultra AF:16 | |
| BOSGAME M1 | |
| GMK NucBox K6 | |
| GMK NucBox M6 | |
| Intel NUC 13 Pro Kit NUC13ANK | |
| GMK NucBox M5 | |
| Beelink SER5 | |
| Dota 2 Reborn - 1920x1080 ultra (3/3) best looking | |
| BOSGAME M1 | |
| GMK NucBox K6 | |
| Intel NUC 13 Pro Kit NUC13ANK | |
| GMK NucBox M6 | |
| GMK NucBox M5 | |
| Beelink SER5 | |
| X-Plane 11.11 - 1920x1080 high (fps_test=3) | |
| GMK NucBox K6 | |
| BOSGAME M1 | |
| GMK NucBox M6 | |
| GMK NucBox M5 | |
| Beelink SER5 | |
| Tiny Tina's Wonderlands - 1920x1080 Badass Preset (DX12) | |
| BOSGAME M1 | |
| GMK NucBox K6 | |
| GMK NucBox M6 | |
| Intel NUC 13 Pro Kit NUC13ANK | |
| GMK NucBox M5 | |
| Beelink SER5 | |
| The Witcher 3 | |
| 1024x768 Low Graphics & Postprocessing | |
| BOSGAME M1 | |
| GMK NucBox K6 | |
| Intel NUC 13 Pro Kit NUC13ANK | |
| GMK NucBox M6 | |
| Gemiddeld AMD Radeon 660M (32.2 - 98.2, n=8) | |
| GMK NucBox M5 | |
| Beelink SER5 | |
| 1366x768 Medium Graphics & Postprocessing | |
| BOSGAME M1 | |
| GMK NucBox K6 | |
| GMK NucBox M6 | |
| Gemiddeld AMD Radeon 660M (40.2 - 58.5, n=7) | |
| GMK NucBox M5 | |
| Beelink SER5 | |
| 1920x1080 High Graphics & Postprocessing (Nvidia HairWorks Off) | |
| BOSGAME M1 | |
| GMK NucBox K6 | |
| Intel NUC 13 Pro Kit NUC13ANK | |
| GMK NucBox M6 | |
| Gemiddeld AMD Radeon 660M (18.5 - 28.6, n=8) | |
| GMK NucBox M5 | |
| Beelink SER5 | |
| 1920x1080 Ultra Graphics & Postprocessing (HBAO+) | |
| BOSGAME M1 | |
| GMK NucBox K6 | |
| GMK NucBox M6 | |
| Intel NUC 13 Pro Kit NUC13ANK | |
| Gemiddeld AMD Radeon 660M (12.3 - 17.9, n=8) | |
| GMK NucBox M5 | |
| Beelink SER5 | |
| Far Cry 5 | |
| 1280x720 Low Preset AA:T | |
| BOSGAME M1 | |
| GMK NucBox K6 | |
| GMK NucBox M6 | |
| Gemiddeld AMD Radeon 660M (38 - 71, n=6) | |
| Intel NUC 13 Pro Kit NUC13ANK | |
| Beelink SER5 | |
| GMK NucBox M5 | |
| 1920x1080 Medium Preset AA:T | |
| BOSGAME M1 | |
| GMK NucBox K6 | |
| GMK NucBox M6 | |
| Gemiddeld AMD Radeon 660M (18 - 33, n=6) | |
| Intel NUC 13 Pro Kit NUC13ANK | |
| Beelink SER5 | |
| GMK NucBox M5 | |
| 1920x1080 High Preset AA:T | |
| BOSGAME M1 | |
| GMK NucBox K6 | |
| GMK NucBox M6 | |
| Intel NUC 13 Pro Kit NUC13ANK | |
| Gemiddeld AMD Radeon 660M (16 - 30, n=6) | |
| Beelink SER5 | |
| GMK NucBox M5 | |
| 1920x1080 Ultra Preset AA:T | |
| BOSGAME M1 | |
| GMK NucBox K6 | |
| GMK NucBox M6 | |
| Gemiddeld AMD Radeon 660M (16 - 27, n=5) | |
| Intel NUC 13 Pro Kit NUC13ANK | |
| Beelink SER5 | |
| GMK NucBox M5 | |
| Final Fantasy XV Benchmark | |
| 1280x720 Lite Quality | |
| BOSGAME M1 | |
| GMK NucBox K6 | |
| GMK NucBox M6 | |
| Gemiddeld AMD Radeon 660M (33.1 - 53.4, n=10) | |
| GMK NucBox M5 | |
| Beelink SER5 | |
| 1920x1080 Standard Quality | |
| BOSGAME M1 | |
| GMK NucBox K6 | |
| GMK NucBox M6 | |
| Gemiddeld AMD Radeon 660M (16 - 24.7, n=10) | |
| GMK NucBox M5 | |
| Beelink SER5 | |
| 1920x1080 High Quality | |
| BOSGAME M1 | |
| GMK NucBox K6 | |
| GMK NucBox M6 | |
| Gemiddeld AMD Radeon 660M (11.1 - 17.9, n=10) | |
| GMK NucBox M5 | |
| Beelink SER5 | |
| Cyberpunk 2077 2.2 Phantom Liberty | |
| 1280x720 Low Preset (FSR off) | |
| BOSGAME M1 | |
| GMK NucBox K6 | |
| Gemiddeld AMD Radeon 660M (27.5 - 34.1, n=2) | |
| GMK NucBox M5 | |
| 1920x1080 Low Preset (FSR off) | |
| BOSGAME M1 | |
| GMK NucBox K6 | |
| GMK NucBox M6 | |
| Gemiddeld AMD Radeon 660M (14.9 - 24.3, n=4) | |
| GMK NucBox M5 | |
| 1920x1080 Medium Preset (FSR off) | |
| BOSGAME M1 | |
| GMK NucBox K6 | |
| GMK NucBox M6 | |
| Gemiddeld AMD Radeon 660M (11.5 - 18.1, n=4) | |
| GMK NucBox M5 | |
| 1920x1080 High Preset (FSR off) | |
| BOSGAME M1 | |
| GMK NucBox K6 | |
| GMK NucBox M6 | |
| Gemiddeld AMD Radeon 660M (8.85 - 13.2, n=5) | |
| GMK NucBox M5 | |
| 1920x1080 Ultra Preset (FSR off) | |
| BOSGAME M1 | |
| GMK NucBox K6 | |
| Gemiddeld AMD Radeon 660M (7.77 - 11.2, n=3) | |
| Strange Brigade | |
| 1280x720 lowest AF:1 | |
| BOSGAME M1 | |
| GMK NucBox K6 | |
| GMK NucBox M6 | |
| Gemiddeld AMD Radeon 660M (70.2 - 120.7, n=9) | |
| Intel NUC 13 Pro Kit NUC13ANK | |
| GMK NucBox M5 | |
| Beelink SER5 | |
| 1920x1080 medium AA:medium AF:4 | |
| BOSGAME M1 | |
| GMK NucBox K6 | |
| GMK NucBox M6 | |
| Gemiddeld AMD Radeon 660M (26.8 - 44.5, n=9) | |
| Intel NUC 13 Pro Kit NUC13ANK | |
| GMK NucBox M5 | |
| Beelink SER5 | |
| 1920x1080 high AA:high AF:8 | |
| BOSGAME M1 | |
| GMK NucBox K6 | |
| GMK NucBox M6 | |
| Gemiddeld AMD Radeon 660M (21.4 - 35.9, n=9) | |
| Intel NUC 13 Pro Kit NUC13ANK | |
| GMK NucBox M5 | |
| Beelink SER5 | |
| 1920x1080 ultra AA:ultra AF:16 | |
| BOSGAME M1 | |
| GMK NucBox K6 | |
| GMK NucBox M6 | |
| Gemiddeld AMD Radeon 660M (18.4 - 29.7, n=9) | |
| Intel NUC 13 Pro Kit NUC13ANK | |
| GMK NucBox M5 | |
| Beelink SER5 | |
| Tiny Tina's Wonderlands | |
| 1280x720 Lowest Preset (DX12) | |
| BOSGAME M1 | |
| GMK NucBox K6 | |
| GMK NucBox M6 | |
| Gemiddeld AMD Radeon 660M (56.3 - 80.8, n=2) | |
| Intel NUC 13 Pro Kit NUC13ANK | |
| GMK NucBox M5 | |
| Beelink SER5 | |
| 1920x1080 Low Preset (DX12) | |
| BOSGAME M1 | |
| GMK NucBox K6 | |
| GMK NucBox M6 | |
| Gemiddeld AMD Radeon 660M (26.9 - 40, n=3) | |
| Intel NUC 13 Pro Kit NUC13ANK | |
| GMK NucBox M5 | |
| Beelink SER5 | |
| 1920x1080 Medium Preset (DX12) | |
| BOSGAME M1 | |
| GMK NucBox K6 | |
| GMK NucBox M6 | |
| Gemiddeld AMD Radeon 660M (19.7 - 31.3, n=3) | |
| Intel NUC 13 Pro Kit NUC13ANK | |
| GMK NucBox M5 | |
| Beelink SER5 | |
| 1920x1080 High Preset (DX12) | |
| BOSGAME M1 | |
| GMK NucBox K6 | |
| GMK NucBox M6 | |
| Gemiddeld AMD Radeon 660M (12.6 - 20.5, n=3) | |
| Intel NUC 13 Pro Kit NUC13ANK | |
| GMK NucBox M5 | |
| Beelink SER5 | |
| 1920x1080 Badass Preset (DX12) | |
| BOSGAME M1 | |
| GMK NucBox K6 | |
| GMK NucBox M6 | |
| Intel NUC 13 Pro Kit NUC13ANK | |
| Gemiddeld AMD Radeon 660M (9.57 - 15.6, n=2) | |
| GMK NucBox M5 | |
| Beelink SER5 | |
| F1 22 | |
| 1280x720 Ultra Low Preset AA:T AF:16x | |
| BOSGAME M1 | |
| GMK NucBox K6 | |
| GMK NucBox M6 | |
| Gemiddeld AMD Radeon 660M (72.1 - 107.3, n=3) | |
| Intel NUC 13 Pro Kit NUC13ANK | |
| GMK NucBox M5 | |
| Beelink SER5 | |
| 1920x1080 Low Preset AA:T AF:16x | |
| BOSGAME M1 | |
| GMK NucBox K6 | |
| GMK NucBox M6 | |
| Gemiddeld AMD Radeon 660M (42.4 - 58.3, n=4) | |
| Intel NUC 13 Pro Kit NUC13ANK | |
| GMK NucBox M5 | |
| Beelink SER5 | |
| 1920x1080 Medium Preset AA:T AF:16x | |
| BOSGAME M1 | |
| GMK NucBox K6 | |
| GMK NucBox M6 | |
| Intel NUC 13 Pro Kit NUC13ANK | |
| Gemiddeld AMD Radeon 660M (37 - 52.3, n=4) | |
| GMK NucBox M5 | |
| Beelink SER5 | |
| 1920x1080 High Preset AA:T AF:16x | |
| BOSGAME M1 | |
| GMK NucBox K6 | |
| GMK NucBox M6 | |
| Intel NUC 13 Pro Kit NUC13ANK | |
| Gemiddeld AMD Radeon 660M (26.2 - 37.2, n=4) | |
| GMK NucBox M5 | |
| Beelink SER5 | |
| 1920x1080 Ultra High Preset AA:T AF:16x | |
| Intel NUC 13 Pro Kit NUC13ANK | |
| BOSGAME M1 | |
| GMK NucBox K6 | |
| GMK NucBox M5 | |
| Beelink SER5 | |
| GMK NucBox M6 | |
| Gemiddeld AMD Radeon 660M (5.13 - 8.43, n=3) | |
| Baldur's Gate 3 | |
| 1280x720 Low Preset | |
| BOSGAME M1 | |
| GMK NucBox M6 | |
| Gemiddeld AMD Radeon 660M (26.6 - 37.3, n=2) | |
| GMK NucBox M5 | |
| 1920x1080 Low Preset | |
| BOSGAME M1 | |
| GMK NucBox K6 | |
| GMK NucBox M6 | |
| Gemiddeld AMD Radeon 660M (16.5 - 22.9, n=4) | |
| GMK NucBox M5 | |
| 1920x1080 Medium Preset | |
| BOSGAME M1 | |
| GMK NucBox K6 | |
| GMK NucBox M6 | |
| Gemiddeld AMD Radeon 660M (12.8 - 15.1, n=4) | |
| 1920x1080 High Preset | |
| BOSGAME M1 | |
| GMK NucBox K6 | |
| GMK NucBox M6 | |
| Gemiddeld AMD Radeon 660M (10.2 - 13.3, n=4) | |
| 1920x1080 Ultra Preset | |
| BOSGAME M1 | |
| GMK NucBox K6 | |
| GMK NucBox M6 | |
| Gemiddeld AMD Radeon 660M (9.97 - 12.6, n=3) | |
| X-Plane 11.11 | |
| 1280x720 low (fps_test=1) | |
| GMK NucBox K6 | |
| BOSGAME M1 | |
| GMK NucBox M6 | |
| Gemiddeld AMD Radeon 660M (34.8 - 51.8, n=10) | |
| GMK NucBox M5 | |
| Beelink SER5 | |
| 1920x1080 med (fps_test=2) | |
| GMK NucBox K6 | |
| BOSGAME M1 | |
| GMK NucBox M6 | |
| Gemiddeld AMD Radeon 660M (24.2 - 38.5, n=10) | |
| Beelink SER5 | |
| GMK NucBox M5 | |
| 1920x1080 high (fps_test=3) | |
| GMK NucBox K6 | |
| BOSGAME M1 | |
| GMK NucBox M6 | |
| Gemiddeld AMD Radeon 660M (22.1 - 33.8, n=10) | |
| GMK NucBox M5 | |
| Beelink SER5 | |
Inactiviteit op Witcher 3 laat zien dat er problemen zijn met het handhaven van constante framerates, wat duidt op een slechte afhandeling van achtergrondactiviteiten of slechte stuurprogramma's. Zoals onze onderstaande grafiek laat zien, daalde de framerate af en toe scherp van ~30 FPS naar ~24 FPS zonder dat daar een reden voor leek te zijn, terwijl deze constant zou moeten blijven.
Witcher 3 FPS Chart
| lage | gem. | hoge | ultra | |
|---|---|---|---|---|
| The Witcher 3 (2015) | 98.2 | 52.6 | 25.7 | 17.8 |
| Dota 2 Reborn (2015) | 144.9 | 107.9 | 70 | 60.8 |
| Final Fantasy XV Benchmark (2018) | 48.3 | 24.7 | 17.9 | |
| X-Plane 11.11 (2018) | 51.8 | 38.5 | 33.2 | |
| Far Cry 5 (2018) | 71 | 33 | 30 | 27 |
| Strange Brigade (2018) | 120.2 | 43 | 35.9 | 29.6 |
| Tiny Tina's Wonderlands (2022) | 40 | 31.3 | 20.5 | 15.6 |
| F1 22 (2022) | 58.3 | 52.3 | 37.2 | 8.43 |
| Baldur's Gate 3 (2023) | 22.9 | 15.1 | 13.3 | 12.6 |
| Cyberpunk 2077 2.2 Phantom Liberty (2023) | 24.3 | 18.1 | 11.6 |
Uitstoot
Systeemgeluid
Het ventilatorgeluid is luider dan wat we opnamen bij de NucBox M5. Als u bedenkt dat de M6 een meer veeleisende CPU gebruikt zonder veranderingen aan de koeloplossing, is het hardere geluid geen verrassing. Zelfs gemiddelde belastingen zoals 3DMark 06 kunnen ervoor zorgen dat de ventilator al na 30 seconden in de test zijn maximale toerental bereikt, vergeleken met slechts 37 dB(A) op de langzamere M5. Pulseren van de ventilator is
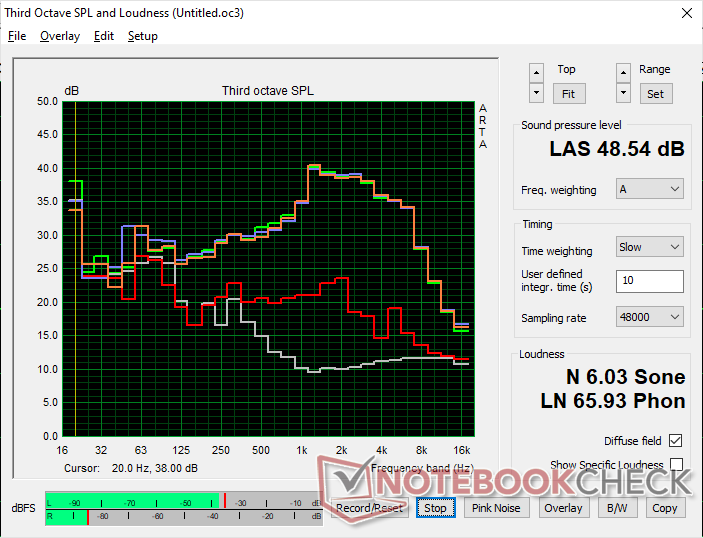
Geluidsniveau
| Onbelast |
| 31.9 / 32 / 33.8 dB (A) |
| Belasting |
| 48.5 / 48.5 dB (A) |
 | ||
30 dB stil 40 dB(A) hoorbaar 50 dB(A) luid |
||
min: | ||
| GMK NucBox M6 Radeon 660M, R5 6600H, AirDisk APF 10-512G | GMK NucBox M5 Vega 8, R7 5700U, Lexar 1024GB LNM6A1X001T-HNNNG | GMK NucBox K6 Radeon 780M, R7 7840HS, MasonSemi 1TB MC7000 | BOSGAME M1 Radeon 780M, R7 7840HS | Beelink SER5 Vega 6, R5 5560U, Crucial P3 Plus CT1000P3PSSD8 | Intel NUC 13 Pro Kit NUC13ANK Iris Xe G7 96EUs, i7-1360P, Samsung PM9A1 MZVL2512HCJQ | |
|---|---|---|---|---|---|---|
| Noise | 9% | 3% | 8% | 28% | 4% | |
| uit / omgeving * | 24.2 | 23.4 3% | 23.2 4% | 23.2 4% | 23.7 2% | 29.8 -23% |
| Idle Minimum * | 31.9 | 33.8 -6% | 31.3 2% | 32 -0% | 23.9 25% | 30.2 5% |
| Idle Average * | 32 | 33.8 -6% | 31.3 2% | 32 -0% | 23.9 25% | 31.1 3% |
| Idle Maximum * | 33.8 | 33.8 -0% | 33.4 1% | 32 5% | 23.9 29% | 31.9 6% |
| Load Average * | 48.5 | 36.5 25% | 47.5 2% | 38.7 20% | 28 42% | 40 18% |
| Witcher 3 ultra * | 48.5 | 36.8 24% | 43.6 10% | 41.7 14% | 27.6 43% | |
| Load Maximum * | 48.5 | 36.9 24% | 47.7 2% | 42 13% | 32.8 32% | 40.5 16% |
* ... kleiner is beter
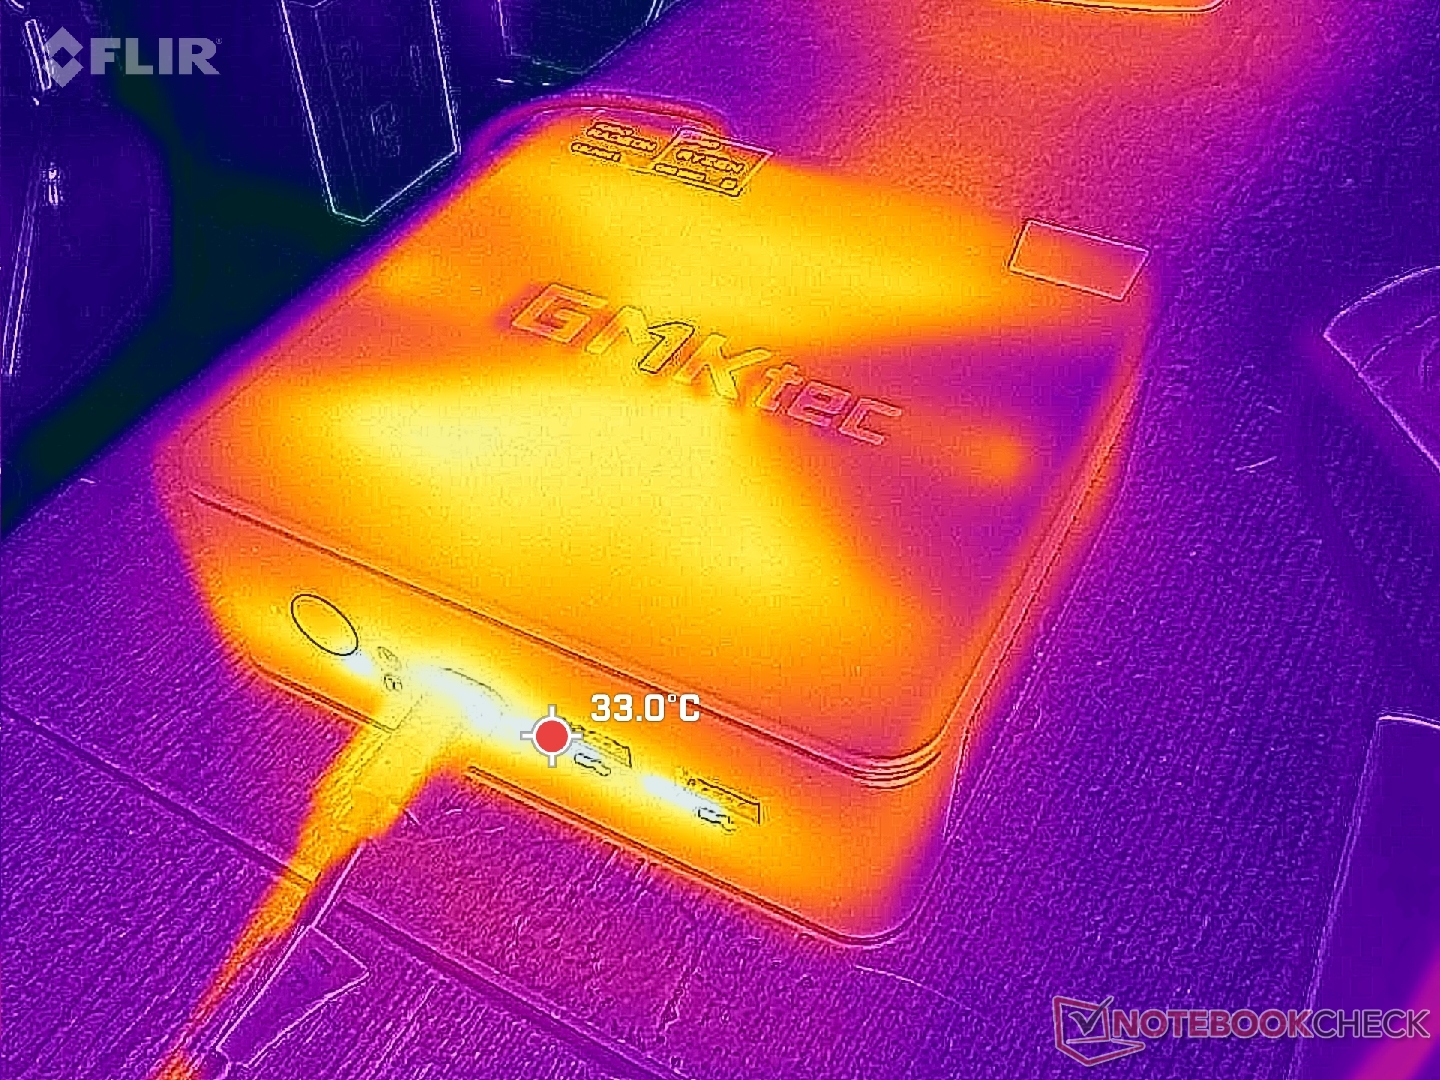
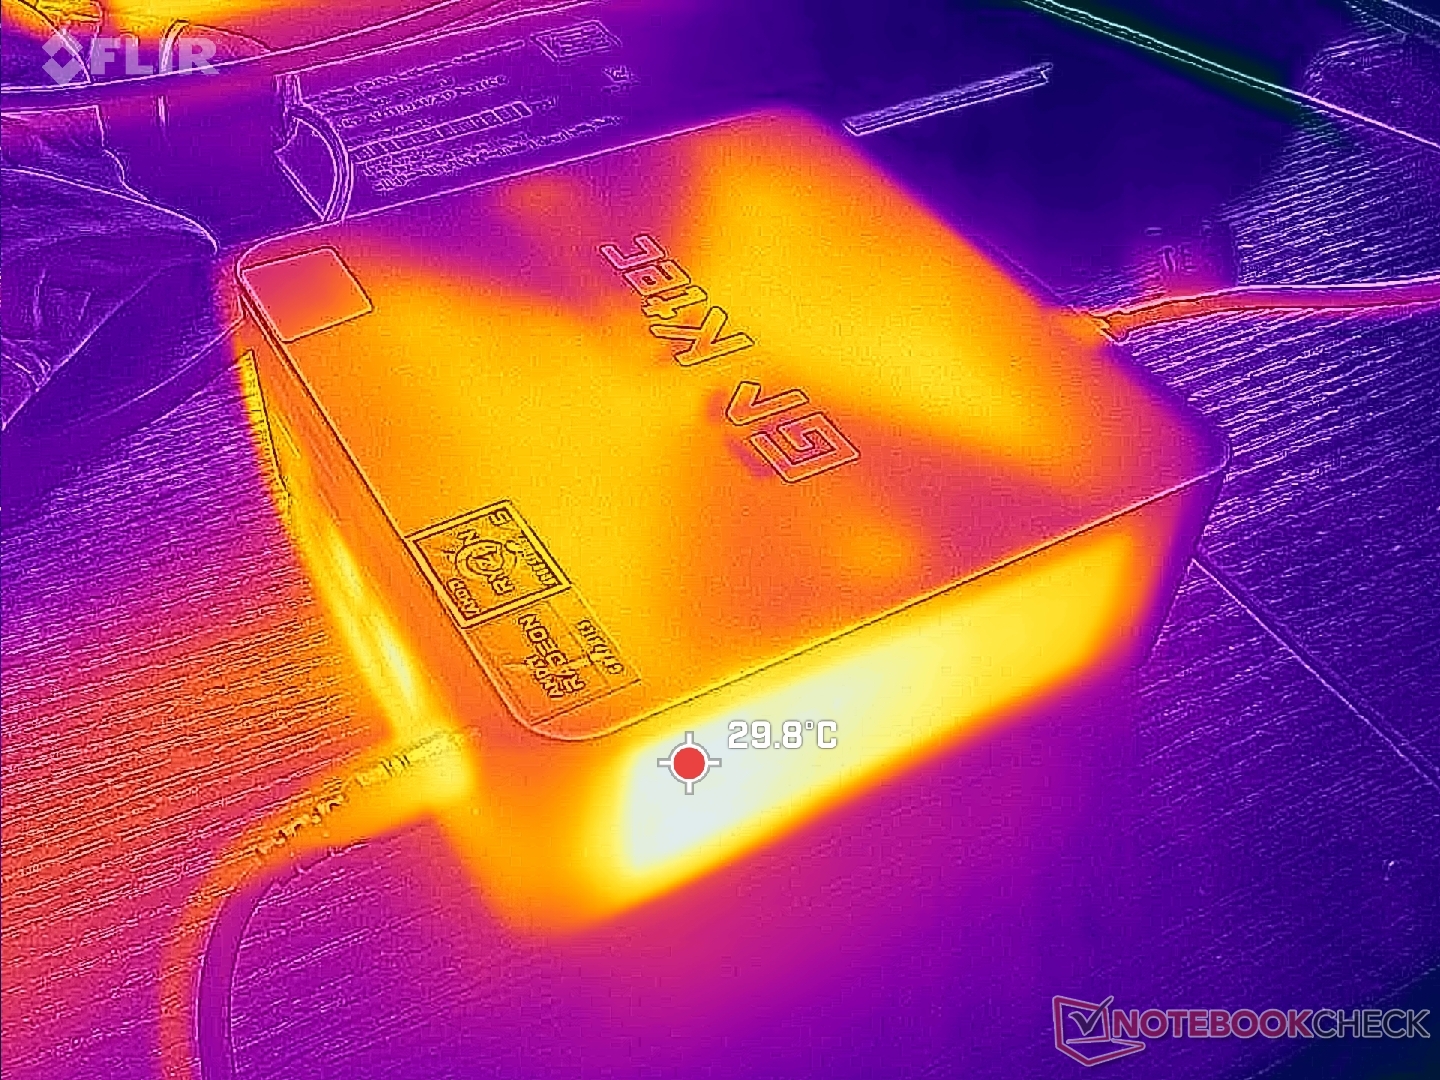
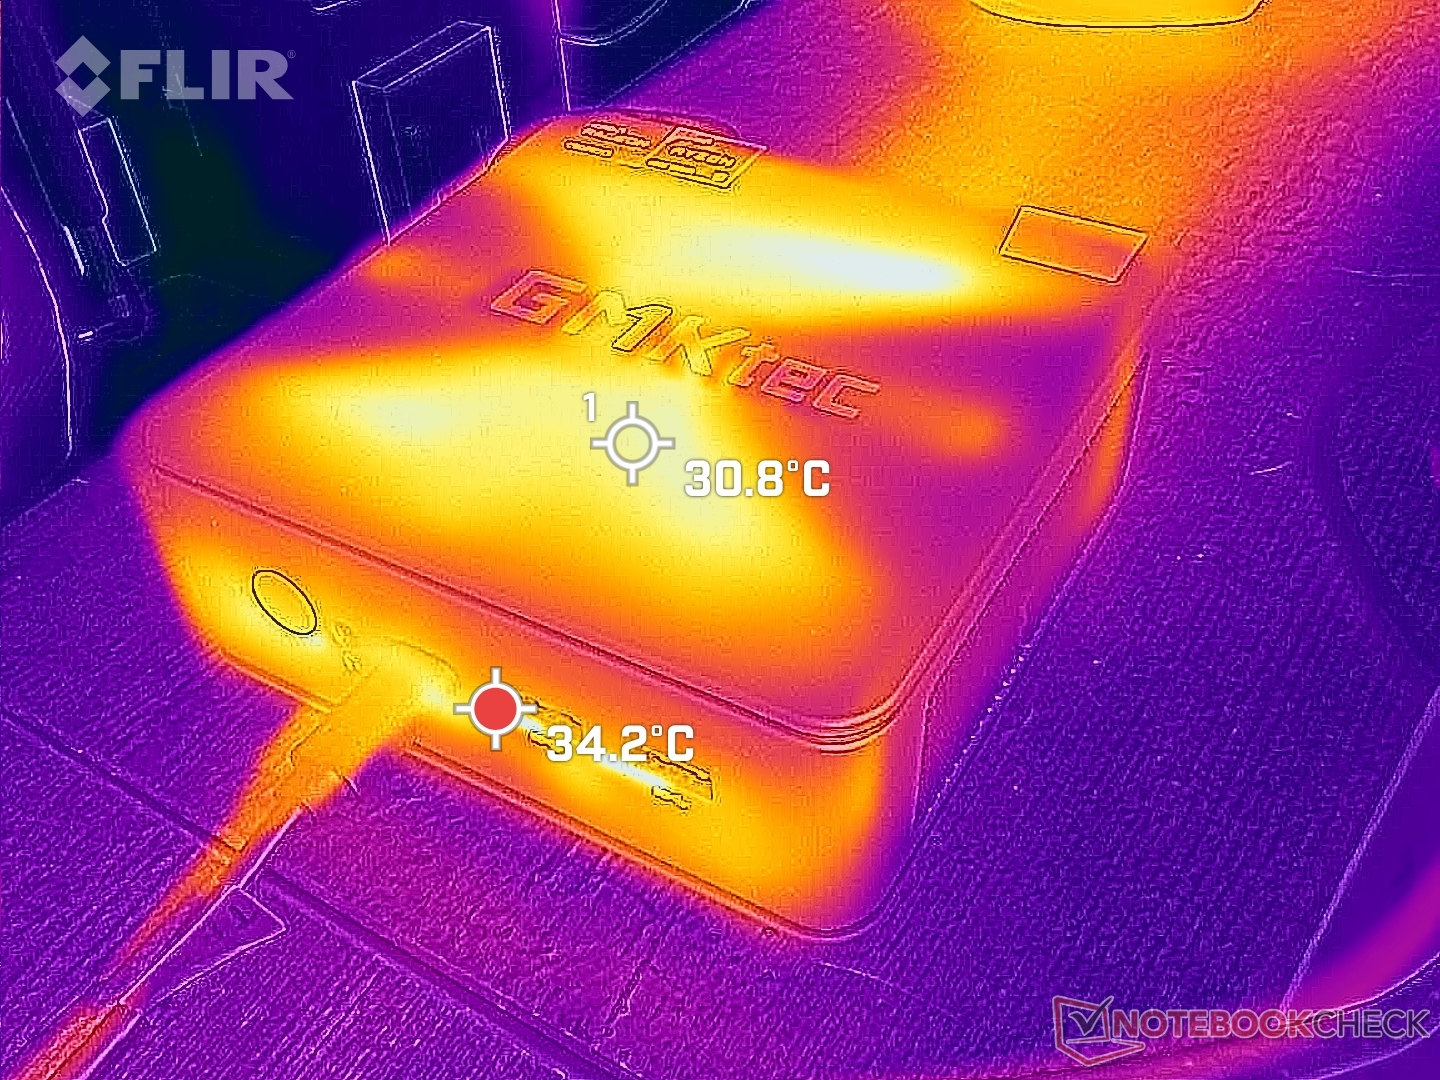
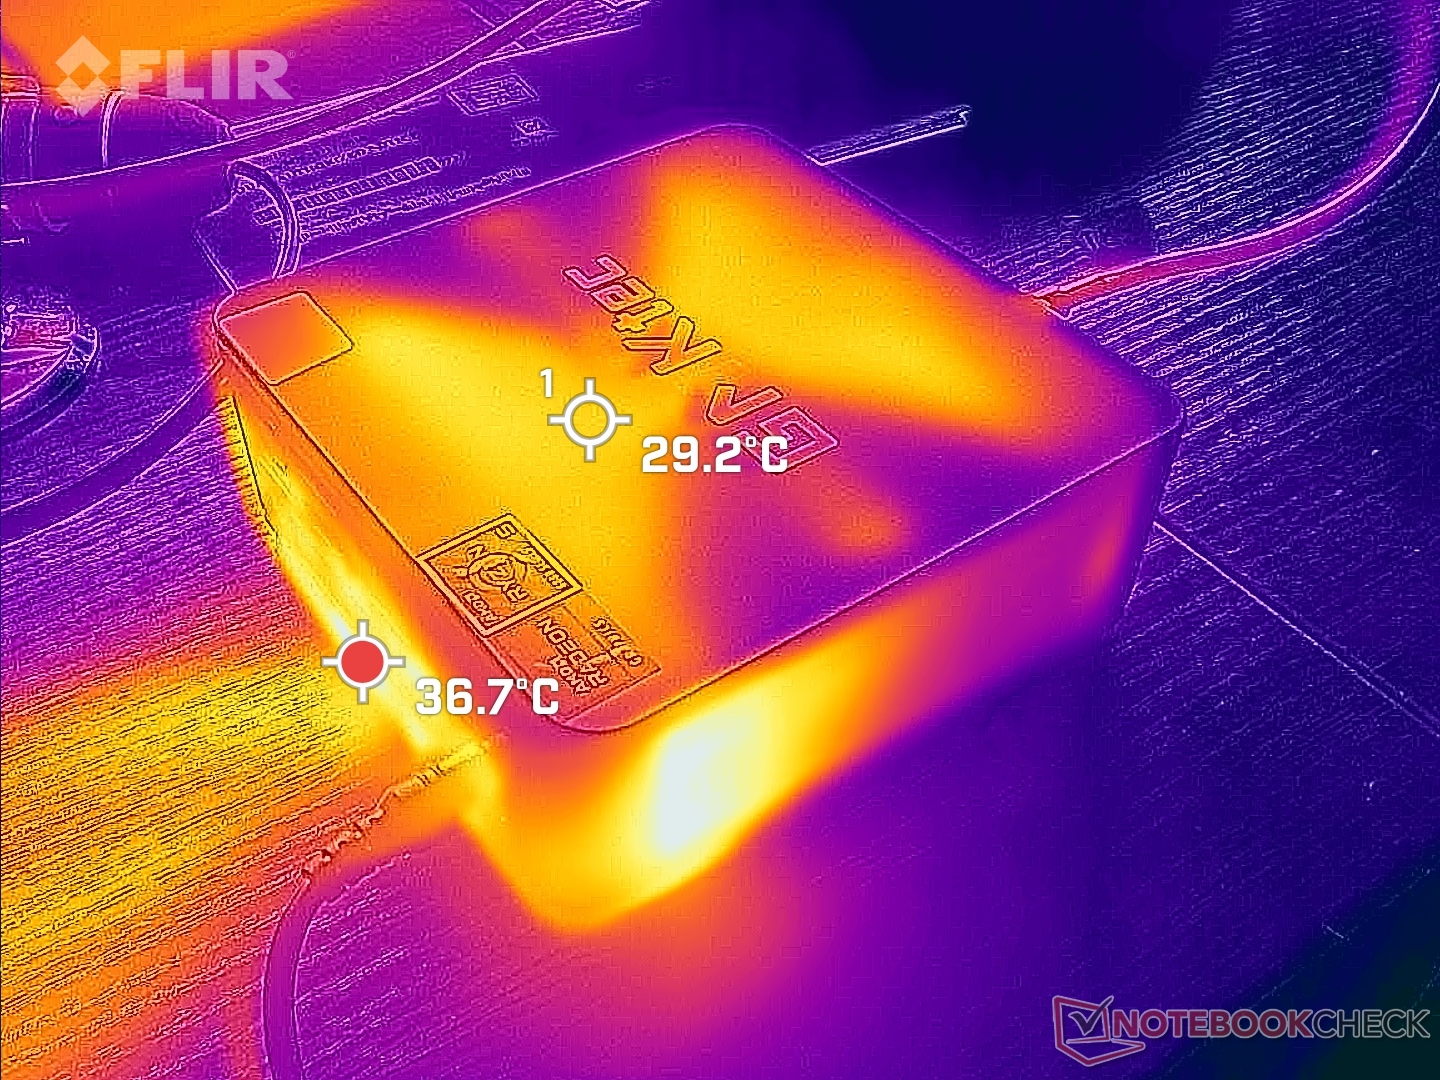
Temperatuur
De oppervlaktetemperatuur is nooit onaangenaam warm. In tegenstelling tot sommige Beelink modellen heeft de NucBox M6 geen roosters aan de bovenkant, maar wordt frisse lucht aangezogen via smalle sleuven langs de omtrek. Het is veilig om de unit verticaal te plaatsen, ook al worden sommige ventilatieroosters geblokkeerd.
Energiebeheer - Hogere prestaties, hoger verbruik
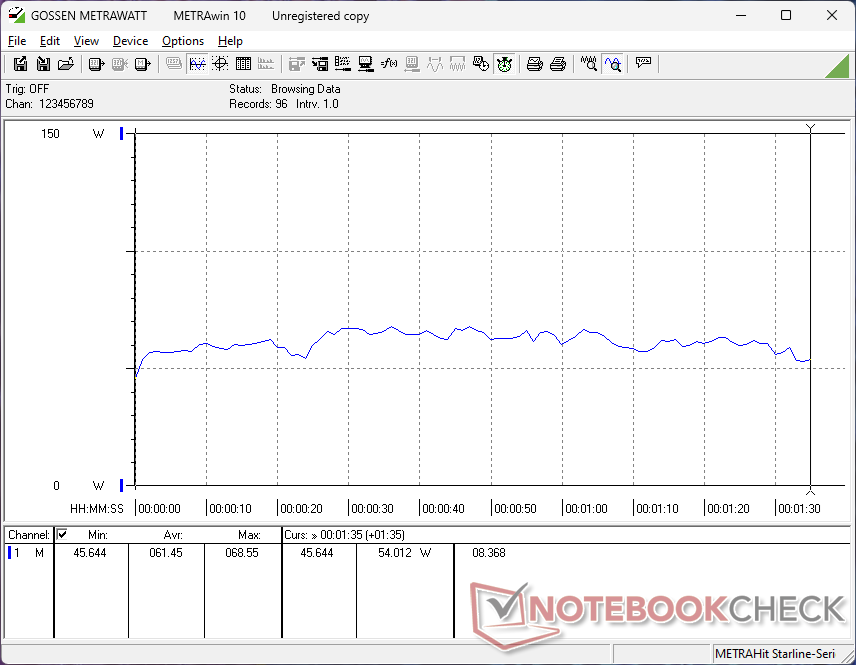
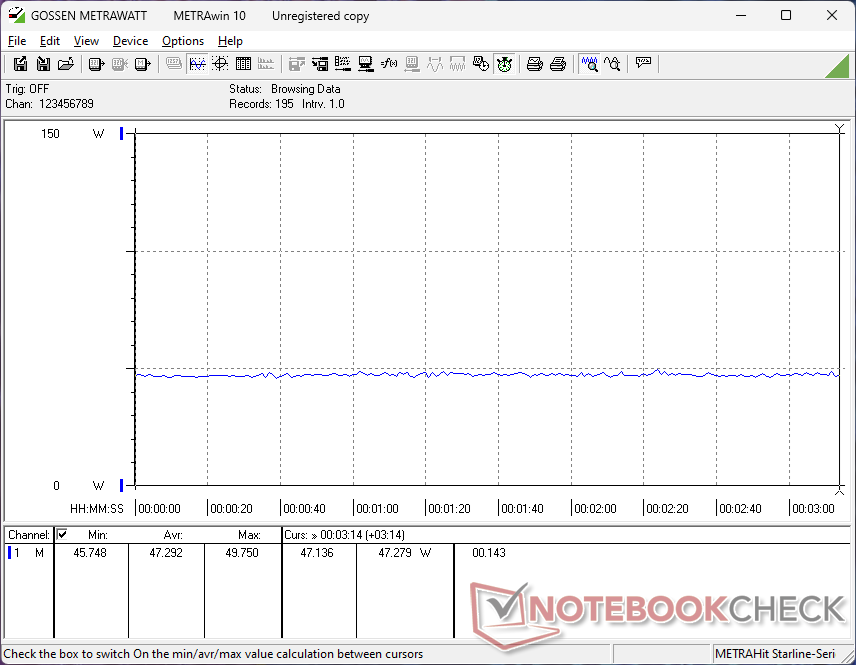
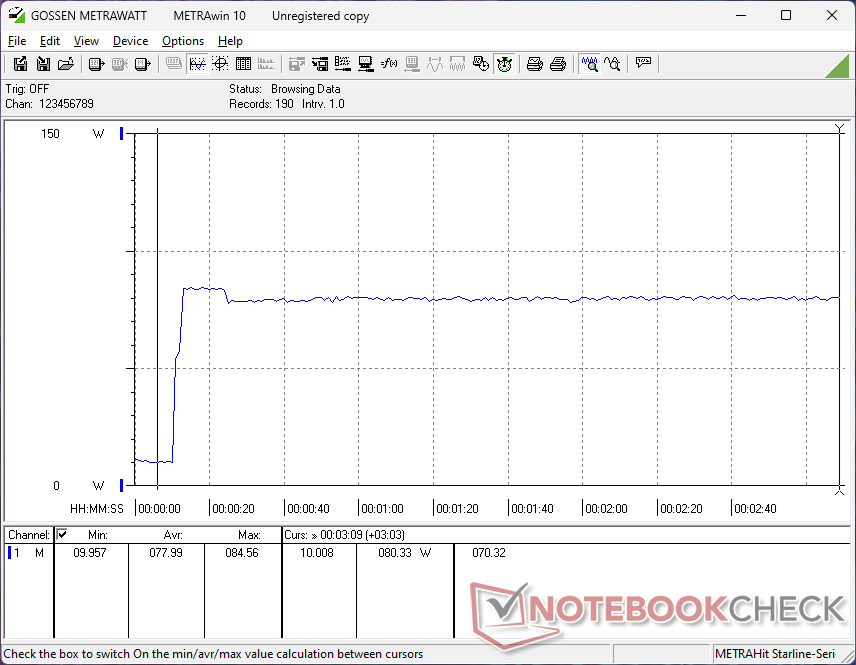
Stroomverbruik
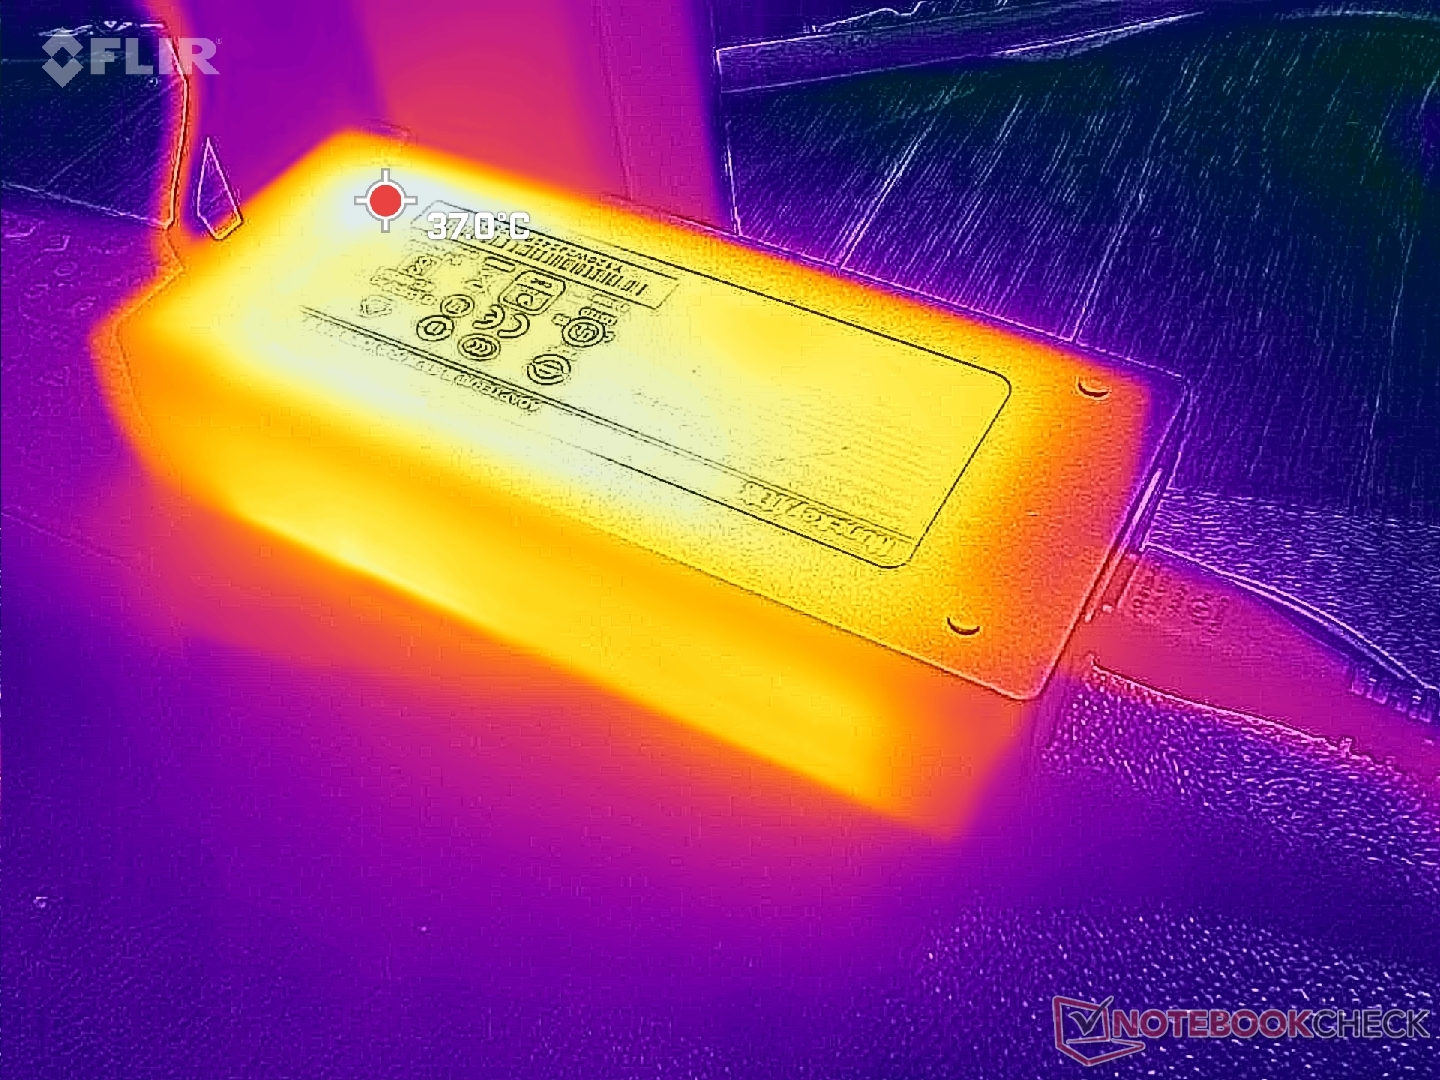
Het systeem is veel veeleisender dan de NucBox M5 door de overstap naar een CPU uit de H-serie. Het draaien van Witcher 3zou bijvoorbeeld 75 procent meer stroom vragen, terwijl Prime95 meer dan 2,5 keer zoveel stroom zou vragen. De Ryzen 5 6600H is zeker sneller dan de Ryzen 7 5700U in de NucBox M5, maar de prestaties per watt zijn nog steeds in het voordeel van de M5.
We zijn in staat om een maximaal stroomverbruik van 85 W te registreren van de middelgrote (~14,5 x 6,4 x 3,2 cm) 120 W AC-adapter wanneer de CPU volledig belast is. Merk op dat deze adapter groter is dan de 65 W wisselstroomadapter die bij de NucBox M5 wordt geleverd, vanwege de zwaardere processor van de NucBox M6.

| Uit / Standby | |
| Inactief | |
| Belasting |
|
Key:
min: | |
| GMK NucBox M6 R5 6600H, Radeon 660M, AirDisk APF 10-512G, , x, | GMK NucBox M5 R7 5700U, Vega 8, Lexar 1024GB LNM6A1X001T-HNNNG, , x, | GMK NucBox K6 R7 7840HS, Radeon 780M, MasonSemi 1TB MC7000, , x, | BOSGAME M1 R7 7840HS, Radeon 780M, , , x, | Beelink SER5 R5 5560U, Vega 6, Crucial P3 Plus CT1000P3PSSD8, , x, | Intel NUC 13 Pro Kit NUC13ANK i7-1360P, Iris Xe G7 96EUs, Samsung PM9A1 MZVL2512HCJQ, , x, | |
|---|---|---|---|---|---|---|
| Power Consumption | 39% | -8% | -15% | 43% | 0% | |
| Idle Minimum * | 7.9 | 5.9 25% | 6.7 15% | 7.3 8% | 4.4 44% | 5.1 35% |
| Idle Average * | 8 | 6.2 22% | 7 12% | 7.3 9% | 5 37% | 5.8 27% |
| Idle Maximum * | 8.3 | 6.4 23% | 7.6 8% | 8.4 -1% | 5.3 36% | 10.2 -23% |
| Load Average * | 61.5 | 28.2 54% | 74.3 -21% | 72.7 -18% | 29.8 52% | 68.1 -11% |
| Witcher 3 ultra * | 47.3 | 27.5 42% | 75 -59% | 80.5 -70% | 28.8 39% | |
| Load Maximum * | 84.6 | 29.5 65% | 85.7 -1% | 99.1 -17% | 40.4 52% | 108.3 -28% |
* ... kleiner is beter
Power Consumption Witcher 3 / Stresstest
Power Consumption external Monitor
Pro
Contra
Verdict - Grote waarde voor de prijs en grootte
Net als de rest van het assortiment slaat de NucBox M6 uit het park als het gaat om prestaties per dollar. De Ryzen 5 6600H loopt rondjes om elke Core i3 of Celeron optie die vaak te vinden is in de prijsklasse onder de $300. HTPC-gebruikers die maximale prestaties willen zonder veel geld uit te geven, kunnen de NucBox M5 overwegen.
Bij de GMKtec NucBox M6 draait alles om waarde zonder genoegen te nemen met langzamere CPU's uit de U-serie van de Core i3- of Celeron-families. Het ventilatorgeluid kan echter aan de luide kant zijn voor een mini PC.
Er zijn een paar nadelen, waaronder het gebrek aan USB4 ondersteuning en het hardere ventilatorgeluid dat gepaard gaat met de snellere CPU uit de H-serie. Wi-Fi 6E compatibiliteit, hoewel leuk om te hebben, kan prestatieproblemen vertonen en hetzelfde kan gezegd worden bij het afspelen van 4K video-inhoud op 60 FPS. Vooral deze laatste problemen kunnen wijzen op een gebrek aan zorg voor de kleine details van het model. Voor het doelpubliek van thuisgebruikers en elementaire HTPC-streamingtaken zullen de meesten echter eerder het ventilatorgeluid opmerken dan iets anders.
Prijs en beschikbaarheid
De NucBox M6 wordt nu verzonden rechtstreeks van de fabrikant voor $ 230 als een barebones kit of voor $ 300 met 16 GB RAM, 512 GB SSD en Windows 11 Pro. Het model is ook verkrijgbaar op Amazon voor hogere vanafprijzen.
Hinweis: We hebben ons beoordelingssysteem kürzlich geactualiseerd en de resultaten van versie 8 zijn niet vergelijkbaar met de resultaten van versie 7. Meer informatie vindt u hier beschikbaar.
Opmerking: We hebben ons beoordelingssysteem onlangs bijgewerkt en de resultaten van versie 8 zijn niet vergelijkbaar met de resultaten van versie 7. Meer informatie is beschikbaar hier .
GMK NucBox M6
- 04-07-2024 v8
Allen Ngo
 Total Sustainability Score:
 Transparantie
De selectie van te beoordelen apparaten wordt gemaakt door onze redactie. Het testexemplaar werd ten behoeve van deze beoordeling door de fabrikant of detailhandelaar in bruikleen aan de auteur verstrekt. De kredietverstrekker had geen invloed op deze recensie, noch ontving de fabrikant vóór publicatie een exemplaar van deze recensie. Er bestond geen verplichting om deze recensie te publiceren. Wij accepteren nooit een compensatie of betaling in ruil voor onze beoordelingen. Als onafhankelijk mediabedrijf is Notebookcheck niet onderworpen aan het gezag van fabrikanten, detailhandelaren of uitgevers.
[transparency_disclaimer]Dit is hoe Notebookcheck test
Elk jaar beoordeelt Notebookcheck onafhankelijk honderden laptops en smartphones met behulp van gestandaardiseerde procedures om ervoor te zorgen dat alle resultaten vergelijkbaar zijn. We hebben onze testmethoden al zo'n 20 jaar voortdurend ontwikkeld en daarbij de industriestandaard bepaald. In onze testlaboratoria wordt gebruik gemaakt van hoogwaardige meetapparatuur door ervaren technici en redacteuren. Deze tests omvatten een validatieproces in meerdere fasen. Ons complexe beoordelingssysteem is gebaseerd op honderden goed onderbouwde metingen en benchmarks, waardoor de objectiviteit behouden blijft. Meer informatie over onze testmethoden kunt u hier vinden.
Price comparison

