Notebookcheck Logo

XMG Neo 16 (Early 24) beoordeling: Volledige RTX 4090-kracht in een compacte gaminglaptop
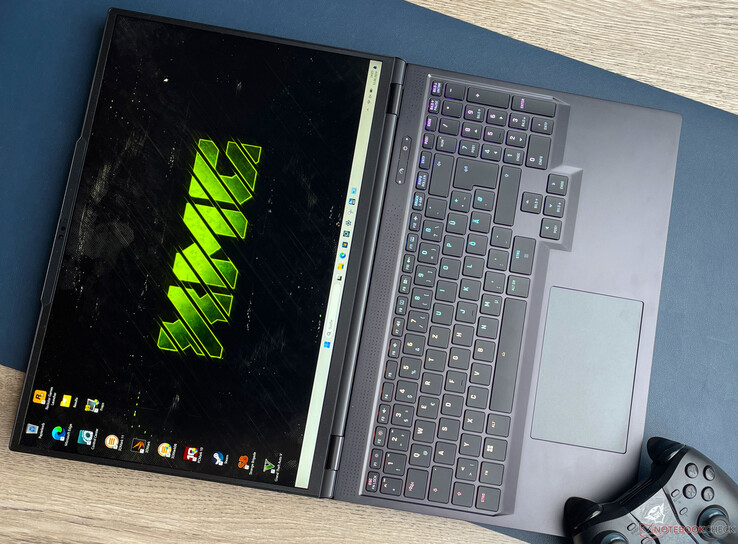
Laat het water maar komen.

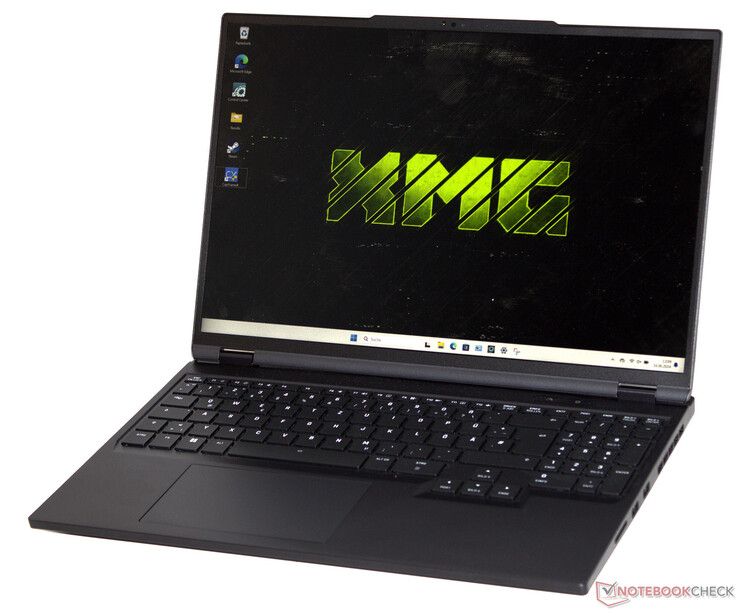
De Neo 16 is momenteel een van de krachtigste laptops: Core i9 14900HX en GeForce RTX 4090 bereiden de computer voor op gaming, streaming en rendering. Een optioneel, extern waterkoelsysteem perst elke druppel uit de hardware.

Met de Neo 16 richt Schenker zich op het topsegment en er worden dan ook geen halve maatregelen genomen: Core i9, GeForce RTX 4090 en 32 GB RAM maken de laptop geschikt voor veeleisende toepassingsscenario's (streamen, renderen, gamen). Maar hier hangt wel een prijskaartje aan: U moet ongeveer $4.000 (huidige dollar/euro wisselkoers) neerleggen voor het reviewmodel, hoewel er ook goedkopere varianten vanaf $2.000 verkrijgbaar zijn. De basis wordt geleverd door de Tongfang barebone (GM6IX9B). Concurrenten zijn er in de vorm van bijvoorbeeld de Razer Blade 16, de Medion Erazer Beast X40 en de Asus ROG Strix Scar 17.

Het apparaat is vergelijkbaar met het 2023-model, maar heeft een aantal nieuwe functies: Een helderder beeldscherm, een gereviseerd koelsysteem en een grotere openingshoek. Het (optionele) mechanische toetsenbord van de voorganger maakt geen deel uit van het aanbod van het 2024-model.

SCHENKER XMG Neo 16 (Early 24) (XMG Neo 16 Serie)
Processor
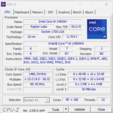
Intel Core i9-14900HX 24 x 1.6 - 5.8 GHz, 205 W PL2 / Short Burst, 205 W PL1 / Sustained, Raptor Lake-HX Refresh
Grafische kaart
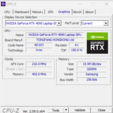
NVIDIA GeForce RTX 4090 Laptop GPU - 16 GB VRAM, Core: 2040 MHz, RAM: 2250 MHz, 175 W TDP ( waaronder 25 W Dynamic Boost), GDDR6, 32.0.15.5599, Advanced Optimus, MUX-Switch
Geheugen
32 GB 
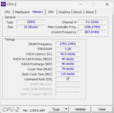
, DDR5-5600, Dual-Channel-Mode, two memory slots (both in use)
Beeldscherm
16.00 inch 16:10, 2560 x 1600 pixel 189 PPI, BOE NE160QDM-NZA, IPS, G-Sync, glimmend: nee, 240 Hz, Adaptive Sync
Moederbord
Intel HM770 (Raptor Lake-S PCH)
Opslag
Samsung 990 Pro 1 TB, 1024 GB 
, PCIe 4, M.2 2280, 865 GB beschikbaar
Verbindingen
4 USB 3.0, 1 USB 4.0 40 Gbps, 1 Thunderbolt, USB-C Power Delivery (PD), 1 HDMI, 1 DisplayPort, 1 Kensington Lock, Audio Verbindingen: Headset combined port, Card Reader: SD, SDHC, SDXC, , TPM 2.0
Netwerkmogelijkheden
Realtek RTL8125 2.5GBe Family Ethernet Controller (10/100/1000/2500MBit/s), Intel Wi-Fi 6E AX211 (a/b/g/h/n = Wi-Fi 4/ac = Wi-Fi 5/ax = Wi-Fi 6/ Wi-Fi 6E 6 GHz), Bluetooth 5.3
Afmetingen
hoogte x breedte x diepte (in mm): 26.6 x 356.7 x 253
Batterij
99.8 Wh, 6450 mAh Lithium-Polymer
Besturingssysteem
Microsoft Windows 11 Pro
Camera
Webcam: FHD
Primaire camera: 2.1 MPix
Bijkomende functionaliteiten
Luidsprekers: Stereo, Toetsenbord: Chiclet, Toetsenbordverlichting: ja, USB Thumbdrive (Drivers, Manuals), Stickers, Mousepad, 24 Maanden Garantie
Gewicht
2.52 kg, Voeding: 970 g
Prijs
3800 Euro
Opmerking: De fabrikant kan onderdelen van verschillende leveranciers gebruiken, waaronder beeldschermen, schijven of geheugensticks met vergelijkbare specificaties.


Potentiële concurrenten in vergelijkings

Evaluatie
Versie
Datum
Model
Gewicht
Hoogte
Formaat
Resolutie
Beste prijs
85.5 %v8
06-2024
SCHENKER XMG Neo 16 (Early 24)
i9-14900HX, NVIDIA GeForce RTX 4090 Laptop GPU
2.5 kg26.6 mm16.00"2560x1600
91.1 %
v7 (old)
v7 (old)
02-2024
Razer Blade 16 2024, RTX 4090
i9-14900HX, NVIDIA GeForce RTX 4090 Laptop GPU
2.5 kg22 mm16.00"2560x1600
89.2 %
v7 (old)
v7 (old)
02-2024
Medion Erazer Beast X40 2024
i9-14900HX, NVIDIA GeForce RTX 4090 Laptop GPU
2.9 kg36 mm17.00"2560x1600
87.2 %
v7 (old)
v7 (old)
08-2023
Asus ROG Strix Scar 17 G733PYV-LL053X
R9 7945HX3D, NVIDIA GeForce RTX 4090 Laptop GPU
2.9 kg28.3 mm17.30"2560x1440

Behuizing - De XMG-laptop heeft een aluminium behuizing

Het chassis van het 2023-model wordt niet gebruikt in het huidige Neo-model. De nieuwe behuizing heeft meer weg van de behuizing van de nieuwste XMG laptops - een stap in de goede richting: In plaats van een mix van plastic en metaal, heeft de fabrikant gekozen voor een behuizing die volledig van metaal is gemaakt (Uitzondering: de randen van het beeldscherm zijn van plastic). Het chassis is zo stabiel als u zou verwachten. De basiseenheid en het deksel kunnen slechts lichtjes gedraaid worden. Het deksel heeft een openingshoek tot 180 graden (model 2023: 135 graden). Dit maakt het gemakkelijker om inhoud te bekijken als er meerdere mensen aanwezig zijn. De stevige scharnieren houden het deksel stevig op zijn plaats en in bijna elke hoek. U kunt het apparaat met één hand openen.

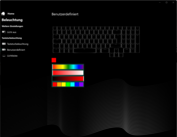
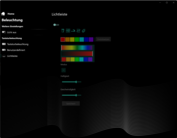
Opvallende ontwerpelementen zijn nergens te bekennen, wat betekent dat de matzwarte computer een serieus figuur slaat. Kleurrijk licht wordt geleverd door - naast de verlichte toetsen (RGB) - een door de gebruiker te definiëren, individueel aanpasbare LED-strip.

XMG Neo 16 (Begin 24)

De nieuwste Neo 16 lijkt iets compacter dan de voorganger, maar qua gewicht zijn de laptops niet uit elkaar te houden. Alleen de Blade 16 biedt meer compactheid - en bij een bijna identiek gewicht.

Vergelijking grootte

395 mm 282.1 mm 28.3 mm 2.9 kg383 mm 272 mm 36 mm 2.9 kg357 mm 268 mm 29.9 mm 2.5 kg356.7 mm 253 mm 26.6 mm 2.5 kg355 mm 244 mm 22 mm 2.5 kg297 mm 210 mm 1 mm 5.7 g

Kenmerken - USB 4 is aan boord

Vier van de vijf USB-poorten van de Neo 16 (3x USB-A, 2x USB-C) werken volgens de USB 3.2 Gen 1-standaard. Alleen de USB-C poort aan de achterkant biedt Thunderbolt 4 (USB 4), inclusief ondersteuning voor Power Delivery en Display Alt-modus. Er zijn in totaal twee video-uitgangen beschikbaar (1x HDMI, 1x DP). Een audio-aansluiting en een Gigabit Ethernet-poort (2,5 GBit/s) ronden het aanbod af.

De afstand tussen de USB-poorten (rechts: 12 mm, links: 8 mm) lijkt goed geproportioneerd: Er kunnen twee sticks (connectoren) van normale grootte tegelijkertijd worden aangesloten (zie galerijafbeeldingen). Video-uitgangen en voedingsaansluitingen bevinden zich aan de achterkant van het apparaat. De bijbehorende kabels zouden naar de achterkant lopen en dus niet in de weg zitten.

Linkerkant: Sleuf voor kabelslot, USB 3.2 Gen 1 (USB-A), USB 3.2 Gen 1 (USB-C), audio-combo
Rechterkant: Geheugenkaartlezer (SD), 2x USB 3.2 Gen 1 (USB-A)
Achterkant: 2x aansluitingen voor de waterkoeling, Thunderbolt 4/USB 4 (USB-C; Power Delivery, Displayport, G-Sync), HDMI, Gigabit Ethernet (2,5 GBit/s), voedingsaansluiting

SD-kaartlezer

De SD-kaartlezer (referentie: AV PRO microSD 128 GB V60) is een van de gemiddeld snelle modellen: Overdrachtssnelheden van 76 MB/s (overdracht van 250 jpg-afbeeldingen, 5 MB per bestand) en 87 MB/s (kopiëren van grote gegevensblokken) kunnen als acceptabel worden omschreven. De Razer Blade 16 laat zien dat aanzienlijk hogere cijfers mogelijk zijn.

SD Card Reader
average JPG Copy Test (av. of 3 runs)
Razer Blade 16 2024, RTX 4090
Intel Core i9-14900HX
171 (169.48min - 194.55max) MB/s +125%
Gemiddelde van klas Gaming
  (19 - 202, n=88, laatste 2 jaar)
95.9 MB/s +26%
Medion Erazer Beast X40 2024
Intel Core i9-14900HX (AV PRO microSD 128 GB V60)
77 MB/s +1%
SCHENKER XMG Neo 16 (Early 24)
Intel Core i9-14900HX (AV PRO microSD 128 GB V60)
76 MB/s
SCHENKER XMG Neo 16 E23
Intel Core i9-13900HX (AV PRO microSD 128 GB V60)
71 MB/s -7%
maximum AS SSD Seq Read Test (1GB)
Razer Blade 16 2024, RTX 4090
Intel Core i9-14900HX
181.81 MB/s +109%
Gemiddelde van klas Gaming
  (25.8 - 269, n=88, laatste 2 jaar)
120.1 MB/s +38%
Medion Erazer Beast X40 2024
Intel Core i9-14900HX (AV PRO microSD 128 GB V60)
90 MB/s +3%
SCHENKER XMG Neo 16 (Early 24)
Intel Core i9-14900HX (AV PRO microSD 128 GB V60)
87 MB/s
SCHENKER XMG Neo 16 E23
Intel Core i9-13900HX (AV PRO microSD 128 GB V60)
83 MB/s -5%

Communicatie

Onder optimale omstandigheden (geen Wi-Fi-apparaten in de buurt, korte afstand tussen de laptop en de server-pc) kunnen goede tot uitstekende gegevenssnelheden worden bereikt - een WiFi 6E-chip (Intel AX211) maakt dit mogelijk. Bekabelde verbindingen worden uitgevoerd door een Realtek Gigabit Ethernet controller (RTL8125, 2,5 GBit/s).

Networking
iperf3 transmit AXE11000
SCHENKER XMG Neo 16 E23
Intel Wi-Fi 6E AX211
1585 (642min - 1670max) MBit/s +56%
Razer Blade 16 2024, RTX 4090
Intel Killer Wi-Fi 7 BE1750W 320 MHz (BE200NGW)
1577 (796min - 1617max) MBit/s +55%
Gemiddelde van klas Gaming
  (469 - 1843, n=147, laatste 2 jaar)
1231 MBit/s +21%
Gemiddeld Intel Wi-Fi 6E AX211
  (64 - 1921, n=246)
1228 MBit/s +21%
SCHENKER XMG Neo 16 (Early 24)
Intel Wi-Fi 6E AX211
1018 (656min - 1248max) MBit/s
Medion Erazer Beast X40 2024
Intel Wi-Fi 6E AX211
636 (501min - 571max) MBit/s -38%
iperf3 receive AXE11000
SCHENKER XMG Neo 16 (Early 24)
Intel Wi-Fi 6E AX211
1689 (843min - 1714max) MBit/s
SCHENKER XMG Neo 16 E23
Intel Wi-Fi 6E AX211
1665 (839min - 1716max) MBit/s -1%
Medion Erazer Beast X40 2024
Intel Wi-Fi 6E AX211
1650 (1031min - 1711max) MBit/s -2%
Razer Blade 16 2024, RTX 4090
Intel Killer Wi-Fi 7 BE1750W 320 MHz (BE200NGW)
1604 (1554min - 1623max) MBit/s -5%
Gemiddelde van klas Gaming
  (680 - 1890, n=147, laatste 2 jaar)
1399 MBit/s -17%
Gemiddeld Intel Wi-Fi 6E AX211
  (582 - 1890, n=246)
1383 MBit/s -18%
050100150200250300350400450500550600650700750800850900950100010501100115012001250130013501400145015001550160016501700Tooltip
SCHENKER XMG Neo 16 (Early 24) Intel Wi-Fi 6E AX211; iperf3 transmit AXE11000; iperf 3.1.3: Ø1018 (656-1248)
Razer Blade 16 2024, RTX 4090 Intel Killer Wi-Fi 7 BE1750W 320 MHz (BE200NGW); iperf3 transmit AXE11000; iperf 3.1.3: Ø1550 (796-1617)
Medion Erazer Beast X40 2024 Intel Wi-Fi 6E AX211; iperf3 transmit AXE11000; iperf 3.1.3: Ø636 (601-671)
SCHENKER XMG Neo 16 E23 Intel Wi-Fi 6E AX211; iperf3 transmit AXE11000; iperf 3.1.3: Ø1564 (642-1670)
SCHENKER XMG Neo 16 (Early 24) Intel Wi-Fi 6E AX211; iperf3 receive AXE11000; iperf 3.1.3: Ø1661 (843-1714)
Razer Blade 16 2024, RTX 4090 Intel Killer Wi-Fi 7 BE1750W 320 MHz (BE200NGW); iperf3 receive AXE11000; iperf 3.1.3: Ø1604 (1554-1623)
Medion Erazer Beast X40 2024 Intel Wi-Fi 6E AX211; iperf3 receive AXE11000; iperf 3.1.3: Ø1671 (1585-1711)
SCHENKER XMG Neo 16 E23 Intel Wi-Fi 6E AX211; iperf3 receive AXE11000; iperf 3.1.3: Ø1637 (839-1716)

Webcam

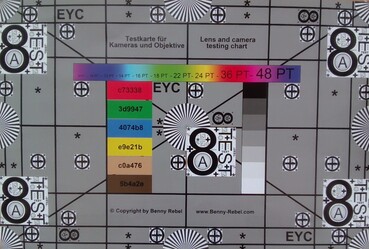
De webcam (2.1 MP) levert gemiddelde kwaliteit en er is ondersteuning voor Windows Hello. Bovendien is er een mechanische sluiter.
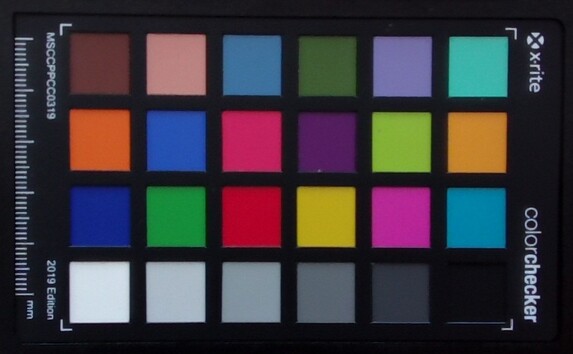
ColorChecker
11.8 ∆E
10.2 ∆E
7.3 ∆E
7.9 ∆E
6.3 ∆E
5.8 ∆E
13.2 ∆E
6.1 ∆E
11.7 ∆E
8.2 ∆E
5.3 ∆E
9.7 ∆E
6.9 ∆E
4.9 ∆E
4.7 ∆E
11.6 ∆E
9.2 ∆E
3.5 ∆E
8.6 ∆E
9.1 ∆E
9.6 ∆E
12.6 ∆E
12.7 ∆E
12 ∆E
ColorChecker SCHENKER XMG Neo 16 (Early 24): 8.7 ∆E min: 3.45 - max: 13.19 ∆E

Accessoires

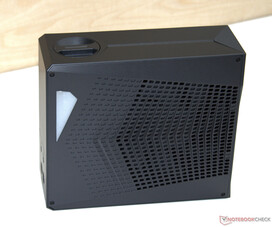
De laptop wordt geleverd met een USB-stick (stuurprogramma's, instructies), stickers en een muismat. Een optioneel accessoire wordt geleverd in de vorm van externe waterkoeling ($230).

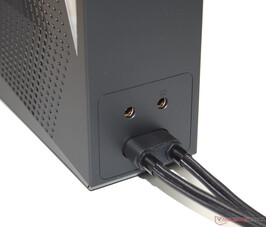
Externe waterkoeling (Oasis Mk2)
De waterleiding is magnetisch bevestigd

Onderhoud

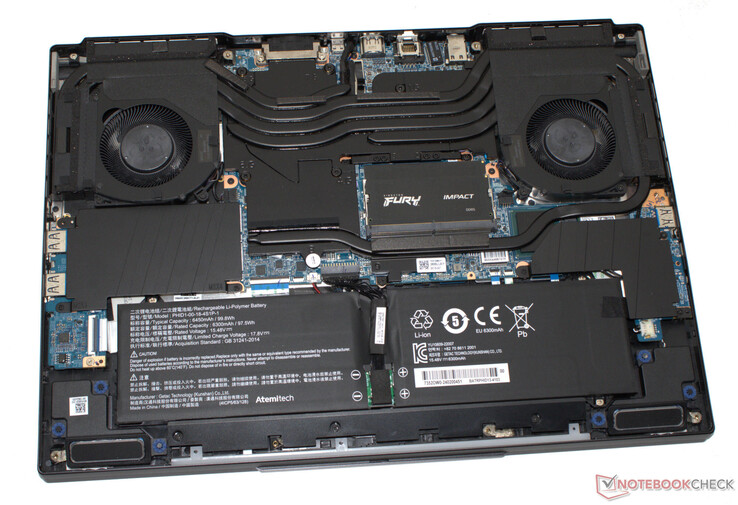
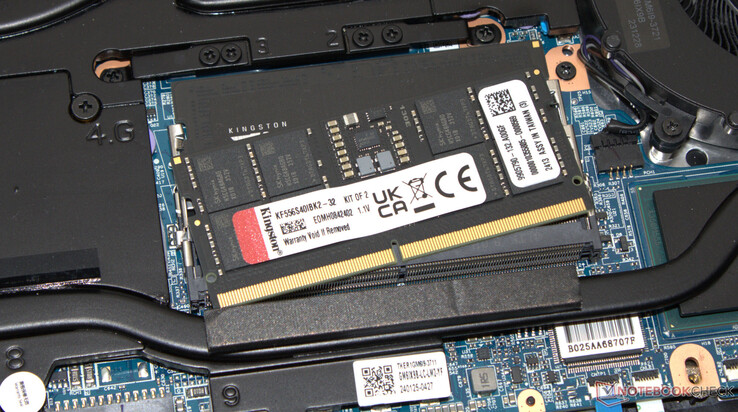
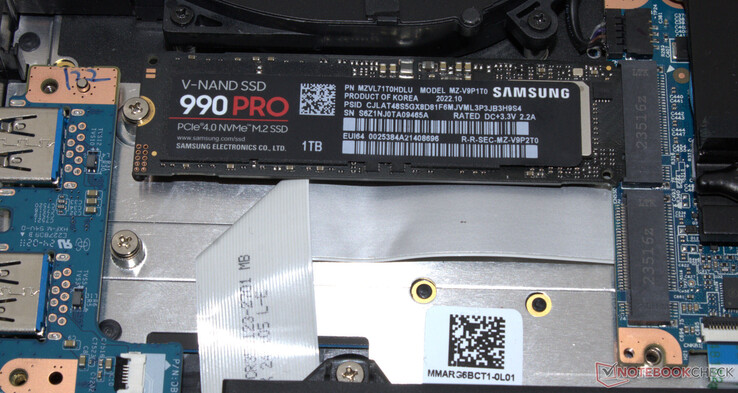
Nadat u alle schroeven aan de onderkant van het apparaat hebt verwijderd, kunt u het deksel van de onderkant losmaken met behulp van een plectrum of een platte spatel. Hierdoor krijgt u toegang tot de RAM-banken (beide zijn bezet), de ventilatoren en de batterij. De SSD en de SSD-sleuven (PCIe 4, M.2 2280) en de Wi-Fi-module worden afgedekt door extra, geschroefde platen.

XMG Neo 16 (E24) hardware

Garantie

In de EU biedt Schenker een basisgarantie van twee jaar, inclusief een ophaalservice en een snelle reparatieservice van 6 maanden (reparaties binnen 48 uur). Een garantie van 36 maanden kost u tussen de $100 en $160 - afhankelijk van de gekozen snelle reparatieperiode.

Invoerapparaten - Een toetsenbord met individuele toetsverlichting

Toetsenbord

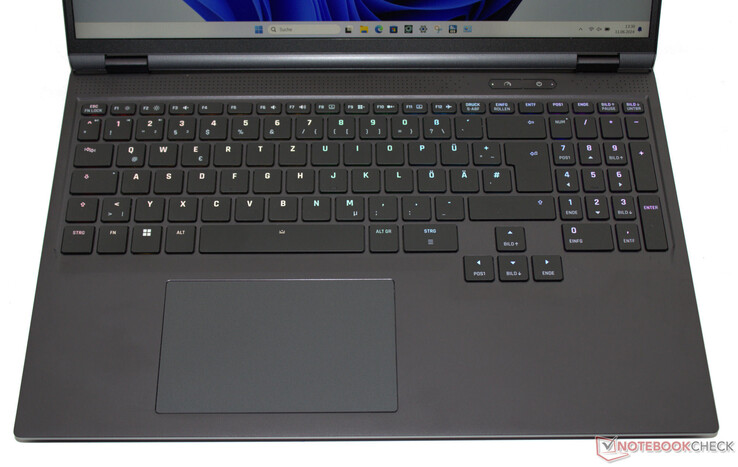
U kon de Neo 16 van vorig jaar bestellen met een optioneel mechanisch toetsenbord, maar het huidige model heeft alleen een chiclet-toetsenbord. Het toetsenbord beslaat de volledige breedte van de laptop en er zijn ook een numeriek toetsenblok en individuele toetsverlichting (RGB) aan boord. De holle, gebogen toetsen hebben een gemiddelde veerweg, een goed gedefinieerd drukpunt en een zeer prettige weerstand. Het toetsenbord buigt niet tijdens het typen. Wat opvalt is hoe comfortabel de off-center pijltjestoetsen van volledige grootte zijn om te gebruiken - een verbetering ten opzichte van het model van vorig jaar.

Touchpad

Een muisalternatief wordt geboden door een multitouch-capabel clickpad (ongeveer 12,3 x 7,7 cm), waarvan de gladde oppervlakken het uitvoeren van veegbewegingen zo gemakkelijk mogelijk maken. Het biedt een korte beweging en een duidelijk drukpunt.

XMG Neo 16 (E24) toetsenbord

Beeldscherm - Schenker heeft gekozen voor een helder IPS-paneel

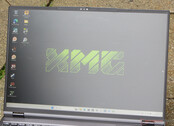
Het geïnstalleerde 16-inch beeldscherm (2.560 x 1.600 pixels) mist niets aan helderheid (~ 500 cd/m²), maar het contrast (1.000:1) zou hoger kunnen. Op dit gebied is de Blade 16's OLED-paneel een beter totaalpakket - dankzij het ontwerp levert het prachtige zwartwaarden en contrast. Over het algemeen zijn de cijfers van de Neo 16 meer dan voldoende om het apparaat binnenshuis te gebruiken. Buitenshuis is het scherm goed leesbaar, zolang de zon niet te fel is. Enkele positieve aspecten zijn dat het zeer goed reagerende, kijkhoekstabiele 16:10, 240 Hz paneel (IPS, G-Sync) geen tekenen van PWM-flikkering vertoont, ongeacht de helderheidsinstelling. Alternatieve schermopties zijn niet beschikbaar.

Subpixels
Subpixels
Lichte bloeding
Lichte bloeding
Buiten
Buiten
Kijkhoek
Kijkhoek
517
cd/m²
510
cd/m²
507
cd/m²
514
cd/m²
530
cd/m²
500
cd/m²
453
cd/m²
483
cd/m²
462
cd/m²
Helderheidsverdeling
BOE NE160QDM-NZA getest met X-Rite i1Pro 2
Maximum: 530 cd/m² (Nits) Gemiddelde: 497.3 cd/m² Minimum: 26 cd/m²
Helderheidsverdeling: 85 %
Helderheid in Batterij-modus: 530 cd/m²
Contrast: 1000:1 (Zwart: 0.53 cd/m²)
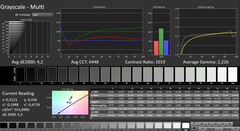
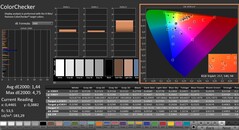
ΔE Color 3.21 | 0.5-29.43 Ø4.9, calibrated: 1.44
ΔE Greyscale 4.2 | 0.5-98 Ø5.2
70.6% AdobeRGB 1998 (Argyll 2.2.0 3D)
98% sRGB (Argyll 2.2.0 3D)
70.2% Display P3 (Argyll 2.2.0 3D)
Gamma: 2.226
SCHENKER XMG Neo 16 (Early 24)
BOE NE160QDM-NZA, IPS, 2560x1600, 16"
Razer Blade 16 2024, RTX 4090
Samsung SDC41AB (ATNA60DL03-0), OLED, 2560x1600, 16"
Medion Erazer Beast X40 2024
BOE NE170QDM-NZ1, IPS, 2560x1600, 17"
SCHENKER XMG Neo 16 E23
BOE0AF0 NE160QDM-NZ1, IPS, 2560x1600, 16"
Display
26%
-1%
-2%
Display P3 Coverage
70.2
99.1
41%
68.1
-3%
67.3
-4%
sRGB Coverage
98
99.9
2%
99.5
2%
96.7
-1%
AdobeRGB 1998 Coverage
70.6
95.6
35%
69
-2%
68.9
-2%
Response Times
95%
-20%
-49%
Response Time Grey 50% / Grey 80% *
11.2 ?(5.2, 6)
0.24 ?(0.15, 0.09)
98%
11.7 ?(5.7, 6)
-4%
14.5 ?(7.1, 7.4)
-29%
Response Time Black / White *
5.1 ?(1.6, 3.5)
0.4 ?(0.2, 0.2)
92%
6.9 ?(2.8, 4.1)
-35%
8.6 ?(3.9, 4.7)
-69%
PWM Frequency
960
Screen
251%
25%
15%
Brightness middle
530
418
-21%
422
-20%
372
-30%
Brightness
497
420
-15%
388
-22%
349
-30%
Brightness Distribution
85
98
15%
87
2%
88
4%
Black Level *
0.53
0.02
96%
0.42
21%
0.32
40%
Contrast
1000
20900
1990%
1005
1%
1163
16%
Colorchecker dE 2000 *
3.21
1.07
67%
1.42
56%
2.06
36%
Colorchecker dE 2000 max. *
5.8
4.04
30%
1.97
66%
3
48%
Colorchecker dE 2000 calibrated *
1.44
1.07
26%
0.7
51%
1.5
-4%
Greyscale dE 2000 *
4.2
1.12
73%
1.2
71%
1.9
55%
Gamma
2.226 99%
2.29 96%
2.078 106%
2.312 95%
CCT
6448 101%
6417 101%
6581 99%
6747 96%
Totaal Gemiddelde (Programma / Instellingen)
124% / 181%
1% / 13%
-12% / 2%

* ... kleiner is beter

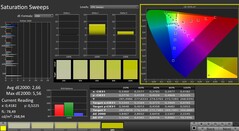
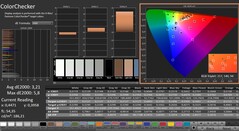
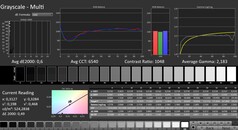
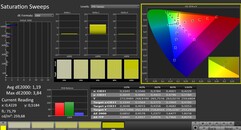
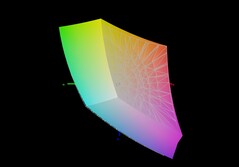
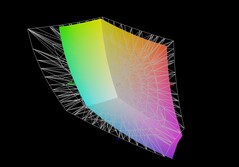
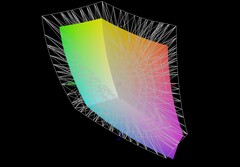
Out-of-the-box levert het beeldscherm een fatsoenlijke kleurweergave: Met een DeltaE van 3,2 mist de afwijking net de doelwaarde (DeltaE < 3). Een kalibratie brengt dit terug tot 1,44 - een goed cijfer. Van alle standaard kleurruimten (AdobeRGB, sRGB, DCI P3) is het paneel - net als de Erazer Beast X40 beeldscherm - kan alleen de sRGB-ruimte bijna volledig weergeven. Het weergeven van alle drie de kleurruimten is voorbehouden aan het OLED-paneel in de Blade 16.

Het kleurenprofiel dat we hebben gemaakt, kan gratis worden gedownload en gebruikt. U vindt een link in het informatievak van het scherm.

CalMAN: Grijze schubben
CalMAN: Kleurverzadiging
CalMAN: Kleurencontrole
CalMAN: Grijze schalen (gekalibreerd)
CalMAN: Kleurverzadiging (gekalibreerd)
CalMAN: ColorChecker (gekalibreerd)
XMG Neo 16 E24 vs sRGB
XMG Neo 16 E24 vs AdobeRGB
XMG Neo 16 E24 vs DCI P3

Responstijd Scherm

De responstijden van het scherm tonen hoe snel het scherm in staat is om van één kleur naar de andere te veranderen. Trage responstijden kunnen aanleiding geven tot 'nabeelden' rond bewegende objecten of het scherm wazig maken (blur). Vooral spelers van snelle 3D-games hebben baat bij een scherm met snelle responstijden.
       Responstijd Zwart naar Wit
5.1 ms ... stijging ↗ en daling ↘ gecombineerd↗ 1.6 ms stijging
↘ 3.5 ms daling
Het scherm vertoonde erg snelle responstijden in onze tests en zou zeer geschikt moeten zijn voor snelle games.
Ter vergelijking: alle testtoestellen variëren van 0.1 (minimum) tot 240 (maximum) ms. » 14 % van alle toestellen zijn beter.
Dit betekent dat de gemeten responstijd beter is dan het gemiddelde (20.9 ms) van alle geteste toestellen.
       Responstijd 50% Grijs naar 80% Grijs
11.2 ms ... stijging ↗ en daling ↘ gecombineerd↗ 5.2 ms stijging
↘ 6 ms daling
Het scherm vertoonde prima responstijden in onze tests maar is misschien wat te traag voor competitieve games.
Ter vergelijking: alle testtoestellen variëren van 0.165 (minimum) tot 636 (maximum) ms. » 21 % van alle toestellen zijn beter.
Dit betekent dat de gemeten responstijd beter is dan het gemiddelde (32.8 ms) van alle geteste toestellen.

Screen Flickering / PWM (Pulse-Width Modulation)

Om de schermhelderheid te verlagen schakelen sommige laptops het backlight erg snel aan en uit. Dit gebeurt aan een dergelijk hoge frequentie dat het niet zichtbaar is voor het menselijk oog. Als de frequentie te laag is kunnen personen met gevoelige ogen geïrriteerd geraken, hoofdpijn krijgen en zelfs flickering waarnemen.
Screen flickering / PWM niet waargenomen

Ter vergelijking: 53 % van alle geteste toestellen maakten geen gebruik van PWM om de schermhelderheid te verlagen. Als het wel werd gebruikt, werd een gemiddelde van 8684 (minimum: 5 - maximum: 343500) Hz waargenomen.

100 % helderheid
100 % helderheid
75 % helderheid
75 % helderheid
50 % helderheid
50 % helderheid
25 % helderheid
25 % helderheid
0 % helderheid
0 % helderheid

Prestaties - Raptor Lake en Ada Lovelace zorgen voor een ton aan vermogen

De Neo 16 (Early 24) is gericht op gamers, ontwerpers en, in het algemeen, alle gebruikersgroepen die veel kracht nodig hebben. Elke specificatievariant is uitgerust met een Core i9 14900HX en het GPU-palet varieert van RTX 4060 tot RTX 4090 - ons model is een RTX 4090. Individuele configuraties en de aankoop van de laptop zijn mogelijk via Bestware.com (Duits). Het recensietoestel dat wij hier hebben, is verkrijgbaar voor ongeveer $4.000, terwijl u voor het instapmodel (RTX 4060) ongeveer $2.000 betaalt. De optioneel verkrijgbare waterkoeling (Oasis MK2) is inbegrepen bij de RTX 4080 of RTX 4090 Neo 16 modellen.

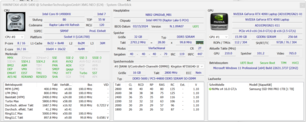
CPU-Z
CPU-Z
CPU-Z
CPU-Z
CPU-Z
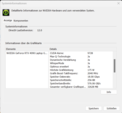
Nvidia systeem info
GPU-Z
GPU-Z
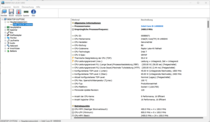
HWInfo
HWInfo


Testomstandigheden

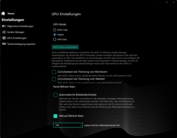
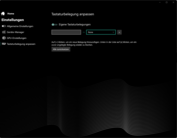
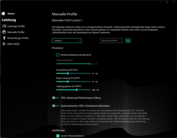
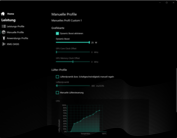
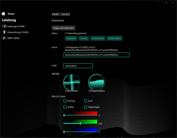
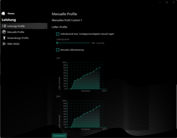
U kunt kiezen uit drie fabrikantspecifieke prestatiemodi (zie tabel). Tijdens de test hebben we de modi "Overboost" (benchmarks) en "Balanced" (batterijtest) gebruikt. De GPU-modus was ingesteld op "Hybrid" (= Optimus). U kunt individuele profielen beheren via het Control Center. Dit betekent dat u de CPU Power Limit, de GPU TGP en/of de bovengrens van de temperatuur kunt aanpassen. Met een aparte toets (naast de aan/uit-knop) kunt u snel schakelen tussen de modi.

We hadden de optioneel verkrijgbare externe waterkoeling (Oasis Mk2) tot onze beschikking, maar hebben deze tijdens het testen niet gebruikt. Desondanks hebben we enkele metingen onafhankelijk van de officiële tests uitgevoerd (zie vergelijkingstabel).

Overboost Enthusiast Gebalanceerd
Vermogenslimiet 1 (HWInfo) 205 Watt 205 Watt 205 Watt
Vermogenslimiet 2 (HWInfo) 205 Watt 205 Watt 205 Watt
Geluid (Witcher 3) 54 dB(A) 51 dB(A) 32 dB(A)
Prestaties (Witcher 3) 214fps 198fps 30fps (vergrendelen)
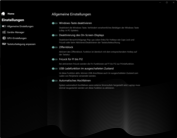
Controlecentrum
Controlecentrum
Controlecentrum
Controlecentrum
Controlecentrum
Controlecentrum
Controlecentrum
Controlecentrum
Controlecentrum
Controlecentrum
Controlecentrum
Controlecentrum
Controlecentrum
Controlecentrum
Controlecentrum
Controlecentrum

Processor

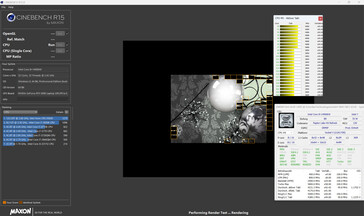
De laptop wordt aangedreven door een Core i9 14900HX (Raptor Lake) - andere CPU's zijn niet beschikbaar. De Core i9 biedt in totaal 24 cores (8P + 16E = 32 threads) op een maximale snelheid van 5,8 GHz (P) en 4,1 GHz (E). Voortdurende belasting van meerdere threads (CB15-lus) resulteert in voortdurende maar licht afnemende prestaties (Overboost) - het gebruik van de Oasis waterkoeling gaat dit effect tegen. De andere twee vermogensmodi zorgen voor consistente prestaties, zelfs zonder waterkoeling - natuurlijk op een laag niveau.

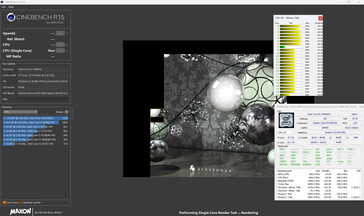
"Overboost" levert bovengemiddelde CPU-cijfers en "Enthusiast" zit iets onder het gemiddelde - dit geldt vooral voor de multi-thread prestaties. In elk van de drie profielen liggen de single-thread prestaties op een vergelijkbaar hoog niveau. De optionele waterkoeling (Oasis) zorgt voor een kleine prestatieboost.

Multi-thread (PSU)
Multi-thread (PSU)
Enkeldraads (batterij)

Cinebench R15 Multi Continuous Test

02805608401120140016801960224025202800308033603640392042004480476050405320Tooltip
SCHENKER XMG Neo 16 (Early 24) Intel Core i9-14900HX: Ø5001 (4861.45-5267.14)
Razer Blade 16 2024, RTX 4090 Intel Core i9-14900HX: Ø4396 (4349.72-4455.83)
Medion Erazer Beast X40 2024 Intel Core i9-14900HX: Ø3224 (3189.54-3263.11)
Asus ROG Strix Scar 17 G733PYV-LL053X AMD Ryzen 9 7945HX3D: Ø5282 (5177.32-5599.89)
SCHENKER XMG Neo 16 E23 Intel Core i9-13900HX: Ø4121 (3925.8-4598.23)
SCHENKER XMG Neo 16 (Early 24) Intel Core i9-14900HX; Overboost, Oasis: Ø5559 (5506.61-5589.71)
Lenovo Legion Pro 7 RTX4090 Intel Core i9-13900HX: Ø4469 (4358.72-4684.94)
Alienware x16 R2 P120F Intel Core Ultra 9 185H: Ø2753 (2708.56-2857.35)
Asus ROG Strix Scar 16 G634JZR Intel Core i9-14900HX: Ø4439 (4357.3-4809.43)
Lenovo Legion 9 16IRX9, RTX 4090 Intel Core i9-14900HX: Ø4648 (4505.52-4878.64)
CB15 lus (Overboost)
CB15 lus (Liefhebber)
CB15 lus (Gebalanceerd)
CB15 lus (Overboost, Oasis)
CPU Performance Rating - Percent
SCHENKER XMG Neo 16 (Early 24)
Intel Core i9-14900HX
88.1 pt
SCHENKER XMG Neo 16 (Early 24)
Intel Core i9-14900HX
86.7 pt
Asus ROG Strix Scar 17 G733PYV-LL053X
AMD Ryzen 9 7945HX3D
81.5 pt
Asus ROG Strix Scar 16 G634JZR
Intel Core i9-14900HX
79.8 pt
Razer Blade 16 2024, RTX 4090
Intel Core i9-14900HX
76.1 pt
Gemiddeld Intel Core i9-14900HX
 
75.8 pt
Lenovo Legion Pro 7 RTX4090 -2!
Intel Core i9-13900HX
75.4 pt
SCHENKER XMG Neo 16 E23 -2!
Intel Core i9-13900HX
75.3 pt
Medion Erazer Beast X40 2024
Intel Core i9-14900HX
70.1 pt
Lenovo Legion 9 16IRX9, RTX 4090
Intel Core i9-14900HX
69.9 pt
Gemiddelde van klas Gaming
 
61.6 pt
Alienware x16 R2 P120F
Intel Core Ultra 9 185H
51 pt
Cinebench R23
Multi Core
SCHENKER XMG Neo 16 (Early 24)
Intel Core i9-14900HX
36249 Points
SCHENKER XMG Neo 16 (Early 24)
Intel Core i9-14900HX (Overboost, Oasis)
36200 Points 0%
Asus ROG Strix Scar 17 G733PYV-LL053X
AMD Ryzen 9 7945HX3D
32782 Points -10%
Lenovo Legion 9 16IRX9, RTX 4090
Intel Core i9-14900HX
31889 Points -12%
Lenovo Legion Pro 7 RTX4090
Intel Core i9-13900HX
31109 Points -14%
Asus ROG Strix Scar 16 G634JZR
Intel Core i9-14900HX
30411 Points -16%
SCHENKER XMG Neo 16 E23
Intel Core i9-13900HX
29082 Points -20%
Razer Blade 16 2024, RTX 4090
Intel Core i9-14900HX
28867 Points -20%
Gemiddeld Intel Core i9-14900HX
  (17078 - 36249, n=37)
28851 Points -20%
Medion Erazer Beast X40 2024
Intel Core i9-14900HX
22238 Points -39%
Gemiddelde van klas Gaming
  (5668 - 36249, n=187, laatste 2 jaar)
22019 Points -39%
Alienware x16 R2 P120F
Intel Core Ultra 9 185H
18338 (17139.2min - 18337.8max) Points -49%
Single Core
Medion Erazer Beast X40 2024
Intel Core i9-14900HX
2227 Points +1%
SCHENKER XMG Neo 16 (Early 24)
Intel Core i9-14900HX
2209 Points
SCHENKER XMG Neo 16 (Early 24)
Intel Core i9-14900HX (Overboost, Oasis)
2205 Points 0%
Asus ROG Strix Scar 16 G634JZR
Intel Core i9-14900HX
2193 Points -1%
Gemiddeld Intel Core i9-14900HX
  (1720 - 2245, n=37)
2149 Points -3%
Razer Blade 16 2024, RTX 4090
Intel Core i9-14900HX
2117 Points -4%
SCHENKER XMG Neo 16 E23
Intel Core i9-13900HX
2076 Points -6%
Lenovo Legion Pro 7 RTX4090
Intel Core i9-13900HX
2039 Points -8%
Asus ROG Strix Scar 17 G733PYV-LL053X
AMD Ryzen 9 7945HX3D
1935 Points -12%
Gemiddelde van klas Gaming
  (1136 - 2235, n=185, laatste 2 jaar)
1893 Points -14%
Lenovo Legion 9 16IRX9, RTX 4090
Intel Core i9-14900HX
1720 Points -22%
Alienware x16 R2 P120F
Intel Core Ultra 9 185H
1620 Points -27%
Cinebench R20
CPU (Multi Core)
SCHENKER XMG Neo 16 (Early 24)
Intel Core i9-14900HX (Overboost, Oasis, Overboost, Oasis)
13832 Points 0%
SCHENKER XMG Neo 16 (Early 24)
Intel Core i9-14900HX
13824 Points
Asus ROG Strix Scar 17 G733PYV-LL053X
AMD Ryzen 9 7945HX3D
13033 Points -6%
Lenovo Legion 9 16IRX9, RTX 4090
Intel Core i9-14900HX
11960 Points -13%
Lenovo Legion Pro 7 RTX4090
Intel Core i9-13900HX
11637 Points -16%
Asus ROG Strix Scar 16 G634JZR
Intel Core i9-14900HX
11604 Points -16%
SCHENKER XMG Neo 16 E23
Intel Core i9-13900HX
11010 Points -20%
Gemiddeld Intel Core i9-14900HX
  (6579 - 13832, n=37)
10970 Points -21%
Razer Blade 16 2024, RTX 4090
Intel Core i9-14900HX
10968 Points -21%
Medion Erazer Beast X40 2024
Intel Core i9-14900HX
8495 Points -39%
Gemiddelde van klas Gaming
  (2179 - 13832, n=185, laatste 2 jaar)
8379 Points -39%
Alienware x16 R2 P120F
Intel Core Ultra 9 185H
7081 Points -49%
CPU (Single Core)
Medion Erazer Beast X40 2024
Intel Core i9-14900HX
855 Points +1%
SCHENKER XMG Neo 16 (Early 24)
Intel Core i9-14900HX (Overboost, Oasis, Overboost, Oasis)
847 Points 0%
SCHENKER XMG Neo 16 (Early 24)
Intel Core i9-14900HX
844 Points
Asus ROG Strix Scar 16 G634JZR
Intel Core i9-14900HX
839 Points -1%
Gemiddeld Intel Core i9-14900HX
  (657 - 859, n=37)
824 Points -2%
Razer Blade 16 2024, RTX 4090
Intel Core i9-14900HX
810 Points -4%
SCHENKER XMG Neo 16 E23
Intel Core i9-13900HX
797 Points -6%
Lenovo Legion Pro 7 RTX4090
Intel Core i9-13900HX
780 Points -8%
Asus ROG Strix Scar 17 G733PYV-LL053X
AMD Ryzen 9 7945HX3D
755 Points -11%
Gemiddelde van klas Gaming
  (439 - 856, n=185, laatste 2 jaar)
727 Points -14%
Lenovo Legion 9 16IRX9, RTX 4090
Intel Core i9-14900HX
657 Points -22%
Alienware x16 R2 P120F
Intel Core Ultra 9 185H
622 Points -26%
Cinebench R15
CPU Multi 64Bit
Asus ROG Strix Scar 17 G733PYV-LL053X
AMD Ryzen 9 7945HX3D
5600 (5177.32min - 5599.89max) Points +6%
SCHENKER XMG Neo 16 (Early 24)
Intel Core i9-14900HX (Overboost, Oasis)
5589 Points +6%
SCHENKER XMG Neo 16 (Early 24)
Intel Core i9-14900HX
5267 Points
Lenovo Legion 9 16IRX9, RTX 4090
Intel Core i9-14900HX
4879 (4505.52min - 4878.64max) Points -7%
Asus ROG Strix Scar 16 G634JZR
Intel Core i9-14900HX
4809 (4357.3min - 4809.43max) Points -9%
Lenovo Legion Pro 7 RTX4090
Intel Core i9-13900HX
4685 (4358.72min - 4684.94max) Points -11%
SCHENKER XMG Neo 16 E23
Intel Core i9-13900HX
4598 (3925.8min - 4598.23max) Points -13%
Razer Blade 16 2024, RTX 4090
Intel Core i9-14900HX
4456 (4349.72min - 4455.83max) Points -15%
Gemiddeld Intel Core i9-14900HX
  (3263 - 5589, n=38)
4427 Points -16%
Gemiddelde van klas Gaming
  (905 - 5663, n=192, laatste 2 jaar)
3445 Points -35%
Medion Erazer Beast X40 2024
Intel Core i9-14900HX
3263 Points -38%
Alienware x16 R2 P120F
Intel Core Ultra 9 185H
2857 (2708.56min - 2857.35max) Points -46%
CPU Single 64Bit
SCHENKER XMG Neo 16 (Early 24)
Intel Core i9-14900HX (Overboost, Oasis)
318 Points +3%
Asus ROG Strix Scar 16 G634JZR
Intel Core i9-14900HX
316 Points +2%
Medion Erazer Beast X40 2024
Intel Core i9-14900HX
314 Points +1%
Asus ROG Strix Scar 17 G733PYV-LL053X
AMD Ryzen 9 7945HX3D
311 Points 0%
Razer Blade 16 2024, RTX 4090
Intel Core i9-14900HX
311 Points 0%
SCHENKER XMG Neo 16 (Early 24)
Intel Core i9-14900HX
310 Points
Gemiddeld Intel Core i9-14900HX
  (247 - 323, n=37)
305 Points -2%
SCHENKER XMG Neo 16 E23
Intel Core i9-13900HX
301 Points -3%
Lenovo Legion Pro 7 RTX4090
Intel Core i9-13900HX
289 Points -7%
Gemiddelde van klas Gaming
  (191.9 - 318, n=189, laatste 2 jaar)
278 Points -10%
Lenovo Legion 9 16IRX9, RTX 4090
Intel Core i9-14900HX
247 Points -20%
Alienware x16 R2 P120F
Intel Core Ultra 9 185H
238 Points -23%
Blender - v2.79 BMW27 CPU
Alienware x16 R2 P120F
Intel Core Ultra 9 185H
178 Seconds * -87%
Gemiddelde van klas Gaming
  (87 - 555, n=180, laatste 2 jaar)
169 Seconds * -78%
Medion Erazer Beast X40 2024
Intel Core i9-14900HX
143 Seconds * -51%
Gemiddeld Intel Core i9-14900HX
  (91 - 206, n=37)
121.2 Seconds * -28%
SCHENKER XMG Neo 16 E23
Intel Core i9-13900HX
117 Seconds * -23%
Razer Blade 16 2024, RTX 4090
Intel Core i9-14900HX
113 Seconds * -19%
Asus ROG Strix Scar 16 G634JZR
Intel Core i9-14900HX
110 Seconds * -16%
Lenovo Legion 9 16IRX9, RTX 4090
Intel Core i9-14900HX
106 Seconds * -12%
Lenovo Legion Pro 7 RTX4090
Intel Core i9-13900HX
105 Seconds * -11%
Asus ROG Strix Scar 17 G733PYV-LL053X
AMD Ryzen 9 7945HX3D
95 Seconds * -0%
SCHENKER XMG Neo 16 (Early 24)
Intel Core i9-14900HX
95 Seconds *
SCHENKER XMG Neo 16 (Early 24)
Intel Core i9-14900HX (Overboost, Oasis)
91 Seconds * +4%
7-Zip 18.03
7z b 4
SCHENKER XMG Neo 16 (Early 24)
Intel Core i9-14900HX (Overboost, Oasis)
136645 MIPS +1%
Asus ROG Strix Scar 17 G733PYV-LL053X
AMD Ryzen 9 7945HX3D
136201 MIPS +1%
SCHENKER XMG Neo 16 (Early 24)
Intel Core i9-14900HX
135229 MIPS
Lenovo Legion 9 16IRX9, RTX 4090
Intel Core i9-14900HX
125676 MIPS -7%
Lenovo Legion Pro 7 RTX4090
Intel Core i9-13900HX
122148 MIPS -10%
Asus ROG Strix Scar 16 G634JZR
Intel Core i9-14900HX
121465 MIPS -10%
Razer Blade 16 2024, RTX 4090
Intel Core i9-14900HX
115695 MIPS -14%
SCHENKER XMG Neo 16 E23
Intel Core i9-13900HX
115262 MIPS -15%
Gemiddeld Intel Core i9-14900HX
  (66769 - 136645, n=37)
111239 MIPS -18%
Medion Erazer Beast X40 2024
Intel Core i9-14900HX
92386 MIPS -32%
Gemiddelde van klas Gaming
  (23795 - 140932, n=184, laatste 2 jaar)
85971 MIPS -36%
Alienware x16 R2 P120F
Intel Core Ultra 9 185H
67227 MIPS -50%
7z b 4 -mmt1
Asus ROG Strix Scar 17 G733PYV-LL053X
AMD Ryzen 9 7945HX3D
7573 MIPS +2%
Asus ROG Strix Scar 16 G634JZR
Intel Core i9-14900HX
7442 MIPS 0%
SCHENKER XMG Neo 16 (Early 24)
Intel Core i9-14900HX (Overboost, Oasis)
7441 MIPS 0%
SCHENKER XMG Neo 16 (Early 24)
Intel Core i9-14900HX
7406 MIPS
Medion Erazer Beast X40 2024
Intel Core i9-14900HX
7340 MIPS -1%
SCHENKER XMG Neo 16 E23
Intel Core i9-13900HX
7070 MIPS -5%
Gemiddeld Intel Core i9-14900HX
  (5452 - 7545, n=37)
7021 MIPS -5%
Razer Blade 16 2024, RTX 4090
Intel Core i9-14900HX
7018 MIPS -5%
Lenovo Legion Pro 7 RTX4090
Intel Core i9-13900HX
6931 MIPS -6%
Gemiddelde van klas Gaming
  (4199 - 7581, n=184, laatste 2 jaar)
6324 MIPS -15%
Lenovo Legion 9 16IRX9, RTX 4090
Intel Core i9-14900HX
5452 MIPS -26%
Alienware x16 R2 P120F
Intel Core Ultra 9 185H
4502 MIPS -39%
Geekbench 6.3
Multi-Core
SCHENKER XMG Neo 16 (Early 24)
Intel Core i9-14900HX (6.2.1, Overboost, Oasis)
19665 Points +1%
SCHENKER XMG Neo 16 (Early 24)
Intel Core i9-14900HX (6.2.1)
19451 Points
Asus ROG Strix Scar 16 G634JZR
Intel Core i9-14900HX (6.2.1)
18590 Points -4%
Razer Blade 16 2024, RTX 4090
Intel Core i9-14900HX (6.2.1)
17559 Points -10%
Lenovo Legion 9 16IRX9, RTX 4090
Intel Core i9-14900HX (6.2.1)
17499 Points -10%
Gemiddeld Intel Core i9-14900HX
  (13158 - 19665, n=37)
17321 Points -11%
Asus ROG Strix Scar 17 G733PYV-LL053X
AMD Ryzen 9 7945HX3D
16957 Points -13%
Medion Erazer Beast X40 2024
Intel Core i9-14900HX (6.2.1)
15849 Points -19%
Gemiddelde van klas Gaming
  (5340 - 19665, n=113, laatste 2 jaar)
14205 Points -27%
Alienware x16 R2 P120F
Intel Core Ultra 9 185H (6.2.1)
12825 Points -34%
Single-Core
SCHENKER XMG Neo 16 (Early 24)
Intel Core i9-14900HX (6.2.1)
3129 Points
SCHENKER XMG Neo 16 (Early 24)
Intel Core i9-14900HX (6.2.1, Overboost, Oasis)
3109 Points -1%
Medion Erazer Beast X40 2024
Intel Core i9-14900HX (6.2.1)
3077 Points -2%
Asus ROG Strix Scar 16 G634JZR
Intel Core i9-14900HX (6.2.1)
3025 Points -3%
Gemiddeld Intel Core i9-14900HX
  (2419 - 3129, n=37)
2967 Points -5%
Razer Blade 16 2024, RTX 4090
Intel Core i9-14900HX (6.2.1)
2964 Points -5%
Asus ROG Strix Scar 17 G733PYV-LL053X
AMD Ryzen 9 7945HX3D
2916 Points -7%
Gemiddelde van klas Gaming
  (1490 - 3129, n=113, laatste 2 jaar)
2649 Points -15%
Lenovo Legion 9 16IRX9, RTX 4090
Intel Core i9-14900HX (6.2.1)
2419 Points -23%
Alienware x16 R2 P120F
Intel Core Ultra 9 185H (6.2.1)
2199 Points -30%
Geekbench 5.5
Multi-Core
SCHENKER XMG Neo 16 (Early 24)
Intel Core i9-14900HX (Overboost, Oasis)
23194 Points 0%
SCHENKER XMG Neo 16 (Early 24)
Intel Core i9-14900HX
23086 Points
Lenovo Legion 9 16IRX9, RTX 4090
Intel Core i9-14900HX
21642 Points -6%
Asus ROG Strix Scar 16 G634JZR
Intel Core i9-14900HX
21335 Points -8%
SCHENKER XMG Neo 16 E23
Intel Core i9-13900HX
21075 Points -9%
Lenovo Legion Pro 7 RTX4090
Intel Core i9-13900HX
20510 Points -11%
Asus ROG Strix Scar 17 G733PYV-LL053X
AMD Ryzen 9 7945HX3D
19875 Points -14%
Gemiddeld Intel Core i9-14900HX
  (8618 - 23194, n=37)
19449 Points -16%
Razer Blade 16 2024, RTX 4090
Intel Core i9-14900HX
19372 Points -16%
Medion Erazer Beast X40 2024
Intel Core i9-14900HX
17082 Points -26%
Gemiddelde van klas Gaming
  (4557 - 23194, n=185, laatste 2 jaar)
15135 Points -34%
Alienware x16 R2 P120F
Intel Core Ultra 9 185H
12759 Points -45%
Single-Core
Asus ROG Strix Scar 16 G634JZR
Intel Core i9-14900HX
2210 Points +1%
SCHENKER XMG Neo 16 (Early 24)
Intel Core i9-14900HX (Overboost, Oasis)
2210 Points +1%
SCHENKER XMG Neo 16 (Early 24)
Intel Core i9-14900HX
2195 Points
Medion Erazer Beast X40 2024
Intel Core i9-14900HX
2168 Points -1%
Asus ROG Strix Scar 17 G733PYV-LL053X
AMD Ryzen 9 7945HX3D
2133 Points -3%
Razer Blade 16 2024, RTX 4090
Intel Core i9-14900HX
2131 Points -3%
Gemiddeld Intel Core i9-14900HX
  (1669 - 2210, n=37)
2092 Points -5%
SCHENKER XMG Neo 16 E23
Intel Core i9-13900HX
2049 Points -7%
Lenovo Legion Pro 7 RTX4090
Intel Core i9-13900HX
2012 Points -8%
Gemiddelde van klas Gaming
  (986 - 2210, n=185, laatste 2 jaar)
1899 Points -13%
Lenovo Legion 9 16IRX9, RTX 4090
Intel Core i9-14900HX
1729 Points -21%
Alienware x16 R2 P120F
Intel Core Ultra 9 185H
1700 Points -23%
HWBOT x265 Benchmark v2.2 - 4k Preset
SCHENKER XMG Neo 16 (Early 24)
Intel Core i9-14900HX (Overboost, Oasis)
38.9 fps +10%
Asus ROG Strix Scar 17 G733PYV-LL053X
AMD Ryzen 9 7945HX3D
36.4 fps +3%
SCHENKER XMG Neo 16 (Early 24)
Intel Core i9-14900HX
35.3 fps
Lenovo Legion Pro 7 RTX4090
Intel Core i9-13900HX
32.2 fps -9%
Asus ROG Strix Scar 16 G634JZR
Intel Core i9-14900HX
32 fps -9%
SCHENKER XMG Neo 16 E23
Intel Core i9-13900HX
31 fps -12%
Lenovo Legion 9 16IRX9, RTX 4090
Intel Core i9-14900HX
30.7 fps -13%
Razer Blade 16 2024, RTX 4090
Intel Core i9-14900HX
30.1 fps -15%
Gemiddeld Intel Core i9-14900HX
  (16.8 - 38.9, n=37)
29.3 fps -17%
Medion Erazer Beast X40 2024
Intel Core i9-14900HX
23.7 fps -33%
Gemiddelde van klas Gaming
  (6.72 - 38.9, n=184, laatste 2 jaar)
23.6 fps -33%
Alienware x16 R2 P120F
Intel Core Ultra 9 185H
20.7 fps -41%
LibreOffice - 20 Documents To PDF
Lenovo Legion 9 16IRX9, RTX 4090
Intel Core i9-14900HX (6.3.4.2)
53.6 s * -63%
Asus ROG Strix Scar 16 G634JZR
Intel Core i9-14900HX (6.3.4.2)
47.9 s * -46%
Razer Blade 16 2024, RTX 4090
Intel Core i9-14900HX (6.3.4.2)
47.5 s * -44%
Gemiddelde van klas Gaming
  (19 - 96.6, n=181, laatste 2 jaar)
47.3 s * -44%
Alienware x16 R2 P120F
Intel Core Ultra 9 185H (6.3.4.2)
45.9 s * -40%
Medion Erazer Beast X40 2024
Intel Core i9-14900HX (6.3.4.2)
42.8 s * -30%
Gemiddeld Intel Core i9-14900HX
  (19 - 85.1, n=37)
42.6 s * -29%
Lenovo Legion Pro 7 RTX4090
Intel Core i9-13900HX
40.6 s * -23%
Asus ROG Strix Scar 17 G733PYV-LL053X
AMD Ryzen 9 7945HX3D
39 s * -19%
SCHENKER XMG Neo 16 E23
Intel Core i9-13900HX
37.3 s * -13%
SCHENKER XMG Neo 16 (Early 24)
Intel Core i9-14900HX (6.3.4.2)
32.9 s *
SCHENKER XMG Neo 16 (Early 24)
Intel Core i9-14900HX (6.3.4.2, Overboost, Oasis)
31.4 s * +5%
R Benchmark 2.5 - Overall mean
Alienware x16 R2 P120F
Intel Core Ultra 9 185H
0.503 sec * -38%
Lenovo Legion 9 16IRX9, RTX 4090
Intel Core i9-14900HX
0.4859 sec * -33%
Gemiddelde van klas Gaming
  (0.3609 - 0.759, n=185, laatste 2 jaar)
0.4362 sec * -19%
Asus ROG Strix Scar 17 G733PYV-LL053X
AMD Ryzen 9 7945HX3D
0.4127 sec * -13%
Lenovo Legion Pro 7 RTX4090
Intel Core i9-13900HX
0.401 sec * -10%
Gemiddeld Intel Core i9-14900HX
  (0.3604 - 0.4859, n=37)
0.385 sec * -5%
SCHENKER XMG Neo 16 (Early 24)
Intel Core i9-14900HX (Overboost, Oasis, Overboost, Oasis)
0.3826 sec * -5%
Razer Blade 16 2024, RTX 4090
Intel Core i9-14900HX
0.3789 sec * -4%
SCHENKER XMG Neo 16 E23
Intel Core i9-13900HX
0.375 sec * -3%
Medion Erazer Beast X40 2024
Intel Core i9-14900HX
0.3717 sec * -2%
Asus ROG Strix Scar 16 G634JZR
Intel Core i9-14900HX
0.3699 sec * -1%
SCHENKER XMG Neo 16 (Early 24)
Intel Core i9-14900HX
0.3658 sec *

* ... kleiner is beter

Cinebench R15 CPU Multi 64Bit
5267 Points
Cinebench R15 OpenGL 64Bit
281 fps
Cinebench R15 Ref. Match 64Bit
99.6 %
Cinebench R15 CPU Single 64Bit
310 Points
Cinebench R20 CPU (Single Core)
844 Points
Cinebench R20 CPU (Multi Core)
13824 Points
Cinebench R23 Multi Core
36249 Points
Cinebench R23 Single Core
2209 Points
Cinebench 2024 CPU Multi Core
1940 Points
Cinebench 2024 CPU Single Core
131.7 Points
Help
Performance Rating
Asus ROG Strix Scar 17 G733PYV-LL053X
AMD Ryzen 9 7945HX3D, NVIDIA GeForce RTX 4090 Laptop GPU
95.6 pt
SCHENKER XMG Neo 16 (Early 24)
Intel Core i9-14900HX, NVIDIA GeForce RTX 4090 Laptop GPU
73.5 pt
SCHENKER XMG Neo 16 (Early 24)
Intel Core i9-14900HX, NVIDIA GeForce RTX 4090 Laptop GPU
70.2 pt
Asus ROG Strix Scar 16 G634JZR
Intel Core i9-14900HX, NVIDIA GeForce RTX 4080 Laptop GPU
65.2 pt
Lenovo Legion 9 16IRX9, RTX 4090
Intel Core i9-14900HX, NVIDIA GeForce RTX 4090 Laptop GPU
65.1 pt
Lenovo Legion Pro 7 RTX4090
Intel Core i9-13900HX, NVIDIA GeForce RTX 4090 Laptop GPU
63.1 pt
Razer Blade 16 2024, RTX 4090
Intel Core i9-14900HX, NVIDIA GeForce RTX 4090 Laptop GPU
61.1 pt
SCHENKER XMG Neo 16 E23
Intel Core i9-13900HX, NVIDIA GeForce RTX 4090 Laptop GPU
60.1 pt
Gemiddeld Intel Core i9-14900HX
 
59.7 pt
Medion Erazer Beast X40 2024
Intel Core i9-14900HX, NVIDIA GeForce RTX 4090 Laptop GPU
51.7 pt
Gemiddelde van klas Gaming
 
50.4 pt
Alienware x16 R2 P120F
Intel Core Ultra 9 185H, NVIDIA GeForce RTX 4080 Laptop GPU
47.1 pt
AIDA64 / FP32 Ray-Trace
Asus ROG Strix Scar 17 G733PYV-LL053X
AMD Ryzen 9 7945HX3D, NVIDIA GeForce RTX 4090 Laptop GPU (v6.88.6413 Beta)
53908 KRay/s +75%
SCHENKER XMG Neo 16 (Early 24)
Intel Core i9-14900HX, NVIDIA GeForce RTX 4090 Laptop GPU (v6.92.6600, Overboost, Oasis)
33474 KRay/s +9%
SCHENKER XMG Neo 16 (Early 24)
Intel Core i9-14900HX, NVIDIA GeForce RTX 4090 Laptop GPU (v6.92.6600)
30829 KRay/s
Lenovo Legion 9 16IRX9, RTX 4090
Intel Core i9-14900HX, NVIDIA GeForce RTX 4090 Laptop GPU (v6.92.6600)
27535 KRay/s -11%
Lenovo Legion Pro 7 RTX4090
Intel Core i9-13900HX, NVIDIA GeForce RTX 4090 Laptop GPU (v6.85.6300)
27200 KRay/s -12%
Asus ROG Strix Scar 16 G634JZR
Intel Core i9-14900HX, NVIDIA GeForce RTX 4080 Laptop GPU (v6.92.6600)
26280 KRay/s -15%
Razer Blade 16 2024, RTX 4090
Intel Core i9-14900HX, NVIDIA GeForce RTX 4090 Laptop GPU (v6.92.6600)
25682 KRay/s -17%
Gemiddeld Intel Core i9-14900HX
  (13098 - 33474, n=36)
24763 KRay/s -20%
SCHENKER XMG Neo 16 E23
Intel Core i9-13900HX, NVIDIA GeForce RTX 4090 Laptop GPU (v6.75.6100)
22497 KRay/s -27%
Gemiddelde van klas Gaming
  (4986 - 60169, n=181, laatste 2 jaar)
22026 KRay/s -29%
Medion Erazer Beast X40 2024
Intel Core i9-14900HX, NVIDIA GeForce RTX 4090 Laptop GPU (v6.92.6600)
20114 KRay/s -35%
Alienware x16 R2 P120F
Intel Core Ultra 9 185H, NVIDIA GeForce RTX 4080 Laptop GPU (v6.92.6600)
18676 KRay/s -39%
AIDA64 / FPU Julia
Asus ROG Strix Scar 17 G733PYV-LL053X
AMD Ryzen 9 7945HX3D, NVIDIA GeForce RTX 4090 Laptop GPU (v6.88.6413 Beta)
222115 Points +47%
SCHENKER XMG Neo 16 (Early 24)
Intel Core i9-14900HX, NVIDIA GeForce RTX 4090 Laptop GPU (v6.92.6600, Overboost, Oasis)
166040 Points +10%
SCHENKER XMG Neo 16 (Early 24)
Intel Core i9-14900HX, NVIDIA GeForce RTX 4090 Laptop GPU (v6.92.6600)
150728 Points
Lenovo Legion 9 16IRX9, RTX 4090
Intel Core i9-14900HX, NVIDIA GeForce RTX 4090 Laptop GPU (v6.92.6600)
136486 Points -9%
Lenovo Legion Pro 7 RTX4090
Intel Core i9-13900HX, NVIDIA GeForce RTX 4090 Laptop GPU (v6.85.6300)
135707 Points -10%
Razer Blade 16 2024, RTX 4090
Intel Core i9-14900HX, NVIDIA GeForce RTX 4090 Laptop GPU (v6.92.6600)
127908 Points -15%
Asus ROG Strix Scar 16 G634JZR
Intel Core i9-14900HX, NVIDIA GeForce RTX 4080 Laptop GPU (v6.92.6600)
125593 Points -17%
Gemiddeld Intel Core i9-14900HX
  (67573 - 166040, n=36)
124114 Points -18%
SCHENKER XMG Neo 16 E23
Intel Core i9-13900HX, NVIDIA GeForce RTX 4090 Laptop GPU (v6.75.6100)
115346 Points -23%
Gemiddelde van klas Gaming
  (25360 - 252486, n=181, laatste 2 jaar)
107276 Points -29%
Medion Erazer Beast X40 2024
Intel Core i9-14900HX, NVIDIA GeForce RTX 4090 Laptop GPU (v6.92.6600)
103901 Points -31%
Alienware x16 R2 P120F
Intel Core Ultra 9 185H, NVIDIA GeForce RTX 4080 Laptop GPU (v6.92.6600)
96463 Points -36%
AIDA64 / CPU SHA3
Asus ROG Strix Scar 17 G733PYV-LL053X
AMD Ryzen 9 7945HX3D, NVIDIA GeForce RTX 4090 Laptop GPU (v6.88.6413 Beta)
9582 MB/s +26%
SCHENKER XMG Neo 16 (Early 24)
Intel Core i9-14900HX, NVIDIA GeForce RTX 4090 Laptop GPU (v6.92.6600, Overboost, Oasis)
7979 MB/s +5%
SCHENKER XMG Neo 16 (Early 24)
Intel Core i9-14900HX, NVIDIA GeForce RTX 4090 Laptop GPU (v6.92.6600)
7588 MB/s
Lenovo Legion 9 16IRX9, RTX 4090
Intel Core i9-14900HX, NVIDIA GeForce RTX 4090 Laptop GPU (v6.92.6600)
7000 MB/s -8%
Lenovo Legion Pro 7 RTX4090
Intel Core i9-13900HX, NVIDIA GeForce RTX 4090 Laptop GPU (v6.85.6300)
6705 MB/s -12%
Asus ROG Strix Scar 16 G634JZR
Intel Core i9-14900HX, NVIDIA GeForce RTX 4080 Laptop GPU (v6.92.6600)
6666 MB/s -12%
Razer Blade 16 2024, RTX 4090
Intel Core i9-14900HX, NVIDIA GeForce RTX 4090 Laptop GPU (v6.92.6600)
6188 MB/s -18%
Gemiddeld Intel Core i9-14900HX
  (3589 - 7979, n=36)
6130 MB/s -19%
SCHENKER XMG Neo 16 E23
Intel Core i9-13900HX, NVIDIA GeForce RTX 4090 Laptop GPU (v6.75.6100)
6112 MB/s -19%
Gemiddelde van klas Gaming
  (1339 - 10389, n=181, laatste 2 jaar)
4933 MB/s -35%
Medion Erazer Beast X40 2024
Intel Core i9-14900HX, NVIDIA GeForce RTX 4090 Laptop GPU (v6.92.6600)
4905 MB/s -35%
Alienware x16 R2 P120F
Intel Core Ultra 9 185H, NVIDIA GeForce RTX 4080 Laptop GPU (v6.92.6600)
4534 MB/s -40%
AIDA64 / CPU Queen
Asus ROG Strix Scar 17 G733PYV-LL053X
AMD Ryzen 9 7945HX3D, NVIDIA GeForce RTX 4090 Laptop GPU (v6.88.6413 Beta)
181270 Points +22%
SCHENKER XMG Neo 16 (Early 24)
Intel Core i9-14900HX, NVIDIA GeForce RTX 4090 Laptop GPU (v6.92.6600)
148966 Points
SCHENKER XMG Neo 16 (Early 24)
Intel Core i9-14900HX, NVIDIA GeForce RTX 4090 Laptop GPU (v6.92.6600, Overboost, Oasis)
148609 Points 0%
Asus ROG Strix Scar 16 G634JZR
Intel Core i9-14900HX, NVIDIA GeForce RTX 4080 Laptop GPU (v6.92.6600)
144073 Points -3%
Razer Blade 16 2024, RTX 4090
Intel Core i9-14900HX, NVIDIA GeForce RTX 4090 Laptop GPU (v6.92.6600)
138473 Points -7%
Gemiddeld Intel Core i9-14900HX
  (118405 - 148966, n=36)
138261 Points -7%
SCHENKER XMG Neo 16 E23
Intel Core i9-13900HX, NVIDIA GeForce RTX 4090 Laptop GPU (v6.75.6100)
135672 Points -9%
Lenovo Legion Pro 7 RTX4090
Intel Core i9-13900HX, NVIDIA GeForce RTX 4090 Laptop GPU (v6.85.6300)
134965 Points -9%
Medion Erazer Beast X40 2024
Intel Core i9-14900HX, NVIDIA GeForce RTX 4090 Laptop GPU (v6.92.6600)
132613 Points -11%
Lenovo Legion 9 16IRX9, RTX 4090
Intel Core i9-14900HX, NVIDIA GeForce RTX 4090 Laptop GPU (v6.92.6600)
130803 Points -12%
Gemiddelde van klas Gaming
  (50699 - 200651, n=181, laatste 2 jaar)
117382 Points -21%
Alienware x16 R2 P120F
Intel Core Ultra 9 185H, NVIDIA GeForce RTX 4080 Laptop GPU (v6.92.6600)
94794 Points -36%
AIDA64 / FPU SinJulia
Asus ROG Strix Scar 17 G733PYV-LL053X
AMD Ryzen 9 7945HX3D, NVIDIA GeForce RTX 4090 Laptop GPU (v6.88.6413 Beta)
29487 Points +63%
SCHENKER XMG Neo 16 (Early 24)
Intel Core i9-14900HX, NVIDIA GeForce RTX 4090 Laptop GPU (v6.92.6600, Overboost, Oasis)
18517 Points +2%
SCHENKER XMG Neo 16 (Early 24)
Intel Core i9-14900HX, NVIDIA GeForce RTX 4090 Laptop GPU (v6.92.6600)
18114 Points
Lenovo Legion 9 16IRX9, RTX 4090
Intel Core i9-14900HX, NVIDIA GeForce RTX 4090 Laptop GPU (v6.92.6600)
16268 Points -10%
Asus ROG Strix Scar 16 G634JZR
Intel Core i9-14900HX, NVIDIA GeForce RTX 4080 Laptop GPU (v6.92.6600)
16108 Points -11%
Razer Blade 16 2024, RTX 4090
Intel Core i9-14900HX, NVIDIA GeForce RTX 4090 Laptop GPU (v6.92.6600)
15857 Points -12%
Lenovo Legion Pro 7 RTX4090
Intel Core i9-13900HX, NVIDIA GeForce RTX 4090 Laptop GPU (v6.85.6300)
15447 Points -15%
Gemiddeld Intel Core i9-14900HX
  (10475 - 18517, n=36)
15241 Points -16%
SCHENKER XMG Neo 16 E23
Intel Core i9-13900HX, NVIDIA GeForce RTX 4090 Laptop GPU (v6.75.6100)
14811 Points -18%
Medion Erazer Beast X40 2024
Intel Core i9-14900HX, NVIDIA GeForce RTX 4090 Laptop GPU (v6.92.6600)
13541 Points -25%
Gemiddelde van klas Gaming
  (4800 - 32988, n=181, laatste 2 jaar)
13326 Points -26%
Alienware x16 R2 P120F
Intel Core Ultra 9 185H, NVIDIA GeForce RTX 4080 Laptop GPU (v6.92.6600)
11095 Points -39%
AIDA64 / FPU Mandel
Asus ROG Strix Scar 17 G733PYV-LL053X
AMD Ryzen 9 7945HX3D, NVIDIA GeForce RTX 4090 Laptop GPU (v6.88.6413 Beta)
118813 Points +55%
SCHENKER XMG Neo 16 (Early 24)
Intel Core i9-14900HX, NVIDIA GeForce RTX 4090 Laptop GPU (v6.92.6600, Overboost, Oasis)
83662 Points +9%
SCHENKER XMG Neo 16 (Early 24)
Intel Core i9-14900HX, NVIDIA GeForce RTX 4090 Laptop GPU (v6.92.6600)
76668 Points
Lenovo Legion 9 16IRX9, RTX 4090
Intel Core i9-14900HX, NVIDIA GeForce RTX 4090 Laptop GPU (v6.92.6600)
68467 Points -11%
Lenovo Legion Pro 7 RTX4090
Intel Core i9-13900HX, NVIDIA GeForce RTX 4090 Laptop GPU (v6.85.6300)
67013 Points -13%
Asus ROG Strix Scar 16 G634JZR
Intel Core i9-14900HX, NVIDIA GeForce RTX 4080 Laptop GPU (v6.92.6600)
64437 Points -16%
Razer Blade 16 2024, RTX 4090
Intel Core i9-14900HX, NVIDIA GeForce RTX 4090 Laptop GPU (v6.92.6600)
64134 Points -16%
Gemiddeld Intel Core i9-14900HX
  (32543 - 83662, n=36)
61081 Points -20%
SCHENKER XMG Neo 16 E23
Intel Core i9-13900HX, NVIDIA GeForce RTX 4090 Laptop GPU (v6.75.6100)
55564 Points -28%
Gemiddelde van klas Gaming
  (12321 - 134044, n=181, laatste 2 jaar)
53979 Points -30%
Medion Erazer Beast X40 2024
Intel Core i9-14900HX, NVIDIA GeForce RTX 4090 Laptop GPU
50393 Points -34%
Alienware x16 R2 P120F
Intel Core Ultra 9 185H, NVIDIA GeForce RTX 4080 Laptop GPU (v6.92.6600)
48020 Points -37%
AIDA64 / CPU AES
Asus ROG Strix Scar 17 G733PYV-LL053X
AMD Ryzen 9 7945HX3D, NVIDIA GeForce RTX 4090 Laptop GPU (v6.88.6413 Beta)
328679 MB/s +126%
Asus ROG Strix Scar 16 G634JZR
Intel Core i9-14900HX, NVIDIA GeForce RTX 4080 Laptop GPU (v6.92.6600)
226181 MB/s +56%
SCHENKER XMG Neo 16 E23
Intel Core i9-13900HX, NVIDIA GeForce RTX 4090 Laptop GPU (v6.75.6100)
210913 MB/s +45%
SCHENKER XMG Neo 16 (Early 24)
Intel Core i9-14900HX, NVIDIA GeForce RTX 4090 Laptop GPU (v6.92.6600, Overboost, Oasis)
152317 MB/s +5%
SCHENKER XMG Neo 16 (Early 24)
Intel Core i9-14900HX, NVIDIA GeForce RTX 4090 Laptop GPU (v6.92.6600)
145389 MB/s
Gemiddeld Intel Core i9-14900HX
  (86964 - 241777, n=36)
139038 MB/s -4%
Lenovo Legion 9 16IRX9, RTX 4090
Intel Core i9-14900HX, NVIDIA GeForce RTX 4090 Laptop GPU (v6.92.6600)
133395 MB/s -8%
Lenovo Legion Pro 7 RTX4090
Intel Core i9-13900HX, NVIDIA GeForce RTX 4090 Laptop GPU (v6.85.6300)
128778 MB/s -11%
Razer Blade 16 2024, RTX 4090
Intel Core i9-14900HX, NVIDIA GeForce RTX 4090 Laptop GPU (v6.92.6600)
122937 MB/s -15%
Gemiddelde van klas Gaming
  (19065 - 328679, n=181, laatste 2 jaar)
109221 MB/s -25%
Medion Erazer Beast X40 2024
Intel Core i9-14900HX, NVIDIA GeForce RTX 4090 Laptop GPU (v6.92.6600)
99333 MB/s -32%
Alienware x16 R2 P120F
Intel Core Ultra 9 185H, NVIDIA GeForce RTX 4080 Laptop GPU (v6.92.6600)
88763 MB/s -39%
AIDA64 / CPU ZLib
SCHENKER XMG Neo 16 (Early 24)
Intel Core i9-14900HX, NVIDIA GeForce RTX 4090 Laptop GPU (v6.92.6600, Overboost, Oasis)
2292 MB/s +2%
SCHENKER XMG Neo 16 (Early 24)
Intel Core i9-14900HX, NVIDIA GeForce RTX 4090 Laptop GPU (v6.92.6600)
2239 MB/s
Asus ROG Strix Scar 17 G733PYV-LL053X
AMD Ryzen 9 7945HX3D, NVIDIA GeForce RTX 4090 Laptop GPU (v6.88.6413 Beta)
2043 MB/s -9%
Lenovo Legion 9 16IRX9, RTX 4090
Intel Core i9-14900HX, NVIDIA GeForce RTX 4090 Laptop GPU (v6.92.6600)
2043 MB/s -9%
Lenovo Legion Pro 7 RTX4090
Intel Core i9-13900HX, NVIDIA GeForce RTX 4090 Laptop GPU (v6.85.6300)
1936 MB/s -14%
Razer Blade 16 2024, RTX 4090
Intel Core i9-14900HX, NVIDIA GeForce RTX 4090 Laptop GPU (v6.92.6600)
1863 MB/s -17%
Asus ROG Strix Scar 16 G634JZR
Intel Core i9-14900HX, NVIDIA GeForce RTX 4080 Laptop GPU (v6.92.6600)
1861 MB/s -17%
Gemiddeld Intel Core i9-14900HX
  (1054 - 2292, n=36)
1791 MB/s -20%
SCHENKER XMG Neo 16 E23
Intel Core i9-13900HX, NVIDIA GeForce RTX 4090 Laptop GPU (v6.75.6100)
1772 MB/s -21%
Medion Erazer Beast X40 2024
Intel Core i9-14900HX, NVIDIA GeForce RTX 4090 Laptop GPU (v6.92.6600)
1443 MB/s -36%
Gemiddelde van klas Gaming
  (373 - 2409, n=181, laatste 2 jaar)
1373 MB/s -39%
Alienware x16 R2 P120F
Intel Core Ultra 9 185H, NVIDIA GeForce RTX 4080 Laptop GPU (v6.92.6600)
1298 MB/s -42%
AIDA64 / FP64 Ray-Trace
Asus ROG Strix Scar 17 G733PYV-LL053X
AMD Ryzen 9 7945HX3D, NVIDIA GeForce RTX 4090 Laptop GPU (v6.88.6413 Beta)
29140 KRay/s +75%
SCHENKER XMG Neo 16 (Early 24)
Intel Core i9-14900HX, NVIDIA GeForce RTX 4090 Laptop GPU (v6.92.6600, Overboost, Oasis)
18349 KRay/s +10%
SCHENKER XMG Neo 16 (Early 24)
Intel Core i9-14900HX, NVIDIA GeForce RTX 4090 Laptop GPU (v6.92.6600)
16655 KRay/s
Lenovo Legion 9 16IRX9, RTX 4090
Intel Core i9-14900HX, NVIDIA GeForce RTX 4090 Laptop GPU (v6.92.6600)
14791 KRay/s -11%
Lenovo Legion Pro 7 RTX4090
Intel Core i9-13900HX, NVIDIA GeForce RTX 4090 Laptop GPU (v6.85.6300)
14508 KRay/s -13%
Asus ROG Strix Scar 16 G634JZR
Intel Core i9-14900HX, NVIDIA GeForce RTX 4080 Laptop GPU (v6.92.6600)
14033 KRay/s -16%
Razer Blade 16 2024, RTX 4090
Intel Core i9-14900HX, NVIDIA GeForce RTX 4090 Laptop GPU (v6.92.6600)
13993 KRay/s -16%
Gemiddeld Intel Core i9-14900HX
  (6809 - 18349, n=36)
13332 KRay/s -20%
SCHENKER XMG Neo 16 E23
Intel Core i9-13900HX, NVIDIA GeForce RTX 4090 Laptop GPU (v6.75.6100)
12069 KRay/s -28%
Gemiddelde van klas Gaming
  (2540 - 31796, n=181, laatste 2 jaar)
11862 KRay/s -29%
Medion Erazer Beast X40 2024
Intel Core i9-14900HX, NVIDIA GeForce RTX 4090 Laptop GPU (v6.92.6600)
10990 KRay/s -34%
Alienware x16 R2 P120F
Intel Core Ultra 9 185H, NVIDIA GeForce RTX 4080 Laptop GPU (v6.92.6600)
10078 KRay/s -39%
AIDA64 / CPU PhotoWorxx
Lenovo Legion 9 16IRX9, RTX 4090
Intel Core i9-14900HX, NVIDIA GeForce RTX 4090 Laptop GPU (v6.92.6600)
54702 MPixel/s +11%
Alienware x16 R2 P120F
Intel Core Ultra 9 185H, NVIDIA GeForce RTX 4080 Laptop GPU (v6.92.6600)
53242 MPixel/s +8%
Lenovo Legion Pro 7 RTX4090
Intel Core i9-13900HX, NVIDIA GeForce RTX 4090 Laptop GPU (v6.85.6300)
50637 MPixel/s +3%
Asus ROG Strix Scar 16 G634JZR
Intel Core i9-14900HX, NVIDIA GeForce RTX 4080 Laptop GPU (v6.92.6600)
49769 MPixel/s +1%
Razer Blade 16 2024, RTX 4090
Intel Core i9-14900HX, NVIDIA GeForce RTX 4090 Laptop GPU (v6.92.6600)
49616 MPixel/s +1%
SCHENKER XMG Neo 16 (Early 24)
Intel Core i9-14900HX, NVIDIA GeForce RTX 4090 Laptop GPU (v6.92.6600, Overboost, Oasis)
49399 MPixel/s 0%
SCHENKER XMG Neo 16 (Early 24)
Intel Core i9-14900HX, NVIDIA GeForce RTX 4090 Laptop GPU (v6.92.6600)
49305 MPixel/s
Medion Erazer Beast X40 2024
Intel Core i9-14900HX, NVIDIA GeForce RTX 4090 Laptop GPU (v6.92.6600)
49089 MPixel/s 0%
SCHENKER XMG Neo 16 E23
Intel Core i9-13900HX, NVIDIA GeForce RTX 4090 Laptop GPU (v6.75.6100)
48753 MPixel/s -1%
Gemiddeld Intel Core i9-14900HX
  (23903 - 54702, n=36)
46878 MPixel/s -5%
Gemiddelde van klas Gaming
  (10805 - 60161, n=182, laatste 2 jaar)
40511 MPixel/s -18%
Asus ROG Strix Scar 17 G733PYV-LL053X
AMD Ryzen 9 7945HX3D, NVIDIA GeForce RTX 4090 Laptop GPU (v6.88.6413 Beta)
36406 MPixel/s -26%

Systeemprestaties

De lijst met specificaties verraadt het al: Er is geen tekort aan rekenkracht - dit wordt niet in de laatste plaats bevestigd door de zeer goede PCMark-scores. Gamen, streamen en renderen zouden de belangrijkste werkgebieden van deze snelle computer moeten zijn. De overdrachtsnelheden van het RAM liggen op een normaal niveau voor DDR5 5600 RAM.

Het RAM werkt in dual-channel modus.
PCMark 10 / Score
Asus ROG Strix Scar 17 G733PYV-LL053X
NVIDIA GeForce RTX 4090 Laptop GPU, R9 7945HX3D, SK hynix PC801 HFS001TEJ9X101N
9117 Points +1%
SCHENKER XMG Neo 16 (Early 24)
NVIDIA GeForce RTX 4090 Laptop GPU, i9-14900HX, Samsung 990 Pro 1 TB
9017 Points
Medion Erazer Beast X40 2024
NVIDIA GeForce RTX 4090 Laptop GPU, i9-14900HX, Phison E18-1TB-PHISON-SSD-BICS5
8963 Points -1%
Gemiddeld Intel Core i9-14900HX, NVIDIA GeForce RTX 4090 Laptop GPU
  (8230 - 9234, n=13)
8674 Points -4%
Razer Blade 16 2024, RTX 4090
NVIDIA GeForce RTX 4090 Laptop GPU, i9-14900HX, Samsung PM9A1 MZVL22T0HBLB
8401 Points -7%
SCHENKER XMG Neo 16 E23
NVIDIA GeForce RTX 4090 Laptop GPU, i9-13900HX, Crucial P5 Plus 1TB CT1000P5PSSD8
8374 Points -7%
Lenovo Legion 9 16IRX9, RTX 4090
NVIDIA GeForce RTX 4090 Laptop GPU, i9-14900HX, Micron 3400 2TB MTFDKBA2T0TFH
8239 Points -9%
Lenovo Legion Pro 7 RTX4090
NVIDIA GeForce RTX 4090 Laptop GPU, i9-13900HX, Samsung PM9A1 MZVL21T0HCLR
8158 Points -10%
Gemiddelde van klas Gaming
  (5776 - 9852, n=163, laatste 2 jaar)
7825 Points -13%
Asus ROG Strix Scar 16 G634JZR
NVIDIA GeForce RTX 4080 Laptop GPU, i9-14900HX, SK hynix PC801 HFS002TEJ9X101N
7703 Points -15%
Alienware x16 R2 P120F
NVIDIA GeForce RTX 4080 Laptop GPU, Ultra 9 185H, WDC PC SN810 1TB
7251 Points -20%
PCMark 10 / Essentials
Asus ROG Strix Scar 16 G634JZR
NVIDIA GeForce RTX 4080 Laptop GPU, i9-14900HX, SK hynix PC801 HFS002TEJ9X101N
11617 Points +5%
Asus ROG Strix Scar 17 G733PYV-LL053X
NVIDIA GeForce RTX 4090 Laptop GPU, R9 7945HX3D, SK hynix PC801 HFS001TEJ9X101N
11561 Points +4%
Gemiddeld Intel Core i9-14900HX, NVIDIA GeForce RTX 4090 Laptop GPU
  (10778 - 11628, n=13)
11125 Points +1%
Lenovo Legion Pro 7 RTX4090
NVIDIA GeForce RTX 4090 Laptop GPU, i9-13900HX, Samsung PM9A1 MZVL21T0HCLR
11091 Points 0%
SCHENKER XMG Neo 16 (Early 24)
NVIDIA GeForce RTX 4090 Laptop GPU, i9-14900HX, Samsung 990 Pro 1 TB
11065 Points
Lenovo Legion 9 16IRX9, RTX 4090
NVIDIA GeForce RTX 4090 Laptop GPU, i9-14900HX, Micron 3400 2TB MTFDKBA2T0TFH
11007 Points -1%
SCHENKER XMG Neo 16 E23
NVIDIA GeForce RTX 4090 Laptop GPU, i9-13900HX, Crucial P5 Plus 1TB CT1000P5PSSD8
10972 Points -1%
Razer Blade 16 2024, RTX 4090
NVIDIA GeForce RTX 4090 Laptop GPU, i9-14900HX, Samsung PM9A1 MZVL22T0HBLB
10915 Points -1%
Medion Erazer Beast X40 2024
NVIDIA GeForce RTX 4090 Laptop GPU, i9-14900HX, Phison E18-1TB-PHISON-SSD-BICS5
10871 Points -2%
Gemiddelde van klas Gaming
  (9057 - 12600, n=162, laatste 2 jaar)
10842 Points -2%
Alienware x16 R2 P120F
NVIDIA GeForce RTX 4080 Laptop GPU, Ultra 9 185H, WDC PC SN810 1TB
10036 Points -9%
PCMark 10 / Productivity
Medion Erazer Beast X40 2024
NVIDIA GeForce RTX 4090 Laptop GPU, i9-14900HX, Phison E18-1TB-PHISON-SSD-BICS5
11759 Points +1%
SCHENKER XMG Neo 16 (Early 24)
NVIDIA GeForce RTX 4090 Laptop GPU, i9-14900HX, Samsung 990 Pro 1 TB
11681 Points
Razer Blade 16 2024, RTX 4090
NVIDIA GeForce RTX 4090 Laptop GPU, i9-14900HX, Samsung PM9A1 MZVL22T0HBLB
11150 Points -5%
Asus ROG Strix Scar 17 G733PYV-LL053X
NVIDIA GeForce RTX 4090 Laptop GPU, R9 7945HX3D, SK hynix PC801 HFS001TEJ9X101N
10881 Points -7%
Gemiddeld Intel Core i9-14900HX, NVIDIA GeForce RTX 4090 Laptop GPU
  (9458 - 11759, n=13)
10610 Points -9%
Lenovo Legion 9 16IRX9, RTX 4090
NVIDIA GeForce RTX 4090 Laptop GPU, i9-14900HX, Micron 3400 2TB MTFDKBA2T0TFH
10202 Points -13%
Gemiddelde van klas Gaming
  (6662 - 14612, n=162, laatste 2 jaar)
9918 Points -15%
SCHENKER XMG Neo 16 E23
NVIDIA GeForce RTX 4090 Laptop GPU, i9-13900HX, Crucial P5 Plus 1TB CT1000P5PSSD8
9837 Points -16%
Lenovo Legion Pro 7 RTX4090
NVIDIA GeForce RTX 4090 Laptop GPU, i9-13900HX, Samsung PM9A1 MZVL21T0HCLR
9089 Points -22%
Alienware x16 R2 P120F
NVIDIA GeForce RTX 4080 Laptop GPU, Ultra 9 185H, WDC PC SN810 1TB
7934 Points -32%
Asus ROG Strix Scar 16 G634JZR
NVIDIA GeForce RTX 4080 Laptop GPU, i9-14900HX, SK hynix PC801 HFS002TEJ9X101N
6662 Points -43%
PCMark 10 / Digital Content Creation
Asus ROG Strix Scar 17 G733PYV-LL053X
NVIDIA GeForce RTX 4090 Laptop GPU, R9 7945HX3D, SK hynix PC801 HFS001TEJ9X101N
16348 Points +6%
Asus ROG Strix Scar 16 G634JZR
NVIDIA GeForce RTX 4080 Laptop GPU, i9-14900HX, SK hynix PC801 HFS002TEJ9X101N
16027 Points +4%
SCHENKER XMG Neo 16 (Early 24)
NVIDIA GeForce RTX 4090 Laptop GPU, i9-14900HX, Samsung 990 Pro 1 TB
15394 Points
Medion Erazer Beast X40 2024
NVIDIA GeForce RTX 4090 Laptop GPU, i9-14900HX, Phison E18-1TB-PHISON-SSD-BICS5
15287 Points -1%
Gemiddeld Intel Core i9-14900HX, NVIDIA GeForce RTX 4090 Laptop GPU
  (13219 - 16462, n=13)
15042 Points -2%
SCHENKER XMG Neo 16 E23
NVIDIA GeForce RTX 4090 Laptop GPU, i9-13900HX, Crucial P5 Plus 1TB CT1000P5PSSD8
14764 Points -4%
Lenovo Legion Pro 7 RTX4090
NVIDIA GeForce RTX 4090 Laptop GPU, i9-13900HX, Samsung PM9A1 MZVL21T0HCLR
14614 Points -5%
Lenovo Legion 9 16IRX9, RTX 4090
NVIDIA GeForce RTX 4090 Laptop GPU, i9-14900HX, Micron 3400 2TB MTFDKBA2T0TFH
13516 Points -12%
Razer Blade 16 2024, RTX 4090
NVIDIA GeForce RTX 4090 Laptop GPU, i9-14900HX, Samsung PM9A1 MZVL22T0HBLB
13219 Points -14%
Alienware x16 R2 P120F
NVIDIA GeForce RTX 4080 Laptop GPU, Ultra 9 185H, WDC PC SN810 1TB
12994 Points -16%
Gemiddelde van klas Gaming
  (6807 - 18475, n=162, laatste 2 jaar)
12205 Points -21%
CrossMark / Overall
SCHENKER XMG Neo 16 (Early 24)
NVIDIA GeForce RTX 4090 Laptop GPU, i9-14900HX, Samsung 990 Pro 1 TB
2344 Points
Razer Blade 16 2024, RTX 4090
NVIDIA GeForce RTX 4090 Laptop GPU, i9-14900HX, Samsung PM9A1 MZVL22T0HBLB
2149 Points -8%
Medion Erazer Beast X40 2024
NVIDIA GeForce RTX 4090 Laptop GPU, i9-14900HX, Phison E18-1TB-PHISON-SSD-BICS5
2144 Points -9%
Gemiddeld Intel Core i9-14900HX, NVIDIA GeForce RTX 4090 Laptop GPU
  (1877 - 2344, n=10)
2119 Points -10%
SCHENKER XMG Neo 16 E23
NVIDIA GeForce RTX 4090 Laptop GPU, i9-13900HX, Crucial P5 Plus 1TB CT1000P5PSSD8
2113 Points -10%
Asus ROG Strix Scar 17 G733PYV-LL053X
NVIDIA GeForce RTX 4090 Laptop GPU, R9 7945HX3D, SK hynix PC801 HFS001TEJ9X101N
2086 Points -11%
Asus ROG Strix Scar 16 G634JZR
NVIDIA GeForce RTX 4080 Laptop GPU, i9-14900HX, SK hynix PC801 HFS002TEJ9X101N
2037 Points -13%
Lenovo Legion 9 16IRX9, RTX 4090
NVIDIA GeForce RTX 4090 Laptop GPU, i9-14900HX, Micron 3400 2TB MTFDKBA2T0TFH
1939 Points -17%
Gemiddelde van klas Gaming
  (1247 - 2344, n=143, laatste 2 jaar)
1915 Points -18%
Alienware x16 R2 P120F
NVIDIA GeForce RTX 4080 Laptop GPU, Ultra 9 185H, WDC PC SN810 1TB
1589 Points -32%
CrossMark / Productivity
SCHENKER XMG Neo 16 (Early 24)
NVIDIA GeForce RTX 4090 Laptop GPU, i9-14900HX, Samsung 990 Pro 1 TB
2162 Points
Medion Erazer Beast X40 2024
NVIDIA GeForce RTX 4090 Laptop GPU, i9-14900HX, Phison E18-1TB-PHISON-SSD-BICS5
2070 Points -4%
Razer Blade 16 2024, RTX 4090
NVIDIA GeForce RTX 4090 Laptop GPU, i9-14900HX, Samsung PM9A1 MZVL22T0HBLB
2007 Points -7%
Gemiddeld Intel Core i9-14900HX, NVIDIA GeForce RTX 4090 Laptop GPU
  (1738 - 2162, n=10)
1968 Points -9%
SCHENKER XMG Neo 16 E23
NVIDIA GeForce RTX 4090 Laptop GPU, i9-13900HX, Crucial P5 Plus 1TB CT1000P5PSSD8
1957 Points -9%
Asus ROG Strix Scar 17 G733PYV-LL053X
NVIDIA GeForce RTX 4090 Laptop GPU, R9 7945HX3D, SK hynix PC801 HFS001TEJ9X101N
1948 Points -10%
Asus ROG Strix Scar 16 G634JZR
NVIDIA GeForce RTX 4080 Laptop GPU, i9-14900HX, SK hynix PC801 HFS002TEJ9X101N
1874 Points -13%
Gemiddelde van klas Gaming
  (1299 - 2204, n=143, laatste 2 jaar)
1813 Points -16%
Lenovo Legion 9 16IRX9, RTX 4090
NVIDIA GeForce RTX 4090 Laptop GPU, i9-14900HX, Micron 3400 2TB MTFDKBA2T0TFH
1755 Points -19%
Alienware x16 R2 P120F
NVIDIA GeForce RTX 4080 Laptop GPU, Ultra 9 185H, WDC PC SN810 1TB
1584 Points -27%
CrossMark / Creativity
SCHENKER XMG Neo 16 (Early 24)
NVIDIA GeForce RTX 4090 Laptop GPU, i9-14900HX, Samsung 990 Pro 1 TB
2660 Points
SCHENKER XMG Neo 16 E23
NVIDIA GeForce RTX 4090 Laptop GPU, i9-13900HX, Crucial P5 Plus 1TB CT1000P5PSSD8
2430 Points -9%
Razer Blade 16 2024, RTX 4090
NVIDIA GeForce RTX 4090 Laptop GPU, i9-14900HX, Samsung PM9A1 MZVL22T0HBLB
2418 Points -9%
Asus ROG Strix Scar 17 G733PYV-LL053X
NVIDIA GeForce RTX 4090 Laptop GPU, R9 7945HX3D, SK hynix PC801 HFS001TEJ9X101N
2415 Points -9%
Gemiddeld Intel Core i9-14900HX, NVIDIA GeForce RTX 4090 Laptop GPU
  (2195 - 2660, n=10)
2387 Points -10%
Asus ROG Strix Scar 16 G634JZR
NVIDIA GeForce RTX 4080 Laptop GPU, i9-14900HX, SK hynix PC801 HFS002TEJ9X101N
2327 Points -13%
Medion Erazer Beast X40 2024
NVIDIA GeForce RTX 4090 Laptop GPU, i9-14900HX, Phison E18-1TB-PHISON-SSD-BICS5
2323 Points -13%
Lenovo Legion 9 16IRX9, RTX 4090
NVIDIA GeForce RTX 4090 Laptop GPU, i9-14900HX, Micron 3400 2TB MTFDKBA2T0TFH
2207 Points -17%
Gemiddelde van klas Gaming
  (1275 - 2660, n=143, laatste 2 jaar)
2104 Points -21%
Alienware x16 R2 P120F
NVIDIA GeForce RTX 4080 Laptop GPU, Ultra 9 185H, WDC PC SN810 1TB
1583 Points -40%
CrossMark / Responsiveness
SCHENKER XMG Neo 16 (Early 24)
NVIDIA GeForce RTX 4090 Laptop GPU, i9-14900HX, Samsung 990 Pro 1 TB
2045 Points
Medion Erazer Beast X40 2024
NVIDIA GeForce RTX 4090 Laptop GPU, i9-14900HX, Phison E18-1TB-PHISON-SSD-BICS5
1874 Points -8%
Gemiddeld Intel Core i9-14900HX, NVIDIA GeForce RTX 4090 Laptop GPU
  (1478 - 2327, n=10)
1862 Points -9%
Razer Blade 16 2024, RTX 4090
NVIDIA GeForce RTX 4090 Laptop GPU, i9-14900HX, Samsung PM9A1 MZVL22T0HBLB
1851 Points -9%
Lenovo Legion 9 16IRX9, RTX 4090
NVIDIA GeForce RTX 4090 Laptop GPU, i9-14900HX, Micron 3400 2TB MTFDKBA2T0TFH
1769 Points -13%
Asus ROG Strix Scar 16 G634JZR
NVIDIA GeForce RTX 4080 Laptop GPU, i9-14900HX, SK hynix PC801 HFS002TEJ9X101N
1756 Points -14%
SCHENKER XMG Neo 16 E23
NVIDIA GeForce RTX 4090 Laptop GPU, i9-13900HX, Crucial P5 Plus 1TB CT1000P5PSSD8
1750 Points -14%
Gemiddelde van klas Gaming
  (1030 - 2330, n=143, laatste 2 jaar)
1711 Points -16%
Asus ROG Strix Scar 17 G733PYV-LL053X
NVIDIA GeForce RTX 4090 Laptop GPU, R9 7945HX3D, SK hynix PC801 HFS001TEJ9X101N
1649 Points -19%
Alienware x16 R2 P120F
NVIDIA GeForce RTX 4080 Laptop GPU, Ultra 9 185H, WDC PC SN810 1TB
1621 Points -21%
WebXPRT 3 / Overall
Asus ROG Strix Scar 17 G733PYV-LL053X
NVIDIA GeForce RTX 4090 Laptop GPU, R9 7945HX3D, SK hynix PC801 HFS001TEJ9X101N
480 Points +43%
SCHENKER XMG Neo 16 (Early 24)
NVIDIA GeForce RTX 4090 Laptop GPU, i9-14900HX, Samsung 990 Pro 1 TB
336 Points
SCHENKER XMG Neo 16 E23
NVIDIA GeForce RTX 4090 Laptop GPU, i9-13900HX, Crucial P5 Plus 1TB CT1000P5PSSD8
331 Points -1%
Razer Blade 16 2024, RTX 4090
NVIDIA GeForce RTX 4090 Laptop GPU, i9-14900HX, Samsung PM9A1 MZVL22T0HBLB
330 Points -2%
Medion Erazer Beast X40 2024
NVIDIA GeForce RTX 4090 Laptop GPU, i9-14900HX, Phison E18-1TB-PHISON-SSD-BICS5
326 Points -3%
Gemiddeld Intel Core i9-14900HX, NVIDIA GeForce RTX 4090 Laptop GPU
  (279 - 339, n=10)
323 Points -4%
Asus ROG Strix Scar 16 G634JZR
NVIDIA GeForce RTX 4080 Laptop GPU, i9-14900HX, SK hynix PC801 HFS002TEJ9X101N
310 Points -8%
Gemiddelde van klas Gaming
  (215 - 480, n=160, laatste 2 jaar)
304 Points -10%
Lenovo Legion 9 16IRX9, RTX 4090
NVIDIA GeForce RTX 4090 Laptop GPU, i9-14900HX, Micron 3400 2TB MTFDKBA2T0TFH
279 Points -17%
Lenovo Legion Pro 7 RTX4090
NVIDIA GeForce RTX 4090 Laptop GPU, i9-13900HX, Samsung PM9A1 MZVL21T0HCLR
266 Points -21%
Alienware x16 R2 P120F
NVIDIA GeForce RTX 4080 Laptop GPU, Ultra 9 185H, WDC PC SN810 1TB
237 Points -29%
WebXPRT 4 / Overall
Asus ROG Strix Scar 17 G733PYV-LL053X
NVIDIA GeForce RTX 4090 Laptop GPU, R9 7945HX3D, SK hynix PC801 HFS001TEJ9X101N
328 Points +7%
Asus ROG Strix Scar 16 G634JZR
NVIDIA GeForce RTX 4080 Laptop GPU, i9-14900HX, SK hynix PC801 HFS002TEJ9X101N
308 Points +1%
SCHENKER XMG Neo 16 (Early 24)
NVIDIA GeForce RTX 4090 Laptop GPU, i9-14900HX, Samsung 990 Pro 1 TB
306 Points
SCHENKER XMG Neo 16 E23
NVIDIA GeForce RTX 4090 Laptop GPU, i9-13900HX, Crucial P5 Plus 1TB CT1000P5PSSD8
304 Points -1%
Medion Erazer Beast X40 2024
NVIDIA GeForce RTX 4090 Laptop GPU, i9-14900HX, Phison E18-1TB-PHISON-SSD-BICS5
295 Points -4%
Gemiddeld Intel Core i9-14900HX, NVIDIA GeForce RTX 4090 Laptop GPU
  (246 - 309, n=8)
291 Points -5%
Lenovo Legion Pro 7 RTX4090
NVIDIA GeForce RTX 4090 Laptop GPU, i9-13900HX, Samsung PM9A1 MZVL21T0HCLR
269 Points -12%
Gemiddelde van klas Gaming
  (176.4 - 328, n=149, laatste 2 jaar)
268 Points -12%
Lenovo Legion 9 16IRX9, RTX 4090
NVIDIA GeForce RTX 4090 Laptop GPU, i9-14900HX, Micron 3400 2TB MTFDKBA2T0TFH
246 Points -20%
Alienware x16 R2 P120F
NVIDIA GeForce RTX 4080 Laptop GPU, Ultra 9 185H, WDC PC SN810 1TB
237 Points -23%
Mozilla Kraken 1.1 / Total
Alienware x16 R2 P120F
NVIDIA GeForce RTX 4080 Laptop GPU, Ultra 9 185H, WDC PC SN810 1TB
594 ms * -39%
Lenovo Legion 9 16IRX9, RTX 4090
NVIDIA GeForce RTX 4090 Laptop GPU, i9-14900HX, Micron 3400 2TB MTFDKBA2T0TFH
535 ms * -25%
Gemiddelde van klas Gaming
  (421 - 674, n=175, laatste 2 jaar)
502 ms * -17%
Lenovo Legion Pro 7 RTX4090
NVIDIA GeForce RTX 4090 Laptop GPU, i9-13900HX, Samsung PM9A1 MZVL21T0HCLR
500 ms * -17%
Gemiddeld Intel Core i9-14900HX, NVIDIA GeForce RTX 4090 Laptop GPU
  (428 - 535, n=11)
456 ms * -7%
SCHENKER XMG Neo 16 E23
NVIDIA GeForce RTX 4090 Laptop GPU, i9-13900HX, Crucial P5 Plus 1TB CT1000P5PSSD8
453 ms * -6%
Razer Blade 16 2024, RTX 4090
NVIDIA GeForce RTX 4090 Laptop GPU, i9-14900HX, Samsung PM9A1 MZVL22T0HBLB
450 ms * -5%
Asus ROG Strix Scar 16 G634JZR
NVIDIA GeForce RTX 4080 Laptop GPU, i9-14900HX, SK hynix PC801 HFS002TEJ9X101N
443 ms * -4%
Medion Erazer Beast X40 2024
NVIDIA GeForce RTX 4090 Laptop GPU, i9-14900HX, Phison E18-1TB-PHISON-SSD-BICS5
437 ms * -2%
SCHENKER XMG Neo 16 (Early 24)
NVIDIA GeForce RTX 4090 Laptop GPU, i9-14900HX, Samsung 990 Pro 1 TB
428 ms *
Asus ROG Strix Scar 17 G733PYV-LL053X
NVIDIA GeForce RTX 4090 Laptop GPU, R9 7945HX3D, SK hynix PC801 HFS001TEJ9X101N
421.3 ms * +2%

* ... kleiner is beter

PCMark 10 Score
9017 punten
Help
AIDA64 / Memory Copy
Alienware x16 R2 P120F
Intel Core Ultra 9 185H, NVIDIA GeForce RTX 4080 Laptop GPU
89701 MB/s +14%
Lenovo Legion 9 16IRX9, RTX 4090
Intel Core i9-14900HX, NVIDIA GeForce RTX 4090 Laptop GPU
81940 MB/s +4%
SCHENKER XMG Neo 16 (Early 24)
Intel Core i9-14900HX, NVIDIA GeForce RTX 4090 Laptop GPU
78897 MB/s
Asus ROG Strix Scar 16 G634JZR
Intel Core i9-14900HX, NVIDIA GeForce RTX 4080 Laptop GPU
78885 MB/s 0%
Razer Blade 16 2024, RTX 4090
Intel Core i9-14900HX, NVIDIA GeForce RTX 4090 Laptop GPU
78799 MB/s 0%
SCHENKER XMG Neo 16 (Early 24)
Intel Core i9-14900HX, NVIDIA GeForce RTX 4090 Laptop GPU
78589 MB/s 0%
Lenovo Legion Pro 7 RTX4090
Intel Core i9-13900HX, NVIDIA GeForce RTX 4090 Laptop GPU
78367 MB/s -1%
Medion Erazer Beast X40 2024
Intel Core i9-14900HX, NVIDIA GeForce RTX 4090 Laptop GPU
77961 MB/s -1%
SCHENKER XMG Neo 16 E23
Intel Core i9-13900HX, NVIDIA GeForce RTX 4090 Laptop GPU
77217 MB/s -2%
Gemiddeld Intel Core i9-14900HX
  (38028 - 83392, n=36)
75105 MB/s -5%
Gemiddelde van klas Gaming
  (21842 - 94222, n=181, laatste 2 jaar)
65865 MB/s -17%
Asus ROG Strix Scar 17 G733PYV-LL053X
AMD Ryzen 9 7945HX3D, NVIDIA GeForce RTX 4090 Laptop GPU
50335 MB/s -36%
AIDA64 / Memory Read
Asus ROG Strix Scar 16 G634JZR
Intel Core i9-14900HX, NVIDIA GeForce RTX 4080 Laptop GPU
87507 MB/s +1%
SCHENKER XMG Neo 16 (Early 24)
Intel Core i9-14900HX, NVIDIA GeForce RTX 4090 Laptop GPU
86939 MB/s
Lenovo Legion Pro 7 RTX4090
Intel Core i9-13900HX, NVIDIA GeForce RTX 4090 Laptop GPU
86932 MB/s 0%
SCHENKER XMG Neo 16 (Early 24)
Intel Core i9-14900HX, NVIDIA GeForce RTX 4090 Laptop GPU
86790 MB/s 0%
Razer Blade 16 2024, RTX 4090
Intel Core i9-14900HX, NVIDIA GeForce RTX 4090 Laptop GPU
86387 MB/s -1%
Medion Erazer Beast X40 2024
Intel Core i9-14900HX, NVIDIA GeForce RTX 4090 Laptop GPU
85340 MB/s -2%
Alienware x16 R2 P120F
Intel Core Ultra 9 185H, NVIDIA GeForce RTX 4080 Laptop GPU
85092 MB/s -2%
SCHENKER XMG Neo 16 E23
Intel Core i9-13900HX, NVIDIA GeForce RTX 4090 Laptop GPU
84390 MB/s -3%
Lenovo Legion 9 16IRX9, RTX 4090
Intel Core i9-14900HX, NVIDIA GeForce RTX 4090 Laptop GPU
84192 MB/s -3%
Gemiddeld Intel Core i9-14900HX
  (43306 - 87568, n=36)
81377 MB/s -6%
Gemiddelde van klas Gaming
  (23681 - 99713, n=181, laatste 2 jaar)
69737 MB/s -20%
Asus ROG Strix Scar 17 G733PYV-LL053X
AMD Ryzen 9 7945HX3D, NVIDIA GeForce RTX 4090 Laptop GPU
59921 MB/s -31%
AIDA64 / Memory Write
Lenovo Legion 9 16IRX9, RTX 4090
Intel Core i9-14900HX, NVIDIA GeForce RTX 4090 Laptop GPU
80589 MB/s +4%
SCHENKER XMG Neo 16 (Early 24)
Intel Core i9-14900HX, NVIDIA GeForce RTX 4090 Laptop GPU
77688 MB/s 0%
SCHENKER XMG Neo 16 (Early 24)
Intel Core i9-14900HX, NVIDIA GeForce RTX 4090 Laptop GPU
77562 MB/s
Asus ROG Strix Scar 16 G634JZR
Intel Core i9-14900HX, NVIDIA GeForce RTX 4080 Laptop GPU
77444 MB/s 0%
Medion Erazer Beast X40 2024
Intel Core i9-14900HX, NVIDIA GeForce RTX 4090 Laptop GPU
77302 MB/s 0%
Lenovo Legion Pro 7 RTX4090
Intel Core i9-13900HX, NVIDIA GeForce RTX 4090 Laptop GPU
76779 MB/s -1%
Razer Blade 16 2024, RTX 4090
Intel Core i9-14900HX, NVIDIA GeForce RTX 4090 Laptop GPU
75421 MB/s -3%
Alienware x16 R2 P120F
Intel Core Ultra 9 185H, NVIDIA GeForce RTX 4080 Laptop GPU
73199 MB/s -6%
Gemiddeld Intel Core i9-14900HX
  (37146 - 80589, n=36)
72406 MB/s -7%
SCHENKER XMG Neo 16 E23
Intel Core i9-13900HX, NVIDIA GeForce RTX 4090 Laptop GPU
71877 MB/s -7%
Gemiddelde van klas Gaming
  (22986 - 108954, n=181, laatste 2 jaar)
67587 MB/s -13%
Asus ROG Strix Scar 17 G733PYV-LL053X
AMD Ryzen 9 7945HX3D, NVIDIA GeForce RTX 4090 Laptop GPU
58774 MB/s -24%
AIDA64 / Memory Latency
Alienware x16 R2 P120F
Intel Core Ultra 9 185H, NVIDIA GeForce RTX 4080 Laptop GPU
142.3 ns * -87%
Lenovo Legion 9 16IRX9, RTX 4090
Intel Core i9-14900HX, NVIDIA GeForce RTX 4090 Laptop GPU
96.2 ns * -26%
Gemiddelde van klas Gaming
  (59.5 - 259, n=181, laatste 2 jaar)
94.1 ns * -24%
Asus ROG Strix Scar 17 G733PYV-LL053X
AMD Ryzen 9 7945HX3D, NVIDIA GeForce RTX 4090 Laptop GPU
88.6 ns * -16%
SCHENKER XMG Neo 16 E23
Intel Core i9-13900HX, NVIDIA GeForce RTX 4090 Laptop GPU
86 ns * -13%
Lenovo Legion Pro 7 RTX4090
Intel Core i9-13900HX, NVIDIA GeForce RTX 4090 Laptop GPU
85.4 ns * -12%
Gemiddeld Intel Core i9-14900HX
  (76.1 - 105, n=36)
84.7 ns * -11%
Razer Blade 16 2024, RTX 4090
Intel Core i9-14900HX, NVIDIA GeForce RTX 4090 Laptop GPU
83.4 ns * -10%
Medion Erazer Beast X40 2024
Intel Core i9-14900HX, NVIDIA GeForce RTX 4090 Laptop GPU
80.9 ns * -6%
Asus ROG Strix Scar 16 G634JZR
Intel Core i9-14900HX, NVIDIA GeForce RTX 4080 Laptop GPU
79.9 ns * -5%
SCHENKER XMG Neo 16 (Early 24)
Intel Core i9-14900HX, NVIDIA GeForce RTX 4090 Laptop GPU
78 ns * -2%
SCHENKER XMG Neo 16 (Early 24)
Intel Core i9-14900HX, NVIDIA GeForce RTX 4090 Laptop GPU
76.1 ns *

* ... kleiner is beter

DPC latenties

De gestandaardiseerde Latency Monitor test (surfen op het internet, 4k video afspelen, Prime95 hoge belasting) onthulde enkele afwijkingen. Het systeem lijkt niet geschikt te zijn voor real-time video- en audiobewerking. Toekomstige software-updates zouden hier invloed op kunnen hebben.

Vertragingsmonitor
Vertragingsmonitor
Vertragingsmonitor
Vertragingsmonitor
DPC Latencies / LatencyMon - interrupt to process latency (max), Web, Youtube, Prime95
SCHENKER XMG Neo 16 E23
NVIDIA GeForce RTX 4090 Laptop GPU, i9-13900HX, Crucial P5 Plus 1TB CT1000P5PSSD8
5340 μs * -115%
SCHENKER XMG Neo 16 (Early 24)
NVIDIA GeForce RTX 4090 Laptop GPU, i9-14900HX, Samsung 990 Pro 1 TB
2478.6 μs *
Razer Blade 16 2024, RTX 4090
NVIDIA GeForce RTX 4090 Laptop GPU, i9-14900HX, Samsung PM9A1 MZVL22T0HBLB
1389.7 μs * +44%
Medion Erazer Beast X40 2024
NVIDIA GeForce RTX 4090 Laptop GPU, i9-14900HX, Phison E18-1TB-PHISON-SSD-BICS5
1305.5 μs * +47%
Asus ROG Strix Scar 17 G733PYV-LL053X
NVIDIA GeForce RTX 4090 Laptop GPU, R9 7945HX3D, SK hynix PC801 HFS001TEJ9X101N
1100.8 μs * +56%

* ... kleiner is beter

Massa-opslag

Zoals gebruikelijk biedt Schenker klanten een ruime keuze aan SSD's in de online winkel - er is ruimte voor twee SSD's in de Neo. Er is ondersteuning voor RAID 0/1. De Samsung SSD (1 TB, PCIe 4, M.2 2280) levert goede overdrachtssnelheden. Een positief kenmerk is de afwezigheid van thermische throttling.

Er is ruimte voor twee PCIe 4 SSD's.
Samsung 990 Pro 1 TB
CDM 5/6 Read Seq Q32T1: 7108 MB/s
CDM 5/6 Write Seq Q32T1: 6863 MB/s
CDM 5/6 Read 4K Q32T1: 805.4 MB/s
CDM 5/6 Write 4K Q32T1: 570.8 MB/s
CDM 5 Read Seq: 3277 MB/s
CDM 5 Write Seq: 4984 MB/s
CDM 5/6 Read 4K: 75.33 MB/s
CDM 5/6 Write 4K: 284.7 MB/s
Drive Performance Rating - Percent
SCHENKER XMG Neo 16 (Early 24)
Samsung 990 Pro 1 TB
90.2 pt
Gemiddeld Samsung 990 Pro 1 TB
 
83.8 pt
Medion Erazer Beast X40 2024
Phison E18-1TB-PHISON-SSD-BICS5
83.1 pt
Razer Blade 16 2024, RTX 4090
Samsung PM9A1 MZVL22T0HBLB
74.4 pt
Gemiddelde van klas Gaming
 
68 pt
Asus ROG Strix Scar 17 G733PYV-LL053X
SK hynix PC801 HFS001TEJ9X101N
61.2 pt
SCHENKER XMG Neo 16 E23
Crucial P5 Plus 1TB CT1000P5PSSD8
55.1 pt
DiskSpd
seq read
Razer Blade 16 2024, RTX 4090
Samsung PM9A1 MZVL22T0HBLB
3795 (3693.04min - 3794.8max) MB/s +26%
Gemiddelde van klas Gaming
  (1319 - 7045, n=163, laatste 2 jaar)
3475 MB/s +15%
Gemiddeld Samsung 990 Pro 1 TB
  (2556 - 4234, n=19)
3283 MB/s +9%
Medion Erazer Beast X40 2024
Phison E18-1TB-PHISON-SSD-BICS5
3238 (3056.39min - 3237.58max) MB/s +7%
SCHENKER XMG Neo 16 (Early 24)
Samsung 990 Pro 1 TB
3015 (2943.98min - 3014.55max) MB/s
SCHENKER XMG Neo 16 E23
Crucial P5 Plus 1TB CT1000P5PSSD8
2945 (2911.9min - 2945.45max) MB/s -2%
Asus ROG Strix Scar 17 G733PYV-LL053X
SK hynix PC801 HFS001TEJ9X101N
2570 (2552.37min - 2570.06max) MB/s -15%
seq write
SCHENKER XMG Neo 16 (Early 24)
Samsung 990 Pro 1 TB
4826 (4760.33min - 4825.54max) MB/s
Gemiddeld Samsung 990 Pro 1 TB
  (3598 - 5842, n=19)
4816 MB/s 0%
Medion Erazer Beast X40 2024
Phison E18-1TB-PHISON-SSD-BICS5
3940 (3577.56min - 3940.13max) MB/s -18%
Gemiddelde van klas Gaming
  (535 - 9307, n=163, laatste 2 jaar)
3827 MB/s -21%
Razer Blade 16 2024, RTX 4090
Samsung PM9A1 MZVL22T0HBLB
3794 (3745.51min - 3793.5max) MB/s -21%
SCHENKER XMG Neo 16 E23
Crucial P5 Plus 1TB CT1000P5PSSD8
2991 (2423.86min - 2991.17max) MB/s -38%
Asus ROG Strix Scar 17 G733PYV-LL053X
SK hynix PC801 HFS001TEJ9X101N
1690 (1454.82min - 1690.3max) MB/s -65%
seq q8 t1 read
SCHENKER XMG Neo 16 (Early 24)
Samsung 990 Pro 1 TB
7140 (5903.9min - 7139.54max) MB/s
Gemiddeld Samsung 990 Pro 1 TB
  (4958 - 7148, n=19)
6979 MB/s -2%
Asus ROG Strix Scar 17 G733PYV-LL053X
SK hynix PC801 HFS001TEJ9X101N
6971 (6127.67min - 6971.35max) MB/s -2%
Medion Erazer Beast X40 2024
Phison E18-1TB-PHISON-SSD-BICS5
6929 (6183.66min - 6928.97max) MB/s -3%
Razer Blade 16 2024, RTX 4090
Samsung PM9A1 MZVL22T0HBLB
6673 (5801.28min - 6672.72max) MB/s -7%
SCHENKER XMG Neo 16 E23
Crucial P5 Plus 1TB CT1000P5PSSD8
6551 (5445.88min - 6551.19max) MB/s -8%
Gemiddelde van klas Gaming
  (2594 - 16089, n=163, laatste 2 jaar)
6317 MB/s -12%
seq q8 t1 write
SCHENKER XMG Neo 16 (Early 24)
Samsung 990 Pro 1 TB
6860 (6824.33min - 6859.91max) MB/s
Gemiddeld Samsung 990 Pro 1 TB
  (6531 - 6898, n=19)
6796 MB/s -1%
Medion Erazer Beast X40 2024
Phison E18-1TB-PHISON-SSD-BICS5
5740 (5704.67min - 5740.32max) MB/s -16%
Razer Blade 16 2024, RTX 4090
Samsung PM9A1 MZVL22T0HBLB
4936 (4909.47min - 4936.28max) MB/s -28%
Gemiddelde van klas Gaming
  (539 - 14571, n=163, laatste 2 jaar)
4866 MB/s -29%
SCHENKER XMG Neo 16 E23
Crucial P5 Plus 1TB CT1000P5PSSD8
4562 (4255.12min - 4561.93max) MB/s -33%
Asus ROG Strix Scar 17 G733PYV-LL053X
SK hynix PC801 HFS001TEJ9X101N
2382 (920.86min - 2382.42max) MB/s -65%
4k q1 t1 read
Gemiddeld Samsung 990 Pro 1 TB
  (55.3 - 99, n=19)
77.1 MB/s +27%
Razer Blade 16 2024, RTX 4090
Samsung PM9A1 MZVL22T0HBLB
71.4 (66.19min - 71.35max) MB/s +18%
Gemiddelde van klas Gaming
  (30.6 - 95.9, n=163, laatste 2 jaar)
65.9 MB/s +9%
SCHENKER XMG Neo 16 (Early 24)
Samsung 990 Pro 1 TB
60.5 (49.54min - 60.46max) MB/s
Medion Erazer Beast X40 2024
Phison E18-1TB-PHISON-SSD-BICS5
54.5 (53.38min - 54.47max) MB/s -10%
Asus ROG Strix Scar 17 G733PYV-LL053X
SK hynix PC801 HFS001TEJ9X101N
54.3 (54.23min - 54.34max) MB/s -10%
SCHENKER XMG Neo 16 E23
Crucial P5 Plus 1TB CT1000P5PSSD8
49.8 (49.12min - 49.75max) MB/s -18%
4k q1 t1 write
Medion Erazer Beast X40 2024
Phison E18-1TB-PHISON-SSD-BICS5
324 (322.91min - 324.37max) MB/s +86%
Gemiddeld Samsung 990 Pro 1 TB
  (133.9 - 343, n=19)
235 MB/s +35%
Gemiddelde van klas Gaming
  (78 - 397, n=163, laatste 2 jaar)
223 MB/s +28%
Razer Blade 16 2024, RTX 4090
Samsung PM9A1 MZVL22T0HBLB
205 (202.97min - 204.75max) MB/s +18%
Asus ROG Strix Scar 17 G733PYV-LL053X
SK hynix PC801 HFS001TEJ9X101N
183.8 (182.06min - 183.78max) MB/s +5%
SCHENKER XMG Neo 16 (Early 24)
Samsung 990 Pro 1 TB
174.4 (160.08min - 174.38max) MB/s
SCHENKER XMG Neo 16 E23
Crucial P5 Plus 1TB CT1000P5PSSD8
119.3 (117.59min - 119.29max) MB/s -32%
4k q32 t16 read
SCHENKER XMG Neo 16 (Early 24)
Samsung 990 Pro 1 TB
4920 (4883.21min - 4920.02max) MB/s
Razer Blade 16 2024, RTX 4090
Samsung PM9A1 MZVL22T0HBLB
3726 (3704.12min - 3725.6max) MB/s -24%
Medion Erazer Beast X40 2024
Phison E18-1TB-PHISON-SSD-BICS5
3653 (3636.8min - 3652.63max) MB/s -26%
Gemiddeld Samsung 990 Pro 1 TB
  (818 - 4926, n=19)
3398 MB/s -31%
Gemiddelde van klas Gaming
  (417 - 6172, n=163, laatste 2 jaar)
2587 MB/s -47%
SCHENKER XMG Neo 16 E23
Crucial P5 Plus 1TB CT1000P5PSSD8
1350 (1194.53min - 1349.82max) MB/s -73%
Asus ROG Strix Scar 17 G733PYV-LL053X
SK hynix PC801 HFS001TEJ9X101N
1331 (1250.04min - 1330.81max) MB/s -73%
4k q32 t16 write
SCHENKER XMG Neo 16 (Early 24)
Samsung 990 Pro 1 TB
4522 (4451.05min - 4521.93max) MB/s
Razer Blade 16 2024, RTX 4090
Samsung PM9A1 MZVL22T0HBLB
3548 (3533.85min - 3548.33max) MB/s -22%
Medion Erazer Beast X40 2024
Phison E18-1TB-PHISON-SSD-BICS5
3447 (3336.65min - 3446.75max) MB/s -24%
Gemiddeld Samsung 990 Pro 1 TB
  (413 - 4683, n=19)
2584 MB/s -43%
Gemiddelde van klas Gaming
  (162.3 - 4869, n=163, laatste 2 jaar)
2141 MB/s -53%
Asus ROG Strix Scar 17 G733PYV-LL053X
SK hynix PC801 HFS001TEJ9X101N
730 (694.74min - 729.67max) MB/s -84%
SCHENKER XMG Neo 16 E23
Crucial P5 Plus 1TB CT1000P5PSSD8
601 (540.73min - 601.05max) MB/s -87%
AS SSD
Score Total
SCHENKER XMG Neo 16 (Early 24)
Samsung 990 Pro 1 TB
9365 Points
Medion Erazer Beast X40 2024
Phison E18-1TB-PHISON-SSD-BICS5
8462 Points -10%
Gemiddeld Samsung 990 Pro 1 TB
  (5405 - 10591, n=19)
8285 Points -12%
Razer Blade 16 2024, RTX 4090
Samsung PM9A1 MZVL22T0HBLB
7040 Points -25%
Gemiddelde van klas Gaming
  (2271 - 13854, n=155, laatste 2 jaar)
6753 Points -28%
Asus ROG Strix Scar 17 G733PYV-LL053X
SK hynix PC801 HFS001TEJ9X101N
6546 Points -30%
SCHENKER XMG Neo 16 E23
Crucial P5 Plus 1TB CT1000P5PSSD8
5751 Points -39%
Score Read
SCHENKER XMG Neo 16 (Early 24)
Samsung 990 Pro 1 TB
3496 Points
Medion Erazer Beast X40 2024
Phison E18-1TB-PHISON-SSD-BICS5
3033 Points -13%
Gemiddeld Samsung 990 Pro 1 TB
  (1349 - 4721, n=19)
2874 Points -18%
Razer Blade 16 2024, RTX 4090
Samsung PM9A1 MZVL22T0HBLB
2848 Points -19%
Gemiddelde van klas Gaming
  (776 - 4721, n=155, laatste 2 jaar)
2448 Points -30%
SCHENKER XMG Neo 16 E23
Crucial P5 Plus 1TB CT1000P5PSSD8
1890 Points -46%
Asus ROG Strix Scar 17 G733PYV-LL053X
SK hynix PC801 HFS001TEJ9X101N
1689 Points -52%
Score Write
Asus ROG Strix Scar 17 G733PYV-LL053X
SK hynix PC801 HFS001TEJ9X101N
4073 Points 0%
SCHENKER XMG Neo 16 (Early 24)
Samsung 990 Pro 1 TB
4062 Points
Gemiddeld Samsung 990 Pro 1 TB
  (2308 - 4852, n=19)
4041 Points -1%
Medion Erazer Beast X40 2024
Phison E18-1TB-PHISON-SSD-BICS5
3948 Points -3%
Gemiddelde van klas Gaming
  (515 - 7208, n=155, laatste 2 jaar)
3116 Points -23%
SCHENKER XMG Neo 16 E23
Crucial P5 Plus 1TB CT1000P5PSSD8
3007 Points -26%
Razer Blade 16 2024, RTX 4090
Samsung PM9A1 MZVL22T0HBLB
2766 Points -32%
Seq Read
Asus ROG Strix Scar 17 G733PYV-LL053X
SK hynix PC801 HFS001TEJ9X101N
5739 MB/s +1%
SCHENKER XMG Neo 16 (Early 24)
Samsung 990 Pro 1 TB
5684.15 MB/s
Medion Erazer Beast X40 2024
Phison E18-1TB-PHISON-SSD-BICS5
5459.84 MB/s -4%
Gemiddeld Samsung 990 Pro 1 TB
  (4362 - 5760, n=19)
5223 MB/s -8%
Gemiddelde van klas Gaming
  (2260 - 12763, n=155, laatste 2 jaar)
4953 MB/s -13%
SCHENKER XMG Neo 16 E23
Crucial P5 Plus 1TB CT1000P5PSSD8
4823 MB/s -15%
Razer Blade 16 2024, RTX 4090
Samsung PM9A1 MZVL22T0HBLB
4371 MB/s -23%
Seq Write
SCHENKER XMG Neo 16 (Early 24)
Samsung 990 Pro 1 TB
5612.29 MB/s
Gemiddeld Samsung 990 Pro 1 TB
  (3376 - 5651, n=19)
4740 MB/s -16%
Asus ROG Strix Scar 17 G733PYV-LL053X
SK hynix PC801 HFS001TEJ9X101N
3972 MB/s -29%
Medion Erazer Beast X40 2024
Phison E18-1TB-PHISON-SSD-BICS5
3914.76 MB/s -30%
Razer Blade 16 2024, RTX 4090
Samsung PM9A1 MZVL22T0HBLB
3791 MB/s -32%
Gemiddelde van klas Gaming
  (495 - 11316, n=155, laatste 2 jaar)
3775 MB/s -33%
SCHENKER XMG Neo 16 E23
Crucial P5 Plus 1TB CT1000P5PSSD8
2496 MB/s -56%
4K Read
Medion Erazer Beast X40 2024
Phison E18-1TB-PHISON-SSD-BICS5
82.84 MB/s +40%
Gemiddeld Samsung 990 Pro 1 TB
  (52.7 - 90.9, n=19)
71.9 MB/s +21%
Gemiddelde van klas Gaming
  (27.8 - 112.1, n=155, laatste 2 jaar)
64.9 MB/s +9%
Razer Blade 16 2024, RTX 4090
Samsung PM9A1 MZVL22T0HBLB
61.1 MB/s +3%
SCHENKER XMG Neo 16 (Early 24)
Samsung 990 Pro 1 TB
59.28 MB/s
Asus ROG Strix Scar 17 G733PYV-LL053X
SK hynix PC801 HFS001TEJ9X101N
56 MB/s -6%
SCHENKER XMG Neo 16 E23
Crucial P5 Plus 1TB CT1000P5PSSD8
49.34 MB/s -17%
4K Write
SCHENKER XMG Neo 16 (Early 24)
Samsung 990 Pro 1 TB
248.48 MB/s
Medion Erazer Beast X40 2024
Phison E18-1TB-PHISON-SSD-BICS5
237.11 MB/s -5%
Gemiddeld Samsung 990 Pro 1 TB
  (172.3 - 306, n=19)
221 MB/s -11%
Gemiddelde van klas Gaming
  (79.4 - 512, n=155, laatste 2 jaar)
211 MB/s -15%
Asus ROG Strix Scar 17 G733PYV-LL053X
SK hynix PC801 HFS001TEJ9X101N
192.1 MB/s -23%
Razer Blade 16 2024, RTX 4090
Samsung PM9A1 MZVL22T0HBLB
160.6 MB/s -35%
SCHENKER XMG Neo 16 E23
Crucial P5 Plus 1TB CT1000P5PSSD8
149.1 MB/s -40%
4K-64 Read
SCHENKER XMG Neo 16 (Early 24)
Samsung 990 Pro 1 TB
2933.61 MB/s
Medion Erazer Beast X40 2024
Phison E18-1TB-PHISON-SSD-BICS5
2404.46 MB/s -18%
Razer Blade 16 2024, RTX 4090
Samsung PM9A1 MZVL22T0HBLB
2350 MB/s -20%
Gemiddeld Samsung 990 Pro 1 TB
  (787 - 3182, n=19)
2235 MB/s -24%
Gemiddelde van klas Gaming
  (451 - 3475, n=155, laatste 2 jaar)
1882 MB/s -36%
SCHENKER XMG Neo 16 E23
Crucial P5 Plus 1TB CT1000P5PSSD8
1358 MB/s -54%
Asus ROG Strix Scar 17 G733PYV-LL053X
SK hynix PC801 HFS001TEJ9X101N
1059 MB/s -64%
4K-64 Write
Asus ROG Strix Scar 17 G733PYV-LL053X
SK hynix PC801 HFS001TEJ9X101N
3484 MB/s +7%
Gemiddeld Samsung 990 Pro 1 TB
  (1592 - 4090, n=19)
3352 MB/s +3%
Medion Erazer Beast X40 2024
Phison E18-1TB-PHISON-SSD-BICS5
3319.37 MB/s +2%
SCHENKER XMG Neo 16 (Early 24)
Samsung 990 Pro 1 TB
3252.43 MB/s
SCHENKER XMG Neo 16 E23
Crucial P5 Plus 1TB CT1000P5PSSD8
2608 MB/s -20%
Gemiddelde van klas Gaming
  (277 - 5909, n=155, laatste 2 jaar)
2530 MB/s -22%
Razer Blade 16 2024, RTX 4090
Samsung PM9A1 MZVL22T0HBLB
2226 MB/s -32%
Access Time Read
SCHENKER XMG Neo 16 E23
Crucial P5 Plus 1TB CT1000P5PSSD8
0.085 ms * -254%
Asus ROG Strix Scar 17 G733PYV-LL053X
SK hynix PC801 HFS001TEJ9X101N
0.062 ms * -158%
Medion Erazer Beast X40 2024
Phison E18-1TB-PHISON-SSD-BICS5
0.057 ms * -138%
Gemiddelde van klas Gaming
  (0.016 - 0.379, n=154, laatste 2 jaar)
0.05554 ms * -131%
Gemiddeld Samsung 990 Pro 1 TB
  (0.018 - 0.074, n=19)
0.03384 ms * -41%
Razer Blade 16 2024, RTX 4090
Samsung PM9A1 MZVL22T0HBLB
0.033 ms * -38%
SCHENKER XMG Neo 16 (Early 24)
Samsung 990 Pro 1 TB
0.024 ms *
Access Time Write
Gemiddelde van klas Gaming
  (0.011 - 1.028, n=155, laatste 2 jaar)
0.04707 ms * -194%
Razer Blade 16 2024, RTX 4090
Samsung PM9A1 MZVL22T0HBLB
0.025 ms * -56%
SCHENKER XMG Neo 16 E23
Crucial P5 Plus 1TB CT1000P5PSSD8
0.024 ms * -50%
Gemiddeld Samsung 990 Pro 1 TB
  (0.012 - 0.053, n=19)
0.01995 ms * -25%
Asus ROG Strix Scar 17 G733PYV-LL053X
SK hynix PC801 HFS001TEJ9X101N
0.019 ms * -19%
Medion Erazer Beast X40 2024
Phison E18-1TB-PHISON-SSD-BICS5
0.016 ms * -0%
SCHENKER XMG Neo 16 (Early 24)
Samsung 990 Pro 1 TB
0.016 ms *

* ... kleiner is beter

Continuous Performance: DiskSpd Read Loop, Queue Depth 8

036072010801440180021602520288032403600396043204680504054005760612064806840Tooltip
SCHENKER XMG Neo 16 (Early 24) Samsung 990 Pro 1 TB; diskspd 2.0.17 f: Ø7118 (6337.06-7142.46)
Razer Blade 16 2024, RTX 4090 Samsung PM9A1 MZVL22T0HBLB; diskspd 2.0.17 f: Ø5414 (3853.78-6701.45)
Medion Erazer Beast X40 2024 Phison E18-1TB-PHISON-SSD-BICS5; diskspd 2.0.17 f: Ø6943 (5621.29-6984.69)
Asus ROG Strix Scar 17 G733PYV-LL053X SK hynix PC801 HFS001TEJ9X101N: Ø6593 (4837.89-6648.18)
SCHENKER XMG Neo 16 E23 Crucial P5 Plus 1TB CT1000P5PSSD8: Ø6442 (5614.61-6552.24)

Grafische kaart

Momenteel is de GeForce RTX 4090 de hoogste prestaties onder de mobiele GPU's van Nvidia. 9.728 shaders, een 256-bits bus en snel GDDR6 RAM (16.384 MB) kenmerken de pixelversneller. De maximale TGP bedraagt 175 watt (150 watt + 25 watt Dynamic Boost) - meer is niet mogelijk.

De benchmarkresultaten liggen boven (Overboost) en onder (Enthusiast, Balanced) het gemiddelde van de RTX 4090 tot nu toe. De Oasis waterkoeling helpt bij het bereiken van een kleine prestatieboost. Hoe dan ook, de belangrijkste concurrent, de Blade 16wordt op afstand gehouden. Om te schakelen tussen de dGPU en Optimus hoeft u niet opnieuw op te starten: Advanced Optimus wordt ondersteund.

Time Spy (PSU, Overboost)
Time Spy (Batterij, Overboost)
Time Spy (PSU, Overboost, Oasis)
Time Spy (PSU, Liefhebber)
Time Spy (PSU, Gebalanceerd)
3DMark Performance Rating - Percent
SCHENKER XMG Neo 16 (Early 24)
NVIDIA GeForce RTX 4090 Laptop GPU, Intel Core i9-14900HX
99.2 pt
SCHENKER XMG Neo 16 (Early 24)
NVIDIA GeForce RTX 4090 Laptop GPU, Intel Core i9-14900HX
98 pt
SCHENKER XMG Neo 16 E23
NVIDIA GeForce RTX 4090 Laptop GPU, Intel Core i9-13900HX
97.5 pt
Asus ROG Strix Scar 17 G733PYV-LL053X
NVIDIA GeForce RTX 4090 Laptop GPU, AMD Ryzen 9 7945HX3D
92.7 pt
Gemiddeld NVIDIA GeForce RTX 4090 Laptop GPU
 
90.5 pt
Lenovo Legion Pro 7 RTX4090
NVIDIA GeForce RTX 4090 Laptop GPU, Intel Core i9-13900HX
89.6 pt
Razer Blade 16 2024, RTX 4090
NVIDIA GeForce RTX 4090 Laptop GPU, Intel Core i9-14900HX
89.5 pt
Medion Erazer Beast X40 2024
NVIDIA GeForce RTX 4090 Laptop GPU, Intel Core i9-14900HX
88.8 pt
Lenovo Legion 9 16IRX9, RTX 4090
NVIDIA GeForce RTX 4090 Laptop GPU, Intel Core i9-14900HX
87.6 pt
Asus ROG Strix Scar 16 G634JZR
NVIDIA GeForce RTX 4080 Laptop GPU, Intel Core i9-14900HX
81.5 pt
Alienware x16 R2 P120F
NVIDIA GeForce RTX 4080 Laptop GPU, Intel Core Ultra 9 185H
80.9 pt
Gemiddelde van klas Gaming
 
60 pt
3DMark 11 - 1280x720 Performance GPU
SCHENKER XMG Neo 16 (Early 24)
NVIDIA GeForce RTX 4090 Laptop GPU, Intel Core i9-14900HX (Overboost, Oasis)
72178 Points +4%
SCHENKER XMG Neo 16 E23
NVIDIA GeForce RTX 4090 Laptop GPU, Intel Core i9-13900HX
72070 Points +4%
SCHENKER XMG Neo 16 (Early 24)
NVIDIA GeForce RTX 4090 Laptop GPU, Intel Core i9-14900HX
69606 Points
Razer Blade 16 2024, RTX 4090
NVIDIA GeForce RTX 4090 Laptop GPU, Intel Core i9-14900HX
65956 Points -5%
Gemiddeld NVIDIA GeForce RTX 4090 Laptop GPU
  (54073 - 73027, n=42)
65041 Points -7%
Medion Erazer Beast X40 2024
NVIDIA GeForce RTX 4090 Laptop GPU, Intel Core i9-14900HX
64540 Points -7%
Lenovo Legion 9 16IRX9, RTX 4090
NVIDIA GeForce RTX 4090 Laptop GPU, Intel Core i9-14900HX
64341 Points -8%
Asus ROG Strix Scar 17 G733PYV-LL053X
NVIDIA GeForce RTX 4090 Laptop GPU, AMD Ryzen 9 7945HX3D
64166 Points -8%
Lenovo Legion Pro 7 RTX4090
NVIDIA GeForce RTX 4090 Laptop GPU, Intel Core i9-13900HX
62862 Points -10%
Asus ROG Strix Scar 16 G634JZR
NVIDIA GeForce RTX 4080 Laptop GPU, Intel Core i9-14900HX
58713 Points -16%
Alienware x16 R2 P120F
NVIDIA GeForce RTX 4080 Laptop GPU, Intel Core Ultra 9 185H
56772 Points -18%
Gemiddelde van klas Gaming
  (1029 - 72178, n=181, laatste 2 jaar)
44043 Points -37%
3DMark
1920x1080 Fire Strike Graphics
SCHENKER XMG Neo 16 (Early 24)
NVIDIA GeForce RTX 4090 Laptop GPU, Intel Core i9-14900HX
51946 Points
SCHENKER XMG Neo 16 (Early 24)
NVIDIA GeForce RTX 4090 Laptop GPU, Intel Core i9-14900HX (Overboost, Oasis)
50743 Points -2%
Asus ROG Strix Scar 17 G733PYV-LL053X
NVIDIA GeForce RTX 4090 Laptop GPU, AMD Ryzen 9 7945HX3D
49422 Points -5%
SCHENKER XMG Neo 16 E23
NVIDIA GeForce RTX 4090 Laptop GPU, Intel Core i9-13900HX
48556 Points -7%
Razer Blade 16 2024, RTX 4090
NVIDIA GeForce RTX 4090 Laptop GPU, Intel Core i9-14900HX
46527 Points -10%
Gemiddeld NVIDIA GeForce RTX 4090 Laptop GPU
  (40259 - 53059, n=41)
46365 Points -11%
Lenovo Legion Pro 7 RTX4090
NVIDIA GeForce RTX 4090 Laptop GPU, Intel Core i9-13900HX
45696 Points -12%
Medion Erazer Beast X40 2024
NVIDIA GeForce RTX 4090 Laptop GPU, Intel Core i9-14900HX
44366 Points -15%
Lenovo Legion 9 16IRX9, RTX 4090
NVIDIA GeForce RTX 4090 Laptop GPU, Intel Core i9-14900HX
43518 Points -16%
Alienware x16 R2 P120F
NVIDIA GeForce RTX 4080 Laptop GPU, Intel Core Ultra 9 185H
42558 Points -18%
Asus ROG Strix Scar 16 G634JZR
NVIDIA GeForce RTX 4080 Laptop GPU, Intel Core i9-14900HX
41431 Points -20%
Gemiddelde van klas Gaming
  (781 - 53059, n=193, laatste 2 jaar)
31600 Points -39%
2560x1440 Time Spy Graphics
SCHENKER XMG Neo 16 (Early 24)
NVIDIA GeForce RTX 4090 Laptop GPU, Intel Core i9-14900HX (Overboost, Oasis)
22717 Points +3%
SCHENKER XMG Neo 16 E23
NVIDIA GeForce RTX 4090 Laptop GPU, Intel Core i9-13900HX
22529 Points +2%
SCHENKER XMG Neo 16 (Early 24)
NVIDIA GeForce RTX 4090 Laptop GPU, Intel Core i9-14900HX
22134 Points
Asus ROG Strix Scar 17 G733PYV-LL053X
NVIDIA GeForce RTX 4090 Laptop GPU, AMD Ryzen 9 7945HX3D
21353 Points -4%
Lenovo Legion Pro 7 RTX4090
NVIDIA GeForce RTX 4090 Laptop GPU, Intel Core i9-13900HX
21279 Points -4%
Gemiddeld NVIDIA GeForce RTX 4090 Laptop GPU
  (16950 - 23292, n=43)
20950 Points -5%
Medion Erazer Beast X40 2024
NVIDIA GeForce RTX 4090 Laptop GPU, Intel Core i9-14900HX
20806 Points -6%
Lenovo Legion 9 16IRX9, RTX 4090
NVIDIA GeForce RTX 4090 Laptop GPU, Intel Core i9-14900HX
20416 Points -8%
Razer Blade 16 2024, RTX 4090
NVIDIA GeForce RTX 4090 Laptop GPU, Intel Core i9-14900HX
19878 Points -10%
Asus ROG Strix Scar 16 G634JZR
NVIDIA GeForce RTX 4080 Laptop GPU, Intel Core i9-14900HX
18954 Points -14%
Alienware x16 R2 P120F
NVIDIA GeForce RTX 4080 Laptop GPU, Intel Core Ultra 9 185H
18627 Points -16%
Gemiddelde van klas Gaming
  (224 - 22717, n=188, laatste 2 jaar)
13211 Points -40%
3DMark 06 Standard Score
62889 punten
3DMark 11 Performance
43829 punten
3DMark Fire Strike Score
38597 punten
3DMark Time Spy Score
20588 punten
3DMark Steel Nomad Score
5102 punten
Help
Blender
v3.3 Classroom OPTIX/RTX
Gemiddelde van klas Gaming
  (9 - 95, n=177, laatste 2 jaar)
20.7 Seconds * -59%
Alienware x16 R2 P120F
NVIDIA GeForce RTX 4080 Laptop GPU, Intel Core Ultra 9 185H (3.3.3)
15 Seconds * -15%
SCHENKER XMG Neo 16 E23
NVIDIA GeForce RTX 4090 Laptop GPU, Intel Core i9-13900HX (3.3.0)
13 Seconds * -0%
Asus ROG Strix Scar 16 G634JZR
NVIDIA GeForce RTX 4080 Laptop GPU, Intel Core i9-14900HX (3.3.3)
13 Seconds * -0%
Lenovo Legion 9 16IRX9, RTX 4090
NVIDIA GeForce RTX 4090 Laptop GPU, Intel Core i9-14900HX (3.3.3)
13 Seconds * -0%
SCHENKER XMG Neo 16 (Early 24)
NVIDIA GeForce RTX 4090 Laptop GPU, Intel Core i9-14900HX (3.3.3)
13 Seconds *
Gemiddeld NVIDIA GeForce RTX 4090 Laptop GPU
  (9 - 19, n=39)
12.1 Seconds * +7%
Lenovo Legion Pro 7 RTX4090
NVIDIA GeForce RTX 4090 Laptop GPU, Intel Core i9-13900HX (3.3.3)
12 Seconds * +8%
Razer Blade 16 2024, RTX 4090
NVIDIA GeForce RTX 4090 Laptop GPU, Intel Core i9-14900HX (3.3.3)
12 Seconds * +8%
SCHENKER XMG Neo 16 (Early 24)
NVIDIA GeForce RTX 4090 Laptop GPU, Intel Core i9-14900HX (3.3.3, Overboost, Oasis)
12 Seconds * +8%
Asus ROG Strix Scar 17 G733PYV-LL053X
NVIDIA GeForce RTX 4090 Laptop GPU, AMD Ryzen 9 7945HX3D (3.3.3)
11 Seconds * +15%
Medion Erazer Beast X40 2024
NVIDIA GeForce RTX 4090 Laptop GPU, Intel Core i9-14900HX (3.3.3)
11 Seconds * +15%
v3.3 Classroom CUDA
Gemiddelde van klas Gaming
  (16 - 175, n=182, laatste 2 jaar)
36.1 Seconds * -112%
Asus ROG Strix Scar 16 G634JZR
NVIDIA GeForce RTX 4080 Laptop GPU, Intel Core i9-14900HX (3.3.3)
22 Seconds * -29%
Alienware x16 R2 P120F
NVIDIA GeForce RTX 4080 Laptop GPU, Intel Core Ultra 9 185H (3.3.3)
22 Seconds * -29%
Gemiddeld NVIDIA GeForce RTX 4090 Laptop GPU
  (16 - 24, n=39)
18.3 Seconds * -8%
SCHENKER XMG Neo 16 E23
NVIDIA GeForce RTX 4090 Laptop GPU, Intel Core i9-13900HX (3.3.0)
18 Seconds * -6%
Lenovo Legion Pro 7 RTX4090
NVIDIA GeForce RTX 4090 Laptop GPU, Intel Core i9-13900HX
18 Seconds * -6%
Asus ROG Strix Scar 17 G733PYV-LL053X
NVIDIA GeForce RTX 4090 Laptop GPU, AMD Ryzen 9 7945HX3D (3.3.3)
18 Seconds * -6%
Razer Blade 16 2024, RTX 4090
NVIDIA GeForce RTX 4090 Laptop GPU, Intel Core i9-14900HX (3.3.3)
18 Seconds * -6%
Lenovo Legion 9 16IRX9, RTX 4090
NVIDIA GeForce RTX 4090 Laptop GPU, Intel Core i9-14900HX (3.3.3)
18 Seconds * -6%
Medion Erazer Beast X40 2024
NVIDIA GeForce RTX 4090 Laptop GPU, Intel Core i9-14900HX (3.3.3)
17 Seconds * -0%
SCHENKER XMG Neo 16 (Early 24)
NVIDIA GeForce RTX 4090 Laptop GPU, Intel Core i9-14900HX (3.3.3)
17 Seconds *
SCHENKER XMG Neo 16 (Early 24)
NVIDIA GeForce RTX 4090 Laptop GPU, Intel Core i9-14900HX (3.3.3, Overboost, Oasis)
16 Seconds * +6%
v3.3 Classroom CPU
Alienware x16 R2 P120F
NVIDIA GeForce RTX 4080 Laptop GPU, Intel Core Ultra 9 185H (3.3.3)
305 Seconds * -83%
Gemiddelde van klas Gaming
  (138 - 962, n=186, laatste 2 jaar)
293 Seconds * -75%
Medion Erazer Beast X40 2024
NVIDIA GeForce RTX 4090 Laptop GPU, Intel Core i9-14900HX (3.3.3)
253 Seconds * -51%
SCHENKER XMG Neo 16 E23
NVIDIA GeForce RTX 4090 Laptop GPU, Intel Core i9-13900HX (3.3.0)
205 Seconds * -23%
Razer Blade 16 2024, RTX 4090
NVIDIA GeForce RTX 4090 Laptop GPU, Intel Core i9-14900HX (3.3.3)
202 Seconds * -21%
Gemiddeld NVIDIA GeForce RTX 4090 Laptop GPU
  (144 - 305, n=39)
199.1 Seconds * -19%
Lenovo Legion Pro 7 RTX4090
NVIDIA GeForce RTX 4090 Laptop GPU, Intel Core i9-13900HX (3.3.3)
198 Seconds * -19%
Lenovo Legion 9 16IRX9, RTX 4090
NVIDIA GeForce RTX 4090 Laptop GPU, Intel Core i9-14900HX (3.3.3)
193 Seconds * -16%
Asus ROG Strix Scar 16 G634JZR
NVIDIA GeForce RTX 4080 Laptop GPU, Intel Core i9-14900HX (3.3.3)
187 Seconds * -12%
SCHENKER XMG Neo 16 (Early 24)
NVIDIA GeForce RTX 4090 Laptop GPU, Intel Core i9-14900HX (3.3.3)
167 Seconds *
SCHENKER XMG Neo 16 (Early 24)
NVIDIA GeForce RTX 4090 Laptop GPU, Intel Core i9-14900HX (3.3.3, Overboost, Oasis)
155 Seconds * +7%
Asus ROG Strix Scar 17 G733PYV-LL053X
NVIDIA GeForce RTX 4090 Laptop GPU, AMD Ryzen 9 7945HX3D (3.3.3)
150 Seconds * +10%
Geekbench 5.5
OpenCL Score
SCHENKER XMG Neo 16 (Early 24)
NVIDIA GeForce RTX 4090 Laptop GPU, Intel Core i9-14900HX (Overboost, Oasis)
237138 Points +4%
SCHENKER XMG Neo 16 (Early 24)
NVIDIA GeForce RTX 4090 Laptop GPU, Intel Core i9-14900HX
228074 Points
SCHENKER XMG Neo 16 E23
NVIDIA GeForce RTX 4090 Laptop GPU, Intel Core i9-13900HX
221004 Points -3%
Asus ROG Strix Scar 17 G733PYV-LL053X
NVIDIA GeForce RTX 4090 Laptop GPU, AMD Ryzen 9 7945HX3D
204326 Points -10%
Medion Erazer Beast X40 2024
NVIDIA GeForce RTX 4090 Laptop GPU, Intel Core i9-14900HX
201625 Points -12%
Gemiddeld NVIDIA GeForce RTX 4090 Laptop GPU
  (6841 - 237138, n=39)
201434 Points -12%
Razer Blade 16 2024, RTX 4090
NVIDIA GeForce RTX 4090 Laptop GPU, Intel Core i9-14900HX
196962 Points -14%
Lenovo Legion 9 16IRX9, RTX 4090
NVIDIA GeForce RTX 4090 Laptop GPU, Intel Core i9-14900HX
190565 Points -16%
Lenovo Legion Pro 7 RTX4090
NVIDIA GeForce RTX 4090 Laptop GPU, Intel Core i9-13900HX
170505 Points -25%
Asus ROG Strix Scar 16 G634JZR
NVIDIA GeForce RTX 4080 Laptop GPU, Intel Core i9-14900HX
170225 Points -25%
Alienware x16 R2 P120F
NVIDIA GeForce RTX 4080 Laptop GPU, Intel Core Ultra 9 185H
163242 Points -28%
Gemiddelde van klas Gaming
  (5039 - 237138, n=187, laatste 2 jaar)
128049 Points -44%
Vulkan Score 5.5
SCHENKER XMG Neo 16 (Early 24)
NVIDIA GeForce RTX 4090 Laptop GPU, Intel Core i9-14900HX
163089 Points
Medion Erazer Beast X40 2024
NVIDIA GeForce RTX 4090 Laptop GPU, Intel Core i9-14900HX
154063 Points -6%
Razer Blade 16 2024, RTX 4090
NVIDIA GeForce RTX 4090 Laptop GPU, Intel Core i9-14900HX
148841 Points -9%
Lenovo Legion 9 16IRX9, RTX 4090
NVIDIA GeForce RTX 4090 Laptop GPU, Intel Core i9-14900HX
133971 Points -18%
Asus ROG Strix Scar 17 G733PYV-LL053X
NVIDIA GeForce RTX 4090 Laptop GPU, AMD Ryzen 9 7945HX3D
119323 Points -27%
SCHENKER XMG Neo 16 (Early 24)
NVIDIA GeForce RTX 4090 Laptop GPU, Intel Core i9-14900HX (Overboost, Oasis)
117457 Points -28%
Gemiddeld NVIDIA GeForce RTX 4090 Laptop GPU
  (49663 - 163089, n=28)
102459 Points -37%
Alienware x16 R2 P120F
NVIDIA GeForce RTX 4080 Laptop GPU, Intel Core Ultra 9 185H
82123 Points -50%
Gemiddelde van klas Gaming
  (7995 - 163089, n=117, laatste 2 jaar)
73138 Points -55%
Lenovo Legion Pro 7 RTX4090
NVIDIA GeForce RTX 4090 Laptop GPU, Intel Core i9-13900HX
63400 Points -61%
Asus ROG Strix Scar 16 G634JZR
NVIDIA GeForce RTX 4080 Laptop GPU, Intel Core i9-14900HX
52951 Points -68%
Geekbench 6.3
GPU Vulkan
Razer Blade 16 2024, RTX 4090
NVIDIA GeForce RTX 4090 Laptop GPU, Intel Core i9-14900HX (6.2.1)
178909 Points +9%
Medion Erazer Beast X40 2024
NVIDIA GeForce RTX 4090 Laptop GPU, Intel Core i9-14900HX (6.2.1)
178630 Points +9%
SCHENKER XMG Neo 16 (Early 24)
NVIDIA GeForce RTX 4090 Laptop GPU, Intel Core i9-14900HX (6.2.1)
164105 Points
Asus ROG Strix Scar 17 G733PYV-LL053X
NVIDIA GeForce RTX 4090 Laptop GPU, AMD Ryzen 9 7945HX3D
157614 Points -4%
SCHENKER XMG Neo 16 (Early 24)
NVIDIA GeForce RTX 4090 Laptop GPU, Intel Core i9-14900HX (6.2.1, Overboost, Oasis)
149336 Points -9%
Lenovo Legion 9 16IRX9, RTX 4090
NVIDIA GeForce RTX 4090 Laptop GPU, Intel Core i9-14900HX (6.2.1)
148584 Points -9%
Gemiddeld NVIDIA GeForce RTX 4090 Laptop GPU
  (9584 - 196201, n=17)
146803 Points -11%
Alienware x16 R2 P120F
NVIDIA GeForce RTX 4080 Laptop GPU, Intel Core Ultra 9 185H (6.2.1)
115199 Points -30%
Asus ROG Strix Scar 16 G634JZR
NVIDIA GeForce RTX 4080 Laptop GPU, Intel Core i9-14900HX (6.2.1)
110302 Points -33%
Gemiddelde van klas Gaming
  (4286 - 196201, n=106, laatste 2 jaar)
82352 Points -50%
GPU OpenCL
Medion Erazer Beast X40 2024
NVIDIA GeForce RTX 4090 Laptop GPU, Intel Core i9-14900HX (6.2.1)
207373 Points +9%
SCHENKER XMG Neo 16 (Early 24)
NVIDIA GeForce RTX 4090 Laptop GPU, Intel Core i9-14900HX (6.2.1, Overboost, Oasis)
199154 Points +4%
Asus ROG Strix Scar 17 G733PYV-LL053X
NVIDIA GeForce RTX 4090 Laptop GPU, AMD Ryzen 9 7945HX3D
192262 Points +1%
SCHENKER XMG Neo 16 (Early 24)
NVIDIA GeForce RTX 4090 Laptop GPU, Intel Core i9-14900HX (6.2.1)
190820 Points
Lenovo Legion 9 16IRX9, RTX 4090
NVIDIA GeForce RTX 4090 Laptop GPU, Intel Core i9-14900HX (6.2.1)
190540 Points 0%
Gemiddeld NVIDIA GeForce RTX 4090 Laptop GPU
  (159127 - 209521, n=20)
187721 Points -2%
Razer Blade 16 2024, RTX 4090
NVIDIA GeForce RTX 4090 Laptop GPU, Intel Core i9-14900HX (6.2.1)
167047 Points -12%
Asus ROG Strix Scar 16 G634JZR
NVIDIA GeForce RTX 4080 Laptop GPU, Intel Core i9-14900HX (6.2.1)
157282 Points -18%
Alienware x16 R2 P120F
NVIDIA GeForce RTX 4080 Laptop GPU, Intel Core Ultra 9 185H (6.2.1)
153327 Points -20%
Gemiddelde van klas Gaming
  (4321 - 207373, n=112, laatste 2 jaar)
116335 Points -39%
V-Ray 5 Benchmark
GPU RTX
SCHENKER XMG Neo 16 (Early 24)
NVIDIA GeForce RTX 4090 Laptop GPU, Intel Core i9-14900HX (5.0.1, v6.92.6600, Overboost, Oasis)
3744 mpaths +4%
Asus ROG Strix Scar 17 G733PYV-LL053X
NVIDIA GeForce RTX 4090 Laptop GPU, AMD Ryzen 9 7945HX3D (5.0.1)
3715 mpaths +4%
SCHENKER XMG Neo 16 (Early 24)
NVIDIA GeForce RTX 4090 Laptop GPU, Intel Core i9-14900HX (5.0.1)
3588 mpaths
Gemiddeld NVIDIA GeForce RTX 4090 Laptop GPU
  (1982 - 3824, n=29)
3476 mpaths -3%
Medion Erazer Beast X40 2024
NVIDIA GeForce RTX 4090 Laptop GPU, Intel Core i9-14900HX (5.0.1)
3424 mpaths -5%
Alienware x16 R2 P120F
NVIDIA GeForce RTX 4080 Laptop GPU, Intel Core Ultra 9 185H (5.0.1)
2653 mpaths -26%
Gemiddelde van klas Gaming
  (171 - 3824, n=110, laatste 2 jaar)
2219 mpaths -38%
GPU CUDA
SCHENKER XMG Neo 16 (Early 24)
NVIDIA GeForce RTX 4090 Laptop GPU, Intel Core i9-14900HX (5.0.1, v6.92.6600, Overboost, Oasis)
2710 mpaths +4%
Asus ROG Strix Scar 17 G733PYV-LL053X
NVIDIA GeForce RTX 4090 Laptop GPU, AMD Ryzen 9 7945HX3D (5.0.1)
2708 mpaths +4%
SCHENKER XMG Neo 16 (Early 24)
NVIDIA GeForce RTX 4090 Laptop GPU, Intel Core i9-14900HX (5.0.1)
2603 mpaths
Gemiddeld NVIDIA GeForce RTX 4090 Laptop GPU
  (1454 - 2797, n=29)
2537 mpaths -3%
Medion Erazer Beast X40 2024
NVIDIA GeForce RTX 4090 Laptop GPU, Intel Core i9-14900HX (5.0.1)
2489 mpaths -4%
Alienware x16 R2 P120F
NVIDIA GeForce RTX 4080 Laptop GPU, Intel Core Ultra 9 185H (5.0.1)
1967 mpaths -24%
Gemiddelde van klas Gaming
  (120 - 2797, n=112, laatste 2 jaar)
1592 mpaths -39%
CPU
Asus ROG Strix Scar 17 G733PYV-LL053X
NVIDIA GeForce RTX 4090 Laptop GPU, AMD Ryzen 9 7945HX3D (5.0.1)
25424 mpaths +9%
SCHENKER XMG Neo 16 (Early 24)
NVIDIA GeForce RTX 4090 Laptop GPU, Intel Core i9-14900HX (5.0.1, v6.92.6600, Overboost, Oasis)
24595 mpaths +5%
SCHENKER XMG Neo 16 (Early 24)
NVIDIA GeForce RTX 4090 Laptop GPU, Intel Core i9-14900HX (5.0.1)
23364 mpaths
Gemiddeld NVIDIA GeForce RTX 4090 Laptop GPU
  (12404 - 25897, n=27)
20296 mpaths -13%
Medion Erazer Beast X40 2024
NVIDIA GeForce RTX 4090 Laptop GPU, Intel Core i9-14900HX (5.0.1)
15489 mpaths -34%
Gemiddelde van klas Gaming
  (3562 - 26944, n=114, laatste 2 jaar)
15263 mpaths -35%
Alienware x16 R2 P120F
NVIDIA GeForce RTX 4080 Laptop GPU, Intel Core Ultra 9 185H (5.0.1)
12388 mpaths -47%
V-Ray Benchmark Next 4.10
GPU
SCHENKER XMG Neo 16 E23
NVIDIA GeForce RTX 4090 Laptop GPU, Intel Core i9-13900HX (v4.10.07 )
1334 mpaths +3%
SCHENKER XMG Neo 16 (Early 24)
NVIDIA GeForce RTX 4090 Laptop GPU, Intel Core i9-14900HX (v4.10.07, v6.92.6600, Overboost, Oasis)
1317 mpaths +2%
SCHENKER XMG Neo 16 (Early 24)
NVIDIA GeForce RTX 4090 Laptop GPU, Intel Core i9-14900HX (v4.10.07 )
1296 mpaths
Asus ROG Strix Scar 17 G733PYV-LL053X
NVIDIA GeForce RTX 4090 Laptop GPU, AMD Ryzen 9 7945HX3D (v4.10.07 )
1276 mpaths -2%
Razer Blade 16 2024, RTX 4090
NVIDIA GeForce RTX 4090 Laptop GPU, Intel Core i9-14900HX (v4.10.07 )
1258 mpaths -3%
Gemiddeld NVIDIA GeForce RTX 4090 Laptop GPU
  (873 - 1334, n=30)
1213 mpaths -6%
Lenovo Legion 9 16IRX9, RTX 4090
NVIDIA GeForce RTX 4090 Laptop GPU, Intel Core i9-14900HX (v4.10.07 )
1191 mpaths -8%
Medion Erazer Beast X40 2024
NVIDIA GeForce RTX 4090 Laptop GPU, Intel Core i9-14900HX (v4.10.07 )
1170 mpaths -10%
Asus ROG Strix Scar 16 G634JZR
NVIDIA GeForce RTX 4080 Laptop GPU, Intel Core i9-14900HX (v4.10.07 )
1036 mpaths -20%
Lenovo Legion Pro 7 RTX4090
NVIDIA GeForce RTX 4090 Laptop GPU, Intel Core i9-13900HX (v4.10.07 )
873 mpaths -33%
Gemiddelde van klas Gaming
  (54 - 1334, n=151, laatste 2 jaar)
714 mpaths -45%
CPU
Asus ROG Strix Scar 17 G733PYV-LL053X
NVIDIA GeForce RTX 4090 Laptop GPU, AMD Ryzen 9 7945HX3D (v4.10.07 )
37621 ksamples +3%
SCHENKER XMG Neo 16 (Early 24)
NVIDIA GeForce RTX 4090 Laptop GPU, Intel Core i9-14900HX (v4.10.07, v6.92.6600, Overboost, Oasis)
37055 ksamples +2%
SCHENKER XMG Neo 16 (Early 24)
NVIDIA GeForce RTX 4090 Laptop GPU, Intel Core i9-14900HX (v4.10.07 )
36438 ksamples
Lenovo Legion 9 16IRX9, RTX 4090
NVIDIA GeForce RTX 4090 Laptop GPU, Intel Core i9-14900HX (v4.10.07 )
31870 ksamples -13%
Lenovo Legion Pro 7 RTX4090
NVIDIA GeForce RTX 4090 Laptop GPU, Intel Core i9-13900HX (v4.10.07 )
30971 ksamples -15%
Asus ROG Strix Scar 16 G634JZR
NVIDIA GeForce RTX 4080 Laptop GPU, Intel Core i9-14900HX (v4.10.07 )
30073 ksamples -17%
Gemiddeld NVIDIA GeForce RTX 4090 Laptop GPU
  (18206 - 37629, n=30)
29643 ksamples -19%
Razer Blade 16 2024, RTX 4090
NVIDIA GeForce RTX 4090 Laptop GPU, Intel Core i9-14900HX (v4.10.07 )
29082 ksamples -20%
SCHENKER XMG Neo 16 E23
NVIDIA GeForce RTX 4090 Laptop GPU, Intel Core i9-13900HX (v4.10.07 )
29032 ksamples -20%
Medion Erazer Beast X40 2024
NVIDIA GeForce RTX 4090 Laptop GPU, Intel Core i9-14900HX (v4.10.07 )
23314 ksamples -36%
Gemiddelde van klas Gaming
  (5413 - 37629, n=151, laatste 2 jaar)
21560 ksamples -41%

* ... kleiner is beter

Gamingprestaties

De XMG-computer is ontworpen om QHD-gaming op maximale instellingen aan te kunnen. De framerates liggen boven het gemiddelde voor de RTX 4090 (Overboost), waarbij de waterkoeling de prestaties iets verbetert. De GPU-functies Frame Generation en DLSS 3 zouden hogere resoluties mogelijk maken bij maximale instellingen en met ray tracing - zij het alleen met games die deze functies bieden.

Performance Rating - Percent
Asus ROG Strix Scar 17 G733PYV-LL053X
AMD Ryzen 9 7945HX3D, NVIDIA GeForce RTX 4090 Laptop GPU
97.7 pt
SCHENKER XMG Neo 16 (Early 24)
Intel Core i9-14900HX, NVIDIA GeForce RTX 4090 Laptop GPU
94.6 pt
SCHENKER XMG Neo 16 (Early 24)
Intel Core i9-14900HX, NVIDIA GeForce RTX 4090 Laptop GPU
94.1 pt
SCHENKER XMG Neo 16 E23
Intel Core i9-13900HX, NVIDIA GeForce RTX 4090 Laptop GPU
88.8 pt
Medion Erazer Beast X40 2024
Intel Core i9-14900HX, NVIDIA GeForce RTX 4090 Laptop GPU
88.5 pt
Lenovo Legion Pro 7 RTX4090
Intel Core i9-13900HX, NVIDIA GeForce RTX 4090 Laptop GPU
86.1 pt
Gemiddeld NVIDIA GeForce RTX 4090 Laptop GPU
 
84.2 pt
Asus ROG Strix Scar 16 G634JZR
Intel Core i9-14900HX, NVIDIA GeForce RTX 4080 Laptop GPU
84 pt
Razer Blade 16 2024, RTX 4090
Intel Core i9-14900HX, NVIDIA GeForce RTX 4090 Laptop GPU
83.9 pt
Lenovo Legion 9 16IRX9, RTX 4090
Intel Core i9-14900HX, NVIDIA GeForce RTX 4090 Laptop GPU
82.8 pt
Alienware x16 R2 P120F -1!
Intel Core Ultra 9 185H, NVIDIA GeForce RTX 4080 Laptop GPU
66.2 pt
Gemiddelde van klas Gaming
 
62.9 pt
The Witcher 3 - 1920x1080 Ultra Graphics & Postprocessing (HBAO+)
SCHENKER XMG Neo 16 (Early 24)
Intel Core i9-14900HX, NVIDIA GeForce RTX 4090 Laptop GPU
214 (181min) fps
SCHENKER XMG Neo 16 (Early 24)
Intel Core i9-14900HX, NVIDIA GeForce RTX 4090 Laptop GPU (Overboost, Oasis)
214 fps 0%
SCHENKER XMG Neo 16 E23
Intel Core i9-13900HX, NVIDIA GeForce RTX 4090 Laptop GPU
210 (170min) fps -2%
Asus ROG Strix Scar 17 G733PYV-LL053X
AMD Ryzen 9 7945HX3D, NVIDIA GeForce RTX 4090 Laptop GPU
207 fps -3%
Medion Erazer Beast X40 2024
Intel Core i9-14900HX, NVIDIA GeForce RTX 4090 Laptop GPU
204 fps -5%
Lenovo Legion 9 16IRX9, RTX 4090
Intel Core i9-14900HX, NVIDIA GeForce RTX 4090 Laptop GPU
203.4 fps -5%
Lenovo Legion Pro 7 RTX4090
Intel Core i9-13900HX, NVIDIA GeForce RTX 4090 Laptop GPU
200 (174min) fps -7%
Razer Blade 16 2024, RTX 4090
Intel Core i9-14900HX, NVIDIA GeForce RTX 4090 Laptop GPU
200 fps -7%
Gemiddeld NVIDIA GeForce RTX 4090 Laptop GPU
  (139.2 - 216, n=35)
198.5 fps -7%
Asus ROG Strix Scar 16 G634JZR
Intel Core i9-14900HX, NVIDIA GeForce RTX 4080 Laptop GPU
185.6 (170min, 170.31P1) fps -13%
Alienware x16 R2 P120F
Intel Core Ultra 9 185H, NVIDIA GeForce RTX 4080 Laptop GPU
166.3 (154min) fps -22%
Gemiddelde van klas Gaming
  (18.4 - 216, n=160, laatste 2 jaar)
129.2 fps -40%
GTA V - 1920x1080 Highest Settings possible AA:4xMSAA + FX AF:16x
Asus ROG Strix Scar 17 G733PYV-LL053X
AMD Ryzen 9 7945HX3D, NVIDIA GeForce RTX 4090 Laptop GPU
167.7 (1.87min, 111.1P1) fps +5%
SCHENKER XMG Neo 16 (Early 24)
Intel Core i9-14900HX, NVIDIA GeForce RTX 4090 Laptop GPU (Overboost, Oasis)
163 (4.23min, 125P1) fps +2%
SCHENKER XMG Neo 16 (Early 24)
Intel Core i9-14900HX, NVIDIA GeForce RTX 4090 Laptop GPU
159.3 (3.25min, 125P1) fps
SCHENKER XMG Neo 16 E23
Intel Core i9-13900HX, NVIDIA GeForce RTX 4090 Laptop GPU
148.2 (7.32min, 100P1) fps -7%
Lenovo Legion Pro 7 RTX4090
Intel Core i9-13900HX, NVIDIA GeForce RTX 4090 Laptop GPU
143.6 (4.39min, 100P1) fps -10%
Medion Erazer Beast X40 2024
Intel Core i9-14900HX, NVIDIA GeForce RTX 4090 Laptop GPU
141.5 (3.53min, 100P1) fps -11%
Asus ROG Strix Scar 16 G634JZR
Intel Core i9-14900HX, NVIDIA GeForce RTX 4080 Laptop GPU
139 (6.45min, 100P1) fps -13%
Gemiddeld NVIDIA GeForce RTX 4090 Laptop GPU
  (91.1 - 167.7, n=40)
138.6 fps -13%
Razer Blade 16 2024, RTX 4090
Intel Core i9-14900HX, NVIDIA GeForce RTX 4090 Laptop GPU
138.1 (4.19min, 83.3P1) fps -13%
Lenovo Legion 9 16IRX9, RTX 4090
Intel Core i9-14900HX, NVIDIA GeForce RTX 4090 Laptop GPU
136.2 (0.938min, 111.1P1) fps -15%
Gemiddelde van klas Gaming
  (12.1 - 167.7, n=168, laatste 2 jaar)
114 fps -28%
Final Fantasy XV Benchmark - 1920x1080 High Quality
SCHENKER XMG Neo 16 (Early 24)
Intel Core i9-14900HX, NVIDIA GeForce RTX 4090 Laptop GPU (1.3, Overboost, Oasis)
201 fps +2%
SCHENKER XMG Neo 16 (Early 24)
Intel Core i9-14900HX, NVIDIA GeForce RTX 4090 Laptop GPU (1.3)
196.9 fps
SCHENKER XMG Neo 16 E23
Intel Core i9-13900HX, NVIDIA GeForce RTX 4090 Laptop GPU (1.3)
184.9 fps -6%
Lenovo Legion Pro 7 RTX4090
Intel Core i9-13900HX, NVIDIA GeForce RTX 4090 Laptop GPU (1.3)
181.2 fps -8%
Medion Erazer Beast X40 2024
Intel Core i9-14900HX, NVIDIA GeForce RTX 4090 Laptop GPU (1.3)
181.1 fps -8%
Asus ROG Strix Scar 17 G733PYV-LL053X
AMD Ryzen 9 7945HX3D, NVIDIA GeForce RTX 4090 Laptop GPU (1.3)
180 fps -9%
Asus ROG Strix Scar 16 G634JZR
Intel Core i9-14900HX, NVIDIA GeForce RTX 4080 Laptop GPU (1.3)
178 fps -10%
Gemiddeld NVIDIA GeForce RTX 4090 Laptop GPU
  (122.2 - 201, n=40)
173.4 fps -12%
Lenovo Legion 9 16IRX9, RTX 4090
Intel Core i9-14900HX, NVIDIA GeForce RTX 4090 Laptop GPU (1.3)
165.1 fps -16%
Alienware x16 R2 P120F
Intel Core Ultra 9 185H, NVIDIA GeForce RTX 4080 Laptop GPU (1.3)
139.8 fps -29%
Razer Blade 16 2024, RTX 4090
Intel Core i9-14900HX, NVIDIA GeForce RTX 4090 Laptop GPU (1.3)
137.5 fps -30%
Gemiddelde van klas Gaming
  (19.2 - 201, n=180, laatste 2 jaar)
120.5 fps -39%
Strange Brigade - 1920x1080 ultra AA:ultra AF:16
Asus ROG Strix Scar 17 G733PYV-LL053X
AMD Ryzen 9 7945HX3D, NVIDIA GeForce RTX 4090 Laptop GPU (1.47.22.14 D3D12)
420 (64.7min, 302P1) fps +4%
SCHENKER XMG Neo 16 (Early 24)
Intel Core i9-14900HX, NVIDIA GeForce RTX 4090 Laptop GPU (1.47.22.14 D3D12, Overboost, Oasis)
415 (139.4min, 305P1) fps +3%
SCHENKER XMG Neo 16 (Early 24)
Intel Core i9-14900HX, NVIDIA GeForce RTX 4090 Laptop GPU (1.47.22.14 D3D12)
403 (101.2min, 295P1) fps
SCHENKER XMG Neo 16 E23
Intel Core i9-13900HX, NVIDIA GeForce RTX 4090 Laptop GPU (1.47.22.14 D3D12)
384 (116.1min, 281P1) fps -5%
Medion Erazer Beast X40 2024
Intel Core i9-14900HX, NVIDIA GeForce RTX 4090 Laptop GPU (1.47.22.14 D3D12)
371 (5min, 273P1) fps -8%
Lenovo Legion 9 16IRX9, RTX 4090
Intel Core i9-14900HX, NVIDIA GeForce RTX 4090 Laptop GPU (1.47.22.14 D3D12)
369 (5min, 269P1) fps -8%
Razer Blade 16 2024, RTX 4090
Intel Core i9-14900HX, NVIDIA GeForce RTX 4090 Laptop GPU (1.47.22.14 D3D12)
359.8 (30.2min, 253P1) fps -11%
Gemiddeld NVIDIA GeForce RTX 4090 Laptop GPU
  (233 - 421, n=39)
357 fps -11%
Lenovo Legion Pro 7 RTX4090
Intel Core i9-13900HX, NVIDIA GeForce RTX 4090 Laptop GPU (1.47.22.14 D3D12)
347 (87.7min, 252P1) fps -14%
Asus ROG Strix Scar 16 G634JZR
Intel Core i9-14900HX, NVIDIA GeForce RTX 4080 Laptop GPU (1.47.22.14 D3D12)
337 (16.7min, 246P1) fps -16%
Alienware x16 R2 P120F
Intel Core Ultra 9 185H, NVIDIA GeForce RTX 4080 Laptop GPU (1.47.22.14 D3D12)
293 (38.3min, 184.1P1) fps -27%
Gemiddelde van klas Gaming
  (38.9 - 421, n=176, laatste 2 jaar)
230 fps -43%
Dota 2 Reborn - 1920x1080 ultra (3/3) best looking
Asus ROG Strix Scar 17 G733PYV-LL053X
AMD Ryzen 9 7945HX3D, NVIDIA GeForce RTX 4090 Laptop GPU
220 (175min) fps +13%
SCHENKER XMG Neo 16 (Early 24)
Intel Core i9-14900HX, NVIDIA GeForce RTX 4090 Laptop GPU
194.6 (165.7min) fps
SCHENKER XMG Neo 16 (Early 24)
Intel Core i9-14900HX, NVIDIA GeForce RTX 4090 Laptop GPU (Overboost, Oasis)
193.3 (166.3min) fps -1%
Medion Erazer Beast X40 2024
Intel Core i9-14900HX, NVIDIA GeForce RTX 4090 Laptop GPU
189.9 (162.8min) fps -2%
Razer Blade 16 2024, RTX 4090
Intel Core i9-14900HX, NVIDIA GeForce RTX 4090 Laptop GPU
188.1 (155.2min) fps -3%
SCHENKER XMG Neo 16 E23
Intel Core i9-13900HX, NVIDIA GeForce RTX 4090 Laptop GPU
182.6 (154.9min) fps -6%
Lenovo Legion Pro 7 RTX4090
Intel Core i9-13900HX, NVIDIA GeForce RTX 4090 Laptop GPU
182.1 (154.2min) fps -6%
Asus ROG Strix Scar 16 G634JZR
Intel Core i9-14900HX, NVIDIA GeForce RTX 4080 Laptop GPU
177.4 (149.3min) fps -9%
Gemiddeld NVIDIA GeForce RTX 4090 Laptop GPU
  (115.7 - 220, n=42)
176.3 fps -9%
Lenovo Legion 9 16IRX9, RTX 4090
Intel Core i9-14900HX, NVIDIA GeForce RTX 4090 Laptop GPU
164.5 (136min) fps -15%
Gemiddelde van klas Gaming
  (65.1 - 220, n=185, laatste 2 jaar)
151.4 fps -22%
Alienware x16 R2 P120F
Intel Core Ultra 9 185H, NVIDIA GeForce RTX 4080 Laptop GPU
133 (114.6min) fps -32%
X-Plane 11.11 - 1920x1080 high (fps_test=3)
Asus ROG Strix Scar 17 G733PYV-LL053X
AMD Ryzen 9 7945HX3D, NVIDIA GeForce RTX 4090 Laptop GPU
166.2 fps +15%
Razer Blade 16 2024, RTX 4090
Intel Core i9-14900HX, NVIDIA GeForce RTX 4090 Laptop GPU
146.2 fps +1%
SCHENKER XMG Neo 16 (Early 24)
Intel Core i9-14900HX, NVIDIA GeForce RTX 4090 Laptop GPU
144.5 fps
Medion Erazer Beast X40 2024
Intel Core i9-14900HX, NVIDIA GeForce RTX 4090 Laptop GPU
143.9 fps 0%
Asus ROG Strix Scar 16 G634JZR
Intel Core i9-14900HX, NVIDIA GeForce RTX 4080 Laptop GPU
141.3 fps -2%
SCHENKER XMG Neo 16 (Early 24)
Intel Core i9-14900HX, NVIDIA GeForce RTX 4090 Laptop GPU (v6.92.6600, Overboost, Oasis)
139.6 fps -3%
Lenovo Legion Pro 7 RTX4090
Intel Core i9-13900HX, NVIDIA GeForce RTX 4090 Laptop GPU
136.4 fps -6%
SCHENKER XMG Neo 16 E23
Intel Core i9-13900HX, NVIDIA GeForce RTX 4090 Laptop GPU
133 fps -8%
Gemiddeld NVIDIA GeForce RTX 4090 Laptop GPU
  (77.8 - 166.2, n=46)
130.7 fps -10%
Lenovo Legion 9 16IRX9, RTX 4090
Intel Core i9-14900HX, NVIDIA GeForce RTX 4090 Laptop GPU
125.6 fps -13%
Gemiddelde van klas Gaming
  (32.8 - 166.2, n=192, laatste 2 jaar)
108.5 fps -25%
Alienware x16 R2 P120F
Intel Core Ultra 9 185H, NVIDIA GeForce RTX 4080 Laptop GPU
89.3 fps -38%
Cyberpunk 2077 2.1 Phantom Liberty
2560x1440 Ultra Preset (FSR off)
SCHENKER XMG Neo 16 (Early 24)
Intel Core i9-14900HX, NVIDIA GeForce RTX 4090 Laptop GPU (2.02, Overboost, Oasis)
96.8 (61.1min) fps +3%
SCHENKER XMG Neo 16 (Early 24)
Intel Core i9-14900HX, NVIDIA GeForce RTX 4090 Laptop GPU (2.02)
93.8 (53.7min) fps
Gemiddeld NVIDIA GeForce RTX 4090 Laptop GPU
  (68.1 - 103.9, n=19)
89.9 fps -4%
Medion Erazer Beast X40 2024
Intel Core i9-14900HX, NVIDIA GeForce RTX 4090 Laptop GPU (2.02)
87.5 (56.4min) fps -7%
Lenovo Legion 9 16IRX9, RTX 4090
Intel Core i9-14900HX, NVIDIA GeForce RTX 4090 Laptop GPU (2.12)
86 (70.4min) fps -8%
Razer Blade 16 2024, RTX 4090
Intel Core i9-14900HX, NVIDIA GeForce RTX 4090 Laptop GPU
83.39 (67.14min) fps -11%
Asus ROG Strix Scar 16 G634JZR
Intel Core i9-14900HX, NVIDIA GeForce RTX 4080 Laptop GPU (2.12)
77.6 (64min) fps -17%
Alienware x16 R2 P120F
Intel Core Ultra 9 185H, NVIDIA GeForce RTX 4080 Laptop GPU (2.02)
75.4 (25.4min) fps -20%
Gemiddelde van klas Gaming
  (24.8 - 110, n=72, laatste 2 jaar)
64.9 fps -31%
1920x1080 Ultra Preset (FSR off)
SCHENKER XMG Neo 16 (Early 24)
Intel Core i9-14900HX, NVIDIA GeForce RTX 4090 Laptop GPU (2.02, Overboost, Oasis)
133.1 (56.2min) fps +1%
SCHENKER XMG Neo 16 (Early 24)
Intel Core i9-14900HX, NVIDIA GeForce RTX 4090 Laptop GPU (2.02)
131.5 (62.2min) fps
Lenovo Legion 9 16IRX9, RTX 4090
Intel Core i9-14900HX, NVIDIA GeForce RTX 4090 Laptop GPU (2.12)
127 (70.6min) fps -3%
Asus ROG Strix Scar 16 G634JZR
Intel Core i9-14900HX, NVIDIA GeForce RTX 4080 Laptop GPU (2.12)
123.1 (100.1min) fps -6%
Gemiddeld NVIDIA GeForce RTX 4090 Laptop GPU
  (93.1 - 144.7, n=19)
120.8 fps -8%
Medion Erazer Beast X40 2024
Intel Core i9-14900HX, NVIDIA GeForce RTX 4090 Laptop GPU (2.02)
118.9 (49.7min) fps -10%
Alienware x16 R2 P120F
Intel Core Ultra 9 185H, NVIDIA GeForce RTX 4080 Laptop GPU (2.02)
99.7 (13.5min) fps -24%
Razer Blade 16 2024, RTX 4090
Intel Core i9-14900HX, NVIDIA GeForce RTX 4090 Laptop GPU
95.35 (70.51min) fps -27%
Gemiddelde van klas Gaming
  (6.76 - 144.7, n=82, laatste 2 jaar)
86.5 fps -34%
1920x1080 Ray Tracing Ultra Preset (DLSS off)
SCHENKER XMG Neo 16 (Early 24)
Intel Core i9-14900HX, NVIDIA GeForce RTX 4090 Laptop GPU (2.02, Overboost, Oasis)
77.7 (39.8min) fps +3%
SCHENKER XMG Neo 16 (Early 24)
Intel Core i9-14900HX, NVIDIA GeForce RTX 4090 Laptop GPU (2.02)
75.5 (49.8min) fps
Gemiddeld NVIDIA GeForce RTX 4090 Laptop GPU
  (65.5 - 77.7, n=11)
72.2 fps -4%
Medion Erazer Beast X40 2024
Intel Core i9-14900HX, NVIDIA GeForce RTX 4090 Laptop GPU (2.02)
68.3 (47.6min) fps -10%
Asus ROG Strix Scar 16 G634JZR
Intel Core i9-14900HX, NVIDIA GeForce RTX 4080 Laptop GPU (2.12)
62.4 (54.1min) fps -17%
Alienware x16 R2 P120F
Intel Core Ultra 9 185H, NVIDIA GeForce RTX 4080 Laptop GPU (2.02)
58.4 (15.2min) fps -23%
Gemiddelde van klas Gaming
  (11.9 - 77.7, n=55, laatste 2 jaar)
45.5 fps -40%
F1 24
1920x1080 Ultra High Preset AA:T AF:16x
SCHENKER XMG Neo 16 (Early 24)
Intel Core i9-14900HX, NVIDIA GeForce RTX 4090 Laptop GPU (1119215)
127 (78min, 90P1) fps
XMG Neo 16 E23
Intel Core i9-13900HX, NVIDIA GeForce RTX 4090 Laptop GPU
120 (77min) fps -6%
Lenovo Legion 9 16IRX9, RTX 4090
Intel Core i9-14900HX, NVIDIA GeForce RTX 4090 Laptop GPU (1118244)
113.6 (14min, 69P1) fps -11%
Gemiddeld NVIDIA GeForce RTX 4090 Laptop GPU
  (88 - 127, n=4)
112.2 fps -12%
Gemiddelde van klas Gaming
  (54.1 - 127, n=14, laatste 2 jaar)
78.2 fps -38%
2560x1440 Ultra High Preset AA:T AF:16x
SCHENKER XMG Neo 16 (Early 24)
Intel Core i9-14900HX, NVIDIA GeForce RTX 4090 Laptop GPU (1119215)
84.7 (69min, 68P1) fps
XMG Neo 16 E23
Intel Core i9-13900HX, NVIDIA GeForce RTX 4090 Laptop GPU
79 (63min) fps -7%
Gemiddeld NVIDIA GeForce RTX 4090 Laptop GPU
  (58.5 - 84.7, n=4)
73.6 fps -13%
Lenovo Legion 9 16IRX9, RTX 4090
Intel Core i9-14900HX, NVIDIA GeForce RTX 4090 Laptop GPU (1118244)
72.1 (2min, 56P1) fps -15%
Gemiddelde van klas Gaming
  (36.7 - 84.7, n=12, laatste 2 jaar)
55.8 fps -34%
2560x1440 Ultra High Preset + Quality DLSS AF:16x
SCHENKER XMG Neo 16 (Early 24)
Intel Core i9-14900HX, NVIDIA GeForce RTX 4090 Laptop GPU (1119215)
129.5 (76min, 87P1) fps
Gemiddeld NVIDIA GeForce RTX 4090 Laptop GPU
  (88.3 - 129.5, n=2)
108.9 fps -16%
Gemiddelde van klas Gaming
  (59.2 - 129.5, n=9, laatste 2 jaar)
78.4 fps -39%
Senua's Saga Hellblade 2
1920x1080 High Preset
SCHENKER XMG Neo 16 (Early 24)
Intel Core i9-14900HX, NVIDIA GeForce RTX 4090 Laptop GPU
78.8 (51min, 56.6P0.1, 64.4P1) fps
Gemiddeld NVIDIA GeForce RTX 4090 Laptop GPU
  (74 - 78.8, n=2)
76.4 fps -3%
XMG Neo 16 E23
Intel Core i9-13900HX, NVIDIA GeForce RTX 4090 Laptop GPU
74 (31.1min, 50.5P0.1, 62.7P1) fps -6%
Gemiddelde van klas Gaming
  (38.4 - 78.8, n=6, laatste 2 jaar)
51.6 fps -35%
2560x1440 High Preset
SCHENKER XMG Neo 16 (Early 24)
Intel Core i9-14900HX, NVIDIA GeForce RTX 4090 Laptop GPU
57.3 (43min, 46.4P0.1, 50.4P1) fps
Gemiddeld NVIDIA GeForce RTX 4090 Laptop GPU
  (51.8 - 57.3, n=2)
54.6 fps -5%
XMG Neo 16 E23
Intel Core i9-13900HX, NVIDIA GeForce RTX 4090 Laptop GPU
51.8 (36.2min, 41.4P0.1, 46.1P1) fps -10%
Gemiddelde van klas Gaming
  (27.1 - 57.3, n=4, laatste 2 jaar)
39.6 fps -31%
2560x1440 High Preset + Quality DLSS
SCHENKER XMG Neo 16 (Early 24)
Intel Core i9-14900HX, NVIDIA GeForce RTX 4090 Laptop GPU
83.1 (40.3min, 63.5P0.1, 72.6P1) fps
Gemiddeld NVIDIA GeForce RTX 4090 Laptop GPU
  ()
83.1 fps 0%
Gemiddelde van klas Gaming
  (42.2 - 83.1, n=3, laatste 2 jaar)
57.7 fps -31%
Horizon Forbidden West
1920x1080 Very High Preset AA:T
SCHENKER XMG Neo 16 (Early 24)
Intel Core i9-14900HX, NVIDIA GeForce RTX 4090 Laptop GPU
125.2 (73.2min, 82.8P0.1, 91.6P1) fps
Gemiddeld NVIDIA GeForce RTX 4090 Laptop GPU
  (81 - 125.2, n=3)
100 fps -20%
Gemiddelde van klas Gaming
  (14.7 - 125.2, n=10, laatste 2 jaar)
66.7 fps -47%
2560x1440 Very High Preset AA:T
SCHENKER XMG Neo 16 (Early 24)
Intel Core i9-14900HX, NVIDIA GeForce RTX 4090 Laptop GPU
98 (65.7min, 67.6P0.1, 76.8P1) fps
Gemiddeld NVIDIA GeForce RTX 4090 Laptop GPU
  (66 - 98, n=3)
79.7 fps -19%
Gemiddelde van klas Gaming
  (24.1 - 98, n=9, laatste 2 jaar)
57.1 fps -42%
Alone in the Dark
1920x1080 Cinematic Preset
SCHENKER XMG Neo 16 (Early 24)
Intel Core i9-14900HX, NVIDIA GeForce RTX 4090 Laptop GPU
189.9 (28.2min, 84.5P0.1, 113.6P1) fps
Gemiddeld NVIDIA GeForce RTX 4090 Laptop GPU
  (141 - 189.9, n=2)
165.5 fps -13%
Gemiddelde van klas Gaming
  (13.6 - 189.9, n=6, laatste 2 jaar)
126.3 fps -33%
2560x1440 Cinematic Preset
SCHENKER XMG Neo 16 (Early 24)
Intel Core i9-14900HX, NVIDIA GeForce RTX 4090 Laptop GPU
133.6 (25.7min, 66.5P0.1, 87.2P1) fps
Gemiddeld NVIDIA GeForce RTX 4090 Laptop GPU
  (99 - 133.6, n=2)
116.3 fps -13%
Gemiddelde van klas Gaming
  (64.7 - 133.6, n=4, laatste 2 jaar)
91.6 fps -31%
Alan Wake 2
1920x1080 High Preset
SCHENKER XMG Neo 16 (Early 24)
Intel Core i9-14900HX, NVIDIA GeForce RTX 4090 Laptop GPU
123.3 (50.5min, 68.4P0.1, 84.1P1) fps
Gemiddeld NVIDIA GeForce RTX 4090 Laptop GPU
  (108.6 - 124.7, n=6)
118.1 fps -4%
Razer Blade 16 2024, RTX 4090
Intel Core i9-14900HX, NVIDIA GeForce RTX 4090 Laptop GPU
108.6 (26.3P0.1, 67P1) fps -12%
Gemiddelde van klas Gaming
  (17.1 - 123.3, n=18, laatste 2 jaar)
70.8 fps -43%
2560x1440 High Preset
SCHENKER XMG Neo 16 (Early 24)
Intel Core i9-14900HX, NVIDIA GeForce RTX 4090 Laptop GPU
87.1 (51.7min, 55.3P0.1, 66.2P1) fps
Gemiddeld NVIDIA GeForce RTX 4090 Laptop GPU
  (78.4 - 87.1, n=6)
82.9 fps -5%
Razer Blade 16 2024, RTX 4090
Intel Core i9-14900HX, NVIDIA GeForce RTX 4090 Laptop GPU
78.4 (17P0.1, 52.8P1) fps -10%
Gemiddelde van klas Gaming
  (22.5 - 87.1, n=13, laatste 2 jaar)
62 fps -29%
1920x1080 High Preset + High Ray Tracing
Gemiddeld NVIDIA GeForce RTX 4090 Laptop GPU
  (60.3 - 70.3, n=2)
65.3 fps +8%
SCHENKER XMG Neo 16 (Early 24)
Intel Core i9-14900HX, NVIDIA GeForce RTX 4090 Laptop GPU
60.3 (38.8min, 40.2P0.1, 46.9P1) fps
Gemiddelde van klas Gaming
  (42.9 - 60.3, n=2, laatste 2 jaar)
51.6 fps -14%

We hebben Witcher 3 gebruikt om de stabiliteit van de framerate te controleren: Het spel (maximale instellingen, FHD) liep ongeveer 1 uur, het spelkarakter werd niet bewogen en we hebben geen dips in de framerate waargenomen.

Witcher 3 FPS diagram

0153045607590105120135150165180195210Tooltip
SCHENKER XMG Neo 16 (Early 24) i9-14900HX, NVIDIA GeForce RTX 4090 Laptop GPU: Ø204 (195-211)
Razer Blade 16 2024, RTX 4090 i9-14900HX, NVIDIA GeForce RTX 4090 Laptop GPU: Ø192.6 (177-211)
Medion Erazer Beast X40 2024 i9-14900HX, NVIDIA GeForce RTX 4090 Laptop GPU: Ø190.8 (167-207)
SCHENKER XMG Neo 16 E23 i9-13900HX, NVIDIA GeForce RTX 4090 Laptop GPU: Ø205 (192-219)
SCHENKER XMG Neo 16 (Early 24) i9-14900HX, NVIDIA GeForce RTX 4090 Laptop GPU; Overboost, Oasis: Ø206 (193-218)
Lenovo Legion Pro 7 RTX4090 i9-13900HX, NVIDIA GeForce RTX 4090 Laptop GPU: Ø196 (185-206)
Alienware x16 R2 P120F Ultra 9 185H, NVIDIA GeForce RTX 4080 Laptop GPU: Ø154.7 (132-167)
Asus ROG Strix Scar 16 G634JZR i9-14900HX, NVIDIA GeForce RTX 4080 Laptop GPU: Ø178.8 (173-185)
Lenovo Legion 9 16IRX9, RTX 4090 i9-14900HX, NVIDIA GeForce RTX 4090 Laptop GPU: Ø195.6 (67-209)
Witcher 3 (Overboost)
Witcher 3 (Overboost, Oasis)
lagegem.hogeultraQHD DLSSQHD FSRQHD
GTA V (2015) 187.6 187.4 185.7 159.3 156
The Witcher 3 (2015) 643 562.3 412.7 214 169.4
Dota 2 Reborn (2015) 248 221 210 194.6
Final Fantasy XV Benchmark (2018) 233 225 196.9 162.5
X-Plane 11.11 (2018) 208 184.2 144.5
Far Cry 5 (2018) 194 184 172 156
Strange Brigade (2018) 579 444 397 403 305
Cyberpunk 2077 2.1 Phantom Liberty (2023) 168.5 157.8 138 131.5 93.8
Alan Wake 2 (2023) 128.5 128 123.3 87.1
Alone in the Dark (2024) 219 217 216 189.9 133.6
Horizon Forbidden West (2024) 165.4 160.5 126.2 125.2 98
Senua's Saga Hellblade 2 (2024) 122.3 103.3 78.8 83.1 82.1 57.3
F1 24 (2024) 346 369 302 127 84.7

Uitstoot - De XMG-laptop heeft emissies die specifiek zijn voor een bepaalde klasse

Geluidsemissies

Geluidsniveaus tot 56 dB(A) zijn mogelijk, maar bij gaming is dit cijfer iets lager (Overboost). Met "Balanced" kan een aanzienlijk lager geluidsniveau worden bereikt - ten koste van de prestaties. Gaming zou mogelijk zijn. Bij alledaags gebruik (kantoor, internet) en als de computer niet actief is, doet hij over het algemeen zijn werk in stilte - ongeacht de actieve prestatiemodus.

Het gebruik van de externe waterkoeling veroorzaakt enige geluidsproductie: De pomp werkt erg stil en de ventilatoren vallen veel meer op. Subjectief gezien vinden we het geluidsniveau bij gebruik van de externe waterkoeling aangenamer, maar niet per se stiller.

Af en toe komt er elektronisch gekraak uit de laptop - bijvoorbeeld tijdens de Diskspd test. Vermoedelijk komt dit door de SSD.

Geluidsniveau

Onbelast
28 / 29 / 31 dB (A)
Belasting
51 / 56 dB (A)
  red to green bar
 
 
30 dB
stil
40 dB(A)
hoorbaar
50 dB(A)
luid
 
min: dark, med: mid, max: light   Earthworks M23R, Arta (15 cm afstand)   omgevingslawaai: 26 dB(A)
dB(A) 0102030405060708090Deep BassMiddle BassHigh BassLower RangeMidsHigher MidsLower HighsMid HighsUpper HighsSuper Highs2035.535.635.738.135.52532.333.531.232.833.93144.344.642.844.1424029.928.126.127.831.95039.222.923.320.533.26336.22827.226.435.78033.320.419.817.435.31004627.323.721.531.412530.921.120.218.429.216029.620.121.219.230.620030.623.722.722.232.725031.621.922.419.133.531531.119.21917.534.540033.519.417.91637.350035.819.218.315.538.363036.919.716.913.439.980037.917.816.11242.1100038.818.715.713.242.4125041.519.716.312.845.3160041.719.315.91445.8200041.518.617.513.345.9250041.517.515.312.845.5315041.316.515.513.146.1400039.217.616.813.243.8500037.415.214.61341.4630036.814.116.713.543.2800032.114.615.813.938.51000029.814.915.914.436.61250027.515.916.11334.61600022.31515.112.529.1SPL51.43028.625.955.7N7.81.31.10.810.3median 36.8median 18.7median 16.7median 13.5median 38.5Delta4.52.11.325.3hearing rangehide median Fan NoiseSCHENKER XMG Neo 16 (Early 24)
SCHENKER XMG Neo 16 (Early 24)
NVIDIA GeForce RTX 4090 Laptop GPU, i9-14900HX, Samsung 990 Pro 1 TB
Razer Blade 16 2024, RTX 4090
NVIDIA GeForce RTX 4090 Laptop GPU, i9-14900HX, Samsung PM9A1 MZVL22T0HBLB
Medion Erazer Beast X40 2024
NVIDIA GeForce RTX 4090 Laptop GPU, i9-14900HX, Phison E18-1TB-PHISON-SSD-BICS5
Asus ROG Strix Scar 17 G733PYV-LL053X
NVIDIA GeForce RTX 4090 Laptop GPU, R9 7945HX3D, SK hynix PC801 HFS001TEJ9X101N
SCHENKER XMG Neo 16 E23
NVIDIA GeForce RTX 4090 Laptop GPU, i9-13900HX, Crucial P5 Plus 1TB CT1000P5PSSD8
Noise
14%
3%
3%
-12%
uit / omgeving *
26
23
12%
25
4%
23
12%
25
4%
Idle Minimum *
28
23
18%
28
-0%
23
18%
31
-11%
Idle Average *
29
23
21%
29
-0%
27.7
4%
33
-14%
Idle Maximum *
31
27.66
11%
32
-3%
34.7
-12%
42
-35%
Load Average *
51
43.76
14%
48
6%
53.4
-5%
58
-14%
Witcher 3 ultra *
54
46.81
13%
50
7%
53.4
1%
57
-6%
Load Maximum *
56
50.37
10%
52
7%
53.4
5%
59
-5%

* ... kleiner is beter

Temperatuur

De laptop warmt merkbaar op onder belasting (stresstest en Witcher 3 test): Op sommige plekken komt de temperatuur soms boven de 50 °C. Op de palmsteun blijven de temperaturen echter op een gematigd niveau. Bij dagelijks gebruik (kantoor, internet) liggen de cijfers in de groene zone.

De Witcher 3 test benadrukt het effect van de optionele waterkoeling: De GPU-temperatuur verschilt met ongeveer 17 °C (80,7 °C vs. 63,4 °C).

Max. Belasting
 45 °C47 °C46 °C 
 44 °C45 °C44 °C 
 29 °C31 °C30 °C 
Maximum: 47 °C
Gemiddelde: 40.1 °C
54 °C55 °C56 °C
50 °C50 °C44 °C
29 °C31 °C34 °C
Maximum: 56 °C
Gemiddelde: 44.8 °C
Stroomadapter (max.)  57 °C | Kamertemperatuur 21 °C | Fluke t3000FC (calibrated), Voltcraft IR-900
(-) De gemiddelde temperatuur voor de bovenzijde bij maximale belasting bedraagt 40.1 °C / 104 F, vergeleken met het gemiddelde van 33.9 °C / ###class_avg_f## F voor de apparaten van de klasse Gaming.
(-) De maximumtemperatuur aan de bovenzijde bedraagt 47 °C / 117 F, vergeleken met het gemiddelde van 40.5 °C / 105 F, variërend van 21.2 tot 68.8 °C voor de klasse Gaming.
(-) De bodem warmt op tot een maximum van 56 °C / 133 F, vergeleken met een gemiddelde van 43.2 °C / 110 F
(+) Bij onbelast gebruik bedraagt de gemiddelde temperatuur voor de bovenzijde 26 °C / 79 F, vergeleken met het apparaatgemiddelde van 33.9 °C / 93 F.
(-) Bij het spelen van The Witcher 3 is de gemiddelde temperatuur voor de bovenzijde 42.4 °C / 108 F, vergeleken met het apparaatgemiddelde van 33.9 °C / 93 F.
(+) De handpalmsteunen en het touchpad bereiken maximaal de huidtemperatuur (35 °C / 95 F) en zijn dus niet heet.
(-) De gemiddelde temperatuur van de handpalmsteun van soortgelijke toestellen bedroeg 28.9 °C / 84 F (-6.1 °C / -11 F).
SCHENKER XMG Neo 16 (Early 24)
Intel Core i9-14900HX, NVIDIA GeForce RTX 4090 Laptop GPU
Razer Blade 16 2024, RTX 4090
Intel Core i9-14900HX, NVIDIA GeForce RTX 4090 Laptop GPU
Medion Erazer Beast X40 2024
Intel Core i9-14900HX, NVIDIA GeForce RTX 4090 Laptop GPU
Asus ROG Strix Scar 17 G733PYV-LL053X
AMD Ryzen 9 7945HX3D, NVIDIA GeForce RTX 4090 Laptop GPU
SCHENKER XMG Neo 16 E23
Intel Core i9-13900HX, NVIDIA GeForce RTX 4090 Laptop GPU
Heat
2%
-7%
8%
1%
Maximum Upper Side *
47
45
4%
47
-0%
40.1
15%
50
-6%
Maximum Bottom *
56
45
20%
54
4%
46.7
17%
51
9%
Idle Upper Side *
27
29
-7%
30
-11%
26.5
2%
28
-4%
Idle Bottom *
27
30
-11%
32
-19%
27.7
-3%
26
4%

* ... kleiner is beter

Stresstest

Het extreme scenario van de stresstest (Prime95 en Furmark in continubedrijf) controleert de stabiliteit van het systeem onder volledige belasting. De CPU-snelheid daalt binnen de eerste minuut van de test van ongeveer 4,3 tot 4,5 GHz (P) en 3,5 tot 3,6 GHz (E) naar 2,5 GHz (P) en 2,3 GHz (E). Tegelijkertijd neemt de snelheid van de GPU toe van een startpunt van 1.600 MHz tot meer dan 2.000 MHz.

Furmark &amp; Prime95
Witcher 3
Witcher 3
Witcher 3
Witcher 3
Witcher 3
Witcher 3

Luidsprekers

De stereoluidsprekers missen bas. Afgezien daarvan produceren ze meestal wel fatsoenlijk geluid. U kunt een betere kwaliteit krijgen door een hoofdtelefoon of externe luidsprekers te gebruiken.

dB(A) 0102030405060708090Deep BassMiddle BassHigh BassLower RangeMidsHigher MidsLower HighsMid HighsUpper HighsSuper Highs2038.136.52532.836.83144.146.54027.830.55020.533.66326.4328017.438.710021.549.812518.447.616019.255.420022.260.825019.163.231517.561.74001664.550015.570.963013.475.28001275.1100013.275.6125012.875.916001475.6200013.373.2250012.873.1315013.174.7400013.273.250001377.8630013.574.9800013.972.71000014.465.3125001360.61600012.555.5SPL25.986.4N0.871.1median 13.5median 72.7Delta27.13032.83030.931.430.935.742.935.723.728.123.726.219.726.231.216.431.245.113.845.145.919.845.951.414.551.45913.95964.117.864.168.614.368.667.19.667.167.68.567.672.97.572.977.47.477.4717.77164.88.164.865.88.265.867.58.867.568.89.868.868.710.568.77010.67066.410.966.467.311.267.36411.56464.711.664.767126763.211.863.25510.75581.222.581.254.70.454.7median 67median 10.7median 673.62.53.6hearing rangehide median Pink NoiseSCHENKER XMG Neo 16 (Early 24)Razer Blade 16 2024, RTX 4090
Frequentiediagram (selectievakjes kunnen worden aan- en uitgezet om toestellen te vergelijken)
SCHENKER XMG Neo 16 (Early 24) audioanalyse

(+) | luidsprekers kunnen relatief luid spelen (86 dB)
Bas 100 - 315 Hz
(-) | bijna geen lage tonen - gemiddeld 16.3% lager dan de mediaan
(±) | lineariteit van de lage tonen is gemiddeld (8.6% delta ten opzichte van de vorige frequentie)
Midden 400 - 2000 Hz
(+) | evenwichtige middens - slechts 3% verwijderd van de mediaan
(+) | de middentonen zijn lineair (3.6% delta ten opzichte van de vorige frequentie)
Hoog 2 - 16 kHz
(+) | evenwichtige hoogtepunten - slechts 2.5% verwijderd van de mediaan
(+) | de hoge tonen zijn lineair (4.9% delta naar de vorige frequentie)
Algemeen 100 - 16.000 Hz
(+) | het totale geluid is lineair (12.4% verschil met de mediaan)
Vergeleken met dezelfde klasse
» 14% van alle geteste apparaten in deze klasse waren beter, 3% vergelijkbaar, 83% slechter
» De beste had een delta van 6%, het gemiddelde was 18%, de slechtste was 132%
Vergeleken met alle geteste toestellen
» 9% van alle geteste apparaten waren beter, 2% gelijk, 89% slechter
» De beste had een delta van 4%, het gemiddelde was 25%, de slechtste was 134%

Razer Blade 16 2024, RTX 4090 audioanalyse

(±) | luidspreker luidheid is gemiddeld maar goed (81.16 dB)
Bas 100 - 315 Hz
(±) | verminderde zeebaars - gemiddeld 8.2% lager dan de mediaan
(±) | lineariteit van de lage tonen is gemiddeld (7.4% delta ten opzichte van de vorige frequentie)
Midden 400 - 2000 Hz
(+) | evenwichtige middens - slechts 3.3% verwijderd van de mediaan
(+) | de middentonen zijn lineair (5.9% delta ten opzichte van de vorige frequentie)
Hoog 2 - 16 kHz
(+) | evenwichtige hoogtepunten - slechts 1.6% verwijderd van de mediaan
(+) | de hoge tonen zijn lineair (3.1% delta naar de vorige frequentie)
Algemeen 100 - 16.000 Hz
(+) | het totale geluid is lineair (9.2% verschil met de mediaan)
Vergeleken met dezelfde klasse
» 3% van alle geteste apparaten in deze klasse waren beter, 1% vergelijkbaar, 96% slechter
» De beste had een delta van 6%, het gemiddelde was 18%, de slechtste was 132%
Vergeleken met alle geteste toestellen
» 3% van alle geteste apparaten waren beter, 1% gelijk, 97% slechter
» De beste had een delta van 4%, het gemiddelde was 25%, de slechtste was 134%

Energiebeheer - De Schenker Neo heeft een behoorlijke batterijlevensduur

Stroomverbruik

Het stroomverbruik ligt op een normaal niveau voor de geïnstalleerde hardware die we hier hebben. De Witcher 3 test en stresstest liepen met licht dalend stroomverbruik. De PSU (330 watt) is voldoende groot.

Stroomgebruik
Uit / Standbydarklight 0.1 /  Watt
Inactiefdarkmidlight 6 / 16 / 28 Watt
Belasting midlight 130 / 361 Watt
 color bar
Key: min: dark, med: mid, max: light        Metrahit Energy
SCHENKER XMG Neo 16 (Early 24)
i9-14900HX, NVIDIA GeForce RTX 4090 Laptop GPU, Samsung 990 Pro 1 TB, IPS, 2560x1600, 16"
Razer Blade 16 2024, RTX 4090
i9-14900HX, NVIDIA GeForce RTX 4090 Laptop GPU, Samsung PM9A1 MZVL22T0HBLB, OLED, 2560x1600, 16"
Medion Erazer Beast X40 2024
i9-14900HX, NVIDIA GeForce RTX 4090 Laptop GPU, Phison E18-1TB-PHISON-SSD-BICS5, IPS, 2560x1600, 17"
Asus ROG Strix Scar 17 G733PYV-LL053X
R9 7945HX3D, NVIDIA GeForce RTX 4090 Laptop GPU, SK hynix PC801 HFS001TEJ9X101N, IPS, 2560x1440, 17.3"
SCHENKER XMG Neo 16 E23
i9-13900HX, NVIDIA GeForce RTX 4090 Laptop GPU, Crucial P5 Plus 1TB CT1000P5PSSD8, IPS, 2560x1600, 16"
Gemiddelde van klas Gaming
 
Power Consumption
-22%
-1%
-23%
-9%
-19%
Idle Minimum *
6
16.9
-182%
7
-17%
15.4
-157%
8
-33%
Idle Average *
16
17.8
-11%
15
6%
21.6
-35%
18
-13%
Idle Maximum *
28
19.6
30%
33
-18%
22.2
21%
28
-0%
Load Average *
130
128
2%
134
-3%
116.7
10%
133
-2%
Witcher 3 ultra *
302
243
20%
280
7%
262
13%
294
3%
Load Maximum *
361
328
9%
294
19%
327.1
9%
399
-11%

* ... kleiner is beter

Power consumption Witcher 3 / stress test

020406080100120140160180200220240260280300320340Tooltip
SCHENKER XMG Neo 16 (Early 24); Witcher 3 ultra: Ø302 (250-321)
SCHENKER XMG Neo 16 (Early 24); 1280x720 Prime95 28.10 and Furmark 1.25: Ø298 (280-349)
SCHENKER XMG Neo 16 (Early 24); Idle 150cd/m2: Ø16.5 (6.12-27.9)

Power consumption with an external monitor

020406080100120140160180200220240260280300Tooltip
SCHENKER XMG Neo 16 (Early 24); Prime95 V2810 Stress (external Monitor): Ø194.9 (175.3-205)
SCHENKER XMG Neo 16 (Early 24); Cinebench R23 Multi (external Monitor): Ø288 (258-296)
SCHENKER XMG Neo 16 (Early 24); 1280x720 FurMark 1.19 GPU Stress Test (external Monitor): Ø232 (216-240)
SCHENKER XMG Neo 16 (Early 24); 1920x1080 The Witcher 3 ultra (external Monitor): Ø297 (280-309)
SCHENKER XMG Neo 16 (Early 24); Idle 1min (external Monitor): Ø23.4 (21.8-29.1)

Levensduur batterij

In de Wi-Fi- en videotests (het laden van websites met behulp van een script en de korte Big Buck Bunny (H.264 codering, FHD) video in een loop), haalde de 16-inch machine runtimes van 5 uur 50 minuten en 6 uur 58 minuten. Al met al zijn dit behoorlijke cijfers.

De batterij heeft een capaciteit van 99,8 Wh.
Batterijduur
Inactief (zonder WLAN, minimale helderheid)
10h 00min
WiFi Websurfing (Edge 125)
5h 50min
Big Buck Bunny H.264 1080p
6h 58min
Belast (maximale helderheid)
2h 02min
SCHENKER XMG Neo 16 (Early 24)
i9-14900HX, NVIDIA GeForce RTX 4090 Laptop GPU, 99.8 Wh
Razer Blade 16 2024, RTX 4090
i9-14900HX, NVIDIA GeForce RTX 4090 Laptop GPU, 95.2 Wh
Medion Erazer Beast X40 2024
i9-14900HX, NVIDIA GeForce RTX 4090 Laptop GPU, 99.8 Wh
Asus ROG Strix Scar 17 G733PYV-LL053X
R9 7945HX3D, NVIDIA GeForce RTX 4090 Laptop GPU, 90 Wh
SCHENKER XMG Neo 16 E23
i9-13900HX, NVIDIA GeForce RTX 4090 Laptop GPU, 99 Wh
Gemiddelde van klas Gaming
 
Batterijduur
-11%
7%
-34%
-2%
-7%
Reader / Idle
600
H.264
418
456
9%
302
-28%
349
-17%
WiFi v1.3
350
329
-6%
374
7%
287
-18%
399
14%
Load
122
79
-35%
55
-55%
Witcher 3 ultra
84

Pro

+ helder, 16:10, QHD+ beeldscherm (240 Hz, G-Sync)
+ hoge systeemprestaties
+ twee SSD-sleuven (PCIe 4, M.2 2280)
+ RAM verwisselbaar/uitbreidbaar
+ Individuele RGB-toetsverlichting
+ Thunderbolt 4
+ Voeding
+ stabiele metalen behuizing
+ Geavanceerde Optimus
+ vloeibare metalen thermische pasta
+ optionele waterkoeling

Contra

- de kleurruimtedekking zou groter kunnen zijn
- hoge emissies bij volle belasting
- af en toe elektronisch gekraak in het interieur

Verdict - Een hoogwaardige vuurbal

De XMG Neo 16 (Early 24) werd geleverd door Schenker.

De Neo 16 doet wat hij belooft: Hardware (Core i9, RTX 4090) van het hoogste niveau maakt videobewerking, rendering, streaming en natuurlijk QHD-gaming mogelijk. De verwachte hoge emissies kunnen tot een gematigder niveau worden teruggebracht door de juiste prestatiemodus te selecteren.

Met de XMG Neo 16 (Early 24) levert Schenker veel vermogen in een compacte vormfactor.

Iedereen die op zoek is naar een compromisloze oplossing zal moeten grijpen naar de optioneel verkrijgbare externe waterkoeling (230 dollar): Dit zorgt voor een kleine prestatieverhoging en een lagere uitstoot. Dit gezegd hebbende, de laptop is dan gebonden aan een vaste locatie.

Het matte 16-inch 16:10 beeldscherm (2.560 x 1.600 pixels, sRGB, IPS, 240 Hz) maakt over het algemeen een goede indruk, waarbij vooral de hoge helderheid een prettig punt is. Er is wat ruimte voor verbetering als het gaat om het contrast en de kleurruimtedekking. Twee SSD-sleuven (PCIe 4) inclusief RAID 0/1 ondersteuning zorgen voor veel opslagruimte en korte laadtijden.

Een enkele batterijlading (99,8 Wh) is voldoende voor een werkingsduur van ongeveer 6 tot 7 uur - behoorlijke cijfers. Positief: De batterij kan worden opgeladen via een USB-C lader (100 watt, 20 V, 5 A) - de TB4 poort ondersteunt Power Delivery, wat betekent dat de PSU (330 watt) theoretisch thuis kan blijven.

Een alternatief zou de Razer Blade 16 (2024). Deze computer biedt iets minder rekenkracht, maar heeft in tegenstelling tot de Neo een hoger contrast en een levendiger OLED-scherm aan boord.

Prijs en beschikbaarheid

De XMG Neo 16 (Early 24) kan individueel worden geconfigureerd en gekocht in de Schenker online winkel (Duits) en de prijzen zijn de wisselkoers dollar/euro op het moment van testen. Ons reviewmodel kost ongeveer 4.000 dollar. Instapmodellen (met een RTX 4060) beginnen rond de $2.000. Schenker heeft aangegeven dat ze eind juni (RTX 4090) en midden juli (RTX 4060/70/80) beschikbaar zullen zijn. Voor de optionele waterkoeling betaalt u ongeveer 230 dollar.

SCHENKER XMG Neo 16 (Early 24) - 19-06-2024 v8
Sascha Mölck

Behuizing
85 / 98 → 87%
Toetsenbord
85%
Aanwijsapparaat
86%
Aansluitmogelijkheden
70 / 80 → 87%
Gewicht
60 / 10-68 → 86%
Batterij
68 / 95 → 71%
Beeldscherm
84%
Gaming-performance
92%
Applicatie-performance
93%
AI Performance
100%
Temperatuur
81 / 95 → 86%
Luidheid
62 / 90 → 69%
Audio
84%
Camera
41 / 75 → 55%
Gemiddelde
63%
86%
Gaming - Gewogen Gemiddelde
CO2 Emissions
No Data
Materials
0%
Packaging
25%
Power Use
80.6%
Repairability
65%
Software Updates
22.3%
Recycle Logo Total Sustainability Score: 32.2%

Transparantie

De selectie van te beoordelen apparaten wordt gemaakt door onze redactie. Het testexemplaar werd ten behoeve van deze beoordeling door de fabrikant of detailhandelaar in bruikleen aan de auteur verstrekt. De kredietverstrekker had geen invloed op deze recensie, noch ontving de fabrikant vóór publicatie een exemplaar van deze recensie. Er bestond geen verplichting om deze recensie te publiceren. Wij accepteren nooit een compensatie of betaling in ruil voor onze beoordelingen. Als onafhankelijk mediabedrijf is Notebookcheck niet onderworpen aan het gezag van fabrikanten, detailhandelaren of uitgevers.

[transparency_disclaimer]

Dit is hoe Notebookcheck test

Elk jaar beoordeelt Notebookcheck onafhankelijk honderden laptops en smartphones met behulp van gestandaardiseerde procedures om ervoor te zorgen dat alle resultaten vergelijkbaar zijn. We hebben onze testmethoden al zo'n 20 jaar voortdurend ontwikkeld en daarbij de industriestandaard bepaald. In onze testlaboratoria wordt gebruik gemaakt van hoogwaardige meetapparatuur door ervaren technici en redacteuren. Deze tests omvatten een validatieproces in meerdere fasen. Ons complexe beoordelingssysteem is gebaseerd op honderden goed onderbouwde metingen en benchmarks, waardoor de objectiviteit behouden blijft. Meer informatie over onze testmethoden kunt u hier vinden.

Price comparison

Please share our article, every link counts!
Mail Logo
> Overzichten en testrapporten over laptops en mobieltjes > Testrapporten > XMG Neo 16 (Early 24) beoordeling: Volledige RTX 4090-kracht in een compacte gaminglaptop
Sascha Mölck, 2024-06-25 (Update: 2024-06-25)