


Dell Pro 13 Premium test: De bijna perfecte zakelijke laptop
De "Promium" laptop.
We grijpen deze gelegenheid aan om de 13-inch zakelijke laptop in de productlijn van Dell te reviewen. De Dell Pro 13 Premium is gericht op veeleisende zakelijke gebruikers en is ontworpen om ondernemers aan te spreken met zijn moderne poorten. De laptop heeft een stevig maar lichtgewicht magnesium chassis, AI en heeft ook een zeer lange batterijduur.Christian Hintze, 👁 Christian Hintze (vertaald door DeepL / Ninh Duy) Gepubliceerd 🇺🇸 🇩🇪 ...
Verdict - Een bijna complete zakelijke laptop
De Dell Pro 13 Premium is een geweldige zakelijke laptop met vrijwel geen zwakke punten, maar wel veel positieve functies die deze mobiele laptop onze award opleveren. Zakelijke werknemers en andere potentiële kopers krijgen een compacte, kleine, lichtgewicht, zuinige, extreem lang werkende (24 uur!) en krachtige laptop met een magnesium chassis van hoge kwaliteit, een 8 MP webcam met hoge resolutie en moderne interfaces zoals dual Thunderbolt 4 en Wi-Fi 7. Bovendien blijft de laptop in vrijwel elke situatie constant koel.
Daar hangt echter wel een prijskaartje aan: de laptop kost maar liefst $1.900 tot $2.500! Als u dat in gedachten houdt, is de kreupele M.2 2230 SSD bijna schandalig, maar in alledaagse situaties zult u het verschil nauwelijks merken. De enige gebieden waar verbeteringen nodig zijn, zijn de naam en de upgradebaarheid.
Pro
Contra
Prijs en beschikbaarheid
Ons reviewmodel wordt geleverd met een FHD+ beeldscherm en kost ongeveer $2.100 in de online winkel van Dell.
- $29.99Smatree Hard EVA Protective Sleeve Compatible for 13.3 inch Dell Pro 13 Premium (PA13250), for 13 inch DELL Latitude 7350/7320 Detachable, for 12 inch DELL Latitude 7230 Rugged Extreme Tablet (X8016)
- $49.99Smatree 13 inch Laptop Sleeve for DELL Pro 13 Premium PA13250, Protective Laptop Case with Accessory Pocket, YKK Zipper, Patented Shockproof Design (E431)
Mogelijke alternatieven vergeleken
Afbeelding | Model / recensie | prijs | Gewicht | Hoogte | Scherm |
|---|---|---|---|---|---|
1. 89.9%  | Dell Pro 13 Premium PA13250 Intel Core Ultra 7 268V ⎘ Intel Arc Graphics 140V ⎘ 32 GB Geheugen, 1024 GB SSD | Amazon: 1. $39.99 Smatree Hard Shell Laptop Ca... 2. $29.99 Smatree Hard EVA Protective ... 3. $49.99 Smatree 13 inch Laptop Sleev... Catalogusprijs: 2700 Euro | 1.1 kg | 17.2 mm | 13.30" 1920x1200 170 PPI IPS |
2. 85%  | MSI Prestige 13 AI Plus Evo A2VMG Intel Core Ultra 7 258V ⎘ Intel Arc Graphics 140V ⎘ 32 GB Geheugen | Amazon: $1,349.99 Catalogusprijs: 1400 USD | 970 g | 16.9 mm | 13.30" 2880x1800 255 PPI OLED |
3. 85.1%  | Lenovo ThinkPad X13 2-in-1 Gen 5 Intel Core Ultra 7 165U ⎘ Intel Graphics 4-Core iGPU (Arc) ⎘ 32 GB Geheugen, 1000 GB SSD | Amazon: $1,601.95 Catalogusprijs: 2107.23 Euro | 1.3 kg | 16.4 mm | 13.30" 1920x1200 170 PPI IPS |
4. 84%  | Framework Laptop 13.5 Core Ultra 7 155H Intel Core Ultra 7 155H ⎘ Intel Arc 8-Core iGPU ⎘ 32 GB Geheugen | Catalogusprijs: 1500 USD | 1.4 kg | 15.85 mm | 13.50" 2880x1920 256 PPI IPS |
5. 85.3%  | Dell XPS 13 9350 Intel Core Ultra 7 256V ⎘ Intel Arc Graphics 140V ⎘ 16 GB Geheugen, 512 GB SSD | Amazon: 1. $1,499.99 2025 Latest Dell XPS 13 9350... 2. $1,699.00 NewDell XPS 13 9350 Powerful... 3. $1,599.99 Dell XPS 13 9340 Business La... Catalogusprijs: 1400 USD | 1.2 kg | 15.3 mm | 13.40" 1920x1200 169 PPI IPS |
6. 80.7%  | Microsoft Surface Pro Copilot+ Qualcomm Snapdragon X Plus X1P-64-100 ⎘ Qualcomm SD X Adreno X1-85 3.8 TFLOPS ⎘ 16 GB Geheugen, 256 GB SSD | Amazon: $1,079.99 Catalogusprijs: 1199€ | 872 g | 9.3 mm | 13.00" 2880x1920 266 PPI IPS |
Inhoudsopgave
- Verdict - Een bijna complete zakelijke laptop
- Specificaties
- Behuizing & functies - Deze Dell wordt geleverd met een 8 MP webcam
- Invoerapparaten - De 13 Premium heeft een touchpad voor conferentiegesprekken
- Display - Een kantoorpaneel met hoog contrast en extra opties
- Prestaties - Een krachtige boog 140V
- Uitstoot & energie - De Dell Pro is zuinig
- Notebookcheck algemene beoordeling
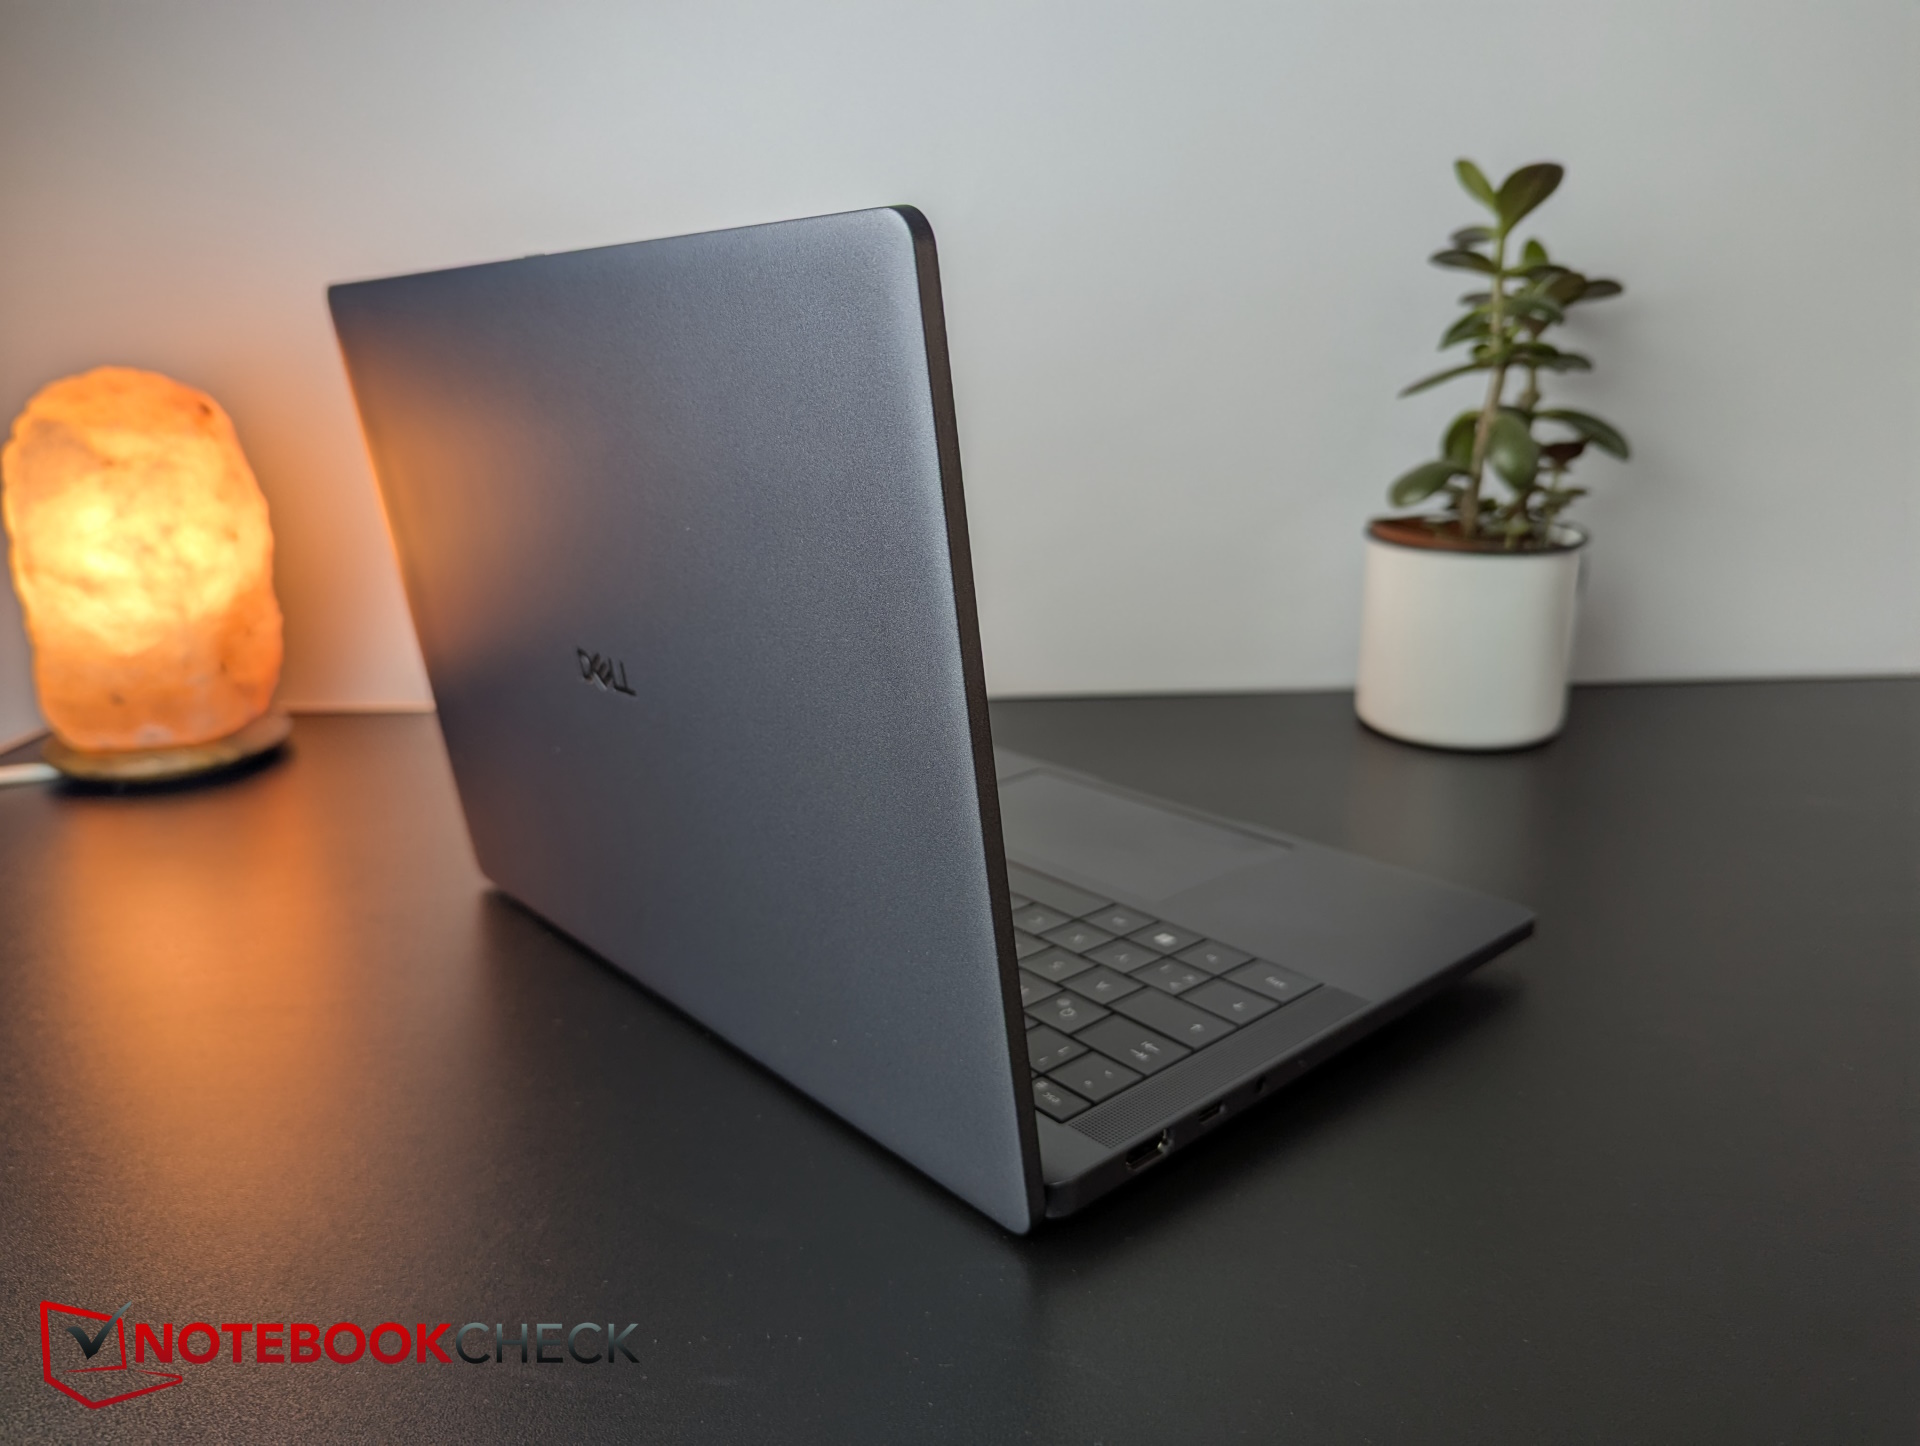
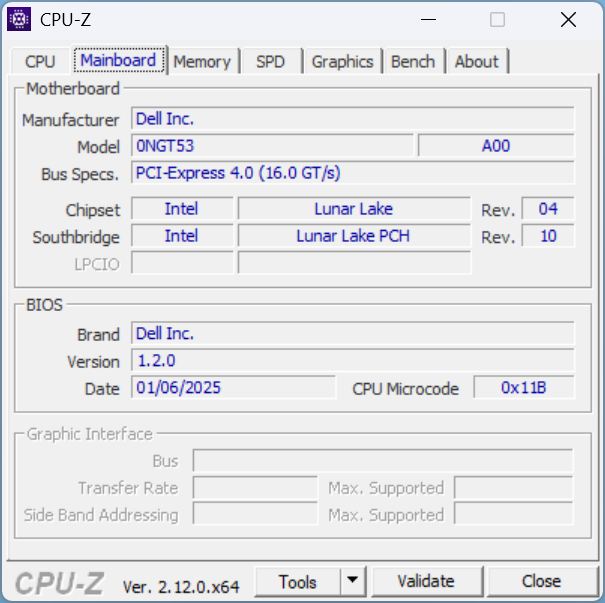
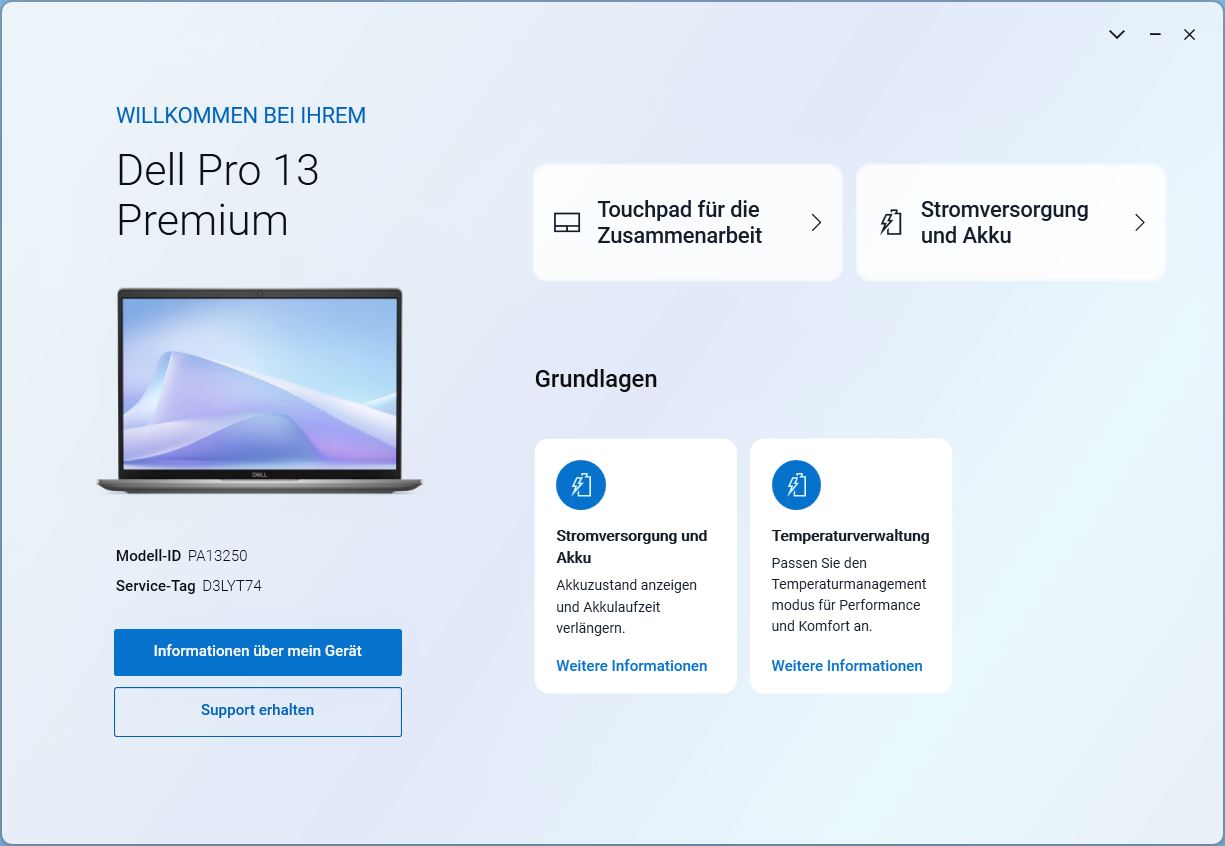
Dell heeft onlangs zijn naamgeving veranderd. Met de Pro serie richt Dell zich op de typische zakelijke gebruiker en vervangt in wezen de vorige Latitude serie. Premium staat voor de beste materialen en functies, en ons huidige 13-inch model heeft moderne poorten, uitgebreide beveiliging, veel AI, een stevig magnesium chassis en weegt desondanks iets meer dan 1 kg. Dus, is dit de premium laptop voor zakelijke gebruikers?
Specificaties
Behuizing & functies - Deze Dell wordt geleverd met een 8 MP webcam
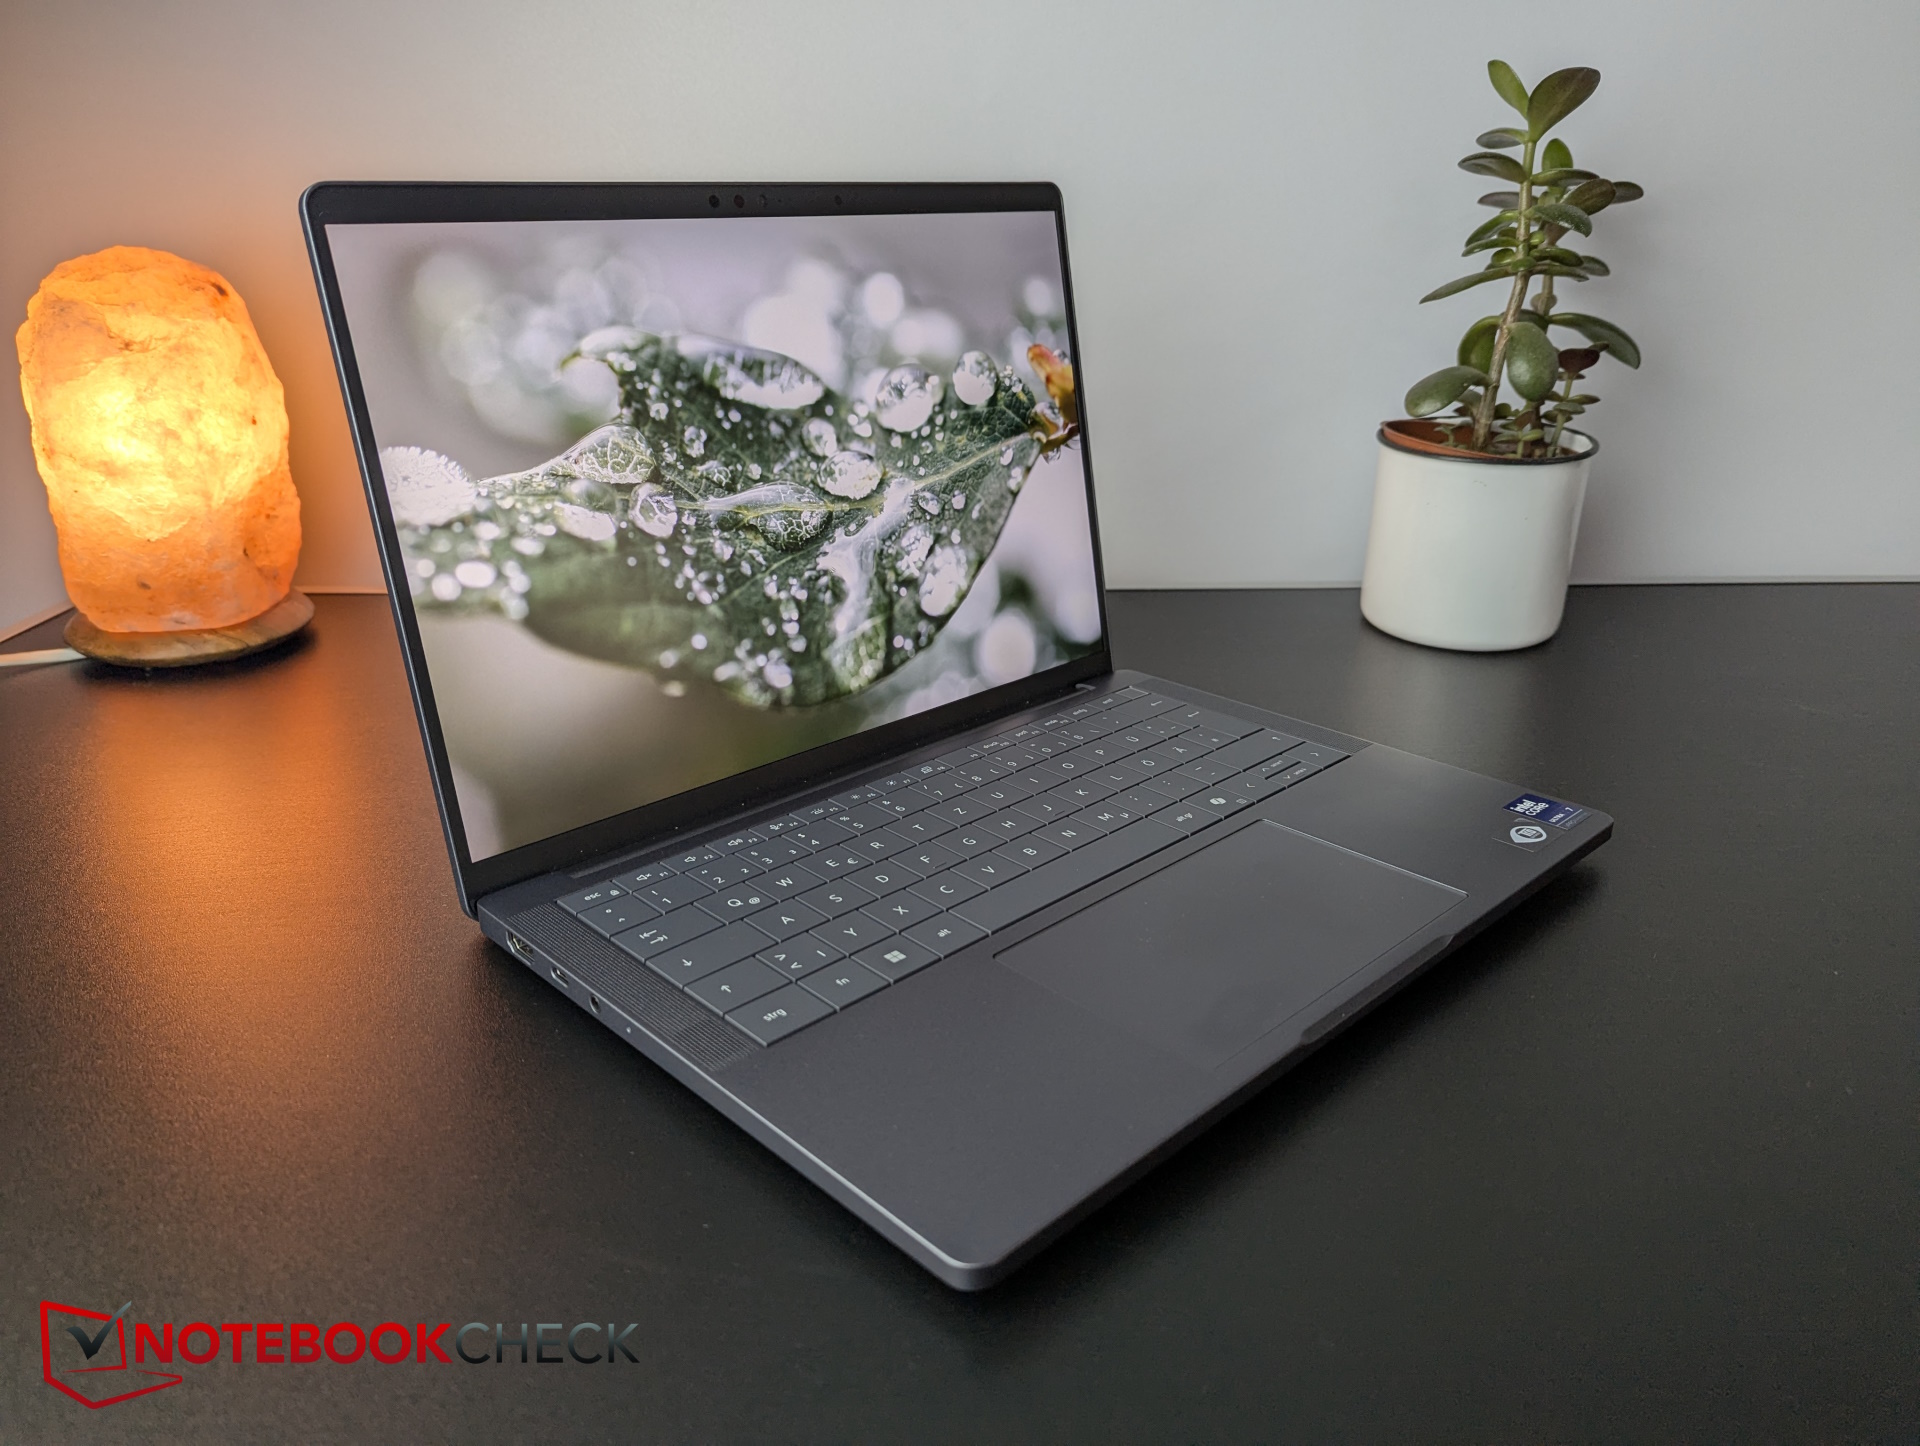
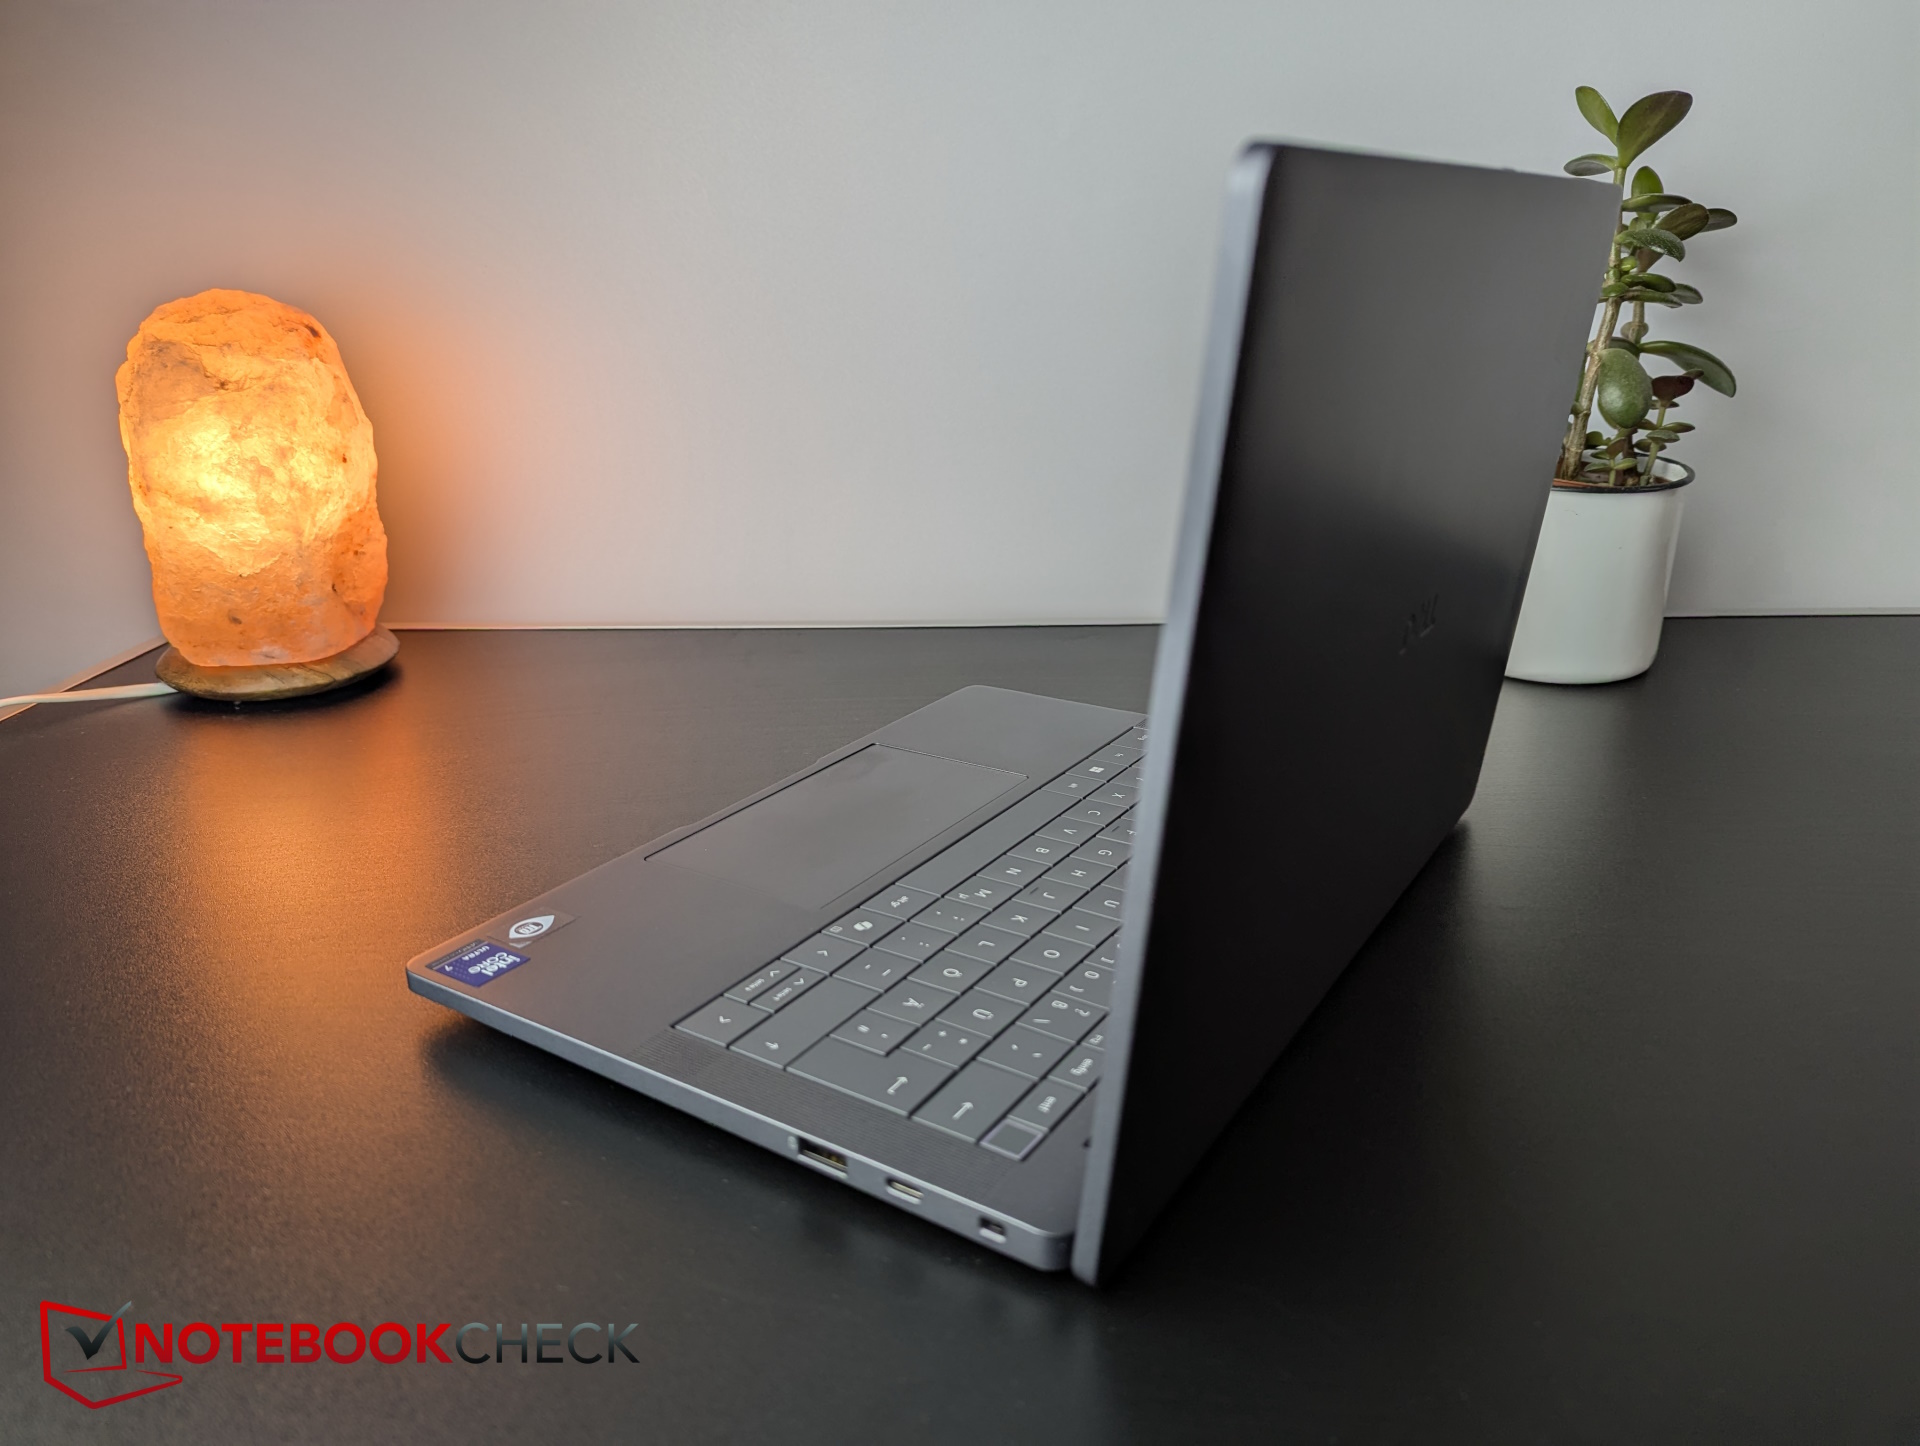
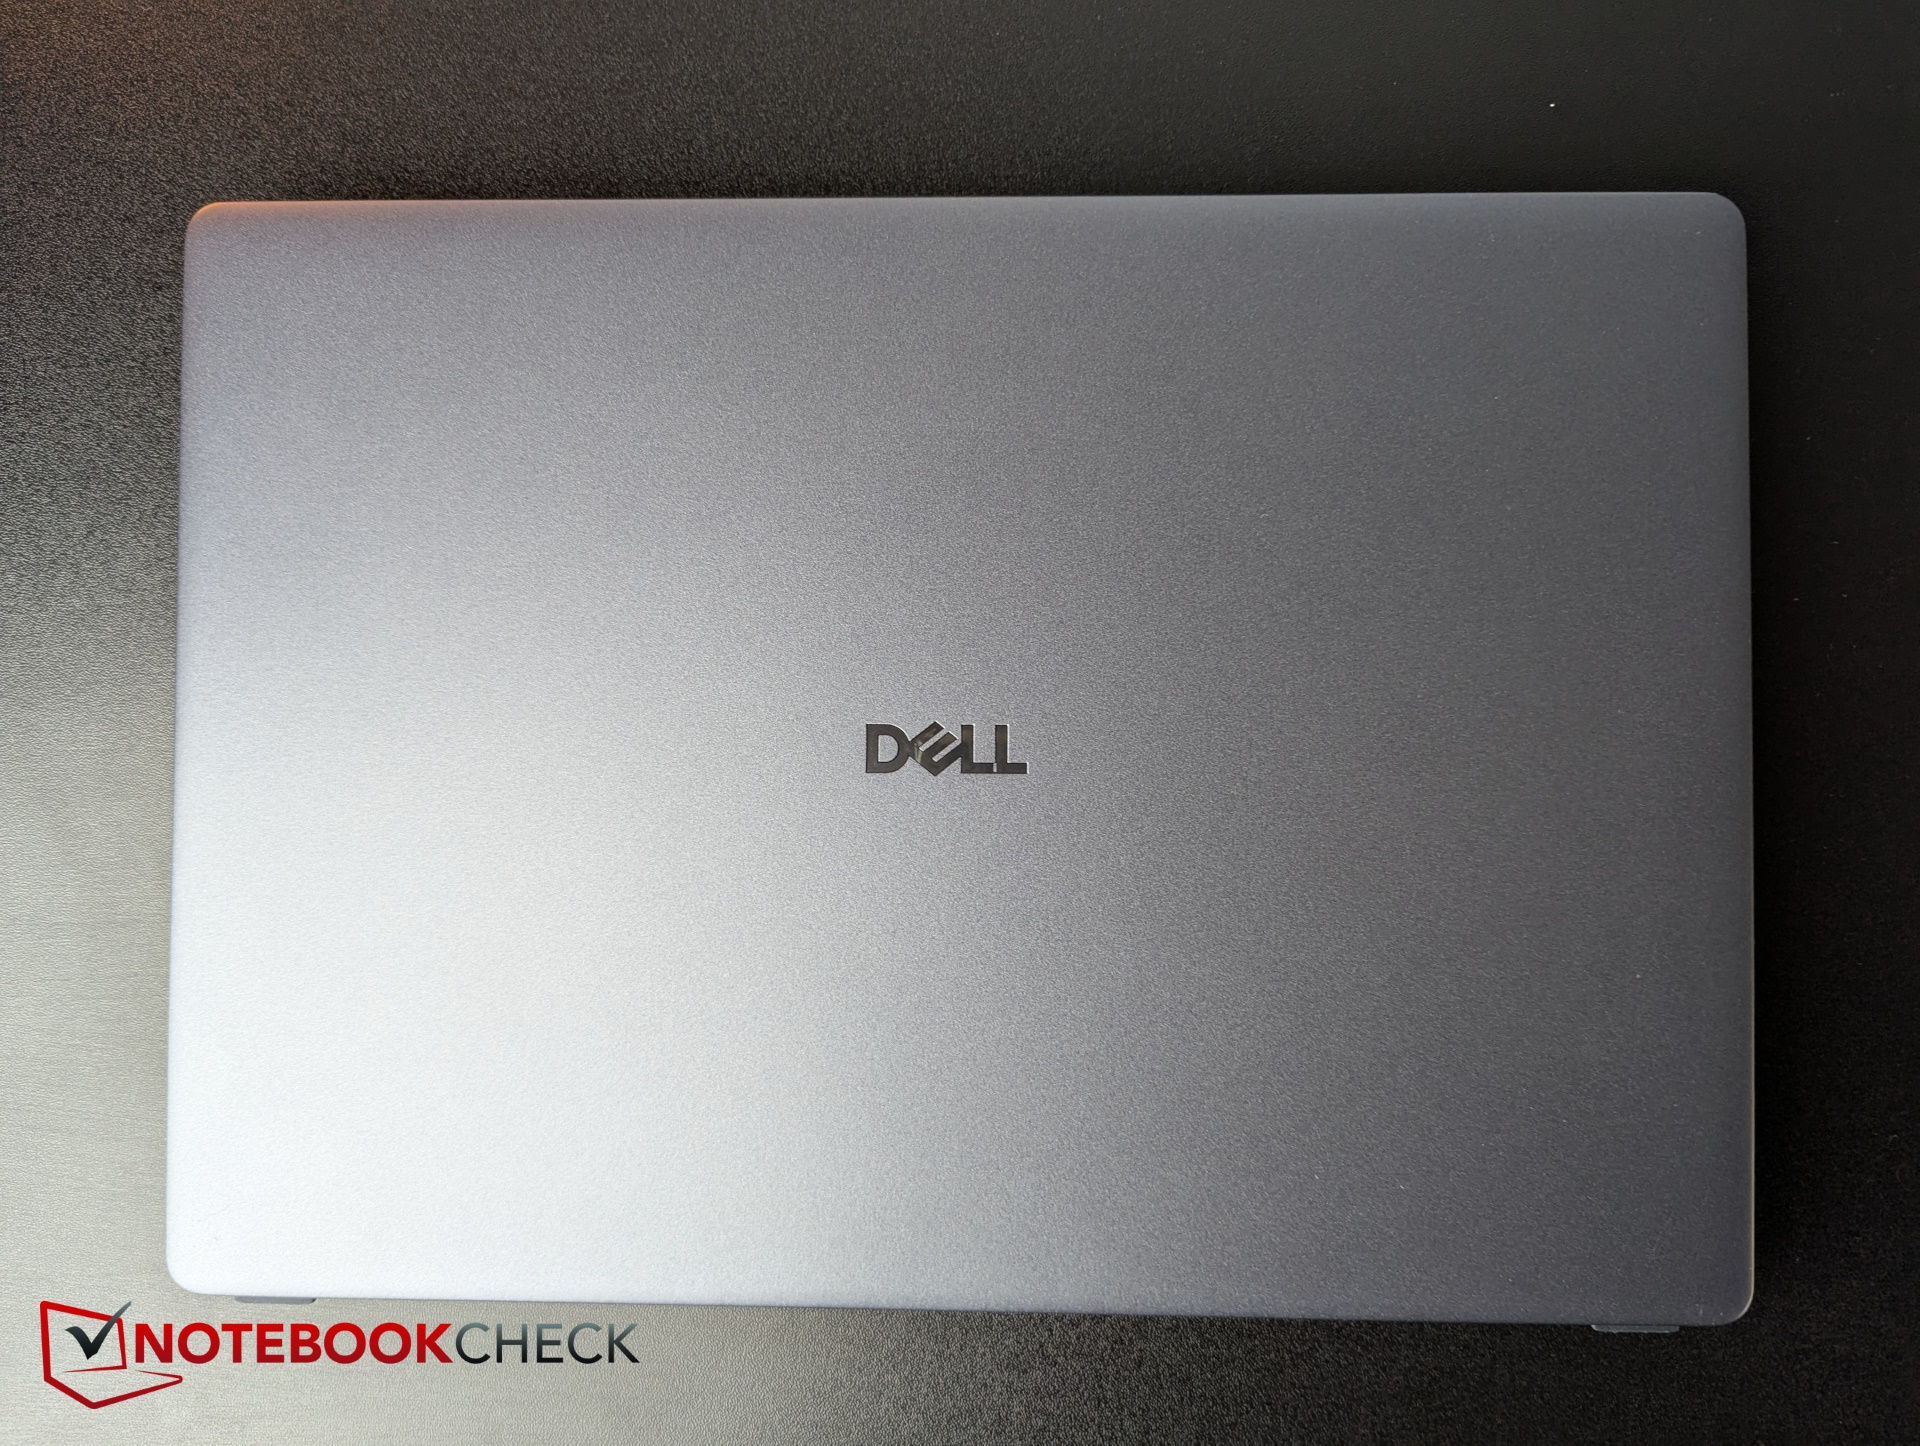
De donkergrijze behuizing is gemaakt van 90% gerecycled magnesium. Hierdoor zijn het basisstation en het 180 graden deksel zeer stabiel, en we hebben geen krakende geluiden waargenomen toen we het apparaat verdraaiden. Het ontwerp ziet er uiterst compact en eenvoudig maar elegant uit.
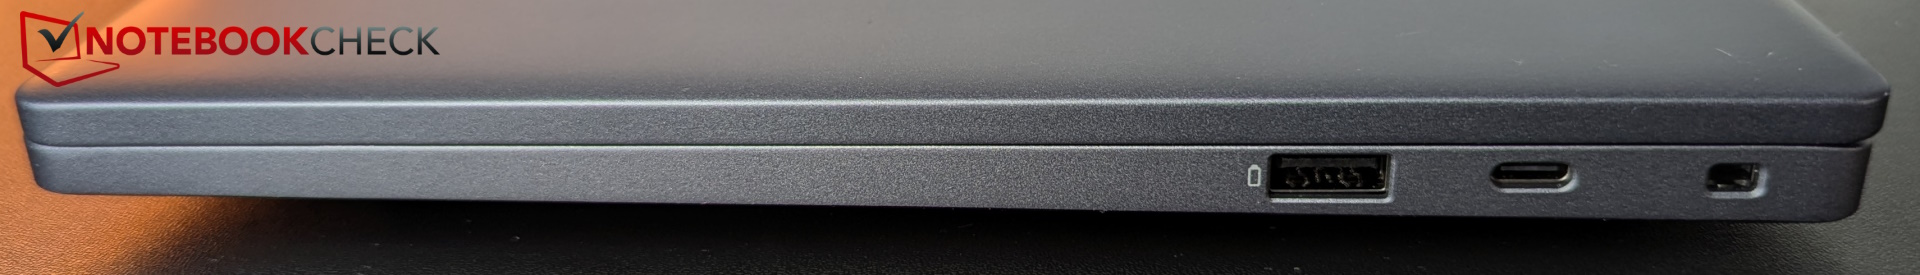
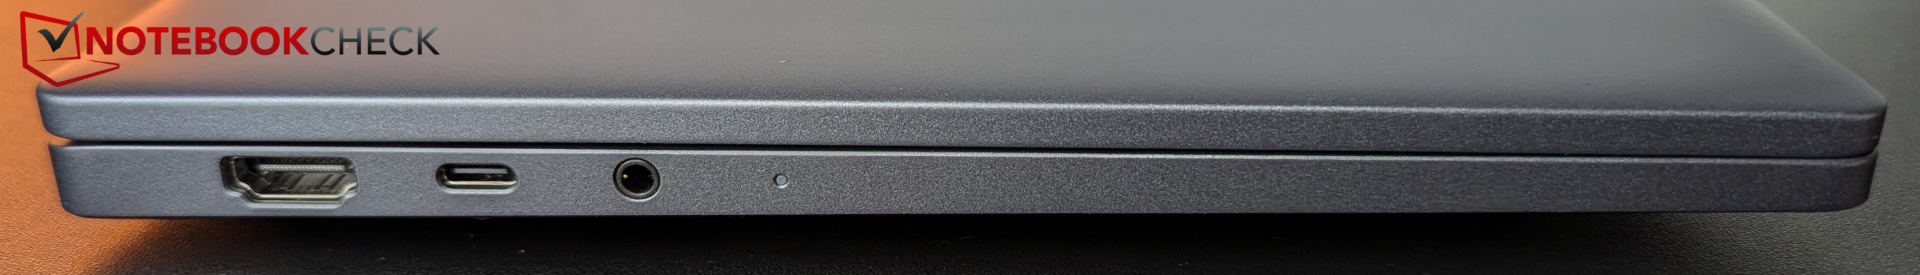
De Pro 13 Premium heeft twee Thunderbolt 4-poorten, één aan elke kant, en een HDMI-poort van volledig formaat. Een vingerafdruksensor is geïntegreerd in de aan/uit-knop. Er is geen kaartlezer of LAN-poort. Dell biedt echter wel Wi-Fi 7. Een SIM-kaartsleuf is optioneel.
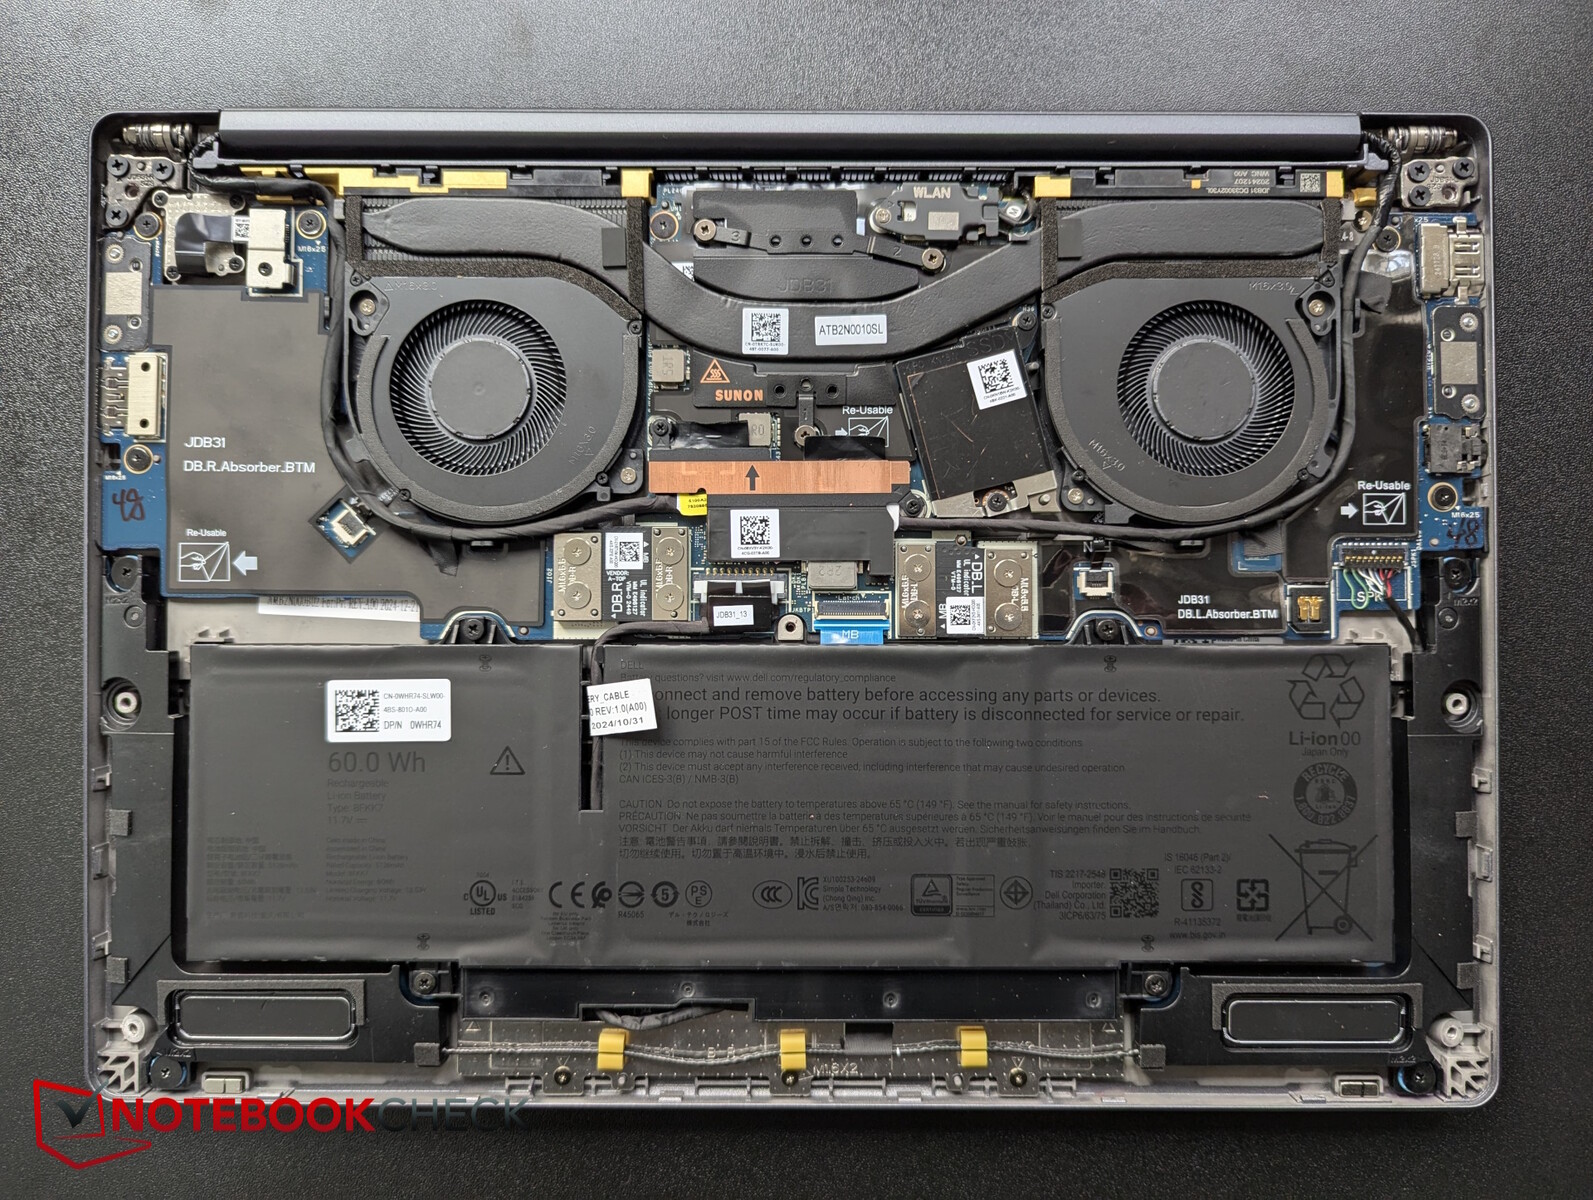
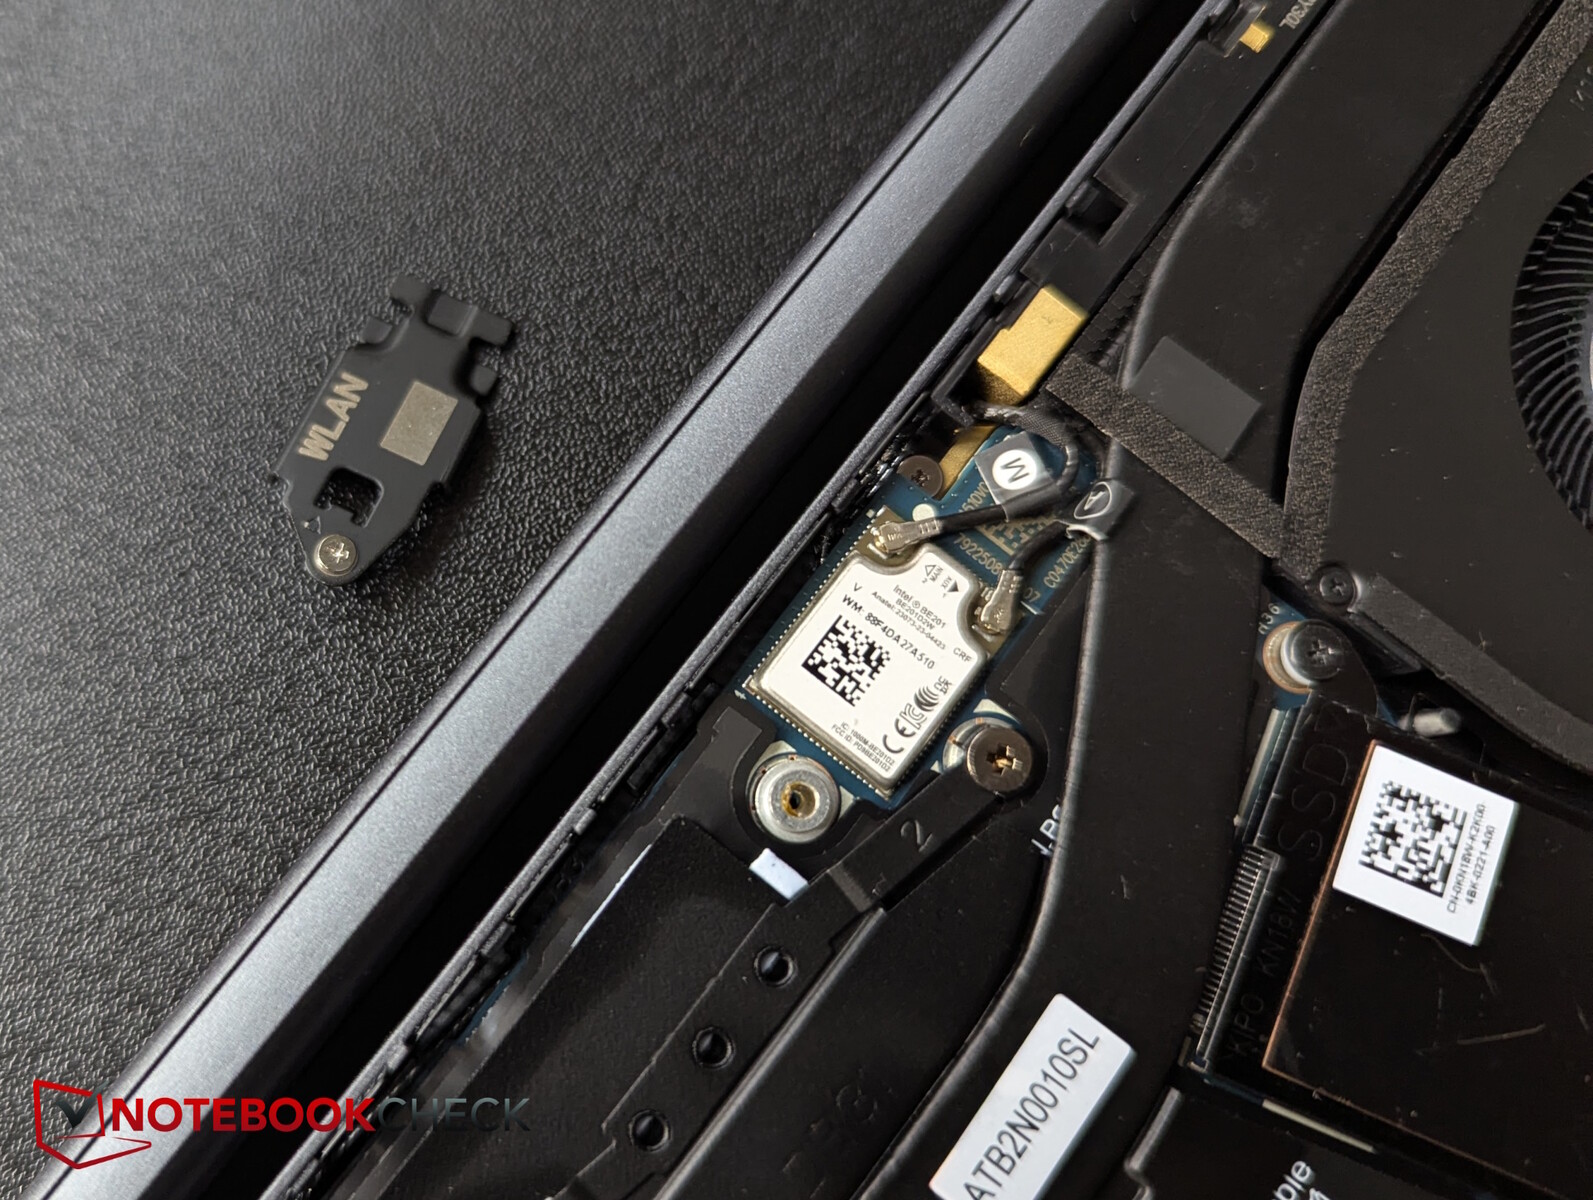
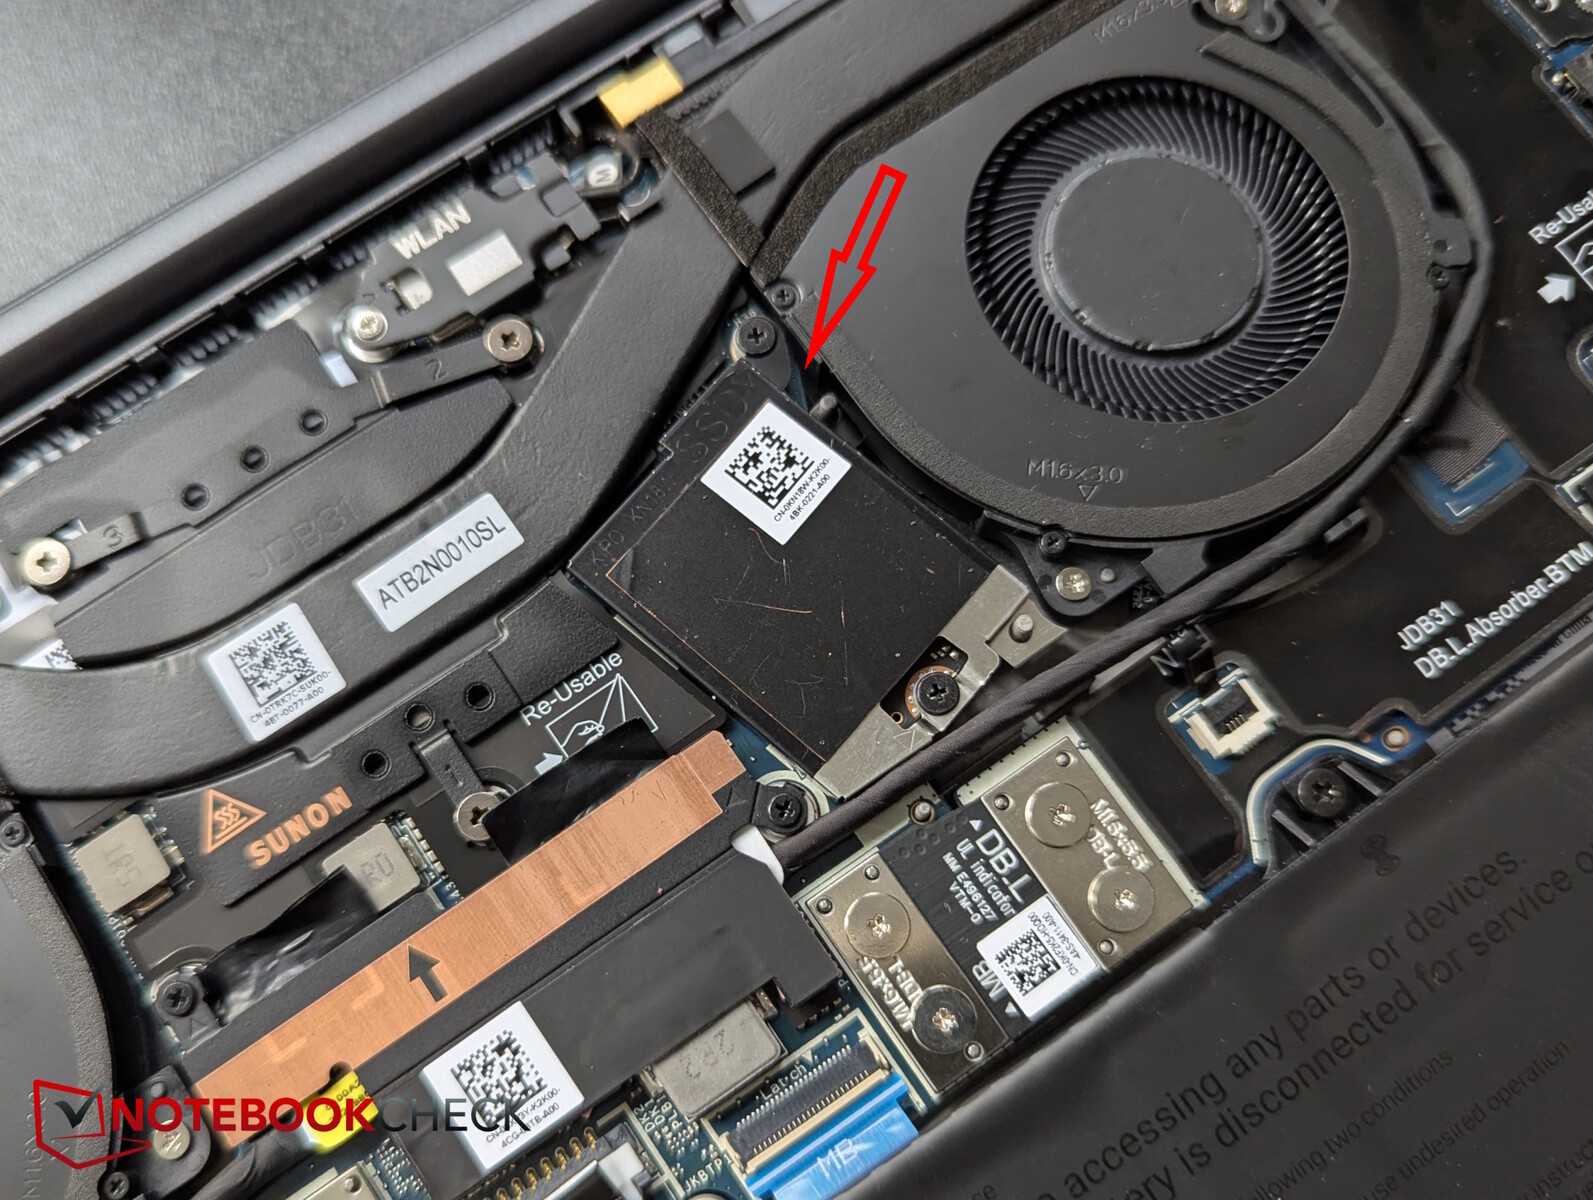
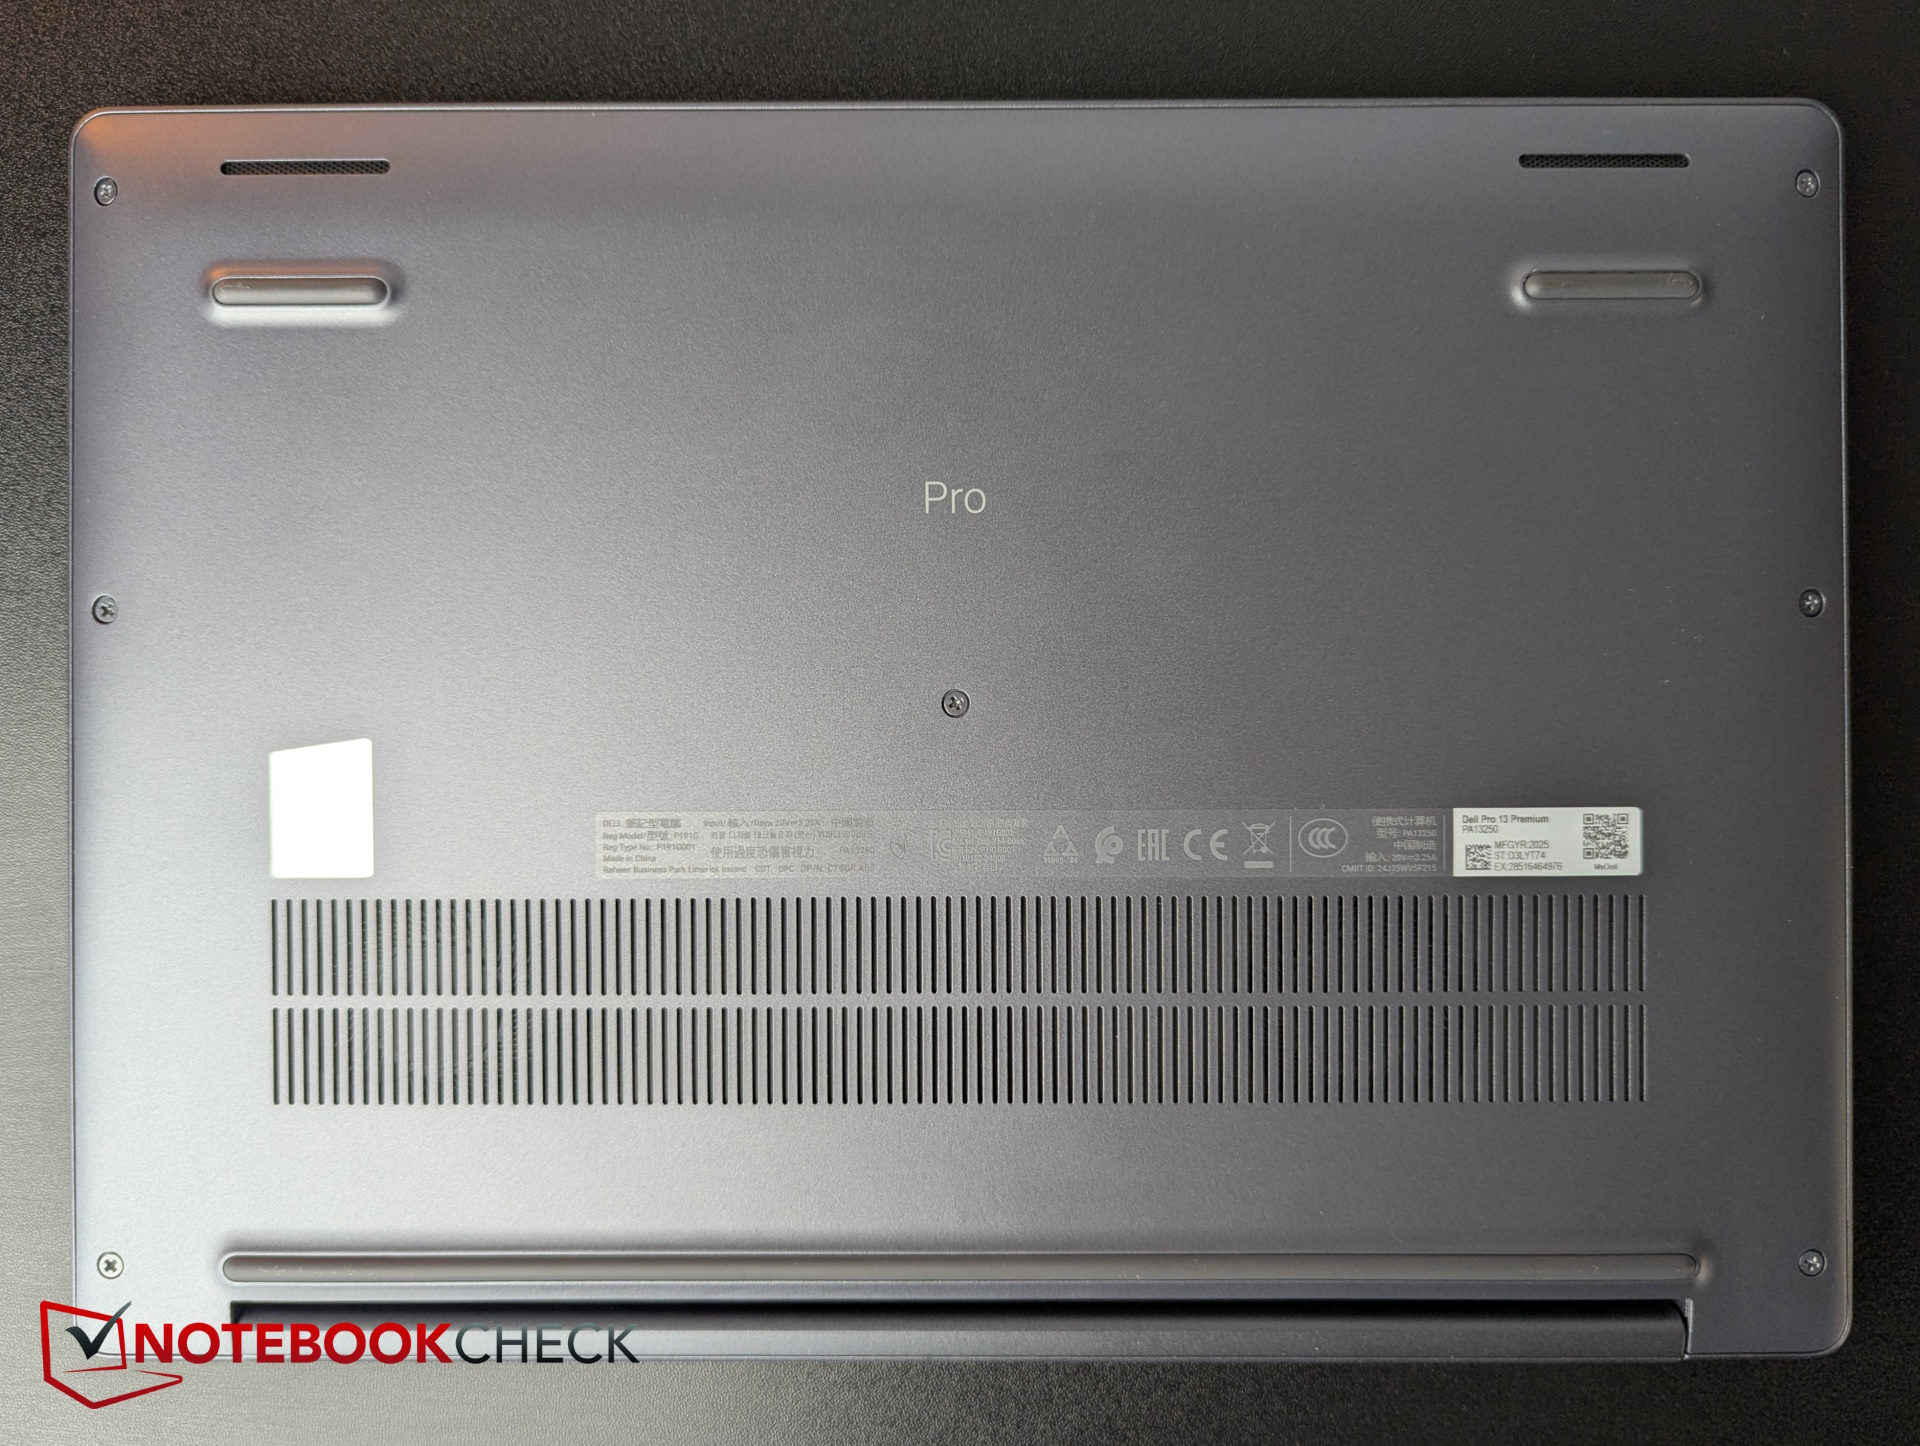
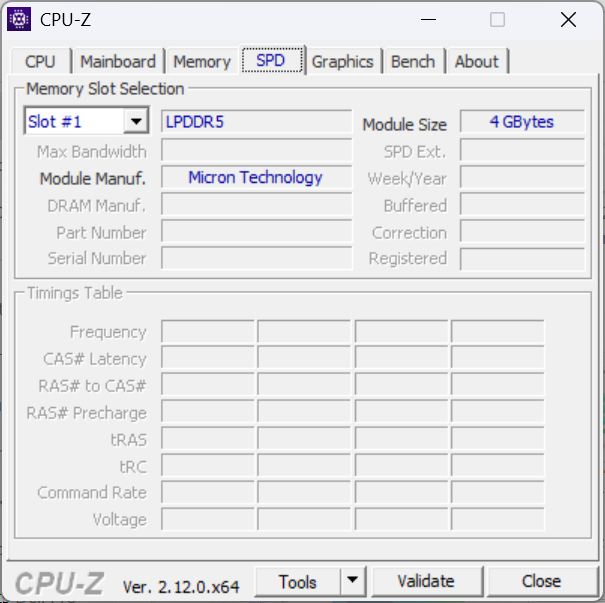
De zakelijke laptop is relatief eenvoudig te openen met de kruiskopschroeven die nog in de bodemplaat zitten. Het RAM-geheugen en de Wi-Fi-module zijn echter permanent binnenin geïnstalleerd, en de SSD heeft alleen het kleine M.2 2230-formaat en mist een tweede sleuf.

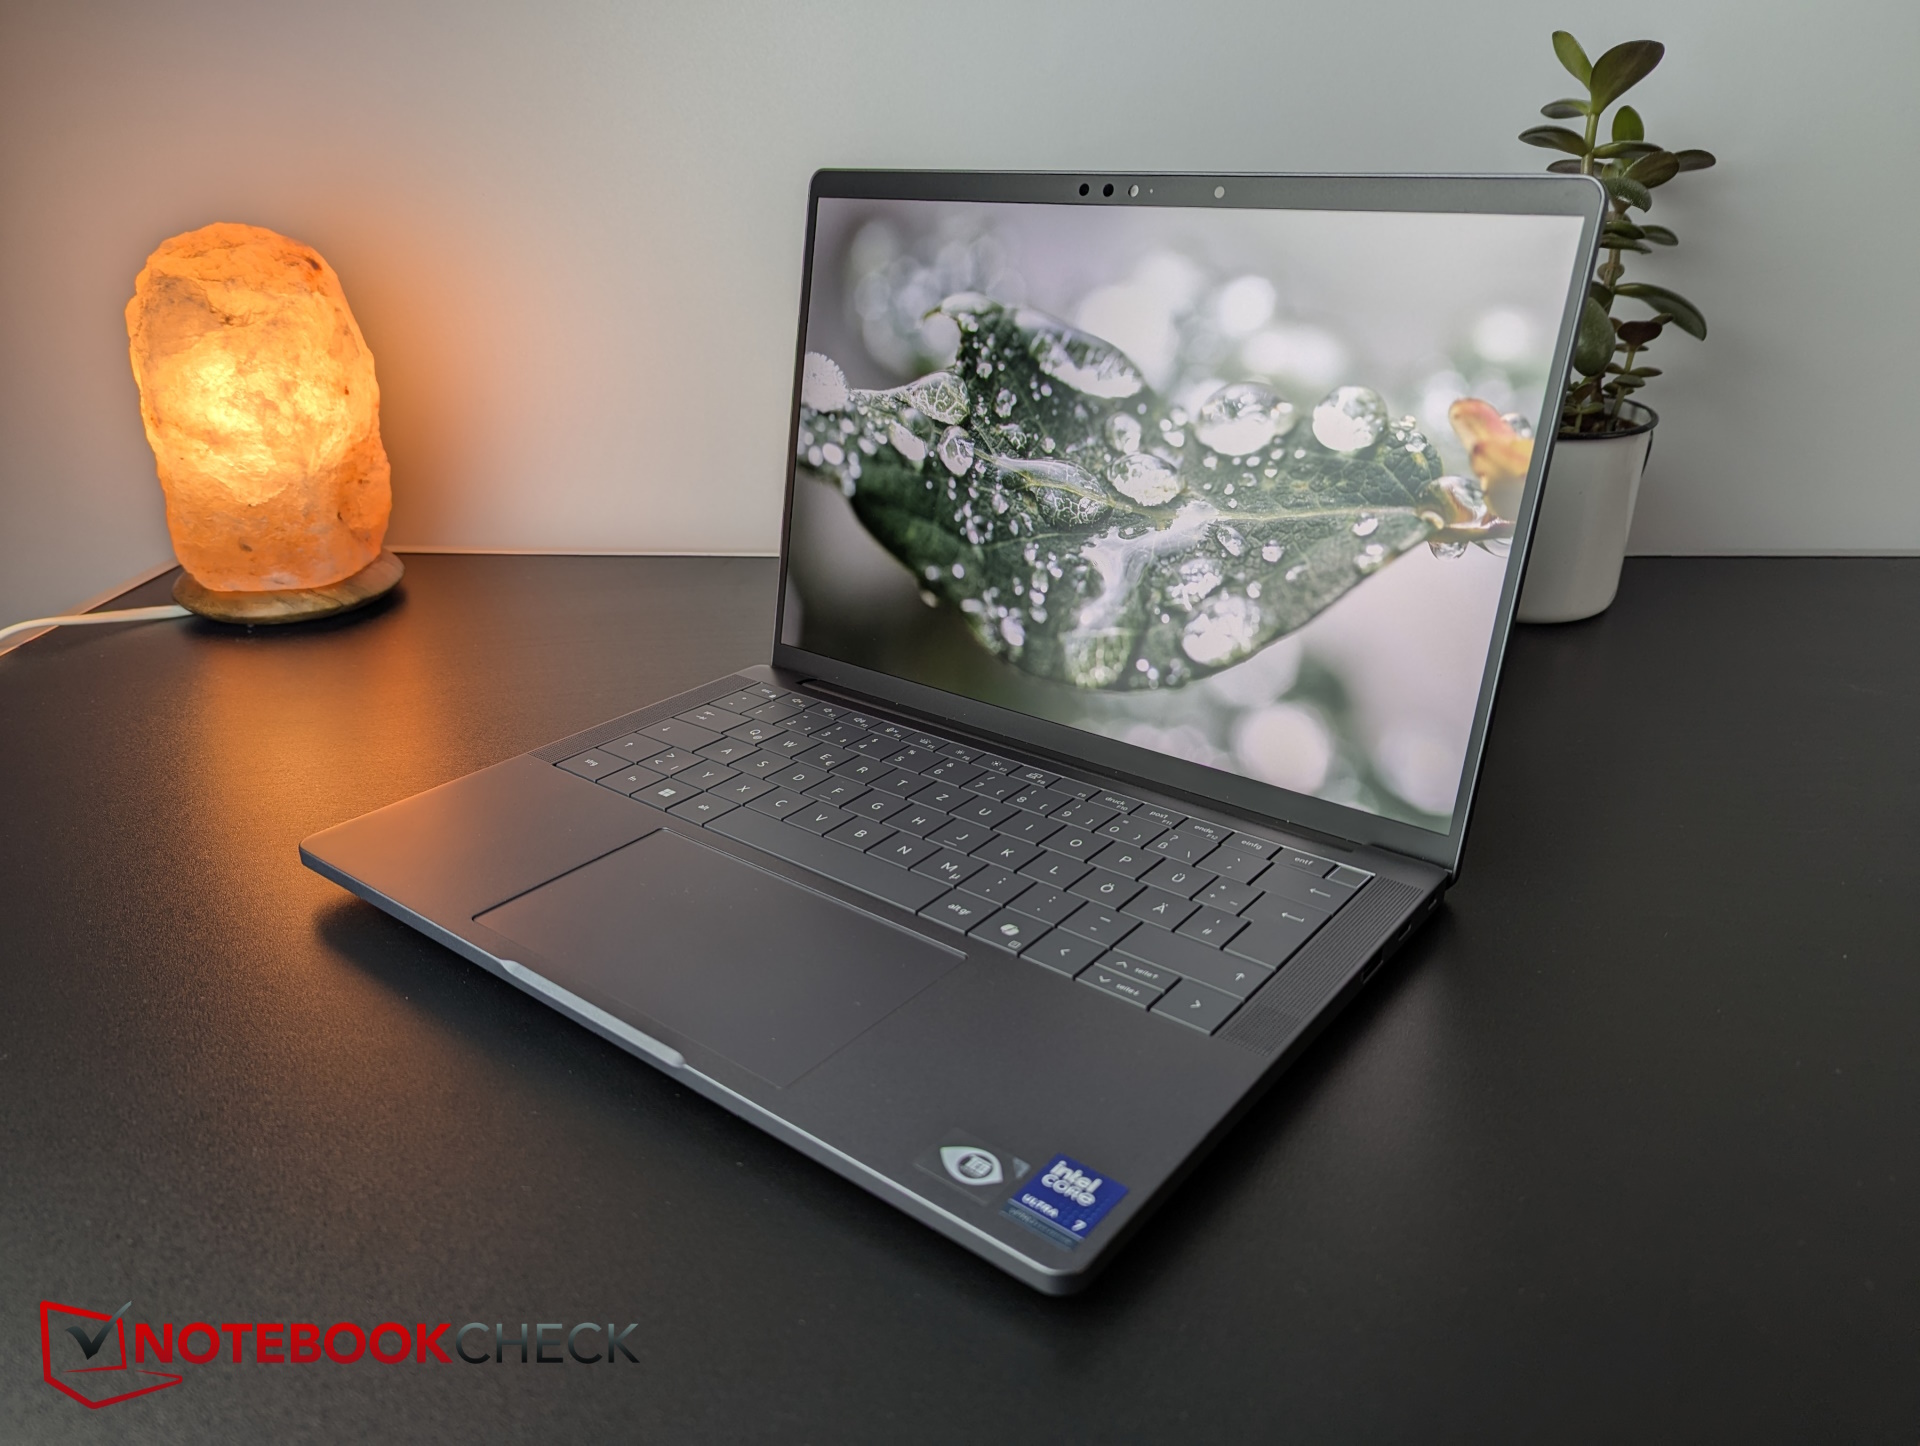
Met 8 MP heeft de IR webcam een ongewoon hoge resolutie. Hierdoor zijn de testbeelden goed scherp, maar de kleurafwijkingen zijn gemiddeld tot groot, vooral in het groene bereik. De WiFi 7 module levert constant hoge overdrachtssnelheden.


Duurzaamheid
Volgens Asus is de Pro 13 Premium ENERGY STAR-gecertificeerd, EPEAT Gold-geregistreerd en heeft het een Climate+-zegel. Hij voldoet ook aan de nieuwste TCO Generation 9-certificering voor stroomverbruik en repareerbaarheid.
De gebruikte materialen zijn onder andere PCR plastic, gerecycled magnesium, bio-based plastic en gerecycled kobalt, en de verpakking is gemaakt van 100% gerecycled of hernieuwbaar materiaal, voornamelijk karton.
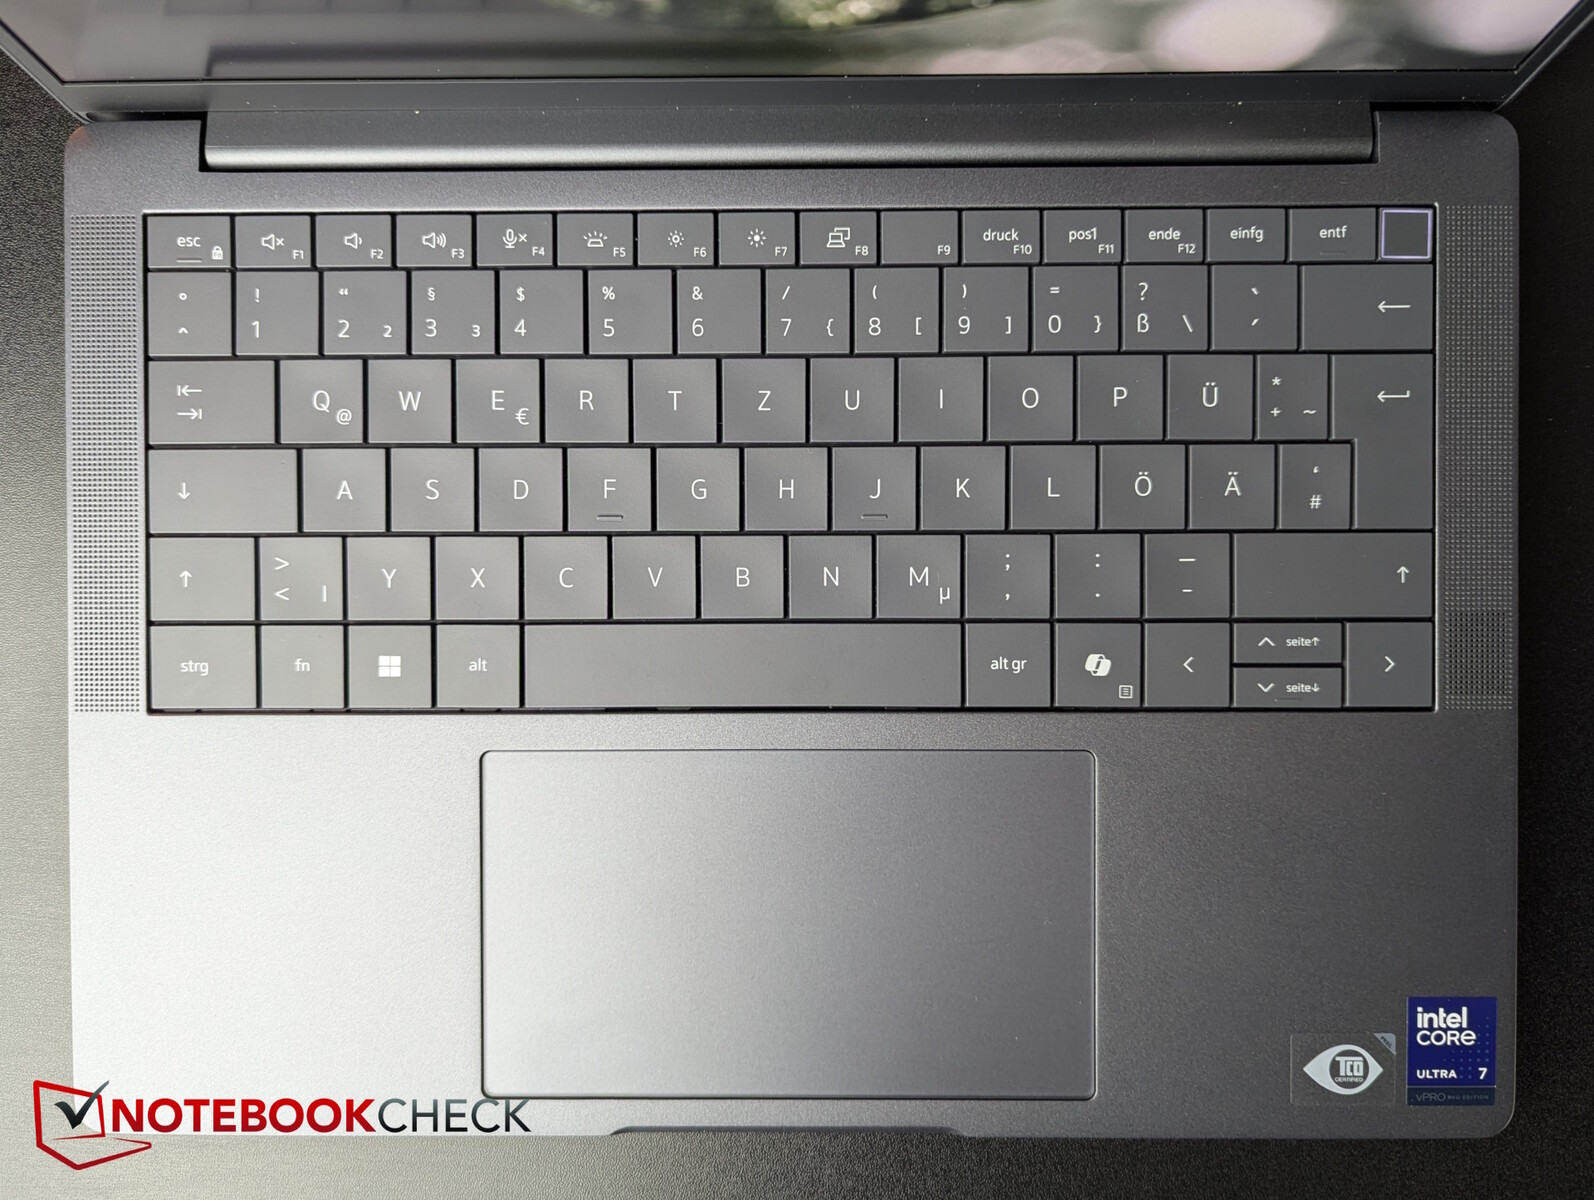
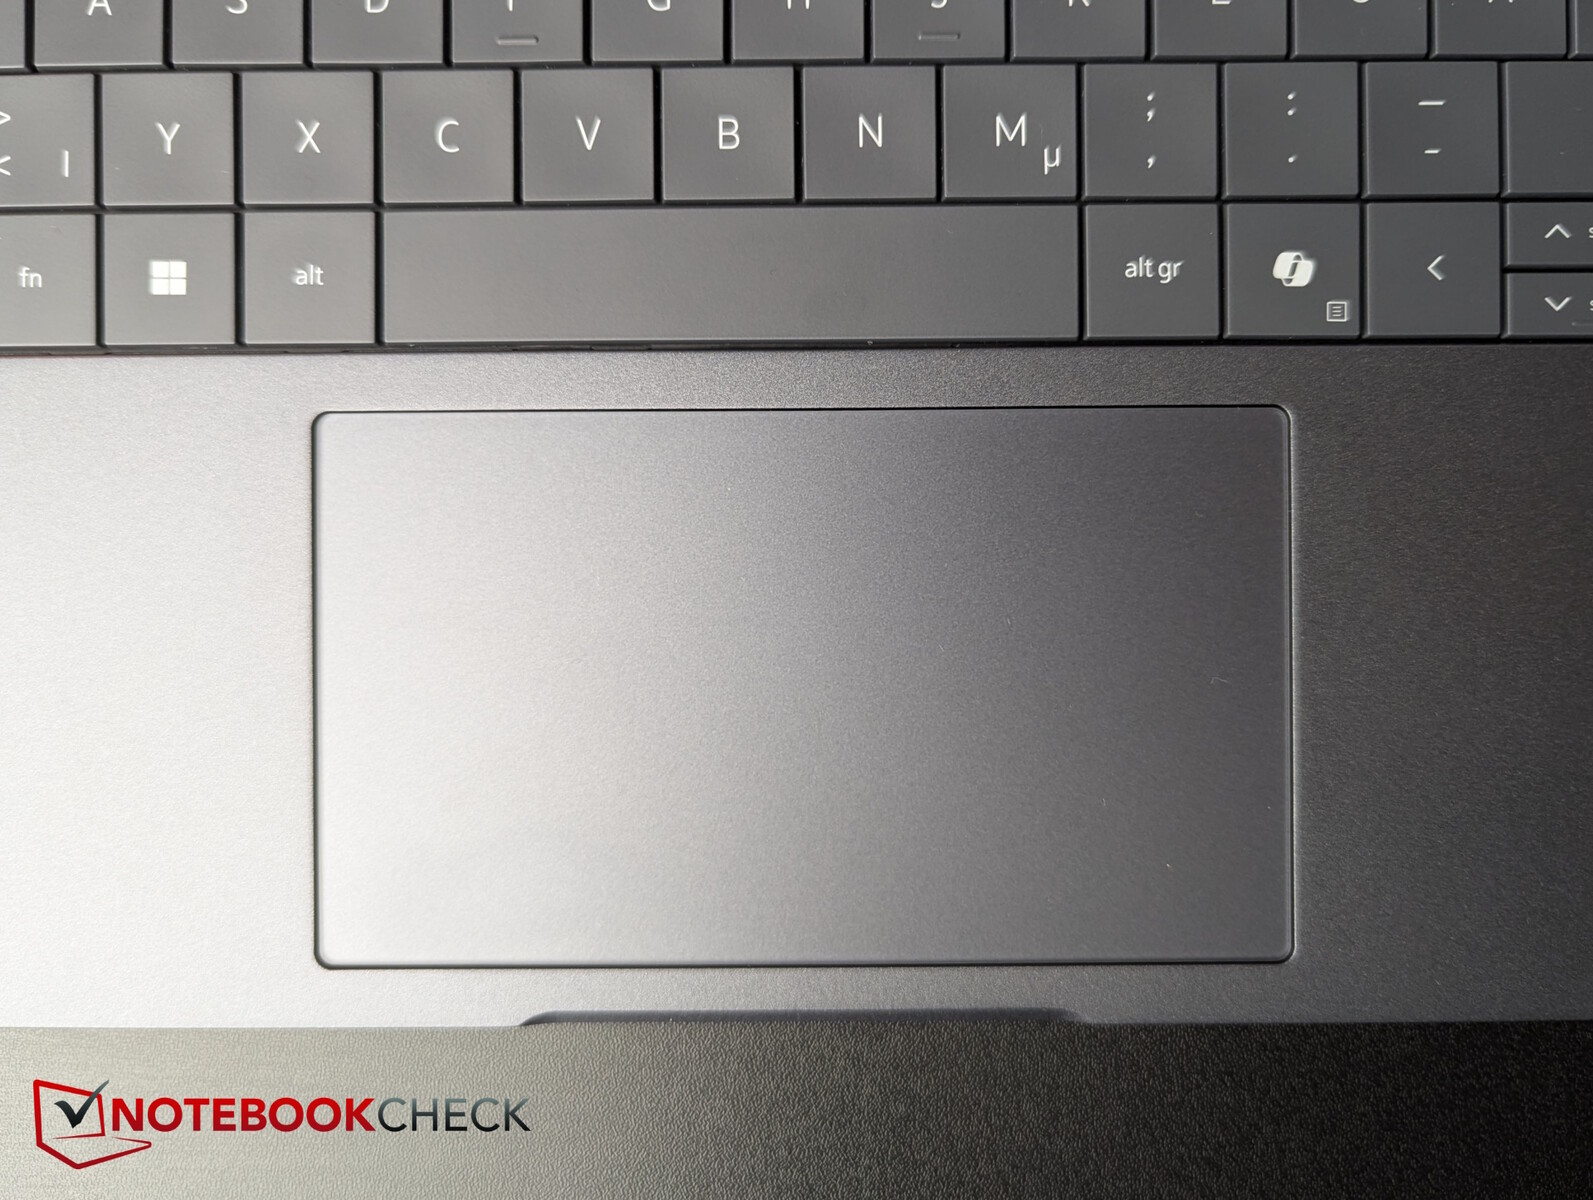
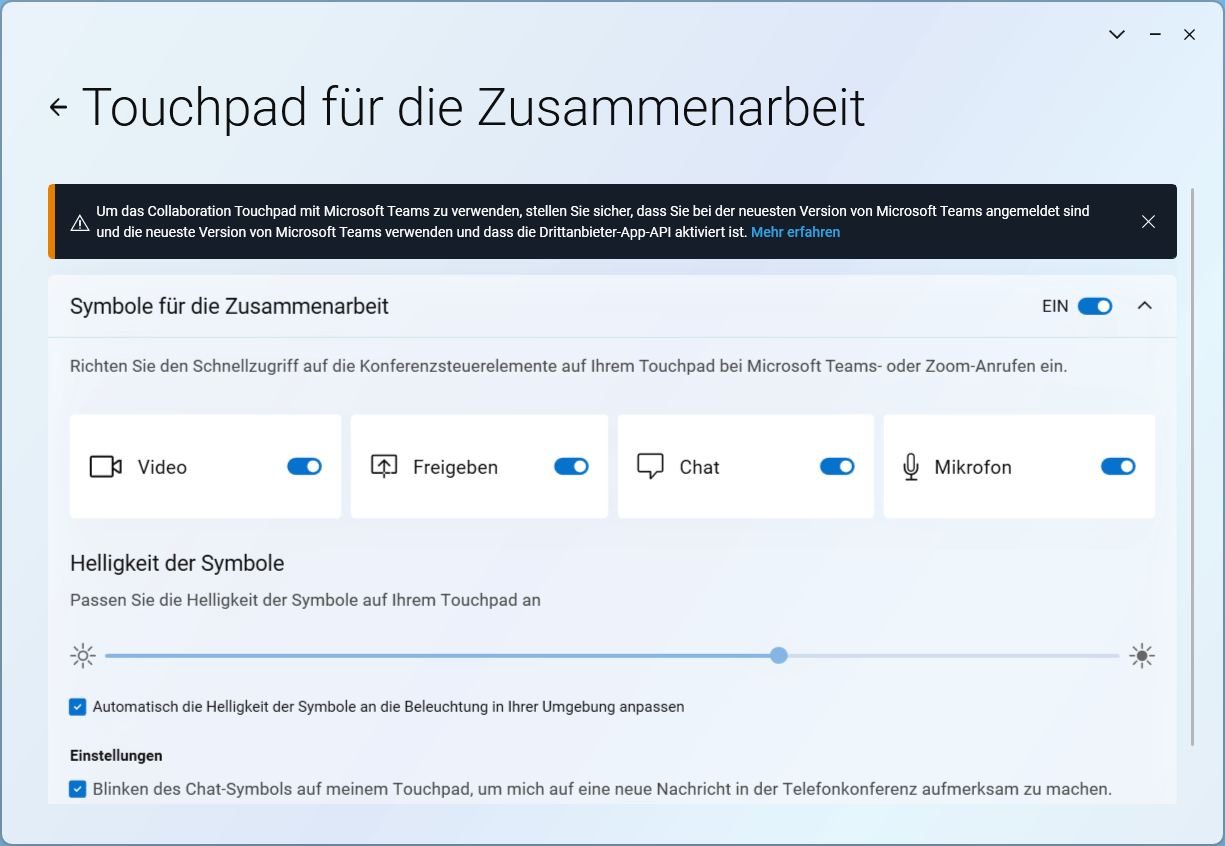
Invoerapparaten - De 13 Premium heeft een touchpad voor conferentiegesprekken
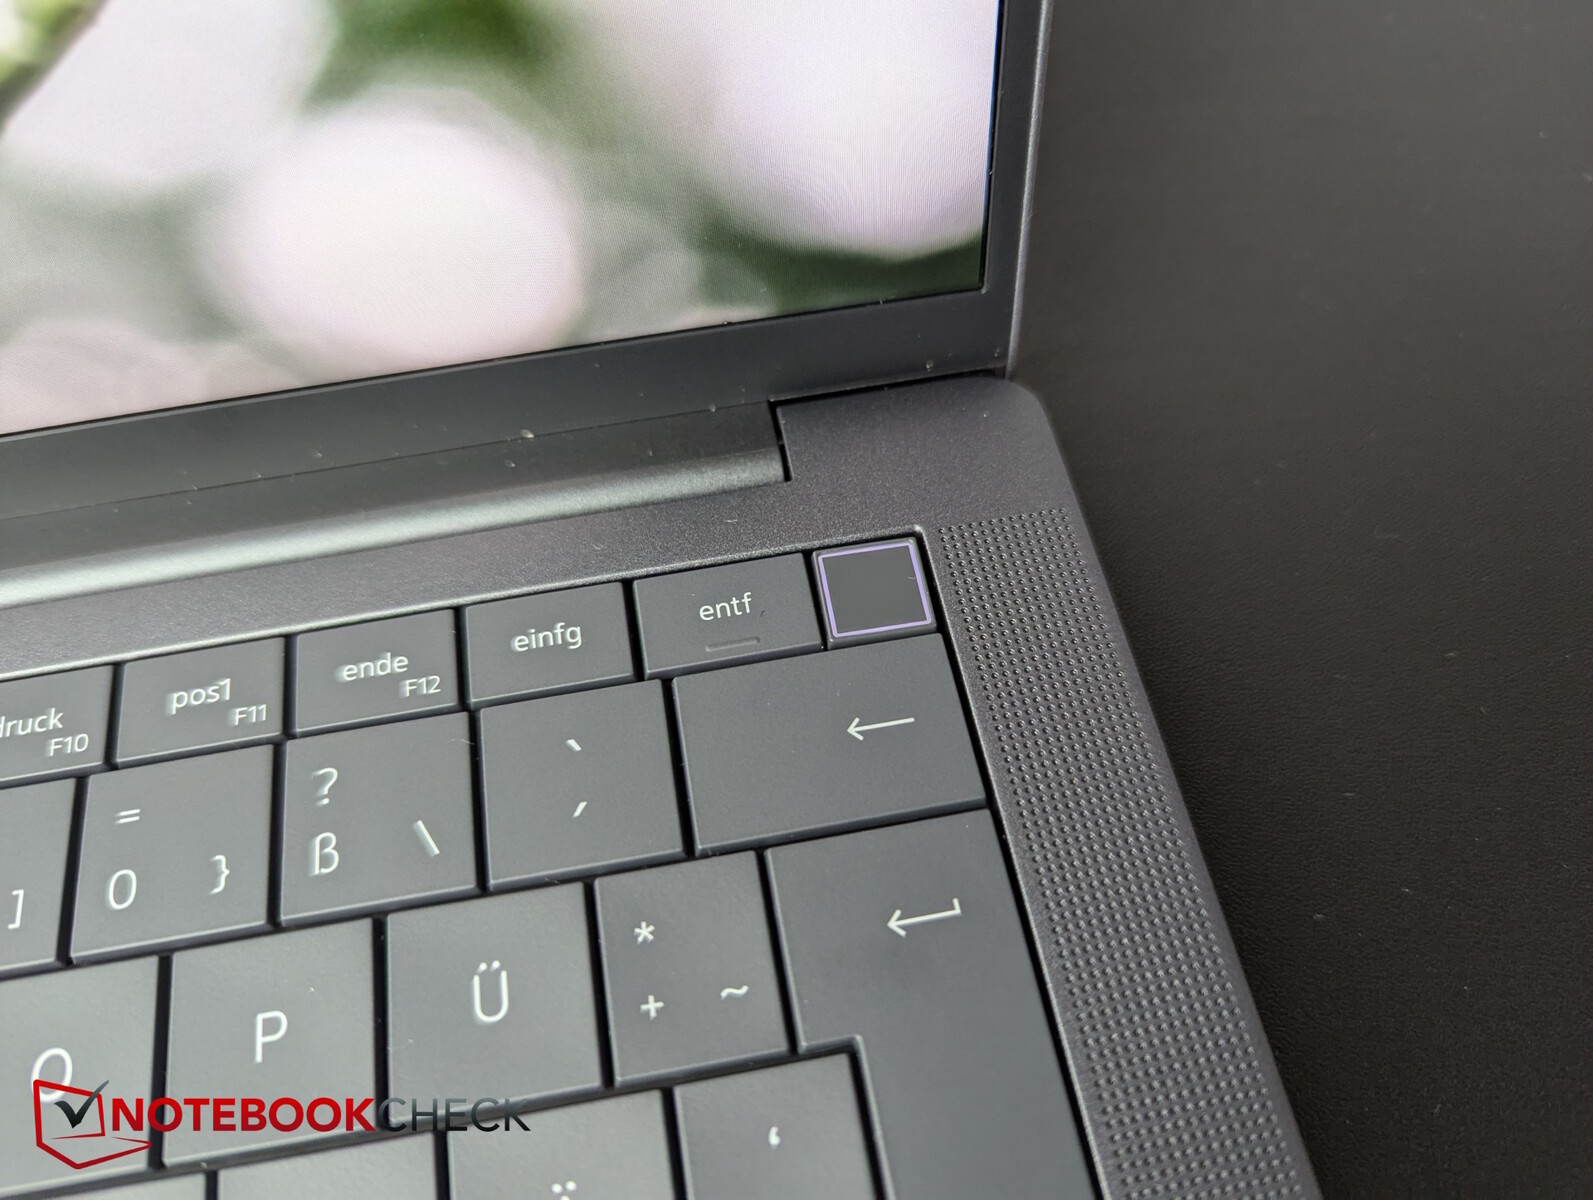
De Dell biedt een zeer overzichtelijke en compacte lay-out met grote toetsen (ca. 1,7 cm), geen tussenruimtes en de verticale pijltjestoetsen zijn gehalveerd in hoogte. De aan/uit-knop die rechtsboven in het toetsenbord is geïntegreerd, bevat ook een vingerafdruksensor.
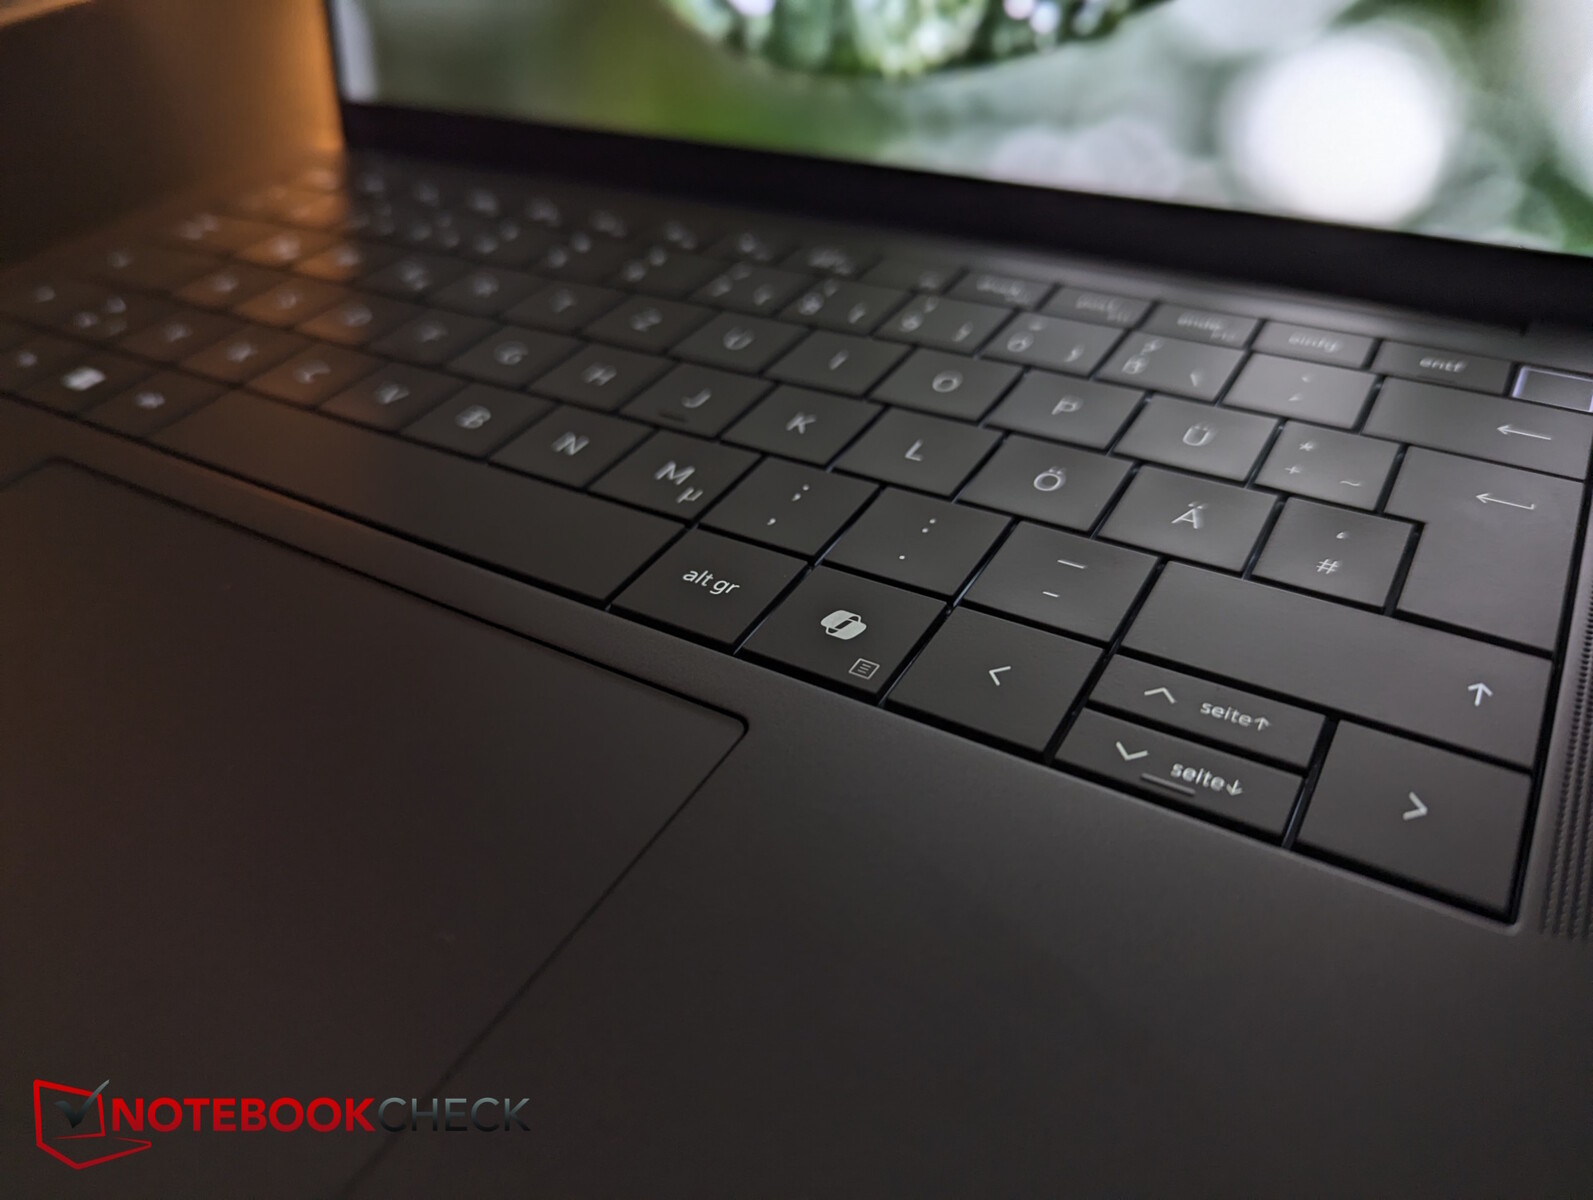
De toetsen hebben een ondiepe tot gemiddelde aanslag, maar een voelbare feedback. Hierdoor kan de gebruiker snel typen en is het toetsgeluid meer dan matig. Het stroomverbruik van de tweetraps achtergrondverlichting is naar verluidt tot 75% verminderd dankzij mini-LED's.
Het touchpad meet ongeveer 12,5 x 7,1 cm, en de opvallendste eigenschap is de opname van speciale toetsen voor videochat in de bovenste rij (camera aan/uit, scherm delen, chat, microfoon aan/uit). De aanraaksymbolen zijn alleen zichtbaar tijdens gesprekken met Zoom of Microsoft Teams. Het oppervlak is erg glad, maar als u net uw handen hebt gewassen of om een andere reden licht vochtige vingers hebt, zal het aanzienlijk stotteren. De stille klikken van de geïntegreerde muisknoppen geven een aangename feedback en worden betrouwbaar geactiveerd.
Display - Een kantoorpaneel met hoog contrast en extra opties
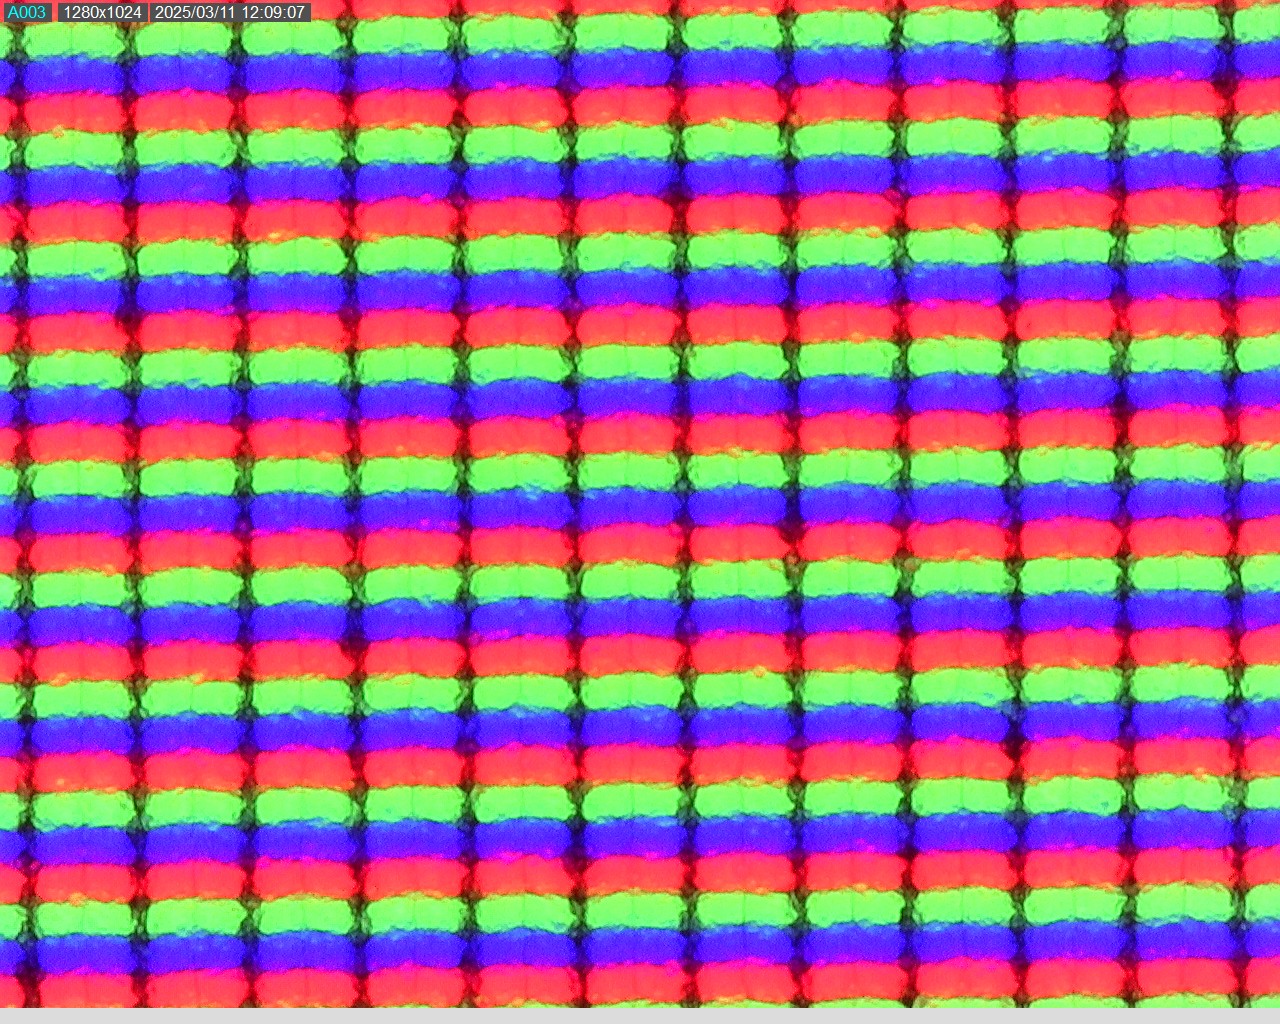

Er zijn verschillende schermopties, maar waar we hier naar kijken is een mat, 16:10 beeldverhouding, 1.920 x 1.200 scherm met een officiële helderheid van 400 nits en geen aanraakinvoer. Er is ook een versie met 300 nits en de bovenste optie heeft een resolutie van 2.560 x 1.600 pixels, 500 nits en aanraakfunctionaliteit. Dell benadrukt dat alle beeldschermen bijzonder energiezuinig zijn.
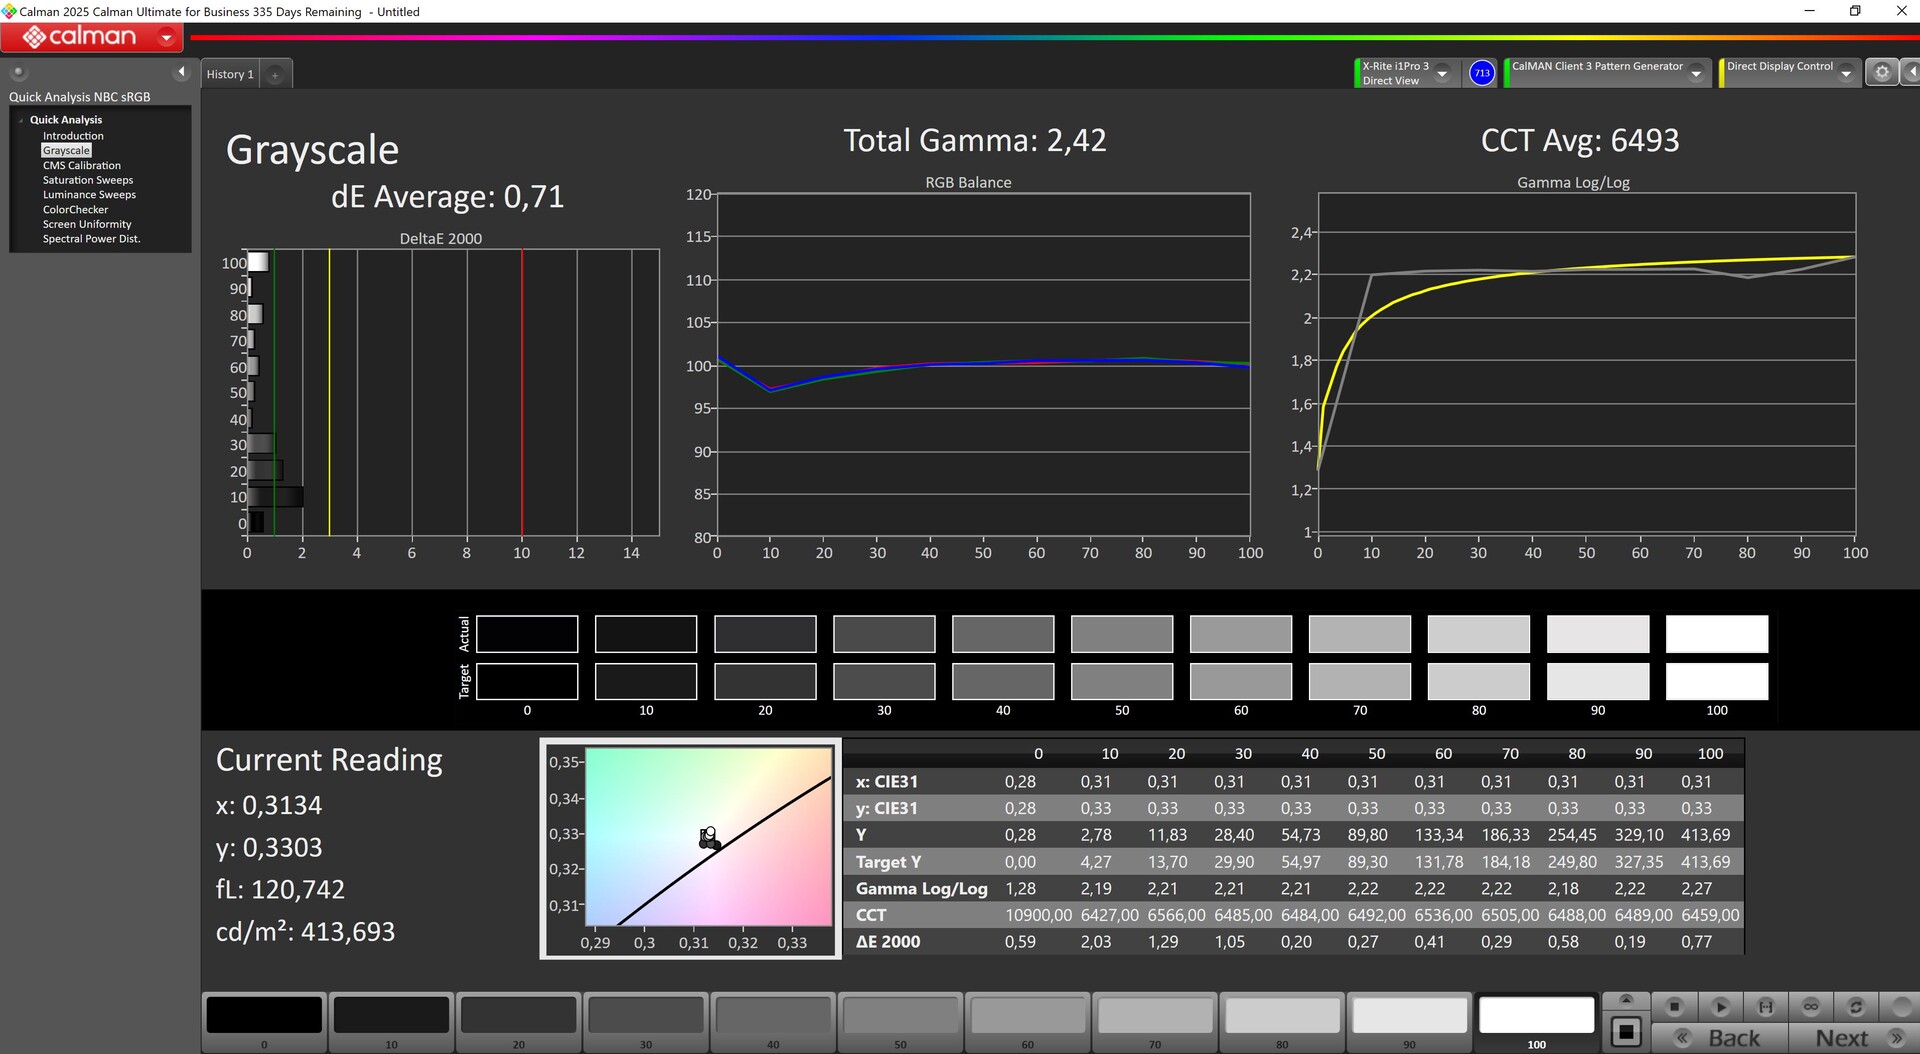
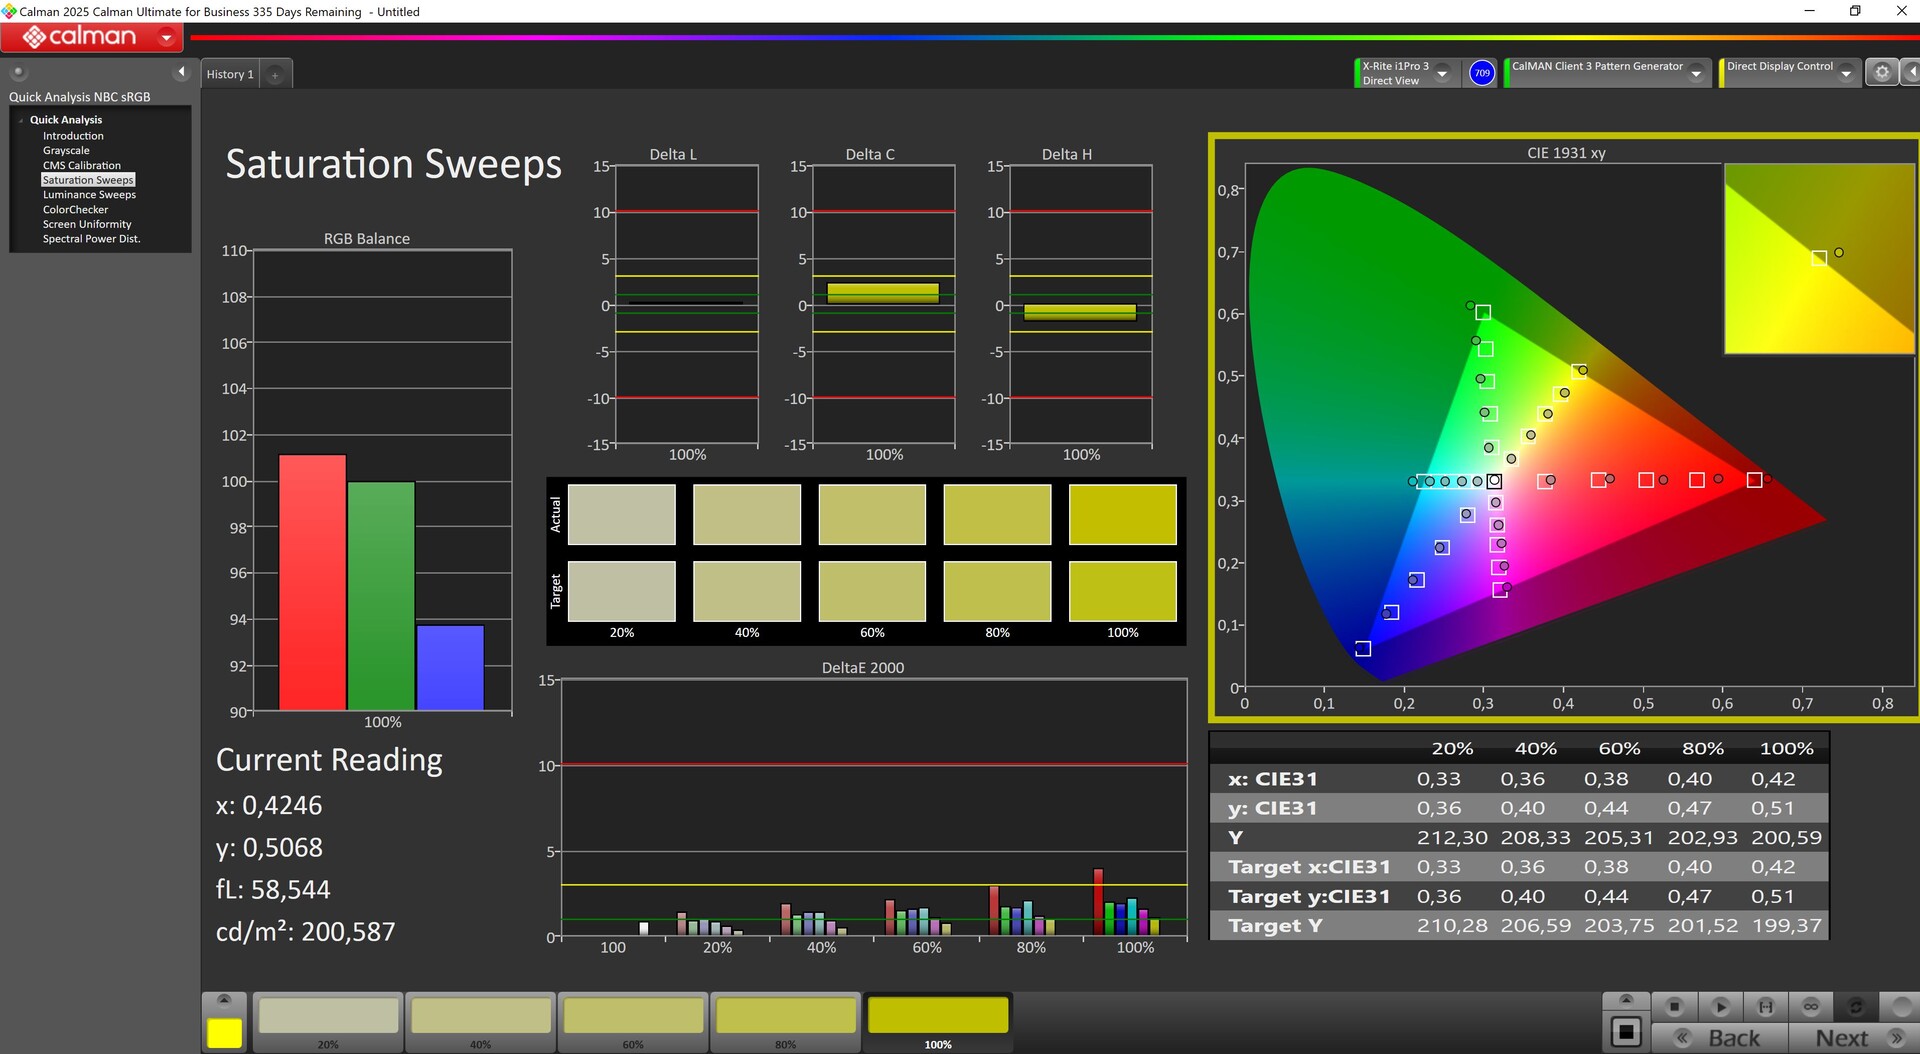
Wij hebben een goed verlichte gemiddelde helderheid van 460 nits gemeten. Het contrast is ook meer dan behoorlijk, dankzij het relatief lage zwartniveau. AdobeRGB en Display P3 worden gedekt tot ongeveer 75 procent, en sRGB bijna volledig.
De responstijden zijn echter vrij traag, en het paneel ondersteunt slechts 60 Hz.
| |||||||||||||||||||||||||
Helderheidsverdeling: 89 %
Helderheid in Batterij-modus: 456 cd/m²
Contrast: 1983:1 (Zwart: 0.23 cd/m²)
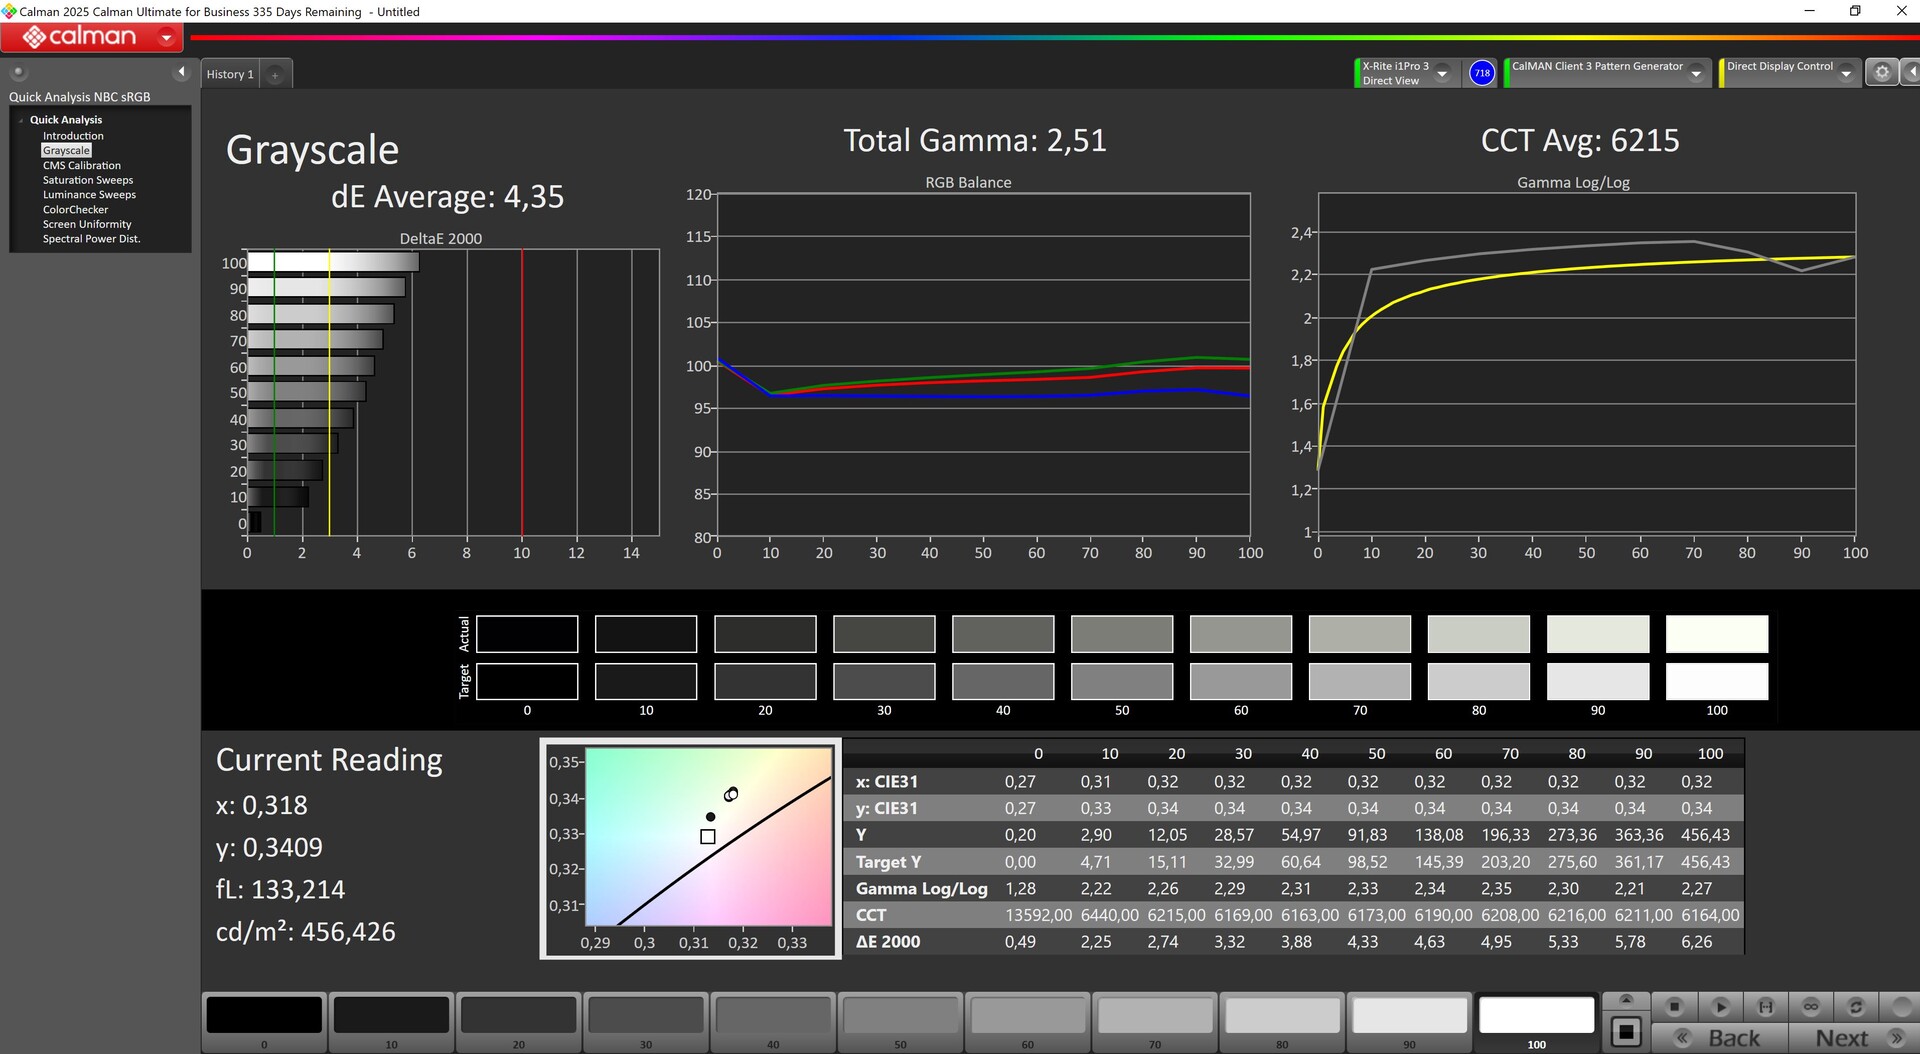
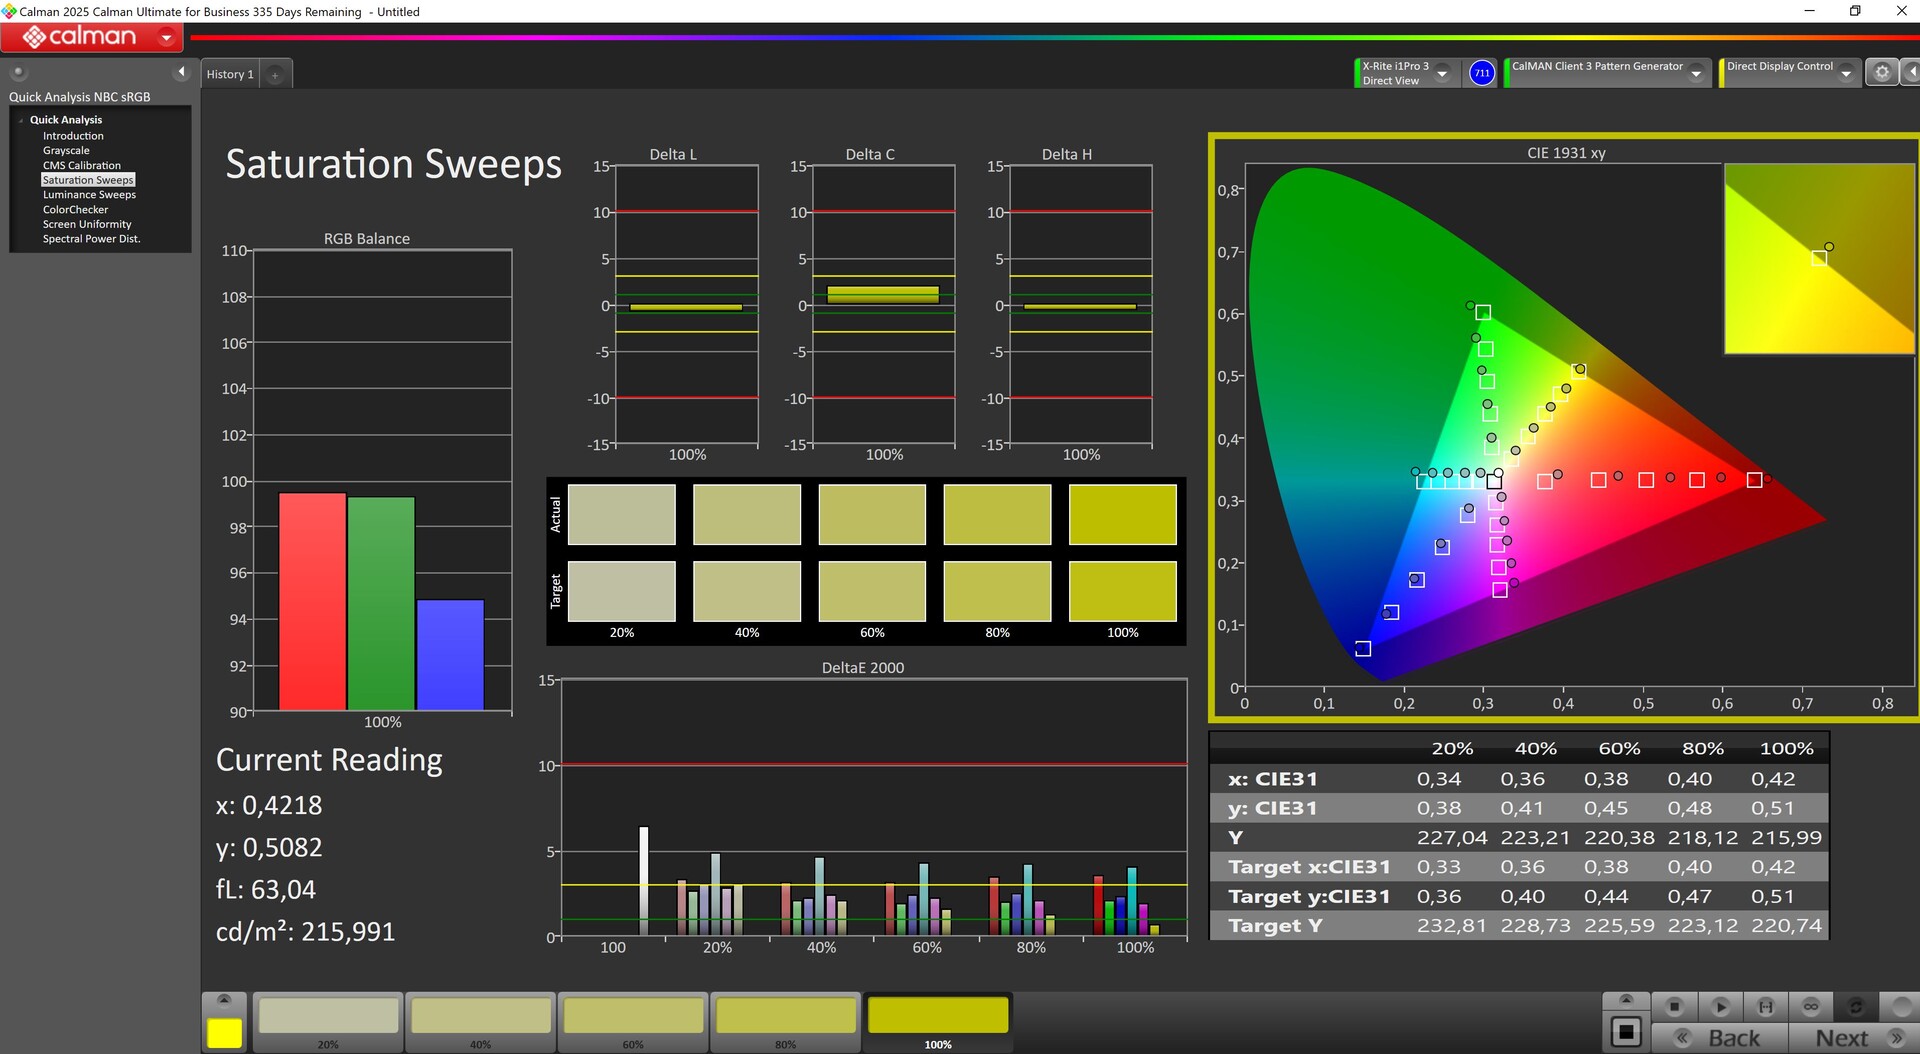
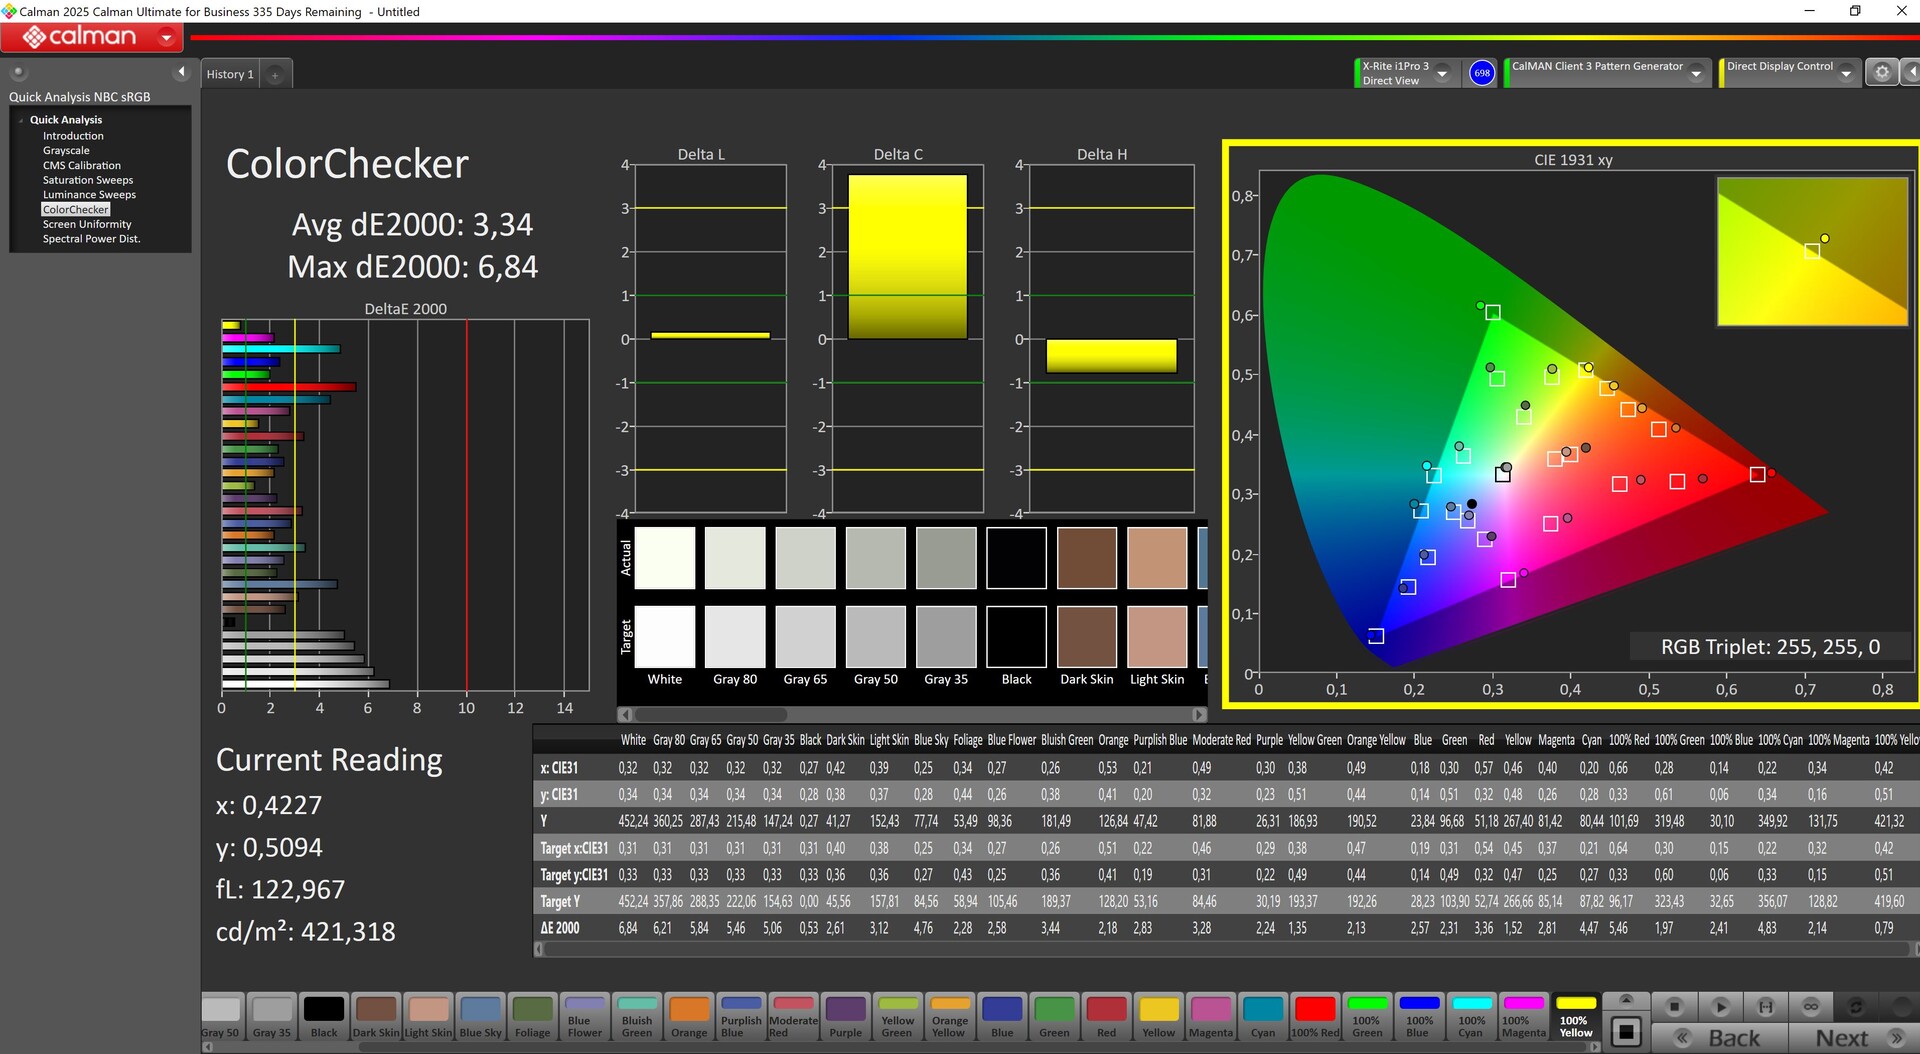
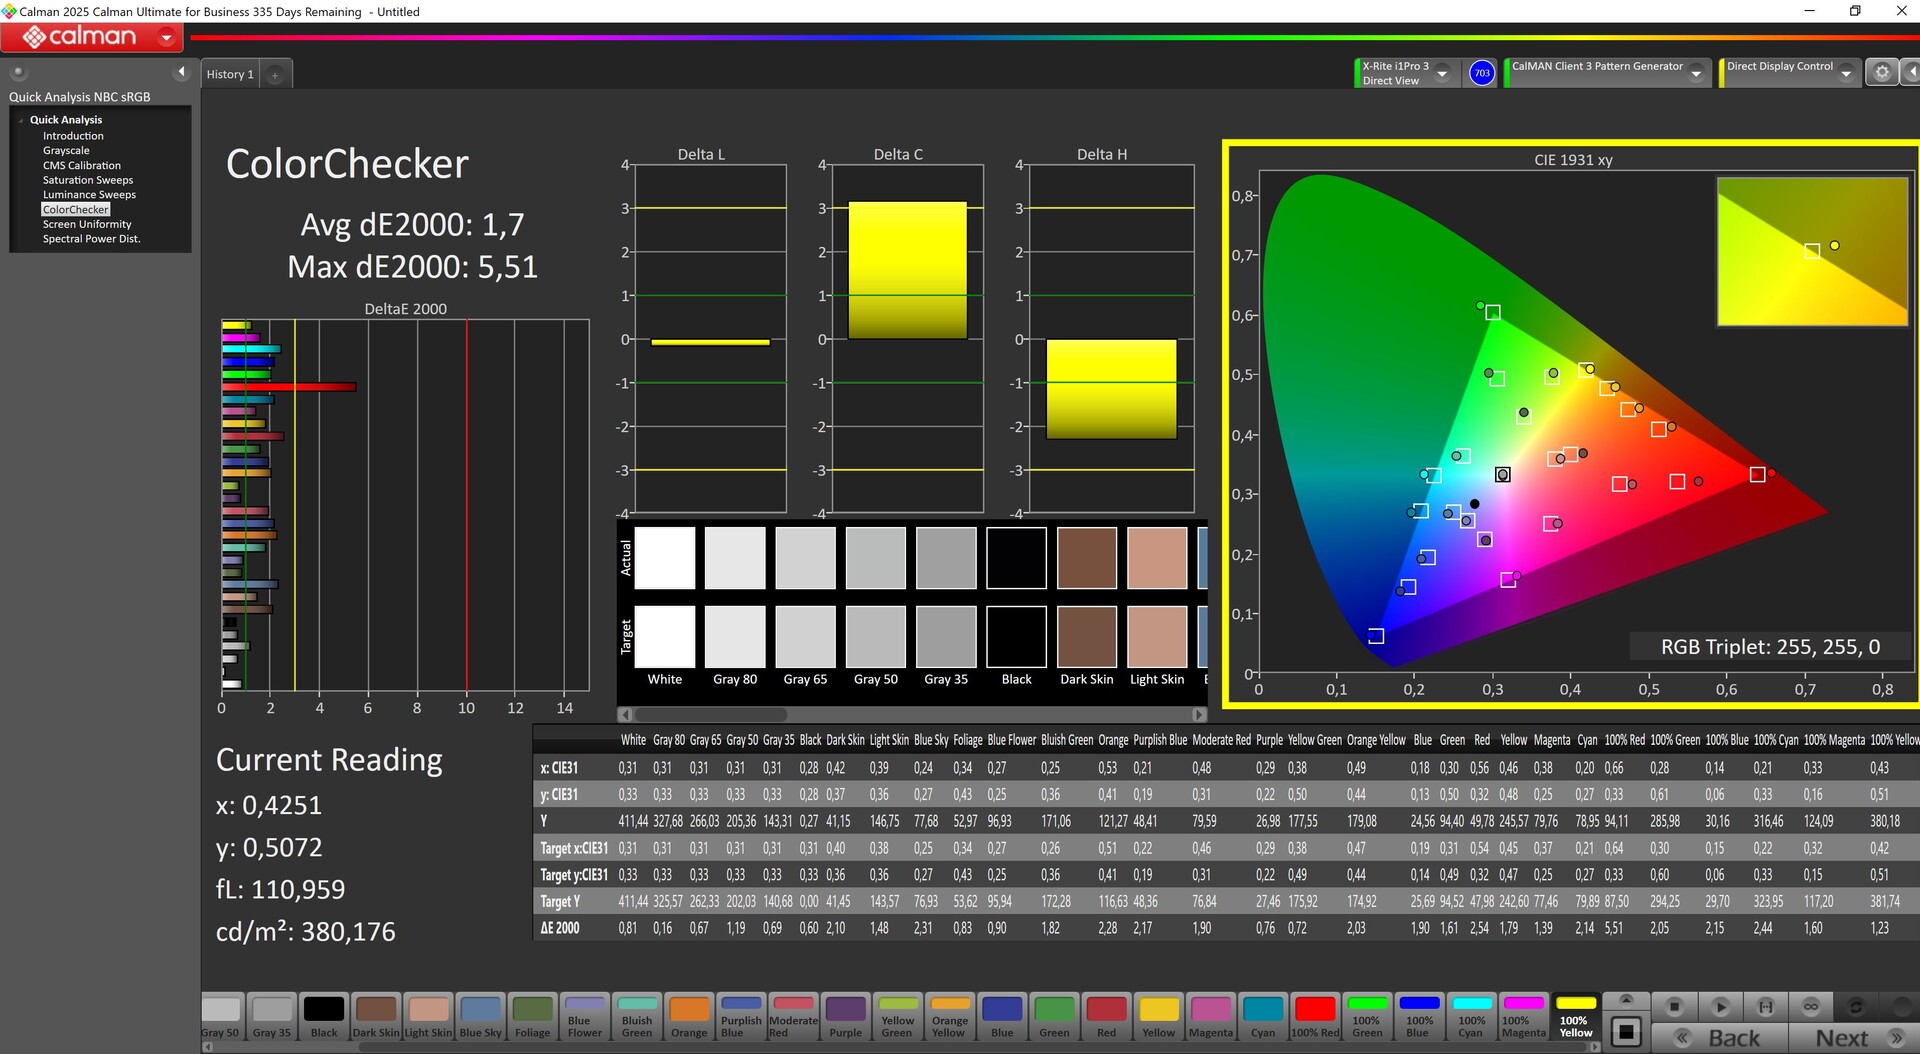
ΔE Color 3.3 | 0.5-29.43 Ø4.87, calibrated: 1.7
ΔE Greyscale 4.35 | 0.5-98 Ø5.1
75.9% AdobeRGB 1998 (Argyll 2.2.0 3D)
99.1% sRGB (Argyll 2.2.0 3D)
74.3% Display P3 (Argyll 2.2.0 3D)
Gamma: 2.51
| Dell Pro 13 Premium PA13250 B133UAN (AUOBEB0), IPS, 1920x1200, 13.3", 60 Hz | MSI Prestige 13 AI Plus Evo A2VMG ATNA33AA07-0, OLED, 2880x1800, 13.3", 60 Hz | Lenovo ThinkPad X13 2-in-1 Gen 5 Lenovo B133UAN01.2, IPS, 1920x1200, 13.3", 60 Hz | Framework Laptop 13.5 Core Ultra 7 155H BOE NE135A1M-NY1, IPS, 2880x1920, 13.5", 120 Hz | Dell XPS 13 9350 LG Philips 134WU2, IPS, 1920x1200, 13.4", 120 Hz | Microsoft Surface Pro Copilot+ LP129WT342166, IPS, 2880x1920, 13", 120 Hz | |
|---|---|---|---|---|---|---|
| Display | 20% | -4% | -2% | -6% | 6% | |
| Display P3 Coverage | 74.3 | 99.9 34% | 71.1 -4% | 72.8 -2% | 67.3 -9% | 83.4 12% |
| sRGB Coverage | 99.1 | 100 1% | 97.1 -2% | 98.6 -1% | 99 0% | 99.7 1% |
| AdobeRGB 1998 Coverage | 75.9 | 95.8 26% | 71.7 -6% | 72.9 -4% | 68.6 -10% | 79.4 5% |
| Response Times | 94% | -9% | 16% | 16% | 29% | |
| Response Time Grey 50% / Grey 80% * | 52.8 ? | 1.94 ? 96% | 50.2 ? 5% | 41.9 ? 21% | 37.3 ? 29% | 39.6 ? 25% |
| Response Time Black / White * | 26.4 ? | 2.02 ? 92% | 32.6 ? -23% | 23.7 ? 10% | 25.9 ? 2% | 18 ? 32% |
| PWM Frequency | 60 ? | |||||
| Screen | 17% | -9% | -11% | 31% | 4% | |
| Brightness middle | 456 | 382.4 -16% | 334 -27% | 498.5 9% | 462.8 1% | 585 28% |
| Brightness | 460 | 383 -17% | 308 -33% | 464 1% | 435 -5% | 574 25% |
| Brightness Distribution | 89 | 99 11% | 86 -3% | 86 -3% | 87 -2% | 89 0% |
| Black Level * | 0.23 | 0.37 -61% | 0.36 -57% | 0.19 17% | 0.56 -143% | |
| Contrast | 1983 | 903 -54% | 1385 -30% | 2436 23% | 1045 -47% | |
| Colorchecker dE 2000 * | 3.3 | 3.84 -16% | 2.36 28% | 4.27 -29% | 1.92 42% | 1.3 61% |
| Colorchecker dE 2000 max. * | 6.47 | 6.66 -3% | 4.93 24% | 7.08 -9% | 3.45 47% | 3 54% |
| Colorchecker dE 2000 calibrated * | 1.7 | 0.41 76% | 1.25 26% | 1.26 26% | 0.48 72% | |
| Greyscale dE 2000 * | 4.35 | 0.7 84% | 3.38 22% | 4.7 -8% | 0.6 86% | 2 54% |
| Gamma | 2.51 88% | 2.23 99% | 2.38 92% | 2.09 105% | 2.19 100% | 2.18 101% |
| CCT | 6215 105% | 6475 100% | 6352 102% | 7417 88% | 6539 99% | 6914 94% |
| Totaal Gemiddelde (Programma / Instellingen) | 44% /
31% | -7% /
-8% | 1% /
-5% | 14% /
21% | 13% /
8% |
* ... kleiner is beter
Uit de doos is het paneel niet bijzonder goed gekalibreerd, en hoewel onze handmatige kalibratie de DeltaE-waarden voor zowel de grijswaarden als de ColorChecker wist te verbeteren, was er nog steeds een uitschieter in het rode gebied.
Responstijd Scherm
| ↔ Responstijd Zwart naar Wit | ||
|---|---|---|
| 26.4 ms ... stijging ↗ en daling ↘ gecombineerd | ↗ 12.2 ms stijging | 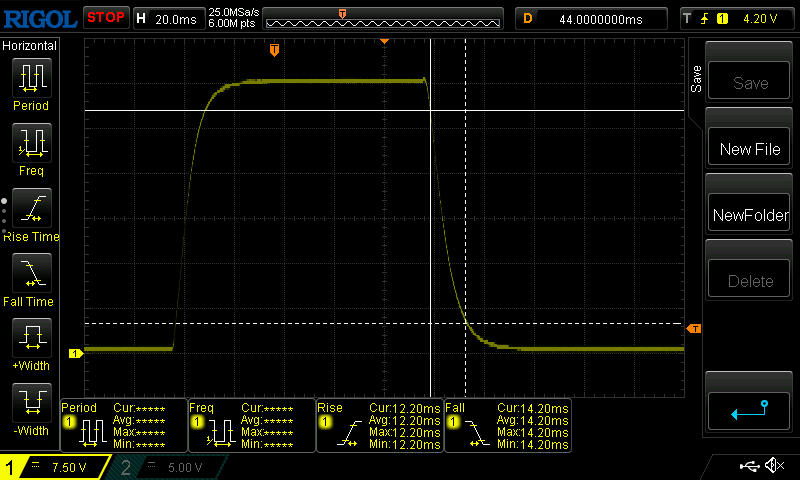 |
| ↘ 14.2 ms daling | ||
| Het scherm vertoonde relatief trage responstijden in onze tests en is misschien te traag voor games. Ter vergelijking: alle testtoestellen variëren van 0.1 (minimum) tot 240 (maximum) ms. » 63 % van alle toestellen zijn beter. Dit betekent dat de gemeten responstijd slechter is dan het gemiddelde (20.8 ms) van alle geteste toestellen. | ||
| ↔ Responstijd 50% Grijs naar 80% Grijs | ||
| 52.8 ms ... stijging ↗ en daling ↘ gecombineerd | ↗ 23.4 ms stijging | 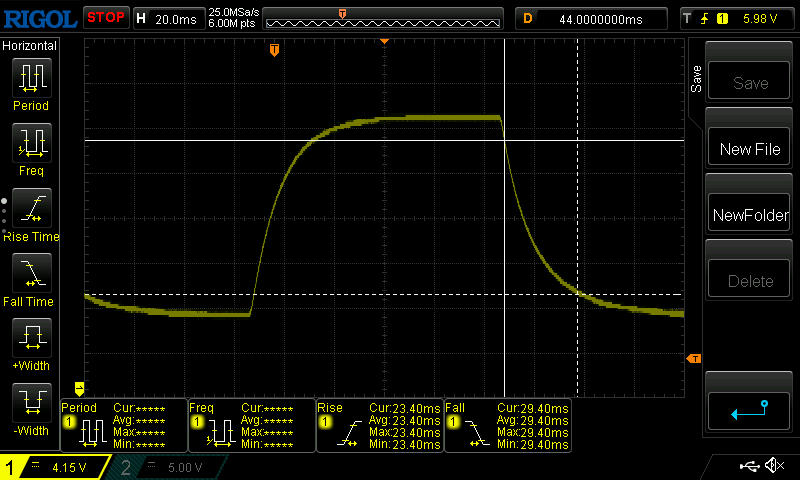 |
| ↘ 29.4 ms daling | ||
| Het scherm vertoonde trage responstijden in onze tests en is misschien te traag voor games. Ter vergelijking: alle testtoestellen variëren van 0.165 (minimum) tot 636 (maximum) ms. » 89 % van alle toestellen zijn beter. Dit betekent dat de gemeten responstijd slechter is dan het gemiddelde (32.5 ms) van alle geteste toestellen. | ||
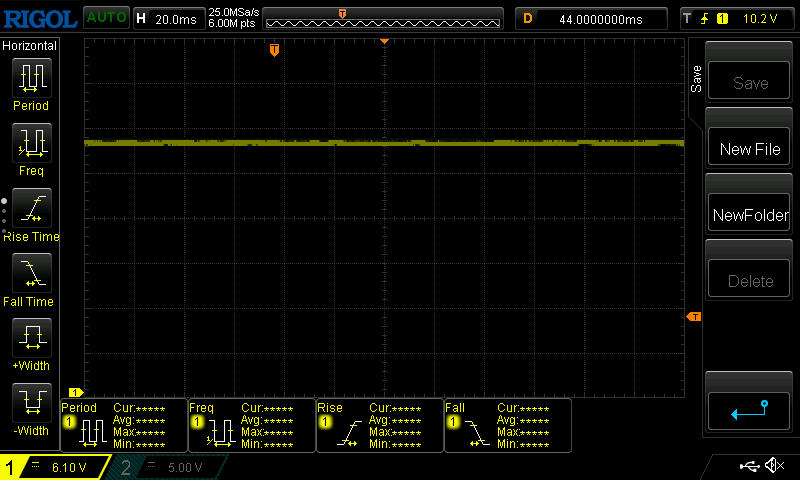
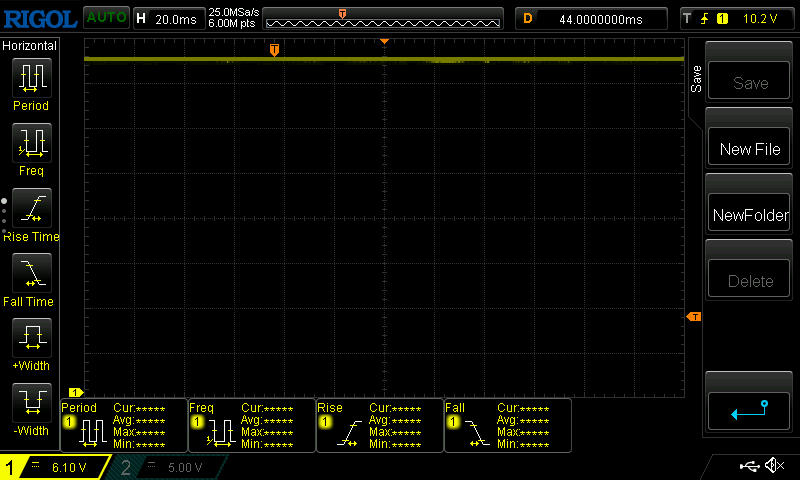
Screen Flickering / PWM (Pulse-Width Modulation)
| Screen flickering / PWM niet waargenomen |  | ||
Ter vergelijking: 53 % van alle geteste toestellen maakten geen gebruik van PWM om de schermhelderheid te verlagen. Als het wel werd gebruikt, werd een gemiddelde van 8516 (minimum: 5 - maximum: 343500) Hz waargenomen. | |||

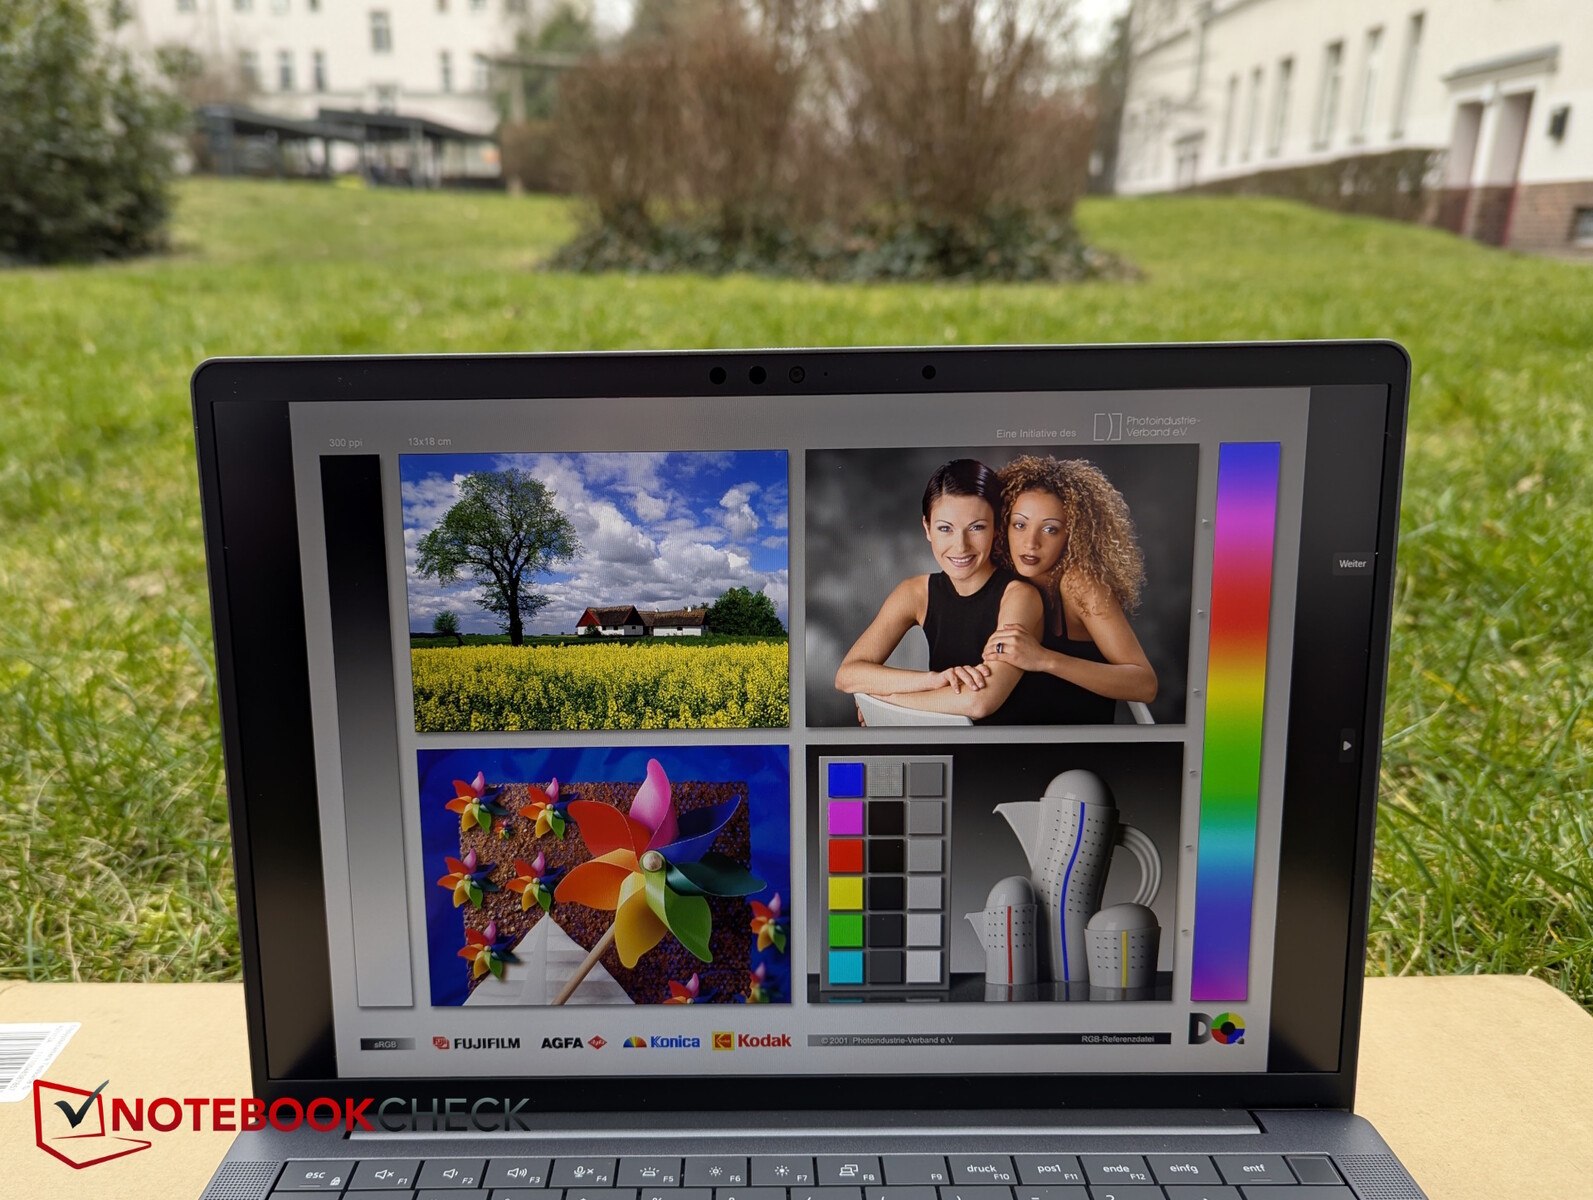
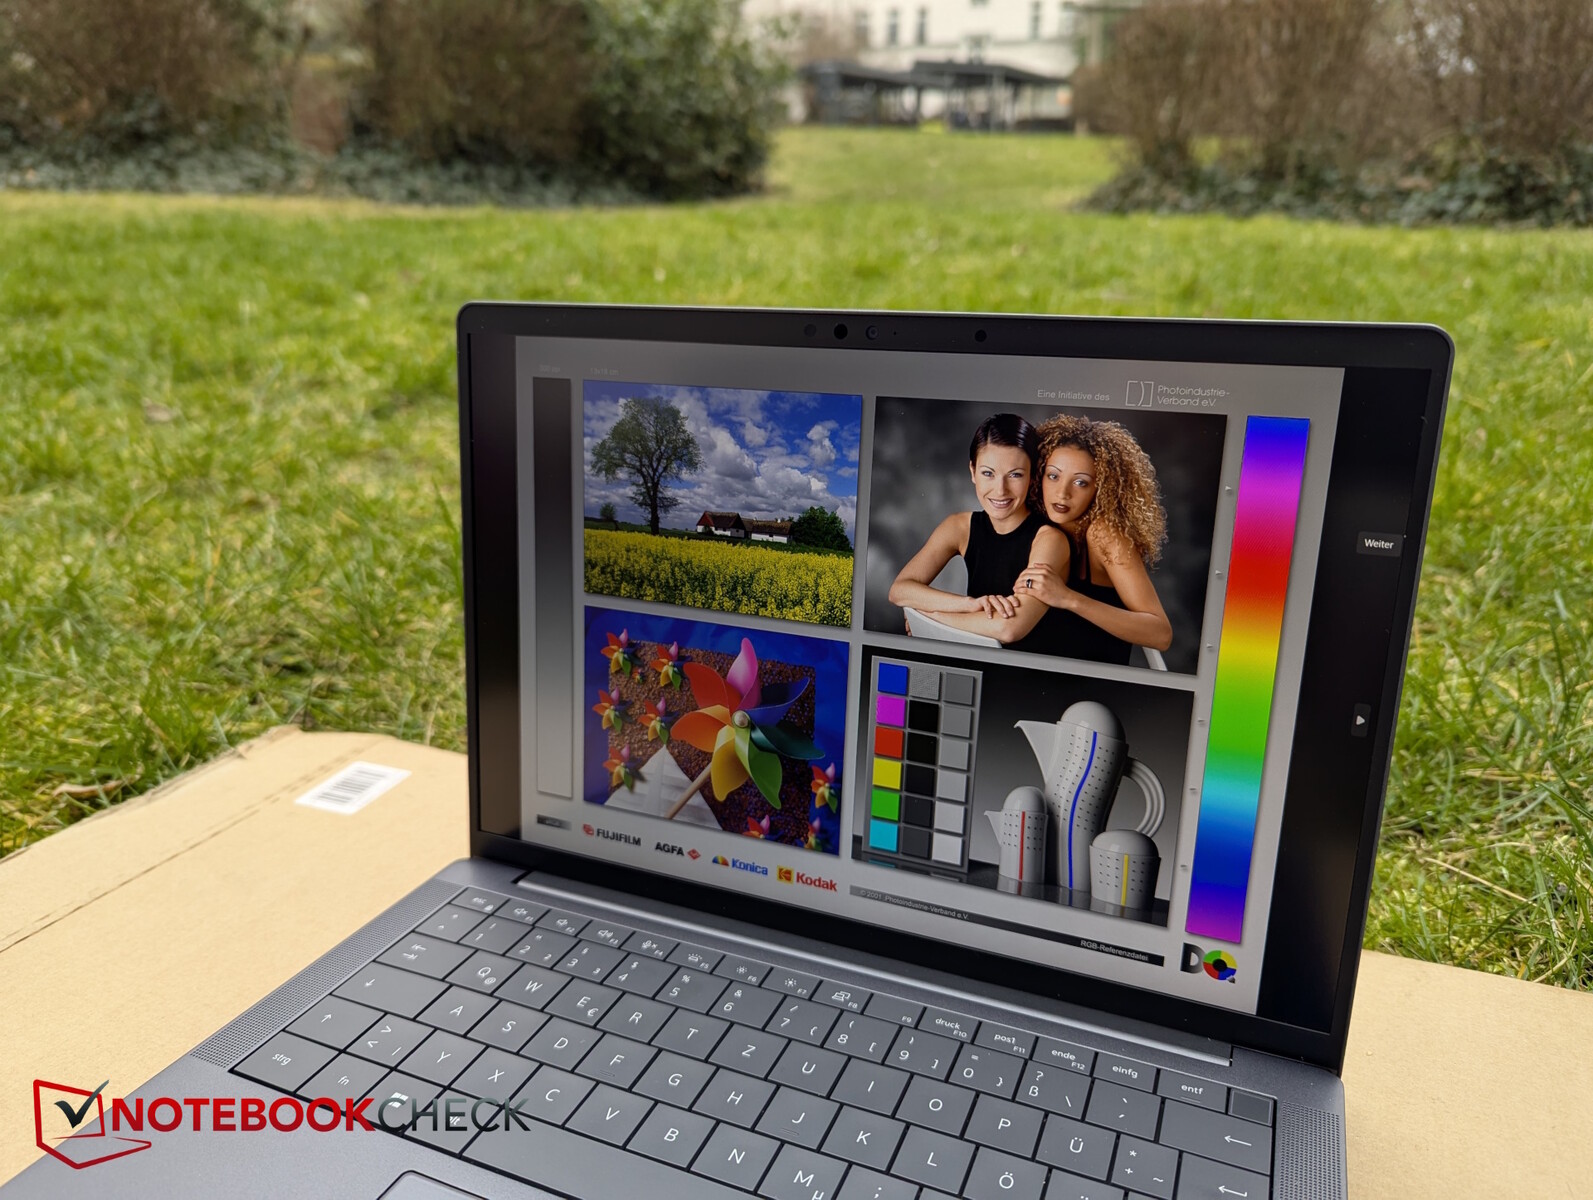
Buiten zorgen de goede helderheid en het contrast, het matte oppervlak en de goede kijkhoekstabiliteit voor een grotendeels probleemloze werking.

Prestaties - Een krachtige boog 140V
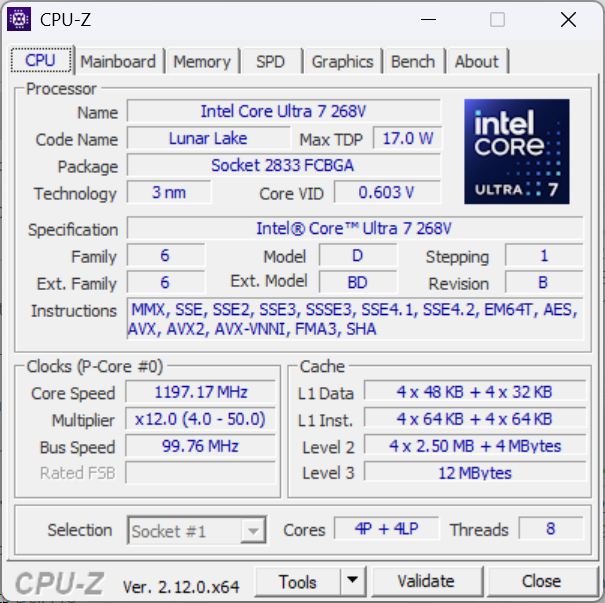
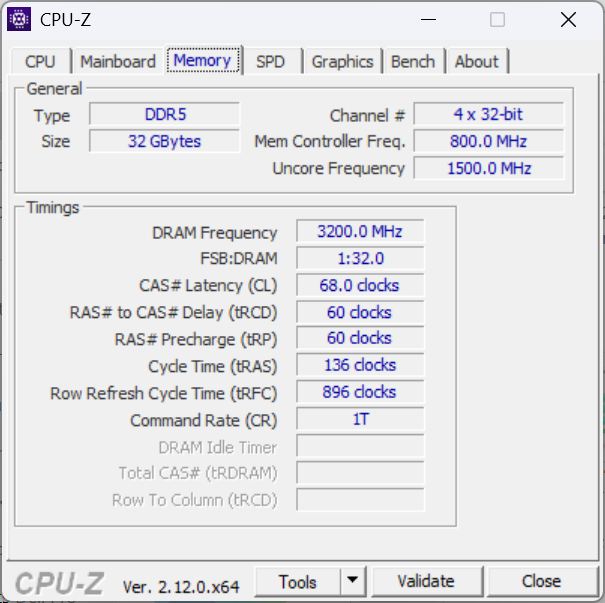
Het kloppende hart is de nieuwe Intel Core Ultra 7 268V processor die ook wordt geleverd met 32 GB ingebouwd RAM. Als alternatief is er een versie met een zwakkere Core Ultra 5 236V en 16 GB RAM. Er is ook opslagruimte beschikbaar in verschillende configuraties (256 GB, 512 GB, 1 TB). De Dell Pro 13 Premium is duidelijk gericht op mobiele zakelijke gebruikers.
Testomstandigheden
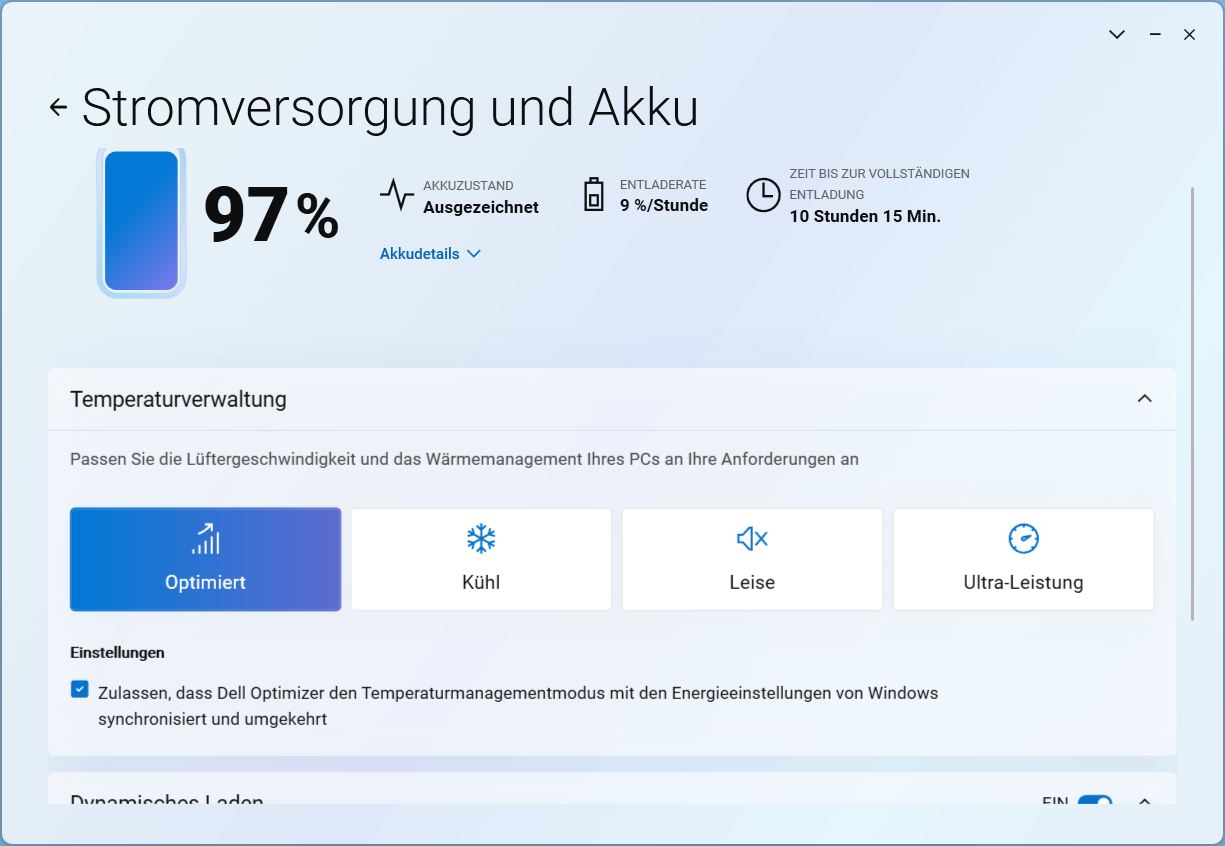
Dell Optimizer dient als controlecentrum en biedt ventilatorinstellingen die de prestaties beïnvloeden en een paar andere opties. Voor onze benchmarks hebben we de vooraf geselecteerde modus "Optimized" gebruikt.
Processor
De Intel Core Ultra 7 268V is een van de duurdere modellen in de energiezuinige Lunar Lake familie. De vier E- en vier P-kernen klokken van 2,2 GHz tot 5,0 GHz en zijn ook voorzien van een 48 TOPS NPU.
De single-core prestaties waren bijzonder indrukwekkend in elke test die we uitvoerden. In multi-core benchmarks is de CPU in de Dell Pro 13 enigszins teleurstellend en loopt vaak iets achter op de concurrentie, waarvan sommige met nominaal zwakkere processors. In batterijmodus gaat ongeveer 16 procent van de prestaties verloren.
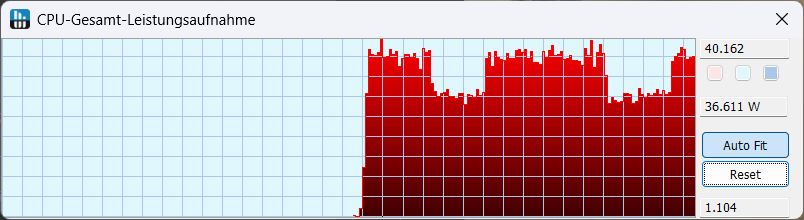
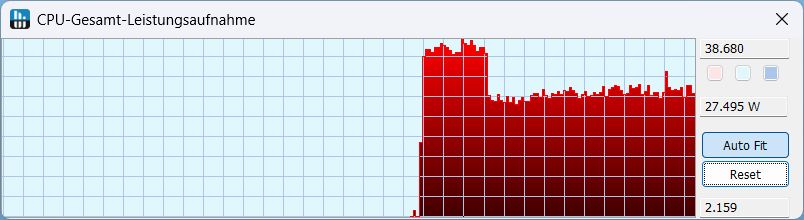
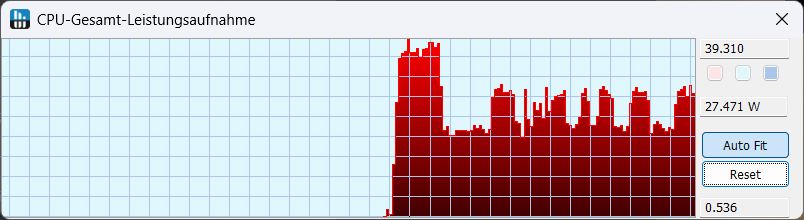
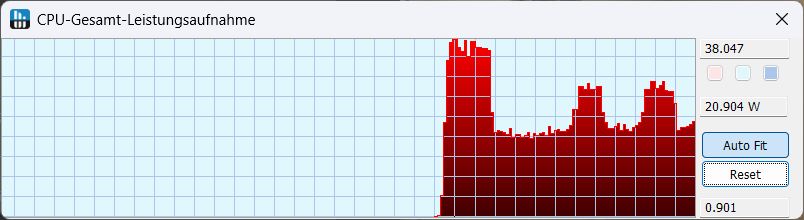
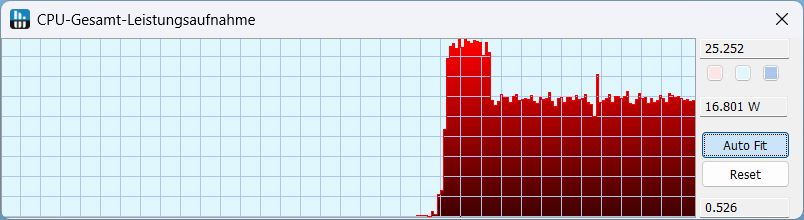
In de Cinebench R15 loop daalden de prestaties met ongeveer 28 procent (!) binnen de eerste drie runs en bleven daarna constant. In de standaard geoptimaliseerde modus lag het stroomverbruik aanvankelijk rond de 38 W en daalde daarna tot 27 W. De afbeeldingen rechts tonen het stroomverbruik in Cinebench R23, afhankelijk van de ventilatormodus.
Cinebench R15 Multi Continuous Test
Cinebench R23: Multi Core | Single Core
Cinebench R20: CPU (Multi Core) | CPU (Single Core)
Cinebench R15: CPU Multi 64Bit | CPU Single 64Bit
Blender: v2.79 BMW27 CPU
7-Zip 18.03: 7z b 4 | 7z b 4 -mmt1
Geekbench 6.4: Multi-Core | Single-Core
Geekbench 5.5: Multi-Core | Single-Core
HWBOT x265 Benchmark v2.2: 4k Preset
LibreOffice : 20 Documents To PDF
R Benchmark 2.5: Overall mean
| CPU Performance Rating | |
| Framework Laptop 13.5 Core Ultra 7 155H | |
| MSI Prestige 13 AI Plus Evo A2VMG | |
| Dell XPS 13 9350 | |
| Gemiddeld Intel Core Ultra 7 268V | |
| Gemiddelde van klas Subnotebook | |
| Dell Pro 13 Premium PA13250 | |
| Lenovo ThinkPad X13 2-in-1 Gen 5 | |
| Microsoft Surface Pro Copilot+ -2! | |
| Cinebench R23 / Multi Core | |
| Framework Laptop 13.5 Core Ultra 7 155H | |
| Gemiddelde van klas Subnotebook (1555 - 21812, n=76, laatste 2 jaar) | |
| MSI Prestige 13 AI Plus Evo A2VMG | |
| Dell XPS 13 9350 | |
| Gemiddeld Intel Core Ultra 7 268V (9835 - 10535, n=2) | |
| Dell Pro 13 Premium PA13250 | |
| Microsoft Surface Pro Copilot+ | |
| Lenovo ThinkPad X13 2-in-1 Gen 5 | |
| Cinebench R23 / Single Core | |
| Dell Pro 13 Premium PA13250 | |
| Gemiddeld Intel Core Ultra 7 268V (1910 - 1985, n=2) | |
| Dell XPS 13 9350 | |
| MSI Prestige 13 AI Plus Evo A2VMG | |
| Framework Laptop 13.5 Core Ultra 7 155H | |
| Gemiddelde van klas Subnotebook (358 - 2165, n=76, laatste 2 jaar) | |
| Lenovo ThinkPad X13 2-in-1 Gen 5 | |
| Microsoft Surface Pro Copilot+ | |
| Cinebench R20 / CPU (Multi Core) | |
| Framework Laptop 13.5 Core Ultra 7 155H | |
| Gemiddelde van klas Subnotebook (579 - 8541, n=71, laatste 2 jaar) | |
| MSI Prestige 13 AI Plus Evo A2VMG | |
| Dell XPS 13 9350 | |
| Gemiddeld Intel Core Ultra 7 268V (3811 - 4129, n=2) | |
| Dell Pro 13 Premium PA13250 | |
| Lenovo ThinkPad X13 2-in-1 Gen 5 | |
| Microsoft Surface Pro Copilot+ | |
| Cinebench R20 / CPU (Single Core) | |
| Dell Pro 13 Premium PA13250 | |
| Gemiddeld Intel Core Ultra 7 268V (736 - 764, n=2) | |
| Dell XPS 13 9350 | |
| MSI Prestige 13 AI Plus Evo A2VMG | |
| Framework Laptop 13.5 Core Ultra 7 155H | |
| Gemiddelde van klas Subnotebook (128 - 826, n=71, laatste 2 jaar) | |
| Lenovo ThinkPad X13 2-in-1 Gen 5 | |
| Microsoft Surface Pro Copilot+ | |
| Cinebench R15 / CPU Multi 64Bit | |
| Framework Laptop 13.5 Core Ultra 7 155H | |
| Microsoft Surface Pro Copilot+ | |
| Gemiddelde van klas Subnotebook (327 - 3345, n=77, laatste 2 jaar) | |
| MSI Prestige 13 AI Plus Evo A2VMG | |
| Gemiddeld Intel Core Ultra 7 268V (1601 - 1616, n=2) | |
| Dell Pro 13 Premium PA13250 | |
| Dell XPS 13 9350 | |
| Lenovo ThinkPad X13 2-in-1 Gen 5 | |
| Cinebench R15 / CPU Single 64Bit | |
| Dell Pro 13 Premium PA13250 | |
| Gemiddeld Intel Core Ultra 7 268V (287 - 302, n=2) | |
| Dell XPS 13 9350 | |
| MSI Prestige 13 AI Plus Evo A2VMG | |
| Framework Laptop 13.5 Core Ultra 7 155H | |
| Gemiddelde van klas Subnotebook (72.4 - 322, n=72, laatste 2 jaar) | |
| Lenovo ThinkPad X13 2-in-1 Gen 5 | |
| Microsoft Surface Pro Copilot+ | |
| Blender / v2.79 BMW27 CPU | |
| Dell Pro 13 Premium PA13250 | |
| Microsoft Surface Pro Copilot+ | |
| Lenovo ThinkPad X13 2-in-1 Gen 5 | |
| Gemiddelde van klas Subnotebook (159 - 2271, n=75, laatste 2 jaar) | |
| Gemiddeld Intel Core Ultra 7 268V (337 - 410, n=2) | |
| Dell XPS 13 9350 | |
| MSI Prestige 13 AI Plus Evo A2VMG | |
| Framework Laptop 13.5 Core Ultra 7 155H | |
| 7-Zip 18.03 / 7z b 4 | |
| Framework Laptop 13.5 Core Ultra 7 155H | |
| Gemiddelde van klas Subnotebook (11668 - 77867, n=67, laatste 2 jaar) | |
| Microsoft Surface Pro Copilot+ | |
| Dell XPS 13 9350 | |
| MSI Prestige 13 AI Plus Evo A2VMG | |
| Gemiddeld Intel Core Ultra 7 268V (32797 - 35687, n=2) | |
| Dell Pro 13 Premium PA13250 | |
| Lenovo ThinkPad X13 2-in-1 Gen 5 | |
| 7-Zip 18.03 / 7z b 4 -mmt1 | |
| Gemiddeld Intel Core Ultra 7 268V (5884 - 6021, n=2) | |
| Dell Pro 13 Premium PA13250 | |
| Dell XPS 13 9350 | |
| MSI Prestige 13 AI Plus Evo A2VMG | |
| Gemiddelde van klas Subnotebook (2643 - 6442, n=69, laatste 2 jaar) | |
| Framework Laptop 13.5 Core Ultra 7 155H | |
| Microsoft Surface Pro Copilot+ | |
| Lenovo ThinkPad X13 2-in-1 Gen 5 | |
| Geekbench 6.4 / Multi-Core | |
| Microsoft Surface Pro Copilot+ | |
| Framework Laptop 13.5 Core Ultra 7 155H | |
| Gemiddelde van klas Subnotebook (2244 - 17489, n=72, laatste 2 jaar) | |
| MSI Prestige 13 AI Plus Evo A2VMG | |
| Dell XPS 13 9350 | |
| Gemiddeld Intel Core Ultra 7 268V (10589 - 11279, n=3) | |
| Dell Pro 13 Premium PA13250 | |
| Lenovo ThinkPad X13 2-in-1 Gen 5 | |
| Geekbench 6.4 / Single-Core | |
| Dell Pro 13 Premium PA13250 | |
| Dell XPS 13 9350 | |
| Gemiddeld Intel Core Ultra 7 268V (2583 - 2871, n=3) | |
| MSI Prestige 13 AI Plus Evo A2VMG | |
| Gemiddelde van klas Subnotebook (960 - 3655, n=67, laatste 2 jaar) | |
| Microsoft Surface Pro Copilot+ | |
| Framework Laptop 13.5 Core Ultra 7 155H | |
| Lenovo ThinkPad X13 2-in-1 Gen 5 | |
| Lenovo ThinkPad X13 2-in-1 Gen 5 | |
| Geekbench 5.5 / Multi-Core | |
| Framework Laptop 13.5 Core Ultra 7 155H | |
| Gemiddelde van klas Subnotebook (2557 - 17218, n=68, laatste 2 jaar) | |
| Gemiddeld Intel Core Ultra 7 268V (9491 - 9801, n=3) | |
| MSI Prestige 13 AI Plus Evo A2VMG | |
| Dell Pro 13 Premium PA13250 | |
| Dell XPS 13 9350 | |
| Lenovo ThinkPad X13 2-in-1 Gen 5 | |
| Geekbench 5.5 / Single-Core | |
| Gemiddeld Intel Core Ultra 7 268V (2008 - 2091, n=3) | |
| Dell XPS 13 9350 | |
| Dell Pro 13 Premium PA13250 | |
| MSI Prestige 13 AI Plus Evo A2VMG | |
| Gemiddelde van klas Subnotebook (726 - 2350, n=68, laatste 2 jaar) | |
| Framework Laptop 13.5 Core Ultra 7 155H | |
| Lenovo ThinkPad X13 2-in-1 Gen 5 | |
| HWBOT x265 Benchmark v2.2 / 4k Preset | |
| MSI Prestige 13 AI Plus Evo A2VMG | |
| Framework Laptop 13.5 Core Ultra 7 155H | |
| Dell XPS 13 9350 | |
| Gemiddelde van klas Subnotebook (0.97 - 25.1, n=70, laatste 2 jaar) | |
| Gemiddeld Intel Core Ultra 7 268V (10.4 - 12.9, n=2) | |
| Dell Pro 13 Premium PA13250 | |
| Lenovo ThinkPad X13 2-in-1 Gen 5 | |
| Microsoft Surface Pro Copilot+ | |
| LibreOffice / 20 Documents To PDF | |
| Dell Pro 13 Premium PA13250 | |
| Microsoft Surface Pro Copilot+ | |
| Lenovo ThinkPad X13 2-in-1 Gen 5 | |
| Gemiddelde van klas Subnotebook (38.5 - 220, n=68, laatste 2 jaar) | |
| Gemiddeld Intel Core Ultra 7 268V (48 - 60.8, n=2) | |
| Dell XPS 13 9350 | |
| MSI Prestige 13 AI Plus Evo A2VMG | |
| Framework Laptop 13.5 Core Ultra 7 155H | |
| R Benchmark 2.5 / Overall mean | |
| Microsoft Surface Pro Copilot+ | |
| Lenovo ThinkPad X13 2-in-1 Gen 5 | |
| Gemiddelde van klas Subnotebook (0.403 - 1.456, n=70, laatste 2 jaar) | |
| Framework Laptop 13.5 Core Ultra 7 155H | |
| MSI Prestige 13 AI Plus Evo A2VMG | |
| Dell XPS 13 9350 | |
| Gemiddeld Intel Core Ultra 7 268V (0.4344 - 0.4565, n=2) | |
| Dell Pro 13 Premium PA13250 | |
* ... kleiner is beter
AIDA64: FP32 Ray-Trace | FPU Julia | CPU SHA3 | CPU Queen | FPU SinJulia | FPU Mandel | CPU AES | CPU ZLib | FP64 Ray-Trace | CPU PhotoWorxx
| Performance Rating | |
| Framework Laptop 13.5 Core Ultra 7 155H | |
| Gemiddelde van klas Subnotebook | |
| MSI Prestige 13 AI Plus Evo A2VMG | |
| Dell XPS 13 9350 | |
| Gemiddeld Intel Core Ultra 7 268V | |
| Dell Pro 13 Premium PA13250 | |
| Lenovo ThinkPad X13 2-in-1 Gen 5 | |
| Microsoft Surface Pro Copilot+ | |
| AIDA64 / FP32 Ray-Trace | |
| Gemiddelde van klas Subnotebook (1135 - 32888, n=70, laatste 2 jaar) | |
| MSI Prestige 13 AI Plus Evo A2VMG | |
| Dell XPS 13 9350 | |
| Framework Laptop 13.5 Core Ultra 7 155H | |
| Gemiddeld Intel Core Ultra 7 268V (10556 - 11547, n=2) | |
| Dell Pro 13 Premium PA13250 | |
| Microsoft Surface Pro Copilot+ | |
| Lenovo ThinkPad X13 2-in-1 Gen 5 | |
| AIDA64 / FPU Julia | |
| MSI Prestige 13 AI Plus Evo A2VMG | |
| Dell XPS 13 9350 | |
| Framework Laptop 13.5 Core Ultra 7 155H | |
| Gemiddelde van klas Subnotebook (5218 - 123315, n=70, laatste 2 jaar) | |
| Gemiddeld Intel Core Ultra 7 268V (47659 - 56299, n=2) | |
| Dell Pro 13 Premium PA13250 | |
| Lenovo ThinkPad X13 2-in-1 Gen 5 | |
| Microsoft Surface Pro Copilot+ | |
| AIDA64 / CPU SHA3 | |
| Gemiddelde van klas Subnotebook (444 - 5287, n=70, laatste 2 jaar) | |
| MSI Prestige 13 AI Plus Evo A2VMG | |
| Framework Laptop 13.5 Core Ultra 7 155H | |
| Dell XPS 13 9350 | |
| Gemiddeld Intel Core Ultra 7 268V (2117 - 2538, n=2) | |
| Dell Pro 13 Premium PA13250 | |
| Lenovo ThinkPad X13 2-in-1 Gen 5 | |
| Microsoft Surface Pro Copilot+ | |
| AIDA64 / CPU Queen | |
| Framework Laptop 13.5 Core Ultra 7 155H | |
| Gemiddelde van klas Subnotebook (10579 - 115682, n=70, laatste 2 jaar) | |
| Microsoft Surface Pro Copilot+ | |
| MSI Prestige 13 AI Plus Evo A2VMG | |
| Dell Pro 13 Premium PA13250 | |
| Gemiddeld Intel Core Ultra 7 268V (49645 - 49759, n=2) | |
| Dell XPS 13 9350 | |
| Lenovo ThinkPad X13 2-in-1 Gen 5 | |
| AIDA64 / FPU SinJulia | |
| Framework Laptop 13.5 Core Ultra 7 155H | |
| Gemiddelde van klas Subnotebook (744 - 18418, n=70, laatste 2 jaar) | |
| Lenovo ThinkPad X13 2-in-1 Gen 5 | |
| Dell XPS 13 9350 | |
| MSI Prestige 13 AI Plus Evo A2VMG | |
| Gemiddeld Intel Core Ultra 7 268V (4353 - 4426, n=2) | |
| Dell Pro 13 Premium PA13250 | |
| Microsoft Surface Pro Copilot+ | |
| AIDA64 / FPU Mandel | |
| MSI Prestige 13 AI Plus Evo A2VMG | |
| Dell XPS 13 9350 | |
| Gemiddelde van klas Subnotebook (3341 - 65433, n=70, laatste 2 jaar) | |
| Framework Laptop 13.5 Core Ultra 7 155H | |
| Gemiddeld Intel Core Ultra 7 268V (25929 - 29637, n=2) | |
| Dell Pro 13 Premium PA13250 | |
| Lenovo ThinkPad X13 2-in-1 Gen 5 | |
| Microsoft Surface Pro Copilot+ | |
| AIDA64 / CPU AES | |
| Framework Laptop 13.5 Core Ultra 7 155H | |
| Microsoft Surface Pro Copilot+ | |
| Gemiddelde van klas Subnotebook (638 - 161430, n=70, laatste 2 jaar) | |
| Dell XPS 13 9350 | |
| MSI Prestige 13 AI Plus Evo A2VMG | |
| Lenovo ThinkPad X13 2-in-1 Gen 5 | |
| Gemiddeld Intel Core Ultra 7 268V (33196 - 38706, n=2) | |
| Dell Pro 13 Premium PA13250 | |
| AIDA64 / CPU ZLib | |
| Framework Laptop 13.5 Core Ultra 7 155H | |
| Gemiddelde van klas Subnotebook (164.9 - 1379, n=70, laatste 2 jaar) | |
| Microsoft Surface Pro Copilot+ | |
| MSI Prestige 13 AI Plus Evo A2VMG | |
| Dell XPS 13 9350 | |
| Lenovo ThinkPad X13 2-in-1 Gen 5 | |
| Gemiddeld Intel Core Ultra 7 268V (441 - 583, n=2) | |
| Dell Pro 13 Premium PA13250 | |
| AIDA64 / FP64 Ray-Trace | |
| MSI Prestige 13 AI Plus Evo A2VMG | |
| Gemiddelde van klas Subnotebook (610 - 17495, n=70, laatste 2 jaar) | |
| Dell XPS 13 9350 | |
| Gemiddeld Intel Core Ultra 7 268V (5938 - 6214, n=2) | |
| Framework Laptop 13.5 Core Ultra 7 155H | |
| Dell Pro 13 Premium PA13250 | |
| Lenovo ThinkPad X13 2-in-1 Gen 5 | |
| Microsoft Surface Pro Copilot+ | |
| AIDA64 / CPU PhotoWorxx | |
| MSI Prestige 13 AI Plus Evo A2VMG | |
| Dell XPS 13 9350 | |
| Gemiddeld Intel Core Ultra 7 268V (46733 - 53540, n=2) | |
| Dell Pro 13 Premium PA13250 | |
| Framework Laptop 13.5 Core Ultra 7 155H | |
| Gemiddelde van klas Subnotebook (6569 - 64588, n=70, laatste 2 jaar) | |
| Lenovo ThinkPad X13 2-in-1 Gen 5 | |
| Microsoft Surface Pro Copilot+ | |
Systeemprestaties
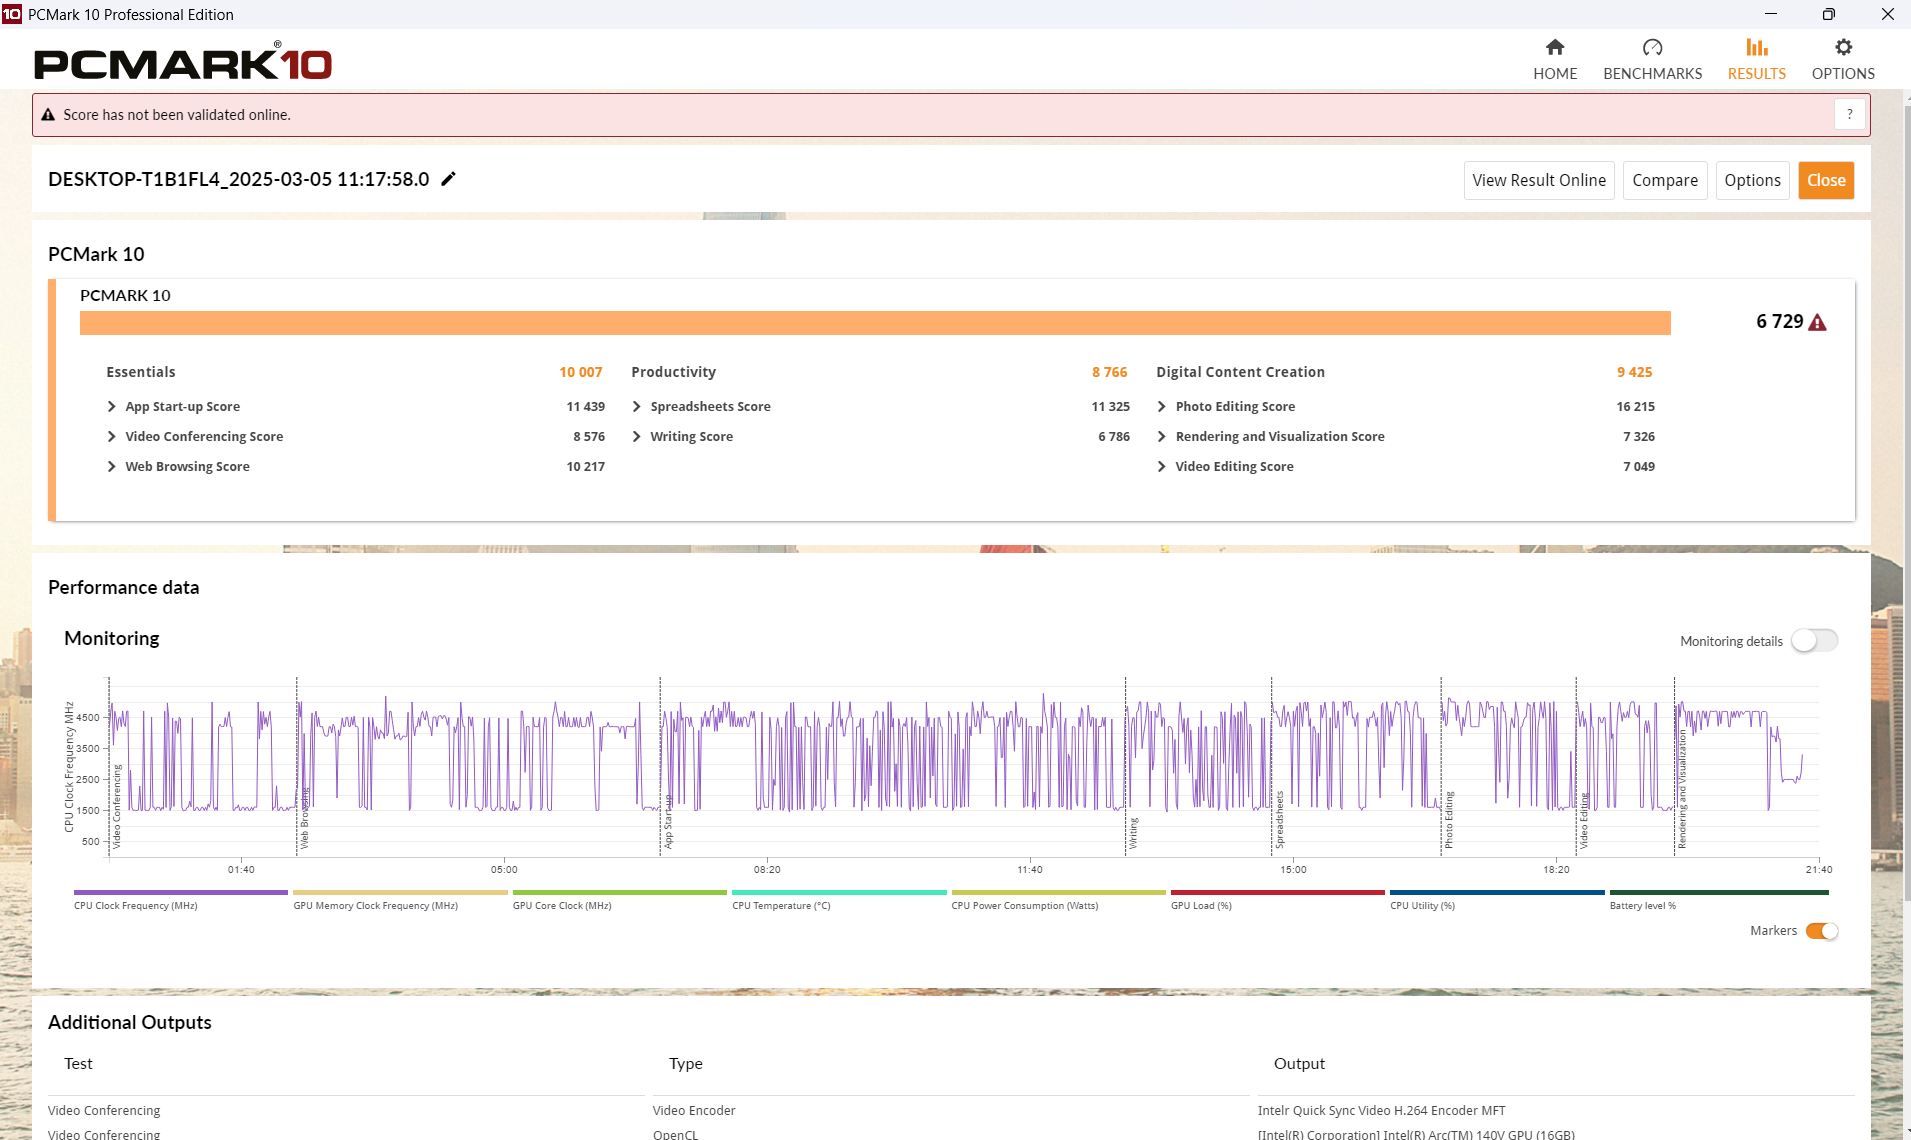
In PCMark 10 en CrossMark liggen de vergelijkingsapparaten dicht bij elkaar, maar zowel in dit gebied als in de webtests staat onze Dell Pro meer in het midden dan dat hij voor de toppositie gaat.
CrossMark: Overall | Productivity | Creativity | Responsiveness
WebXPRT 3: Overall
WebXPRT 4: Overall
Mozilla Kraken 1.1: Total
| PCMark 10 / Score | |
| Gemiddeld Intel Core Ultra 7 268V, Intel Arc Graphics 140V (6729 - 7236, n=2) | |
| Dell XPS 13 9350 | |
| Framework Laptop 13.5 Core Ultra 7 155H | |
| MSI Prestige 13 AI Plus Evo A2VMG | |
| Dell Pro 13 Premium PA13250 | |
| Gemiddelde van klas Subnotebook (4993 - 7788, n=59, laatste 2 jaar) | |
| Lenovo ThinkPad X13 2-in-1 Gen 5 | |
| PCMark 10 / Essentials | |
| Lenovo ThinkPad X13 2-in-1 Gen 5 | |
| Framework Laptop 13.5 Core Ultra 7 155H | |
| Gemiddelde van klas Subnotebook (9363 - 11331, n=59, laatste 2 jaar) | |
| Gemiddeld Intel Core Ultra 7 268V, Intel Arc Graphics 140V (10007 - 10701, n=2) | |
| MSI Prestige 13 AI Plus Evo A2VMG | |
| Dell Pro 13 Premium PA13250 | |
| Dell XPS 13 9350 | |
| PCMark 10 / Productivity | |
| Dell XPS 13 9350 | |
| Gemiddeld Intel Core Ultra 7 268V, Intel Arc Graphics 140V (8766 - 9217, n=2) | |
| Dell Pro 13 Premium PA13250 | |
| Framework Laptop 13.5 Core Ultra 7 155H | |
| Gemiddelde van klas Subnotebook (5435 - 10623, n=59, laatste 2 jaar) | |
| MSI Prestige 13 AI Plus Evo A2VMG | |
| Lenovo ThinkPad X13 2-in-1 Gen 5 | |
| PCMark 10 / Digital Content Creation | |
| MSI Prestige 13 AI Plus Evo A2VMG | |
| Gemiddeld Intel Core Ultra 7 268V, Intel Arc Graphics 140V (9425 - 10427, n=2) | |
| Dell XPS 13 9350 | |
| Framework Laptop 13.5 Core Ultra 7 155H | |
| Dell Pro 13 Premium PA13250 | |
| Gemiddelde van klas Subnotebook (5305 - 12442, n=59, laatste 2 jaar) | |
| Lenovo ThinkPad X13 2-in-1 Gen 5 | |
| CrossMark / Overall | |
| Dell XPS 13 9350 | |
| MSI Prestige 13 AI Plus Evo A2VMG | |
| Gemiddeld Intel Core Ultra 7 268V, Intel Arc Graphics 140V (1643 - 1738, n=2) | |
| Framework Laptop 13.5 Core Ultra 7 155H | |
| Dell Pro 13 Premium PA13250 | |
| Gemiddelde van klas Subnotebook (365 - 2018, n=68, laatste 2 jaar) | |
| Lenovo ThinkPad X13 2-in-1 Gen 5 | |
| Microsoft Surface Pro Copilot+ | |
| CrossMark / Productivity | |
| Dell XPS 13 9350 | |
| MSI Prestige 13 AI Plus Evo A2VMG | |
| Gemiddeld Intel Core Ultra 7 268V, Intel Arc Graphics 140V (1577 - 1680, n=2) | |
| Framework Laptop 13.5 Core Ultra 7 155H | |
| Dell Pro 13 Premium PA13250 | |
| Lenovo ThinkPad X13 2-in-1 Gen 5 | |
| Gemiddelde van klas Subnotebook (364 - 1875, n=68, laatste 2 jaar) | |
| Microsoft Surface Pro Copilot+ | |
| CrossMark / Creativity | |
| MSI Prestige 13 AI Plus Evo A2VMG | |
| Dell XPS 13 9350 | |
| Gemiddeld Intel Core Ultra 7 268V, Intel Arc Graphics 140V (1866 - 1976, n=2) | |
| Framework Laptop 13.5 Core Ultra 7 155H | |
| Dell Pro 13 Premium PA13250 | |
| Gemiddelde van klas Subnotebook (372 - 2396, n=68, laatste 2 jaar) | |
| Lenovo ThinkPad X13 2-in-1 Gen 5 | |
| Microsoft Surface Pro Copilot+ | |
| CrossMark / Responsiveness | |
| Lenovo ThinkPad X13 2-in-1 Gen 5 | |
| Framework Laptop 13.5 Core Ultra 7 155H | |
| Dell XPS 13 9350 | |
| Gemiddelde van klas Subnotebook (312 - 1899, n=68, laatste 2 jaar) | |
| MSI Prestige 13 AI Plus Evo A2VMG | |
| Gemiddeld Intel Core Ultra 7 268V, Intel Arc Graphics 140V (1267 - 1311, n=2) | |
| Dell Pro 13 Premium PA13250 | |
| Microsoft Surface Pro Copilot+ | |
| WebXPRT 3 / Overall | |
| Microsoft Surface Pro Copilot+ | |
| Gemiddelde van klas Subnotebook (156 - 479, n=67, laatste 2 jaar) | |
| Dell XPS 13 9350 | |
| MSI Prestige 13 AI Plus Evo A2VMG | |
| Framework Laptop 13.5 Core Ultra 7 155H | |
| Gemiddeld Intel Core Ultra 7 268V, Intel Arc Graphics 140V (266 - 310, n=2) | |
| Dell Pro 13 Premium PA13250 | |
| Lenovo ThinkPad X13 2-in-1 Gen 5 | |
| WebXPRT 4 / Overall | |
| MSI Prestige 13 AI Plus Evo A2VMG | |
| Dell XPS 13 9350 | |
| Gemiddeld Intel Core Ultra 7 268V, Intel Arc Graphics 140V (245 - 287, n=2) | |
| Gemiddelde van klas Subnotebook (132 - 348, n=68, laatste 2 jaar) | |
| Microsoft Surface Pro Copilot+ | |
| Framework Laptop 13.5 Core Ultra 7 155H | |
| Dell Pro 13 Premium PA13250 | |
| Lenovo ThinkPad X13 2-in-1 Gen 5 | |
| Mozilla Kraken 1.1 / Total | |
| Lenovo ThinkPad X13 2-in-1 Gen 5 | |
| Framework Laptop 13.5 Core Ultra 7 155H | |
| Gemiddelde van klas Subnotebook (278 - 1104, n=76, laatste 2 jaar) | |
| Dell Pro 13 Premium PA13250 | |
| Gemiddeld Intel Core Ultra 7 268V, Intel Arc Graphics 140V (475 - 476, n=2) | |
| MSI Prestige 13 AI Plus Evo A2VMG | |
| Dell XPS 13 9350 | |
| Microsoft Surface Pro Copilot+ | |
* ... kleiner is beter
| PCMark 10 Score | 6729 punten | |
Help | ||
| AIDA64 / Memory Copy | |
| MSI Prestige 13 AI Plus Evo A2VMG | |
| Gemiddeld Intel Core Ultra 7 268V (100445 - 107108, n=2) | |
| Dell XPS 13 9350 | |
| Dell Pro 13 Premium PA13250 | |
| Gemiddelde van klas Subnotebook (14554 - 109035, n=70, laatste 2 jaar) | |
| Framework Laptop 13.5 Core Ultra 7 155H | |
| Lenovo ThinkPad X13 2-in-1 Gen 5 | |
| Microsoft Surface Pro Copilot+ | |
| AIDA64 / Memory Read | |
| Microsoft Surface Pro Copilot+ | |
| Dell XPS 13 9350 | |
| MSI Prestige 13 AI Plus Evo A2VMG | |
| Gemiddeld Intel Core Ultra 7 268V (82511 - 88341, n=2) | |
| Dell Pro 13 Premium PA13250 | |
| Framework Laptop 13.5 Core Ultra 7 155H | |
| Gemiddelde van klas Subnotebook (15948 - 122210, n=70, laatste 2 jaar) | |
| Lenovo ThinkPad X13 2-in-1 Gen 5 | |
| AIDA64 / Memory Write | |
| MSI Prestige 13 AI Plus Evo A2VMG | |
| Gemiddeld Intel Core Ultra 7 268V (115959 - 117888, n=2) | |
| Dell Pro 13 Premium PA13250 | |
| Dell XPS 13 9350 | |
| Gemiddelde van klas Subnotebook (15709 - 117898, n=70, laatste 2 jaar) | |
| Framework Laptop 13.5 Core Ultra 7 155H | |
| Lenovo ThinkPad X13 2-in-1 Gen 5 | |
| Microsoft Surface Pro Copilot+ | |
| AIDA64 / Memory Latency | |
| Lenovo ThinkPad X13 2-in-1 Gen 5 | |
| Framework Laptop 13.5 Core Ultra 7 155H | |
| Gemiddelde van klas Subnotebook (7.2 - 187.8, n=69, laatste 2 jaar) | |
| Dell Pro 13 Premium PA13250 | |
| MSI Prestige 13 AI Plus Evo A2VMG | |
| Dell XPS 13 9350 | |
| Gemiddeld Intel Core Ultra 7 268V (97.4 - 101.2, n=2) | |
| Microsoft Surface Pro Copilot+ | |
* ... kleiner is beter
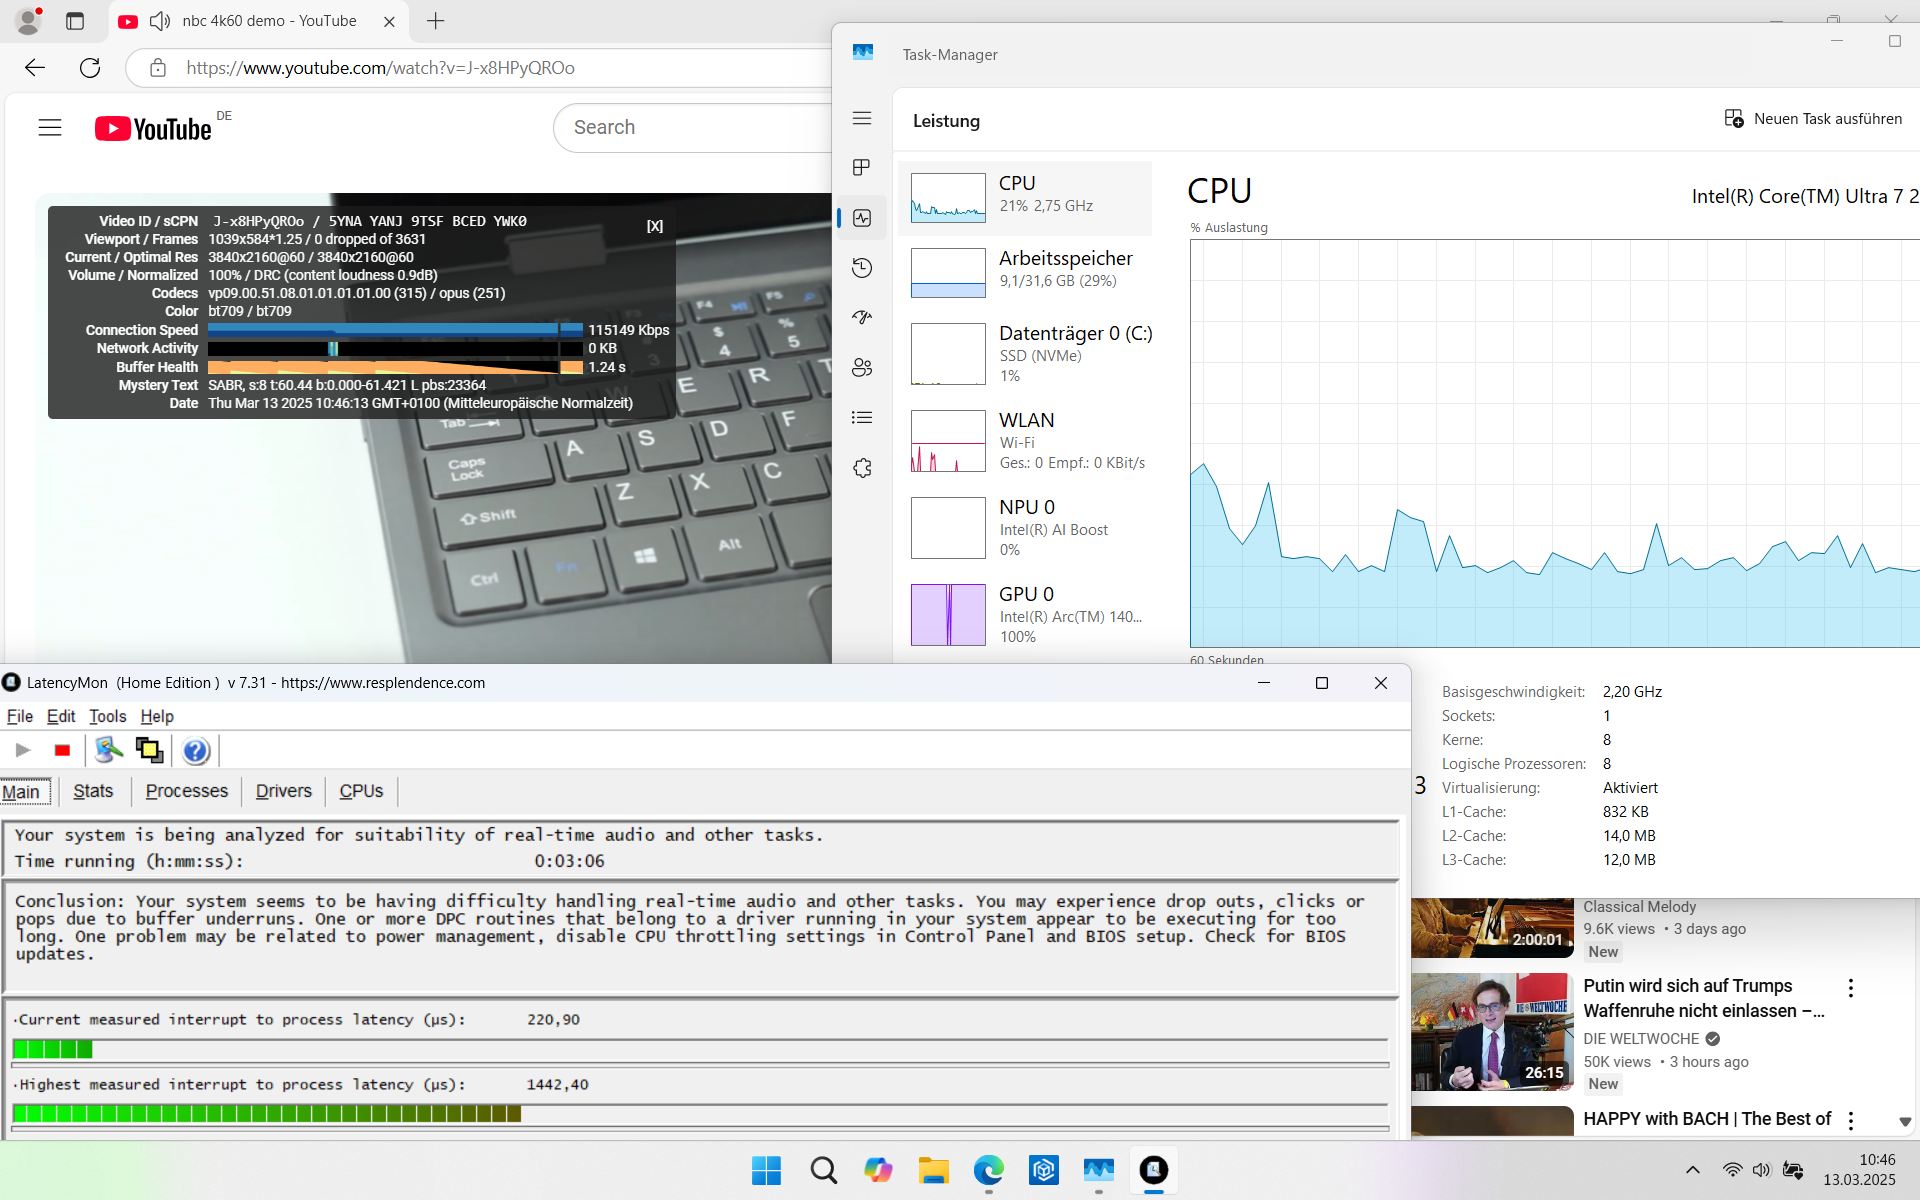
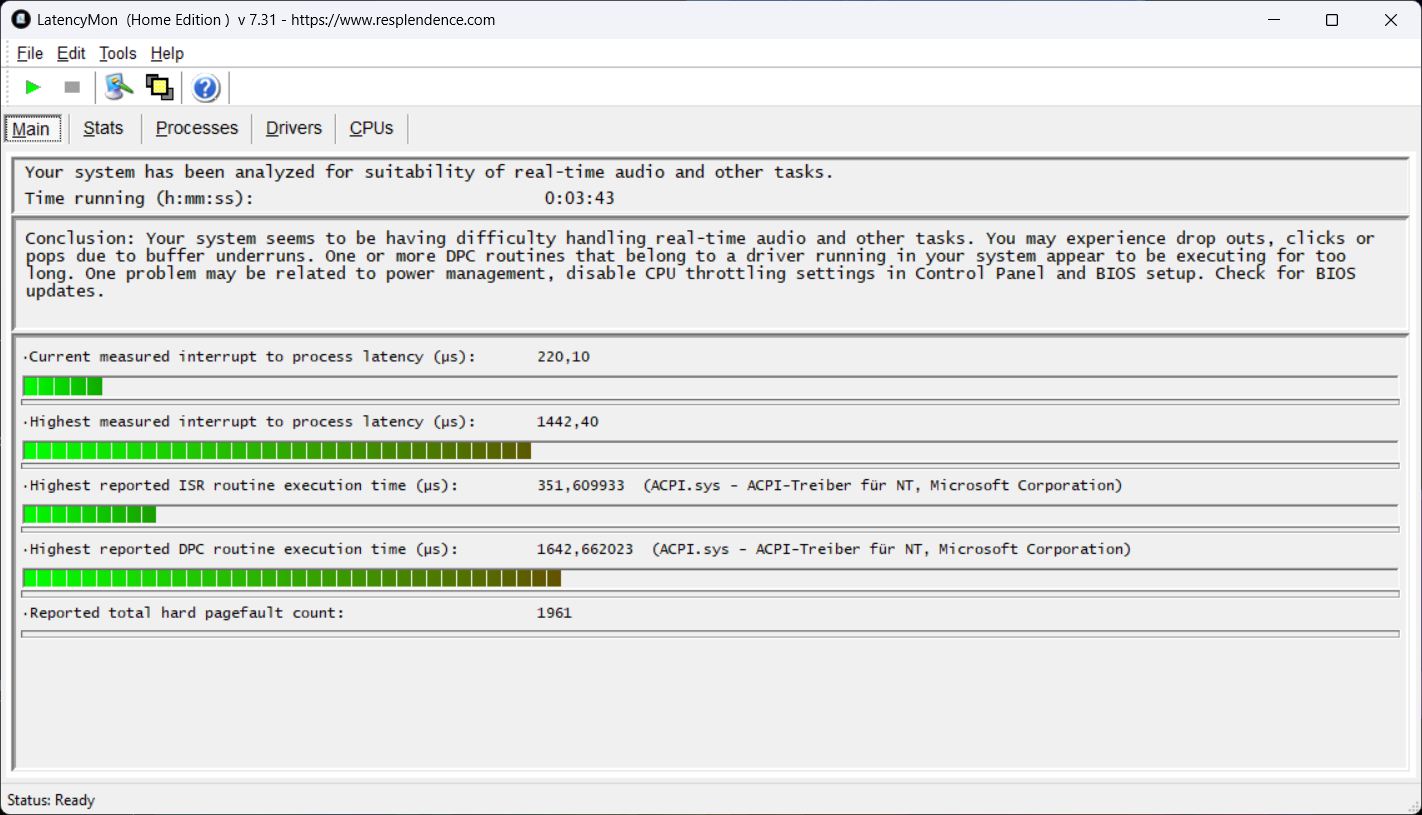
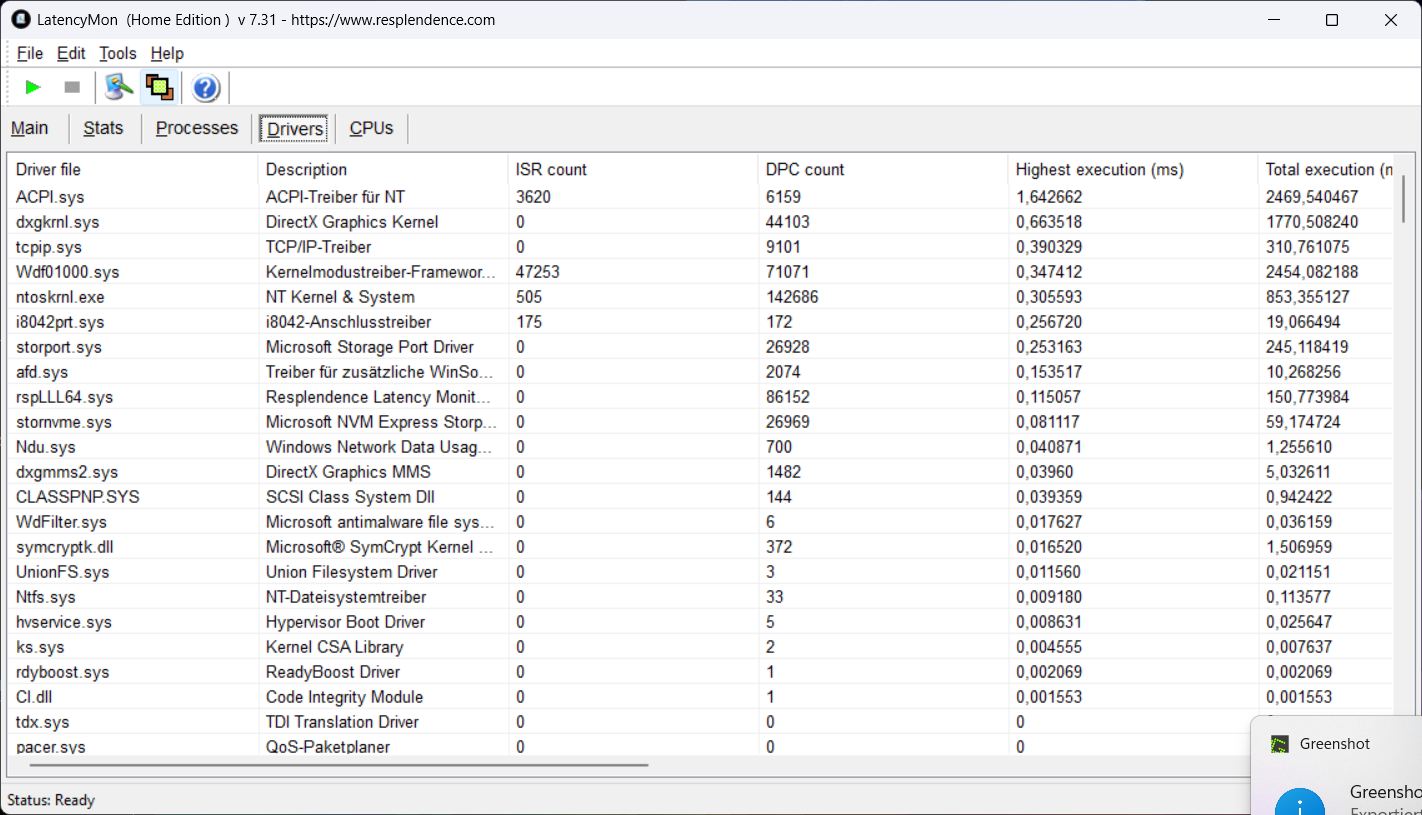
DPC latenties
De eerste serieuze problemen met de latentie kwamen naar voren bij het openen van meerdere browsertabbladen. De latentie nam toe bij het afspelen van onze 4K/60fps YouTube-video, die gelukkig nog steeds liep zonder frames te verliezen. De uiteindelijke waarde is een beetje te hoog voor ons.
| DPC Latencies / LatencyMon - interrupt to process latency (max), Web, Youtube, Prime95 | |
| Dell Pro 13 Premium PA13250 | |
| Lenovo ThinkPad X13 2-in-1 Gen 5 | |
| MSI Prestige 13 AI Plus Evo A2VMG | |
| Framework Laptop 13.5 Core Ultra 7 155H | |
* ... kleiner is beter
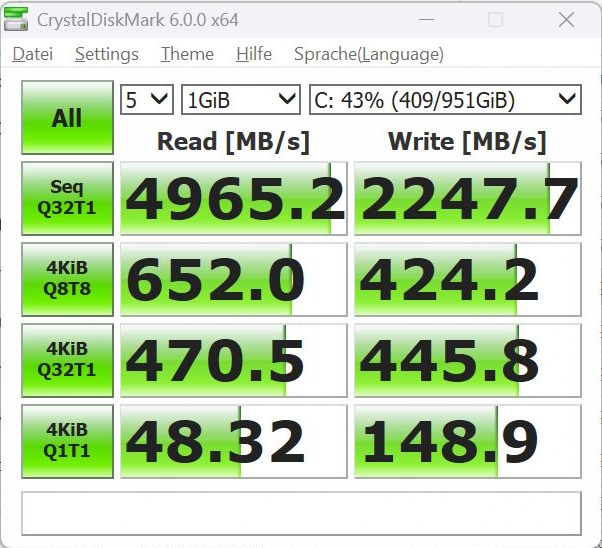
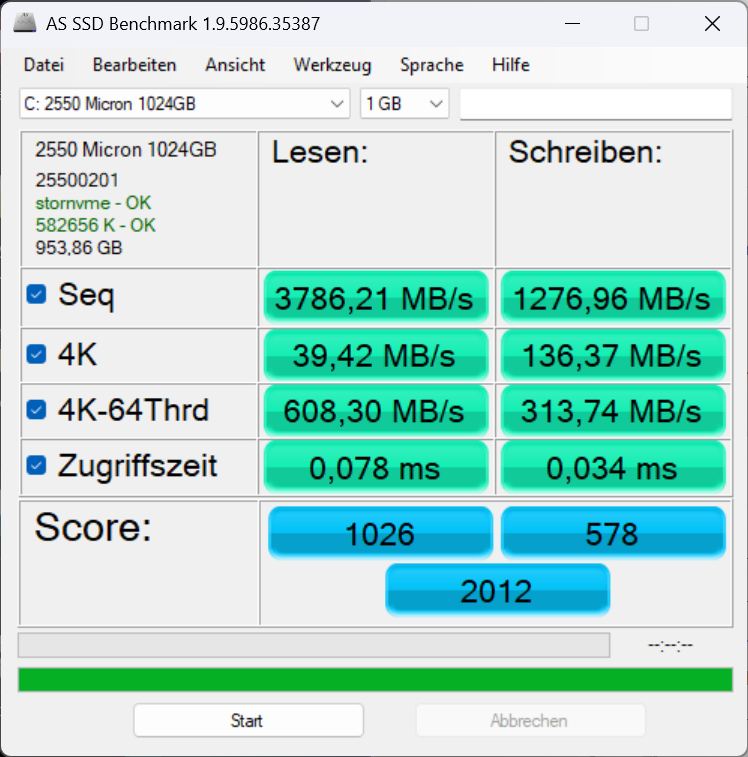
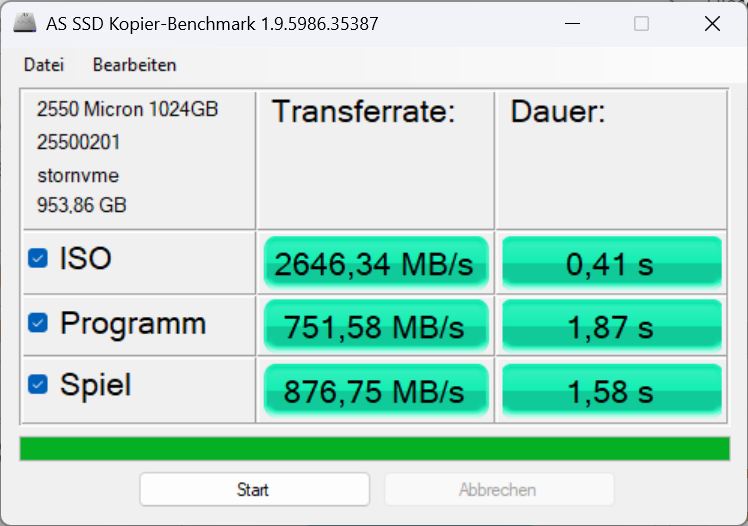
Massa-opslag
De opslag wordt geleverd in de vorm van een 1 TB Micron 2550, hoewel er afhankelijk van de configuratie ook 512 GB modellen beschikbaar zijn. Over het algemeen is de schijf teleurstellend qua snelheid, maar de prestaties blijven na verloop van tijd redelijk constant.

* ... kleiner is beter
Continuous Performance Read: DiskSpd Read Loop, Queue Depth 8
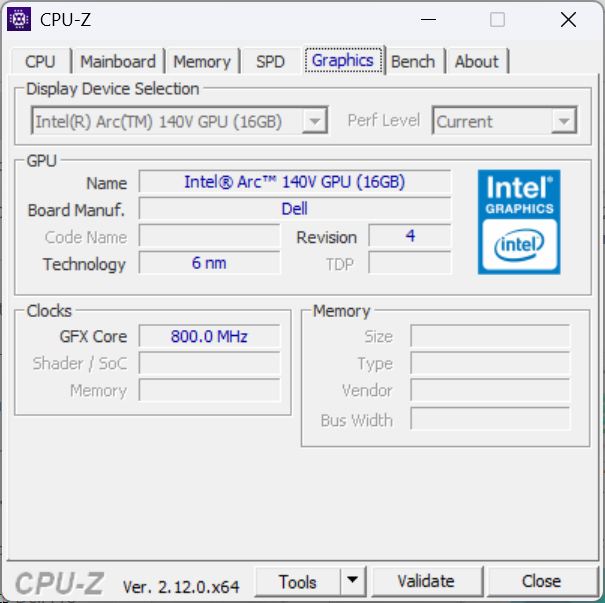
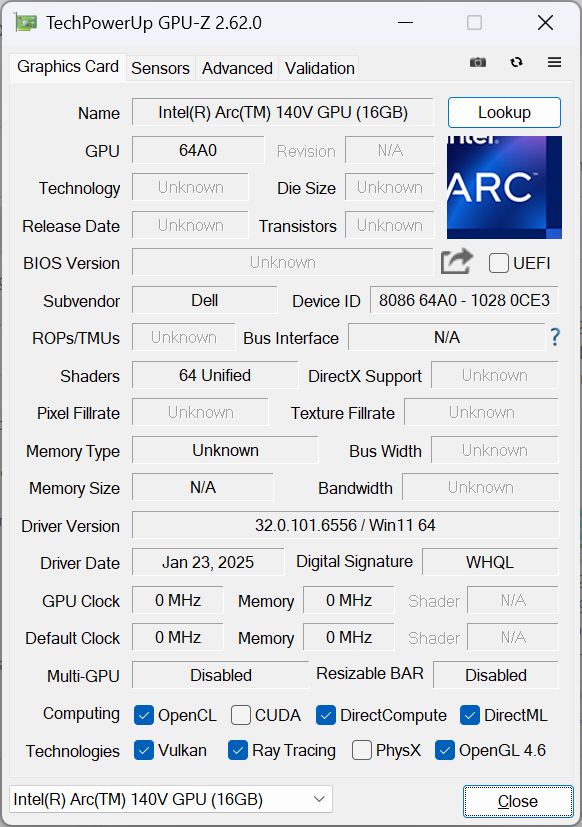
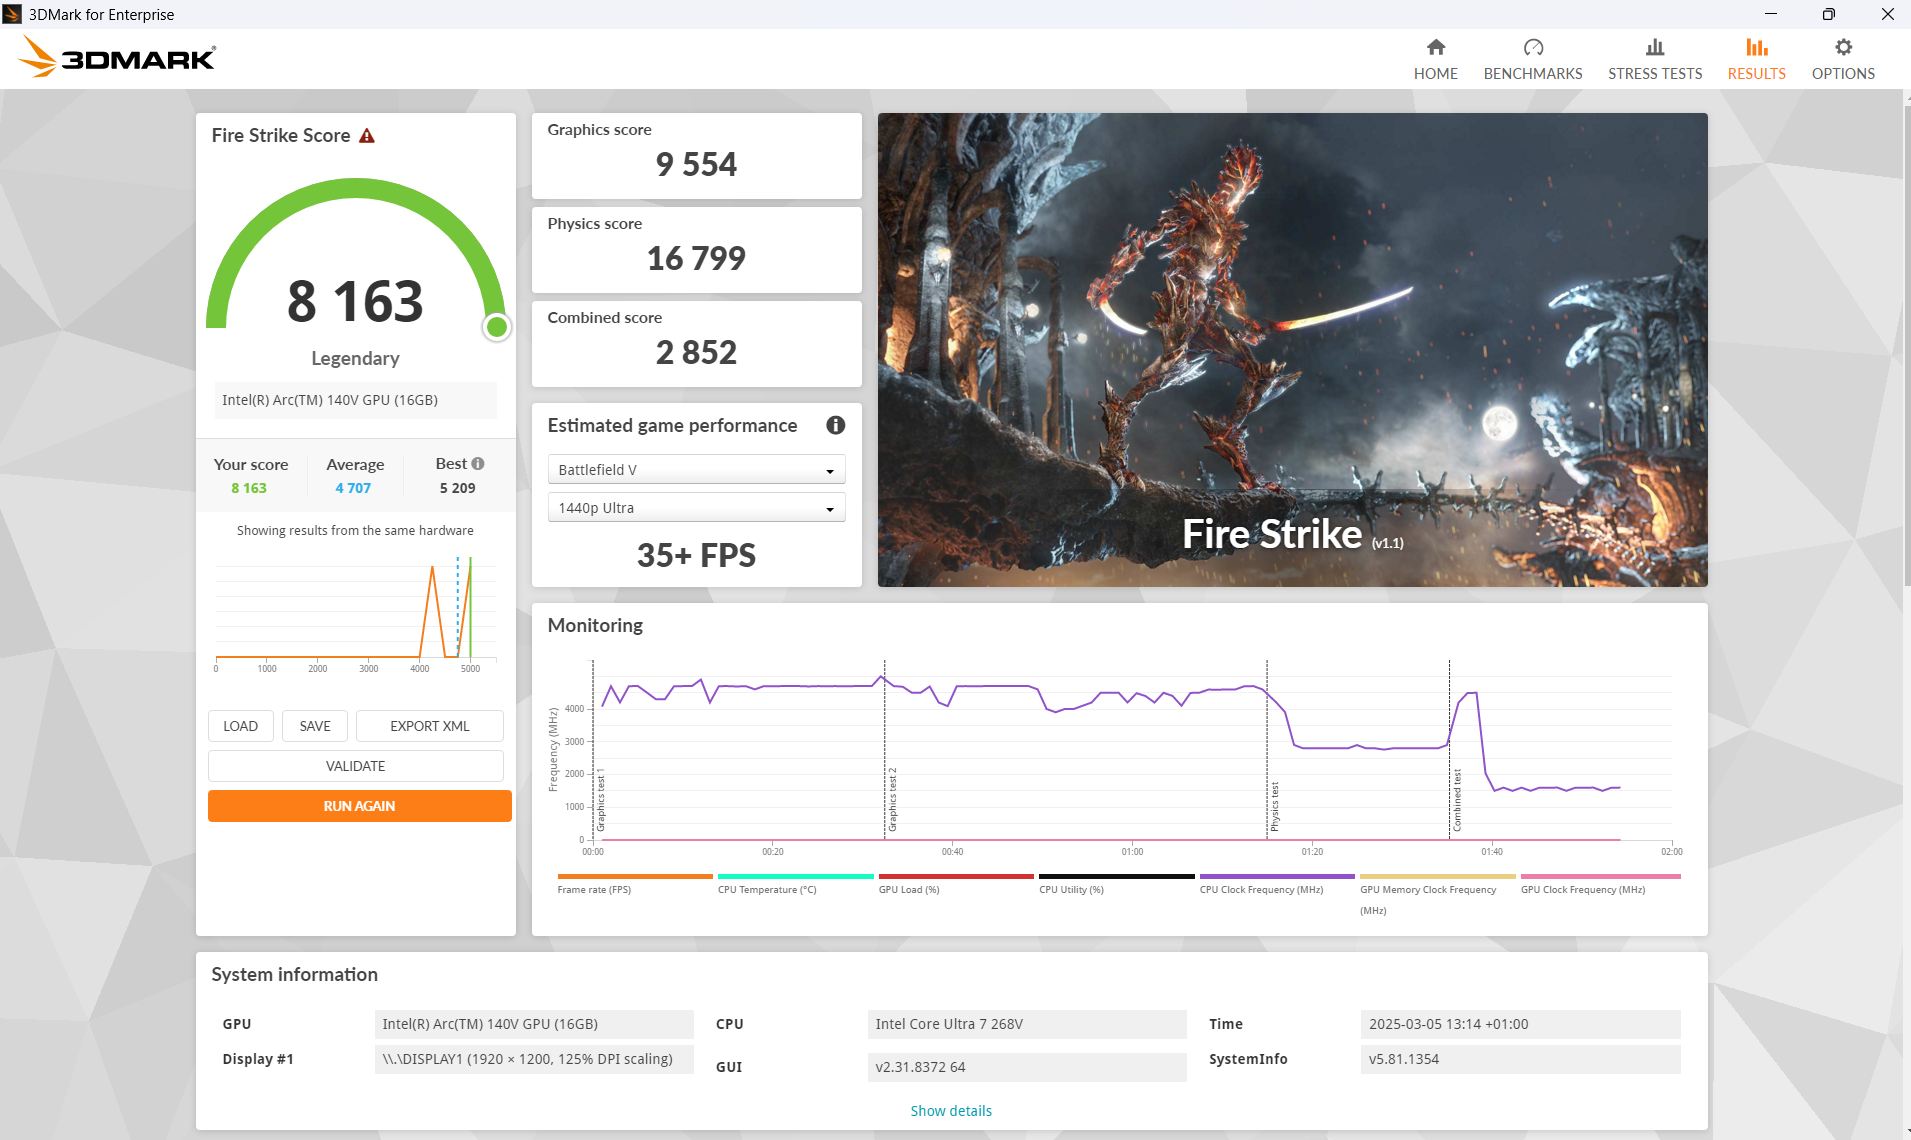
Grafische kaart
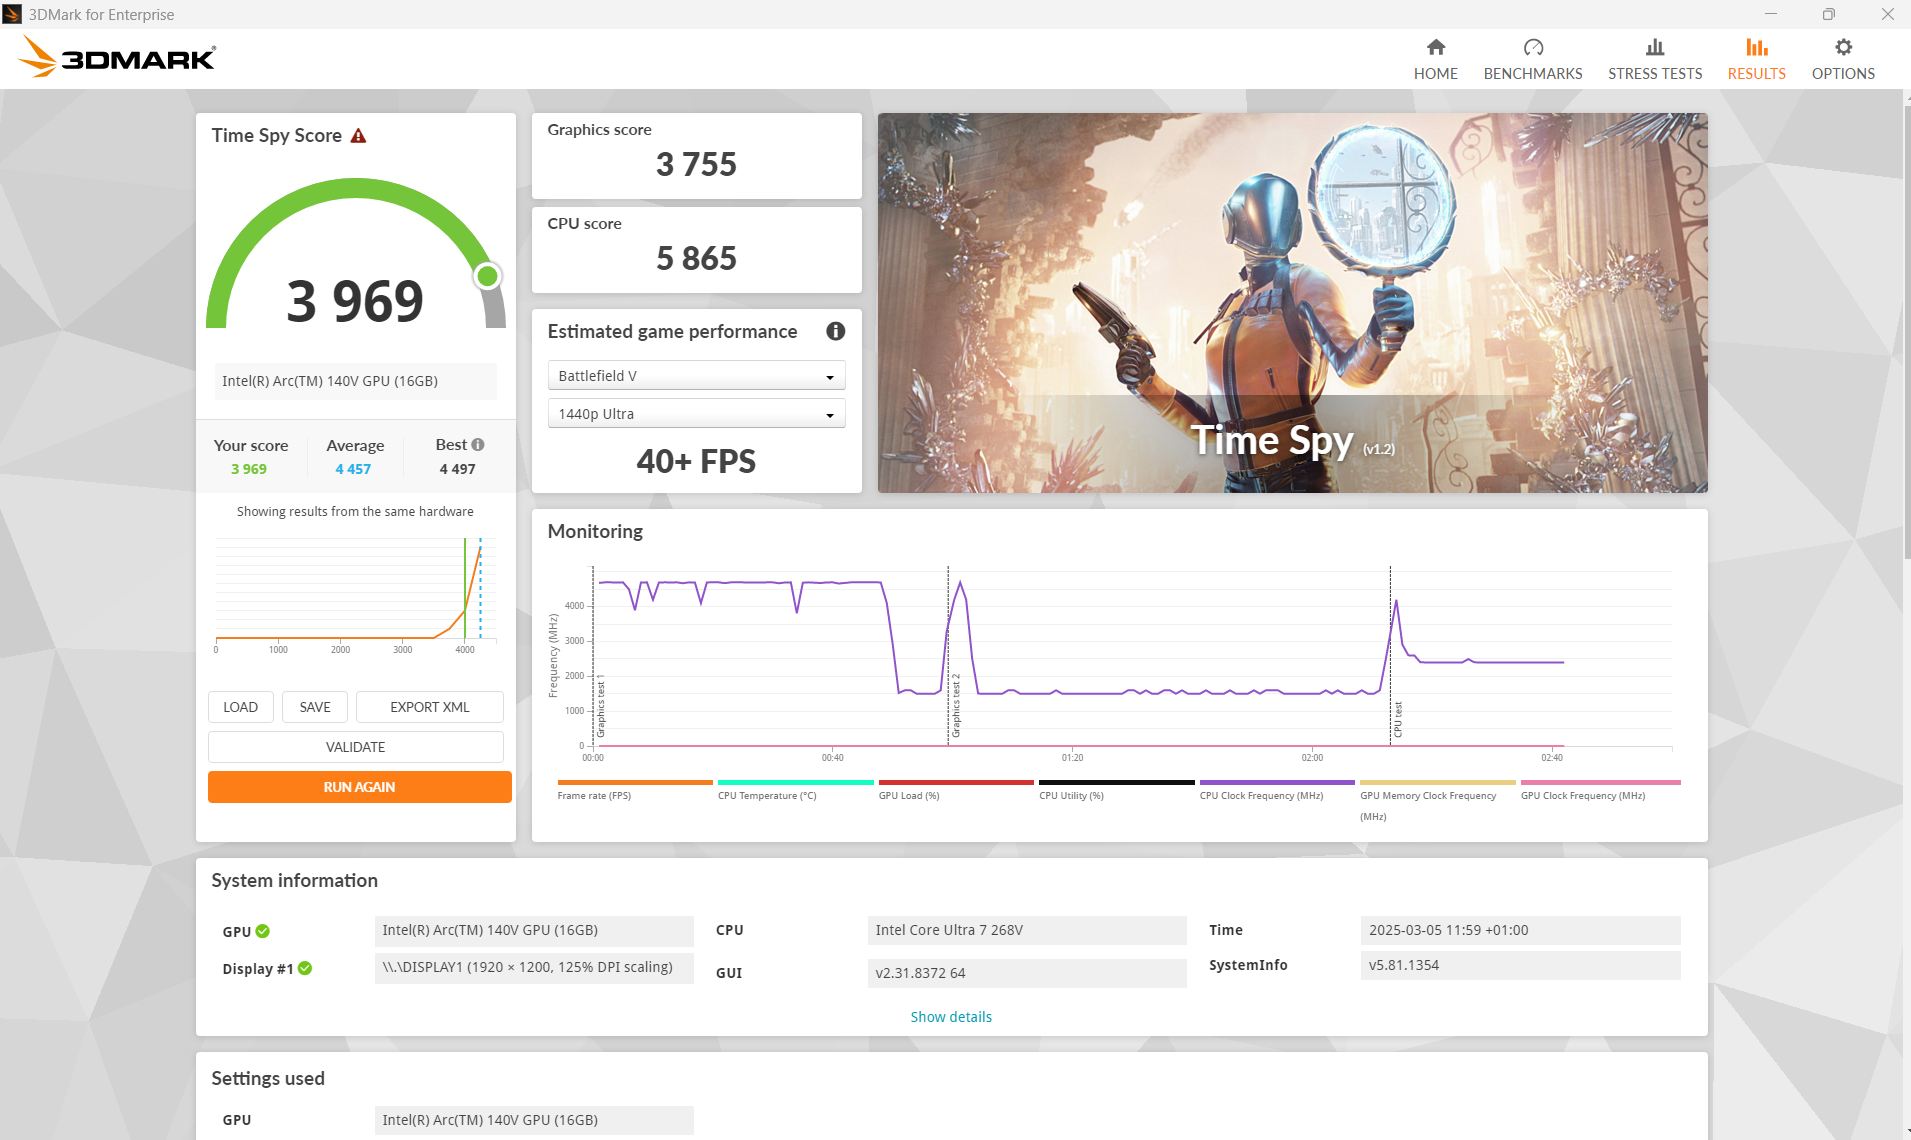
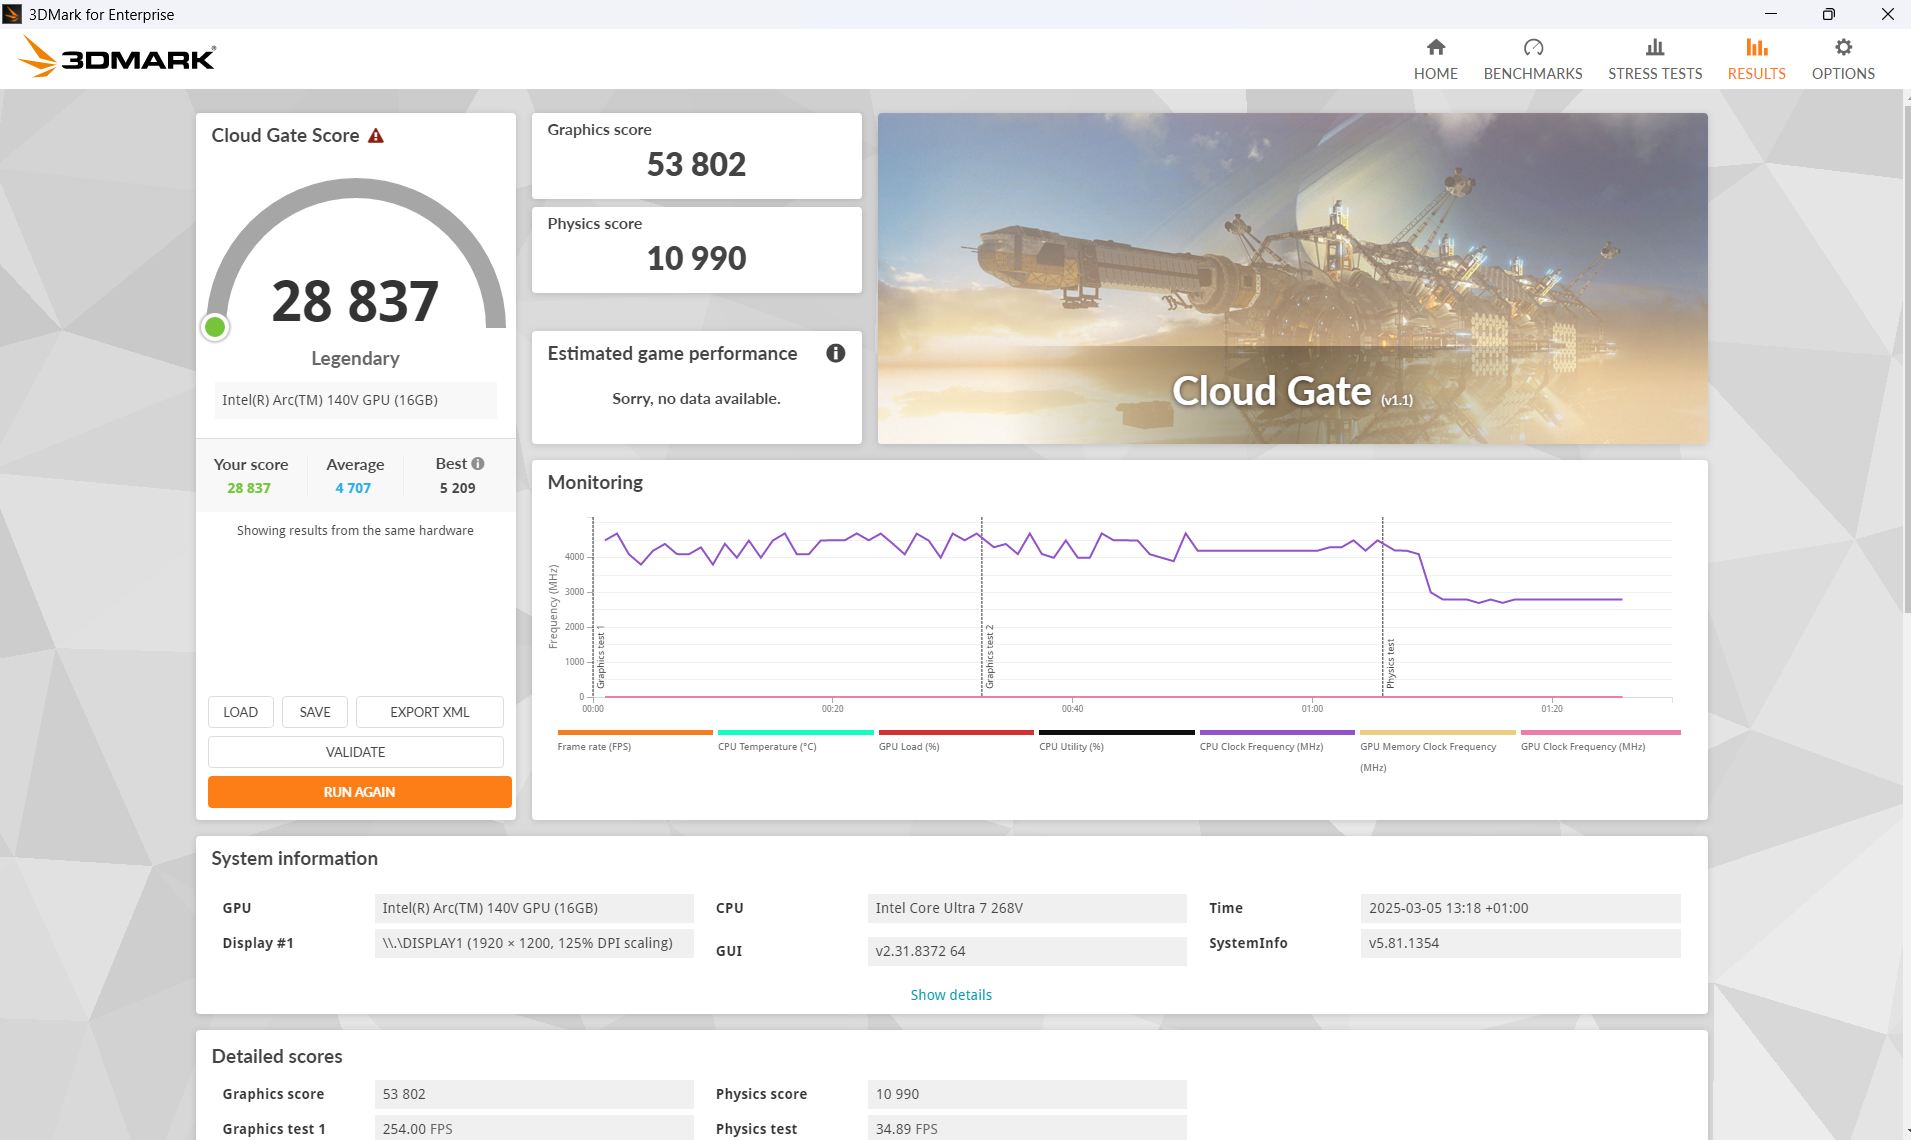
De Intel Arc Graphics 140V iGPU Het is een relatief snelle geïntegreerde grafische kaart. In de synthetische 3DMark benchmarks presteerde hij op of iets boven onze verwachtingen. We merkten geen prestatievermindering in een looped Fire Strike die op batterijvoeding draaide.
Het apparaat presteerde ook indrukwekkend tijdens het gamen, met bijna elk spel dat draaide op Full HD en medium details boven de 30 fps, en in sommige gevallen was het zelfs voldoende voor hoge details. De framerate van 30 minuten in Cyberpunk 2077 zag er zeer consistent uit.
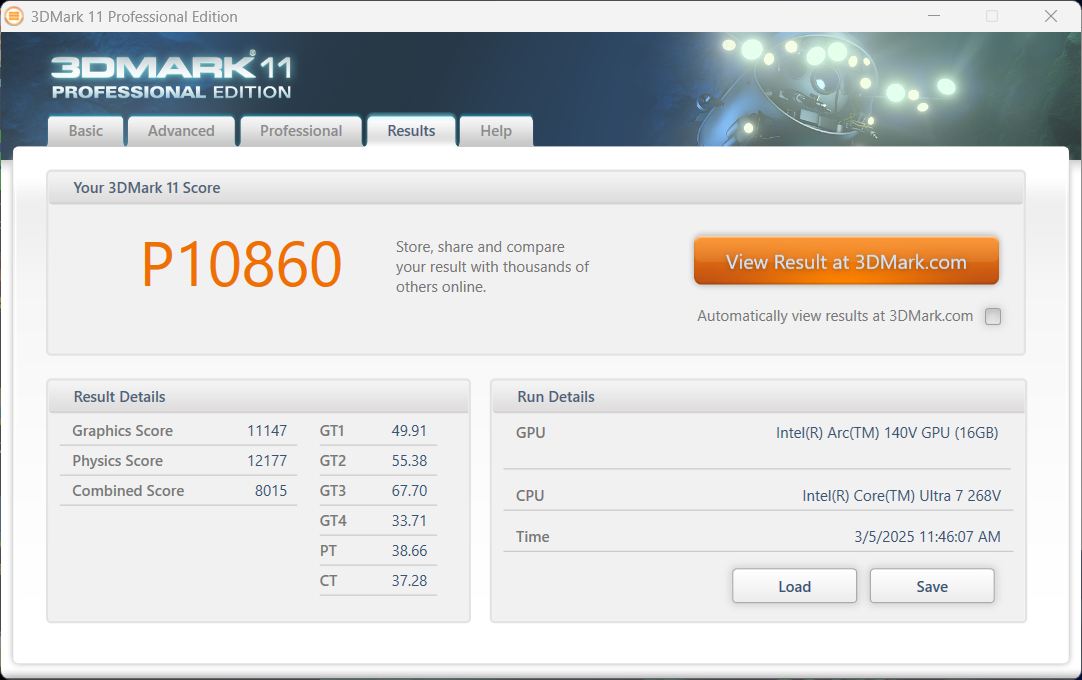
| 3DMark 11 Performance | 10860 punten | |
| 3DMark Cloud Gate Standard Score | 28837 punten | |
| 3DMark Fire Strike Score | 8163 punten | |
| 3DMark Time Spy Score | 3969 punten | |
Help | ||
* ... kleiner is beter
| Cyberpunk 2077 2.2 Phantom Liberty - 1920x1080 Ultra Preset (FSR off) | |
| MSI Prestige 13 AI Plus Evo A2VMG | |
| Dell Pro 13 Premium PA13250 | |
| Framework Laptop 13.5 Core Ultra 7 155H | |
| Gemiddelde van klas Subnotebook (8.48 - 31.4, n=47, laatste 2 jaar) | |
| Dell XPS 13 9350 | |
| Microsoft Surface Pro Copilot+ | |
| Lenovo ThinkPad X13 2-in-1 Gen 5 | |
| GTA V - 1920x1080 Highest Settings possible AA:4xMSAA + FX AF:16x | |
| MSI Prestige 13 AI Plus Evo A2VMG | |
| Dell Pro 13 Premium PA13250 | |
| Dell XPS 13 9350 | |
| Microsoft Surface Pro Copilot+ | |
| Gemiddelde van klas Subnotebook (7.81 - 53, n=67, laatste 2 jaar) | |
| Framework Laptop 13.5 Core Ultra 7 155H | |
| Lenovo ThinkPad X13 2-in-1 Gen 5 | |
Cyberpunk 2077 ultra FPS diagram
| lage | gem. | hoge | ultra | |
|---|---|---|---|---|
| GTA V (2015) | 153.4 | 140 | 26.3 | |
| Dota 2 Reborn (2015) | 107.5 | 101.7 | 87.8 | 71.2 |
| Final Fantasy XV Benchmark (2018) | 74.9 | 42.3 | 29.1 | |
| X-Plane 11.11 (2018) | 48.1 | 36.7 | 32.7 | |
| Strange Brigade (2018) | 223 | 83.3 | 69.5 | 57.8 |
| Baldur's Gate 3 (2023) | 45.5 | 35.7 | 31.3 | 30.8 |
| Cyberpunk 2077 2.2 Phantom Liberty (2023) | 43.5 | 35.4 | 28.6 | 28.1 |
Uitstoot & energie - De Dell Pro is zuinig
Geluidsemissies
De ventilatoren zijn meestal stil als ze stationair draaien. Tijdens het gamen onder maximale belasting hebben we een maximum van 42 dB gemeten, maar in werkelijkheid was het lager (zelfs bij stresstests) en kwam het vaak niet verder dan 36 of 37 dB.
Geluidsniveau
| Onbelast |
| 23 / 23 / 23 dB (A) |
| Belasting |
| 37 / 42.74 dB (A) |
 | ||
30 dB stil 40 dB(A) hoorbaar 50 dB(A) luid |
||
min: | ||
| Dell Pro 13 Premium PA13250 Arc 140V, Core Ultra 7 268V, Micron 2550 1TB | MSI Prestige 13 AI Plus Evo A2VMG Arc 140V, Core Ultra 7 258V | Lenovo ThinkPad X13 2-in-1 Gen 5 Graphics 4-Core, Ultra 7 165U, Lenovo UMIS RPETJ1T24MHP2QDQ | Framework Laptop 13.5 Core Ultra 7 155H Arc 8-Core, Ultra 7 155H | Dell XPS 13 9350 Arc 140V, Core Ultra 7 256V, Micron 2550 512GB | Microsoft Surface Pro Copilot+ Adreno X1-85 3.8 TFLOPS, SD X Plus X1P-64-100, Samsung PM9B1 256GB MZ9L4256HCJQ | |
|---|---|---|---|---|---|---|
| Noise | -8% | 4% | -7% | 3% | 2% | |
| uit / omgeving * | 23 | 24.1 -5% | 23 -0% | 24 -4% | 24.1 -5% | 23.8 -3% |
| Idle Minimum * | 23 | 24.8 -8% | 23 -0% | 24.1 -5% | 24.4 -6% | 23.8 -3% |
| Idle Average * | 23 | 24.8 -8% | 23 -0% | 25.1 -9% | 24.4 -6% | 23.8 -3% |
| Idle Maximum * | 23 | 26.7 -16% | 23 -0% | 27 -17% | 24.4 -6% | 23.8 -3% |
| Load Average * | 37 | 36.8 1% | 34.44 7% | 38.4 -4% | 26.2 29% | 23.8 36% |
| Cyberpunk 2077 ultra * | 42.74 | 44.5 -4% | 38.28 10% | 43.7 -2% | 34.2 20% | 44.7 -5% |
| Load Maximum * | 42.74 | 50.8 -19% | 39.04 9% | 45.8 -7% | 45.2 -6% | 44.7 -5% |
* ... kleiner is beter
Temperatuur
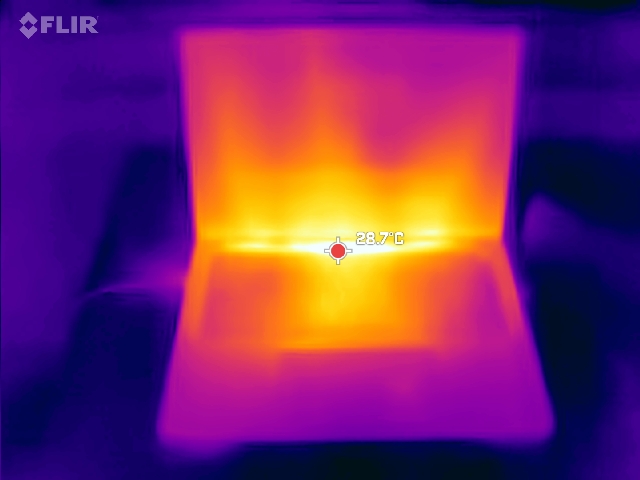
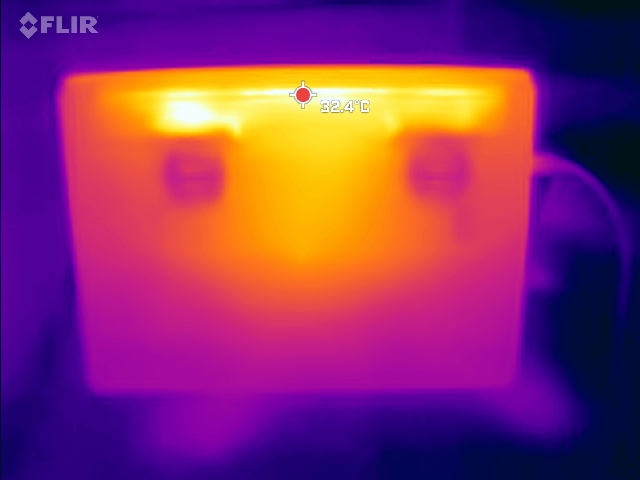
In tegenstelling tot veel kantoor- en zakelijke concurrenten van dit formaat gebruikt de Dell Pro 13 Premium twee ventilatoren in plaats van slechts één, en dit heeft een positieve invloed op de oppervlaktetemperaturen. Gaming wordt warmer dan in onze stresstest, maar zelfs hier hebben we hot spots van slechts 37°C gemeten. Beide kanten van de laptop worden gelijkmatig gekoeld, in plaats van slechts één kant zoals bij sommige concurrenten.
(+) De maximumtemperatuur aan de bovenzijde bedraagt 31 °C / 88 F, vergeleken met het gemiddelde van 35.9 °C / 97 F, variërend van 21.4 tot 59 °C voor de klasse Subnotebook.
(+) De bodem warmt op tot een maximum van 31 °C / 88 F, vergeleken met een gemiddelde van 39.3 °C / 103 F
(+) Bij onbelast gebruik bedraagt de gemiddelde temperatuur voor de bovenzijde 22.3 °C / 72 F, vergeleken met het apparaatgemiddelde van 30.8 °C / 87 F.
(+) 3: The average temperature for the upper side is 28.8 °C / 84 F, compared to the average of 30.8 °C / 87 F for the class Subnotebook.
(+) De palmsteunen en het touchpad zijn met een maximum van ###max## °C / 78.8 F koeler dan de huidtemperatuur en voelen daarom koel aan.
(+) De gemiddelde temperatuur van de handpalmsteun van soortgelijke toestellen bedroeg 28.2 °C / 82.8 F (+2.2 °C / 4 F).
| Dell Pro 13 Premium PA13250 Intel Core Ultra 7 268V, Intel Arc Graphics 140V | MSI Prestige 13 AI Plus Evo A2VMG Intel Core Ultra 7 258V, Intel Arc Graphics 140V | Lenovo ThinkPad X13 2-in-1 Gen 5 Intel Core Ultra 7 165U, Intel Graphics 4-Core iGPU (Arc) | Framework Laptop 13.5 Core Ultra 7 155H Intel Core Ultra 7 155H, Intel Arc 8-Core iGPU | Dell XPS 13 9350 Intel Core Ultra 7 256V, Intel Arc Graphics 140V | Microsoft Surface Pro Copilot+ Qualcomm Snapdragon X Plus X1P-64-100, Qualcomm SD X Adreno X1-85 3.8 TFLOPS | |
|---|---|---|---|---|---|---|
| Heat | -23% | -52% | -29% | -12% | -25% | |
| Maximum Upper Side * | 31 | 43.4 -40% | 60 -94% | 42.8 -38% | 34.8 -12% | 43.9 -42% |
| Maximum Bottom * | 31 | 42.4 -37% | 57 -84% | 45.2 -46% | 37.4 -21% | 44.9 -45% |
| Idle Upper Side * | 24 | 25.4 -6% | 27 -13% | 27.2 -13% | 25.4 -6% | 26.2 -9% |
| Idle Bottom * | 24 | 25.6 -7% | 28 -17% | 28.6 -19% | 26.2 -9% | 24.6 -3% |
* ... kleiner is beter
Luidsprekers
Voor zo'n kleine laptop presteren de luidsprekers zelfs beter dan sommige veel grotere modellen. De middentonen zijn gebalanceerd, maar ze missen nog bas. Er is een audio-ingang voor aansluiting op externe apparaten.
Dell Pro 13 Premium PA13250 audioanalyse
(+) | luidsprekers kunnen relatief luid spelen (87.49 dB)
Bas 100 - 315 Hz
(-) | bijna geen lage tonen - gemiddeld 15.9% lager dan de mediaan
(±) | lineariteit van de lage tonen is gemiddeld (8.3% delta ten opzichte van de vorige frequentie)
Midden 400 - 2000 Hz
(+) | evenwichtige middens - slechts 2.9% verwijderd van de mediaan
(+) | de middentonen zijn lineair (4.7% delta ten opzichte van de vorige frequentie)
Hoog 2 - 16 kHz
(±) | lagere maxima - gemiddeld 5.2% lager dan de mediaan
(±) | lineariteit van de hoogtepunten is gemiddeld (7.1% delta ten opzichte van de vorige frequentie)
Algemeen 100 - 16.000 Hz
(+) | het totale geluid is lineair (12.2% verschil met de mediaan)
Vergeleken met dezelfde klasse
» 14% van alle geteste apparaten in deze klasse waren beter, 4% vergelijkbaar, 82% slechter
» De beste had een delta van 5%, het gemiddelde was 19%, de slechtste was 53%
Vergeleken met alle geteste toestellen
» 8% van alle geteste apparaten waren beter, 2% gelijk, 89% slechter
» De beste had een delta van 4%, het gemiddelde was 24%, de slechtste was 134%
MSI Prestige 13 AI Plus Evo A2VMG audioanalyse
(+) | luidsprekers kunnen relatief luid spelen (84.5 dB)
Bas 100 - 315 Hz
(-) | bijna geen lage tonen - gemiddeld 19.4% lager dan de mediaan
(±) | lineariteit van de lage tonen is gemiddeld (9.6% delta ten opzichte van de vorige frequentie)
Midden 400 - 2000 Hz
(±) | hogere middens - gemiddeld 6.4% hoger dan de mediaan
(+) | de middentonen zijn lineair (5.1% delta ten opzichte van de vorige frequentie)
Hoog 2 - 16 kHz
(±) | higher highs - on average 6.1% higher than median
(+) | de hoge tonen zijn lineair (4.6% delta naar de vorige frequentie)
Algemeen 100 - 16.000 Hz
(±) | lineariteit van het totale geluid is gemiddeld (18.2% verschil met de mediaan)
Vergeleken met dezelfde klasse
» 50% van alle geteste apparaten in deze klasse waren beter, 7% vergelijkbaar, 43% slechter
» De beste had een delta van 5%, het gemiddelde was 19%, de slechtste was 53%
Vergeleken met alle geteste toestellen
» 36% van alle geteste apparaten waren beter, 8% gelijk, 56% slechter
» De beste had een delta van 4%, het gemiddelde was 24%, de slechtste was 134%
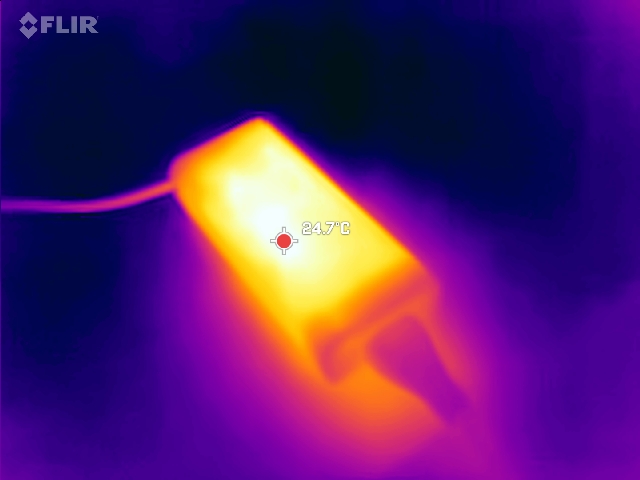
Stroomverbruik
Dankzij de Lunar Lake SoC is de Dell Pro 13 erg zuinig. Hij verbruikt slechts 2 tot 4,75 W bij stationair draaien, en we hebben slechts 38 W gemeten toen we Cyberpunk 2077 draaiden. Alleen de Dell XPS 13 9350met zijn iets zwakkere Lunar Lake CPU is zuiniger, en elke andere concurrent verbruikt meer
| Uit / Standby | |
| Inactief | |
| Belasting |
|
Key:
min: | |
| Dell Pro 13 Premium PA13250 Core Ultra 7 268V, Arc 140V | MSI Prestige 13 AI Plus Evo A2VMG Core Ultra 7 258V, Arc 140V | Lenovo ThinkPad X13 2-in-1 Gen 5 Ultra 7 165U, Graphics 4-Core | Framework Laptop 13.5 Core Ultra 7 155H Ultra 7 155H, Arc 8-Core | Dell XPS 13 9350 Core Ultra 7 256V, Arc 140V | Microsoft Surface Pro Copilot+ SD X Plus X1P-64-100, Adreno X1-85 3.8 TFLOPS | Gemiddelde van klas Subnotebook | |
|---|---|---|---|---|---|---|---|
| Power Consumption | -39% | -19% | -26% | 7% | -23% | -62% | |
| Idle Minimum * | 2 | 3.5 -75% | 3.2 -60% | 2.5 -25% | 1.3 35% | 1.9 5% | 4.3 ? -115% |
| Idle Average * | 4.3 | 5.9 -37% | 6.1 -42% | 5.2 -21% | 2.5 42% | 9.2 -114% | 7.33 ? -70% |
| Idle Maximum * | 4.75 | 10 -111% | 6.7 -41% | 5.8 -22% | 4.1 14% | 9.5 -100% | 9.07 ? -91% |
| Load Average * | 40 | 38.7 3% | 44.2 -11% | 47.5 -19% | 40.1 -0% | 29.6 26% | 45.2 ? -13% |
| Cyberpunk 2077 ultra * | 36.4 | 46.3 -27% | 25.2 31% | 54.5 -50% | 46.1 -27% | 39.5 -9% | |
| Cyberpunk 2077 ultra external monitor * | 38 | 45.6 -20% | 38.5 -1% | 52.4 -38% | 43.1 -13% | 37.4 2% | |
| Load Maximum * | 57 | 61.5 -8% | 62.5 -10% | 61.5 -8% | 57.3 -1% | 40.7 29% | 69 ? -21% |
* ... kleiner is beter
Power consumption Cyberpunk / stress test
Power consumption with an external monitor
Levensduur batterij
Dankzij het lage stroomverbruik is de batterijlevensduur uitstekend. We hebben bijna 24 uur opgenomen in de Wi-Fi- en videotests, wat een fantastisch resultaat is! De 60W batterij is qua capaciteit vrij middenklasse. De XPS 13 verliest slechts marginaal door zijn iets kleinere batterij (55 Wh).
| Dell Pro 13 Premium PA13250 Core Ultra 7 268V, Arc 140V, 60 Wh | MSI Prestige 13 AI Plus Evo A2VMG Core Ultra 7 258V, Arc 140V, 75 Wh | Lenovo ThinkPad X13 2-in-1 Gen 5 Ultra 7 165U, Graphics 4-Core, 54.7 Wh | Framework Laptop 13.5 Core Ultra 7 155H Ultra 7 155H, Arc 8-Core, 61 Wh | Dell XPS 13 9350 Core Ultra 7 256V, Arc 140V, 55 Wh | Microsoft Surface Pro Copilot+ SD X Plus X1P-64-100, Adreno X1-85 3.8 TFLOPS, 47 Wh | Gemiddelde van klas Subnotebook | |
|---|---|---|---|---|---|---|---|
| Batterijduur | -44% | -50% | -52% | -15% | -48% | -36% | |
| H.264 | 1425 | 731 -49% | 841 -41% | 961 ? -33% | |||
| WiFi v1.3 | 1440 | 804 -44% | 739 -49% | 630 -56% | 1236 -14% | 662 -54% | 757 ? -47% |
| Load | 170 | 84 -51% | 90 -47% | 142 -16% | 89 -48% | 121.3 ? -29% | |
| Reader / Idle | 2296 | 3407 | 1882 ? |
Notebookcheck algemene beoordeling
De Dell Pro 13 Premium is bijna alles wat u van een mobiele zakelijke laptop mag verwachten: Hij is vrij klein, licht, zuinig, heeft een geweldige batterijlevensduur en levert nog steeds topprestaties. Afgezien van de hoge prijs zijn er vrijwel geen echte klachten.
Dell Pro 13 Premium PA13250
- 14-03-2025 v8
Christian Hintze
 Total Sustainability Score:
 Transparantie
De selectie van te beoordelen apparaten wordt gemaakt door onze redactie. Het testexemplaar werd ten behoeve van deze beoordeling door de fabrikant of detailhandelaar in bruikleen aan de auteur verstrekt. De kredietverstrekker had geen invloed op deze recensie, noch ontving de fabrikant vóór publicatie een exemplaar van deze recensie. Er bestond geen verplichting om deze recensie te publiceren. Wij accepteren nooit een compensatie of betaling in ruil voor onze beoordelingen. Als onafhankelijk mediabedrijf is Notebookcheck niet onderworpen aan het gezag van fabrikanten, detailhandelaren of uitgevers.
[transparency_disclaimer]Dit is hoe Notebookcheck test
Elk jaar beoordeelt Notebookcheck onafhankelijk honderden laptops en smartphones met behulp van gestandaardiseerde procedures om ervoor te zorgen dat alle resultaten vergelijkbaar zijn. We hebben onze testmethoden al zo'n 20 jaar voortdurend ontwikkeld en daarbij de industriestandaard bepaald. In onze testlaboratoria wordt gebruik gemaakt van hoogwaardige meetapparatuur door ervaren technici en redacteuren. Deze tests omvatten een validatieproces in meerdere fasen. Ons complexe beoordelingssysteem is gebaseerd op honderden goed onderbouwde metingen en benchmarks, waardoor de objectiviteit behouden blijft. Meer informatie over onze testmethoden kunt u hier vinden.

